Attached files
| file | filename |
|---|---|
| 8-K - 8-K - Wesco Aircraft Holdings, Inc | a15-11012_18k.htm |
| EX-99.1 - EX-99.1 - Wesco Aircraft Holdings, Inc | a15-11012_1ex99d1.htm |
Exhibit 99.2
|
|
Fiscal 2015 Second Quarter Earnings Conference Call and Webcast May 7, 2015 Jeff Misakian VP Investor Relations 661-362-6847 Jeff.Misakian@wescoair.com |

|
|
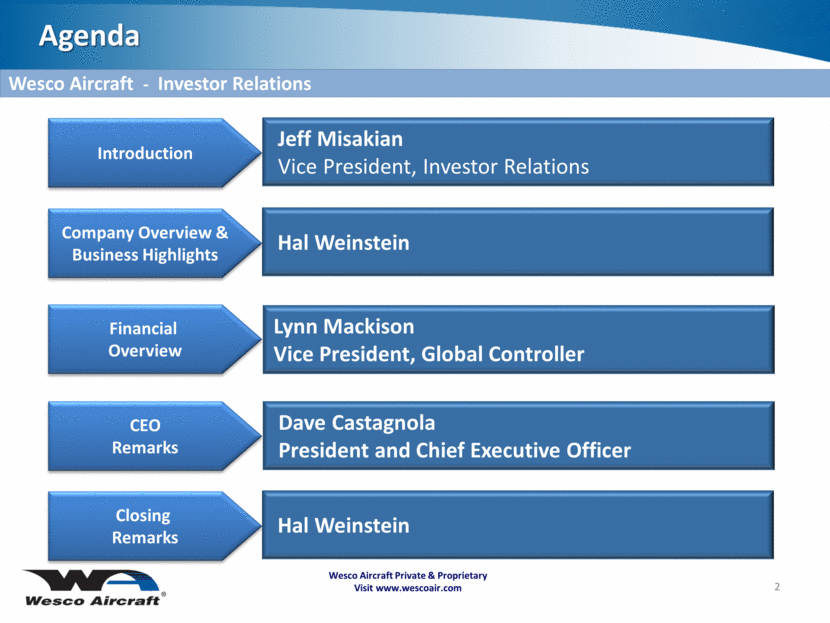
Wesco Aircraft Private & Proprietary Visit www.wescoair.com Agenda Introduction Company Overview & Business Highlights Financial Overview Closing Remarks Jeff Misakian Vice President, Investor Relations Hal Weinstein Lynn Mackison Vice President, Global Controller 2 Wesco Aircraft - Investor Relations Hal Weinstein CEO Remarks Dave Castagnola President and Chief Executive Officer |
|
|
Wesco Aircraft Private & Proprietary Visit www.wescoair.com Disclaimer This presentation contains forward-looking statements (including within the meaning of the Private Securities Litigation Reform Act of 1995) concerning Wesco Aircraft Holdings, Inc. (“Wesco Aircraft “ or the “Company”) and other matters. These statements may discuss goals, intentions and expectations as to future plans, trends, events, results of operations or financial condition, or otherwise, based on current beliefs of management, as well as assumptions made by, and information currently available to, such management. Forward-looking statements may be accompanied by words such as “aim,” “anticipate,” “believe,” “plan,” “could,” “would,” “should,” “estimate,” “expect,” “forecast,” “future,” “guidance,” “intend,” “may,” “will,” “possible,” “potential,” “predict,” “project” or similar words, phrases or expressions. These forward-looking statements are subject to various risks and uncertainties, many of which are outside the Company’s control. Therefore, you should not place undue reliance on such statements. Factors that could cause actual results to differ materially from those in the forward-looking statements include: general economic and industry conditions; conditions in the credit markets; changes in military spending; risks unique to suppliers of equipment and services to the U.S. government; risks associated with the Company’s long-term, fixed-price agreements that have no guarantee of future sales volumes; risks associated with the loss of significant customers, a material reduction in purchase orders by significant customers or the delay, scaling back or elimination of significant programs on which the Company relies; the Company’s ability to effectively compete in its industry; the Company’s ability to effectively manage its inventory; the Company’s ability to successfully integrate the acquired business of Haas Group Inc. in a timely fashion; failure to realize anticipated benefits of the combined operations; risks relating to unanticipated costs of integration; the Company’s suppliers’ ability to provide it with the products the Company sells in a timely manner, in adequate quantities and/or at a reasonable cost; the Company’s ability to maintain effective information technology systems; the Company’s ability to retain key personnel; risks associated with the Company’s international operations, including exposure to foreign currency movements; fluctuations in the Company’s financial results from period-to-period; risks associated with assumptions the Company makes in connection with its critical accounting estimates (including goodwill) and legal proceedings; the Company’s ability to establish and maintain effective internal control over financial reporting; environmental risks; risks related to the handling, transportation and storage of chemical products; the Company’s dependence on third-party package delivery companies; risks related to the aerospace industry and the regulation thereof; risks related to the Company’s indebtedness; and other risks and uncertainties. The foregoing list of factors is not exhaustive. You should carefully consider the foregoing factors and the other risks and uncertainties that affect the Company’s business, including those described in the Company’s Annual Report on Form 10-K, Quarterly Reports on Form 10-Q, Current Reports on Form 8-K and other documents filed from time to time with the Securities and Exchange Commission. All forward-looking statements included in this presentation (including information included or incorporated by reference herein) are based upon information available to the Company as of the date hereof, and the Company undertakes no obligation to update or revise publicly any forward-looking statements, whether as a result of new information, future events or otherwise. The Company utilizes and discusses Adjusted Net Income, Adjusted Basic EPS, Adjusted Diluted EPS, Adjusted EBITDA, Organic Sales and Free Cash Flow, which are non-GAAP measures its management uses to evaluate its business, because the Company believes they assist investors and analysts in comparing its performance across reporting periods on a consistent basis by excluding items that the Company does not believe are indicative of its core operating performance. The Company believes these metrics are used in the financial community, and the Company presents these metrics to enhance investors’ understanding of its operating performance. You should not consider Adjusted EBITDA and Adjusted Net Income as an alternative to Net Income, determined in accordance with GAAP, as an indicator of operating performance. Adjusted Net Income, Adjusted Basic EPS, Adjusted Diluted EPS, Adjusted EBITDA, Organic Sales and Free Cash Flow are not measurements of financial performance under GAAP, and these metrics may not be comparable to similarly titled measures of other companies. See the Appendix for a reconciliation of Adjusted Net Income, Adjusted Basic EPS, Adjusted Diluted EPS, Adjusted EBITDA and Organic Sales to the most directly comparable financial measures calculated and presented in accordance with GAAP. 3 Wesco Aircraft - Investor Relations |
|
|
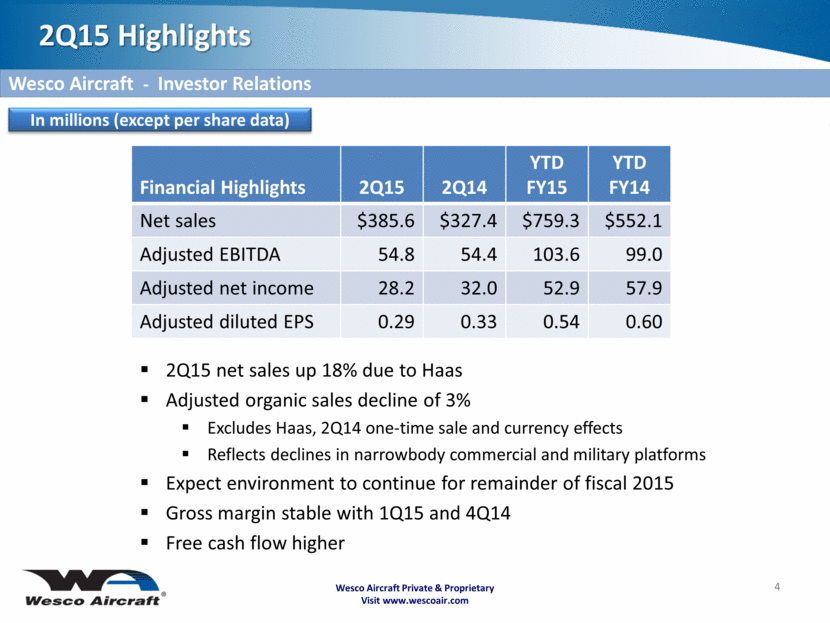
Wesco Aircraft Private & Proprietary Visit www.wescoair.com 2Q15 Highlights 4 Wesco Aircraft - Investor Relations Financial Highlights 2Q15 2Q14 YTD FY15 YTD FY14 Net sales $385.6 $327.4 $759.3 $552.1 Adjusted EBITDA 54.8 54.4 103.6 99.0 Adjusted net income 28.2 32.0 52.9 57.9 Adjusted diluted EPS 0.29 0.33 0.54 0.60 In millions (except per share data) 2Q15 net sales up 18% due to Haas Adjusted organic sales decline of 3% Excludes Haas, 2Q14 one-time sale and currency effects Reflects declines in narrowbody commercial and military platforms Expect environment to continue for remainder of fiscal 2015 Gross margin stable with 1Q15 and 4Q14 Free cash flow higher |
|
|
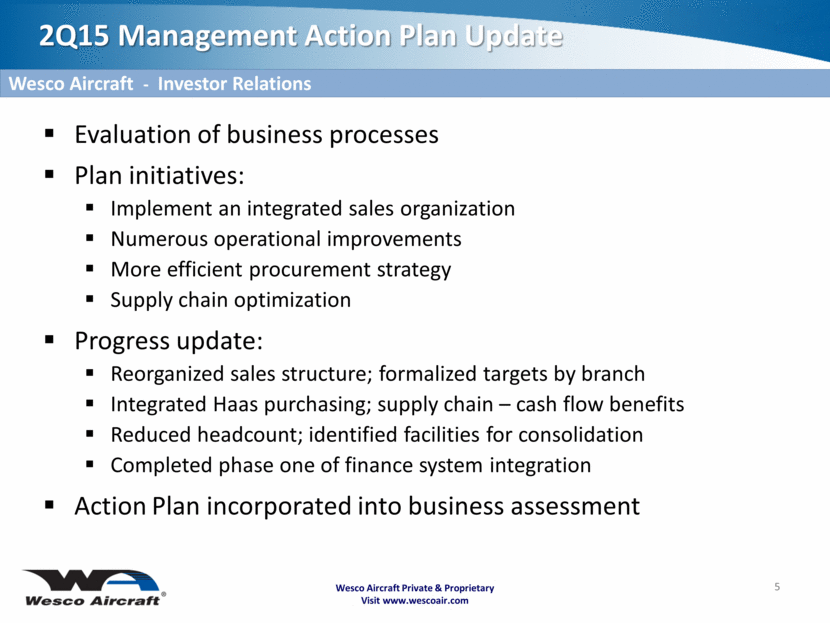
Evaluation of business processes Plan initiatives: Implement an integrated sales organization Numerous operational improvements More efficient procurement strategy Supply chain optimization Progress update: Reorganized sales structure; formalized targets by branch Integrated Haas purchasing; supply chain – cash flow benefits Reduced headcount; identified facilities for consolidation Completed phase one of finance system integration Action Plan incorporated into business assessment Wesco Aircraft Private & Proprietary Visit www.wescoair.com 2Q15 Management Action Plan Update 5 Wesco Aircraft - Investor Relations |
|
|
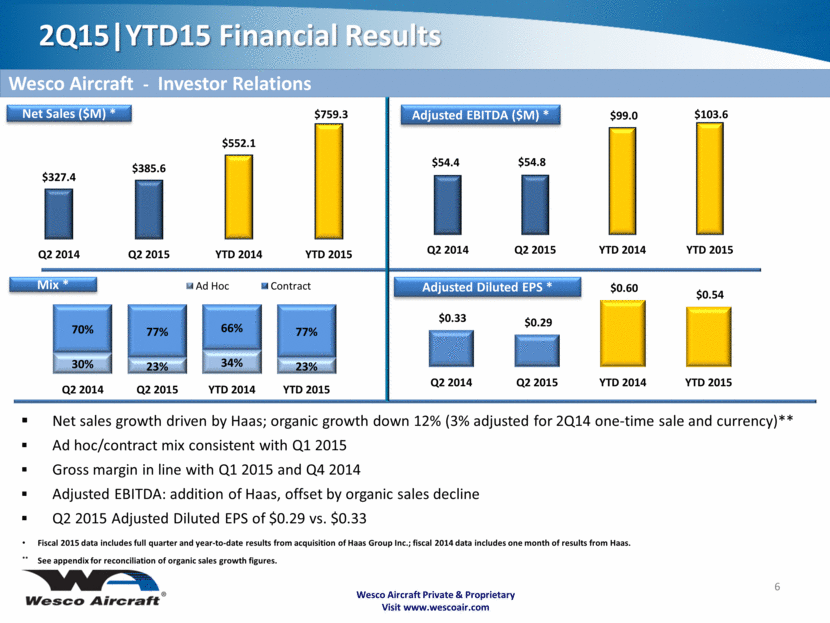
Net sales growth driven by Haas; organic growth down 12% (3% adjusted for 2Q14 one-time sale and currency)** Ad hoc/contract mix consistent with Q1 2015 Gross margin in line with Q1 2015 and Q4 2014 Adjusted EBITDA: addition of Haas, offset by organic sales decline Q2 2015 Adjusted Diluted EPS of $0.29 vs. $0.33 Wesco Aircraft Private & Proprietary Visit www.wescoair.com 2Q15 YTD15 Financial Results Net Sales ($M) * Adjusted EBITDA ($M) * 6 Mix * Adjusted Diluted EPS * Wesco Aircraft - Investor Relations Fiscal 2015 data includes full quarter and year-to-date results from acquisition of Haas Group Inc.; fiscal 2014 data includes one month of results from Haas. ** See appendix for reconciliation of organic sales growth figures. $327.4 $385.6 $552.1 $759.3 Q2 2014 Q2 2015 YTD 2014 YTD 2015 $54.4 $54.8 $99.0 $103.6 Q2 2014 Q2 2015 YTD 2014 YTD 2015 30% 23% 34% 23% 70% 77% 66% 77% Q2 2014 Q2 2015 YTD 2014 YTD 2015 Ad Hoc Contract $0.33 $0.29 $0.60 $0.54 Q2 2014 Q2 2015 YTD 2014 YTD 2015 |
|
|
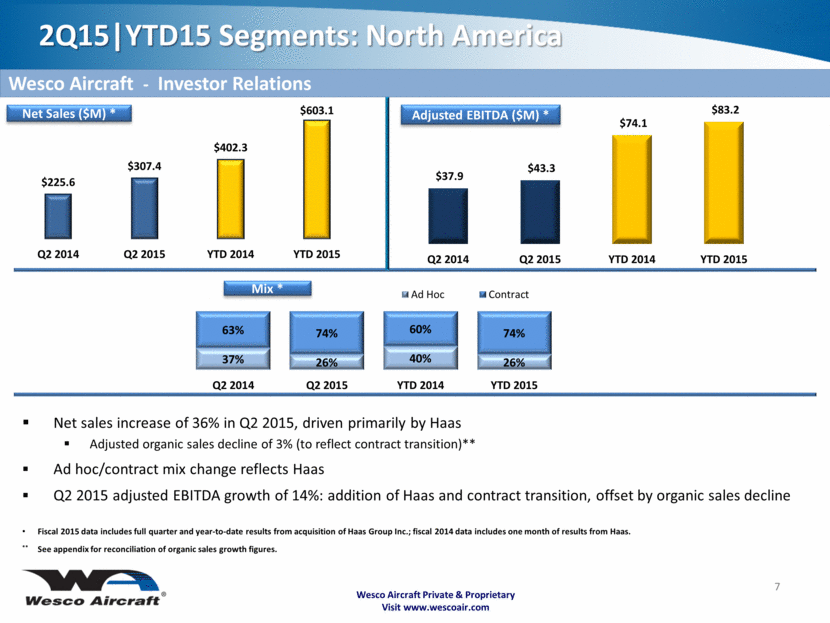
Wesco Aircraft Private & Proprietary Visit www.wescoair.com 2Q15 YTD15 Segments: North America Net Sales ($M) * Adjusted EBITDA ($M) * 7 Mix * Wesco Aircraft - Investor Relations Net sales increase of 36% in Q2 2015, driven primarily by Haas Adjusted organic sales decline of 3% (to reflect contract transition)** Ad hoc/contract mix change reflects Haas Q2 2015 adjusted EBITDA growth of 14%: addition of Haas and contract transition, offset by organic sales decline Fiscal 2015 data includes full quarter and year-to-date results from acquisition of Haas Group Inc.; fiscal 2014 data includes one month of results from Haas. ** See appendix for reconciliation of organic sales growth figures. $225.6 $307.4 $402.3 $603.1 Q2 2014 Q2 2015 YTD 2014 YTD 2015 $37.9 $43.3 $74.1 $83.2 Q2 2014 Q2 2015 YTD 2014 YTD 2015 37% 26% 40% 26% 63% 74% 60% 74% Q2 2014 Q2 2015 YTD 2014 YTD 2015 Ad Hoc Contract |
|
|
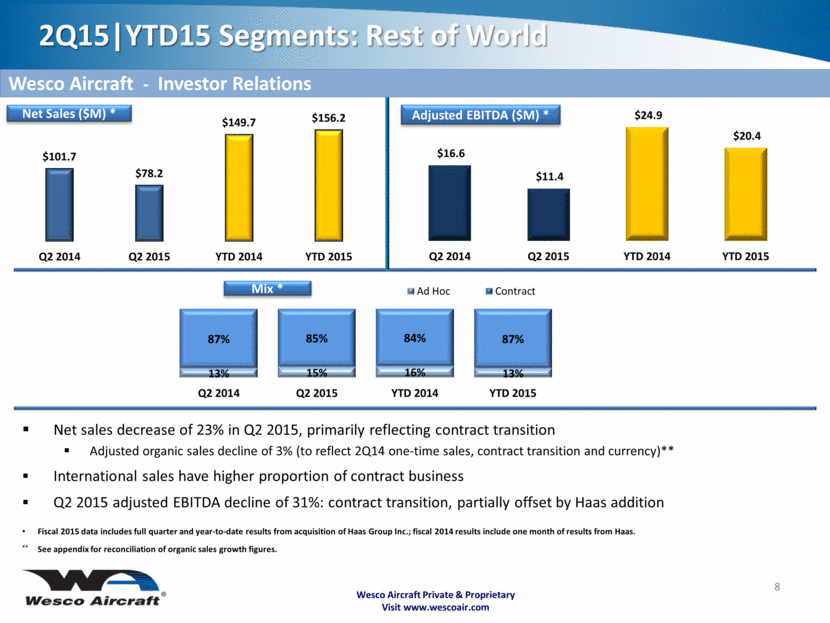
Wesco Aircraft Private & Proprietary Visit www.wescoair.com 2Q15 YTD15 Segments: Rest of World Net Sales ($M) * Adjusted EBITDA ($M) * 8 Mix * Wesco Aircraft - Investor Relations Net sales decrease of 23% in Q2 2015, primarily reflecting contract transition Adjusted organic sales decline of 3% (to reflect 2Q14 one-time sales, contract transition and currency)** International sales have higher proportion of contract business Q2 2015 adjusted EBITDA decline of 31%: contract transition, partially offset by Haas addition Fiscal 2015 data includes full quarter and year-to-date results from acquisition of Haas Group Inc.; fiscal 2014 results include one month of results from Haas. ** See appendix for reconciliation of organic sales growth figures. $101.7 $78.2 $149.7 $156.2 Q2 2014 Q2 2015 YTD 2014 YTD 2015 $16.6 $11.4 $24.9 $20.4 Q2 2014 Q2 2015 YTD 2014 YTD 2015 13% 15% 16% 13% 87% 85% 84% 87% Q2 2014 Q2 2015 YTD 2014 YTD 2015 Ad Hoc Contract |
|
|
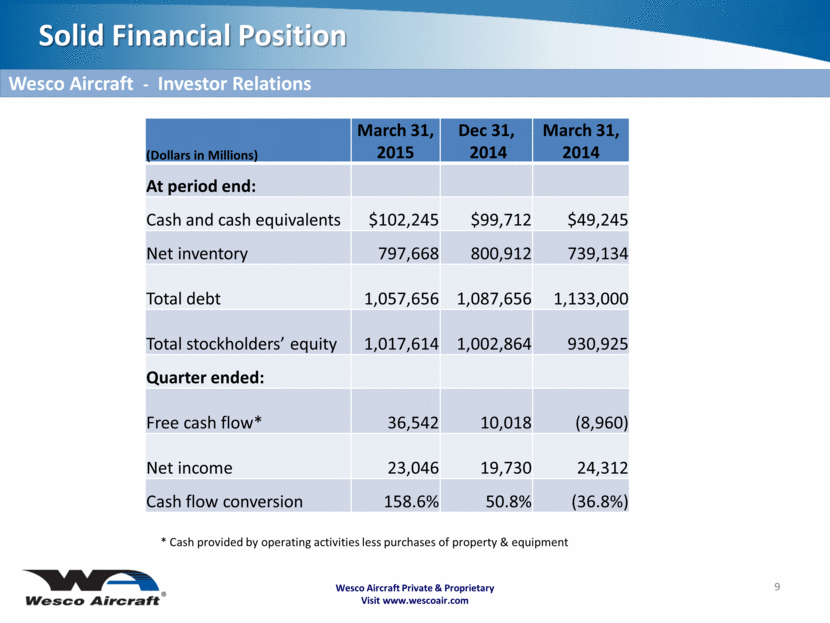
Wesco Aircraft Private & Proprietary Visit www.wescoair.com Solid Financial Position 9 Wesco Aircraft - Investor Relations * Cash provided by operating activities less purchases of property & equipment (Dollars in Millions) March 31, 2015 Dec 31, 2014 March 31, 2014 At period end: Cash and cash equivalents $102,245 $99,712 $49,245 Net inventory 797,668 800,912 739,134 Total debt 1,057,656 1,087,656 1,133,000 Total stockholders’ equity 1,017,614 1,002,864 930,925 Quarter ended: Free cash flow* 36,542 10,018 (8,960) Net income 23,046 19,730 24,312 Cash flow conversion 158.6% 50.8% (36.8%) |
|
|
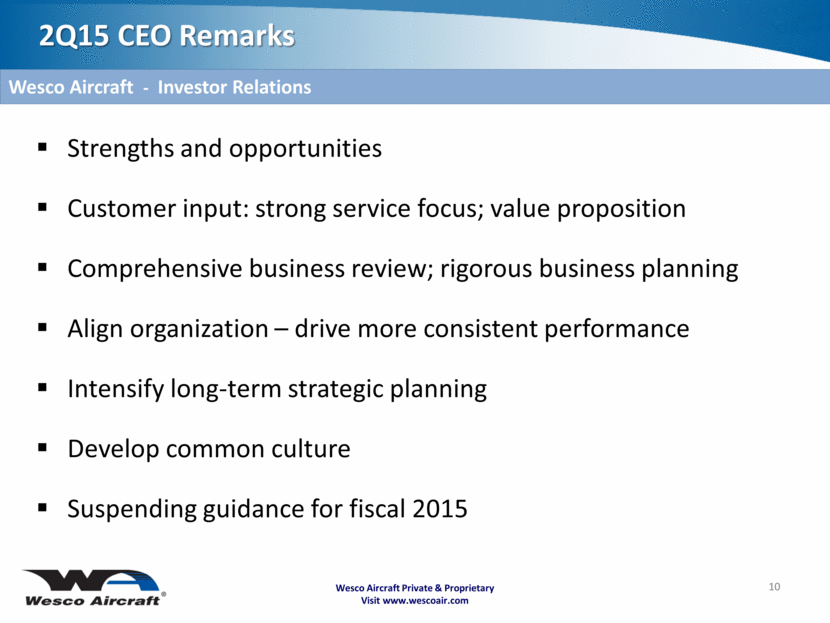
Strengths and opportunities Customer input: strong service focus; value proposition Comprehensive business review; rigorous business planning Align organization – drive more consistent performance Intensify long-term strategic planning Develop common culture Suspending guidance for fiscal 2015 Wesco Aircraft Private & Proprietary Visit www.wescoair.com 2Q15 CEO Remarks 10 Wesco Aircraft - Investor Relations |
|
|
Wesco Aircraft Private & Proprietary Visit www.wescoair.com APPENDIX 11 |
|
|
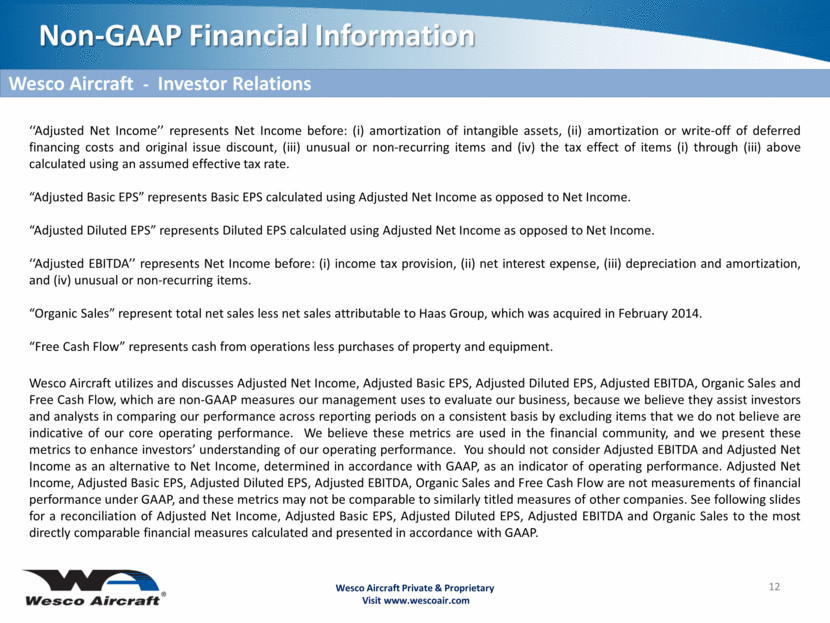
Wesco Aircraft Private & Proprietary Visit www.wescoair.com Non-GAAP Financial Information ‘‘Adjusted Net Income’’ represents Net Income before: (i) amortization of intangible assets, (ii) amortization or write-off of deferred financing costs and original issue discount, (iii) unusual or non-recurring items and (iv) the tax effect of items (i) through (iii) above calculated using an assumed effective tax rate. “Adjusted Basic EPS” represents Basic EPS calculated using Adjusted Net Income as opposed to Net Income. “Adjusted Diluted EPS” represents Diluted EPS calculated using Adjusted Net Income as opposed to Net Income. ‘‘Adjusted EBITDA’’ represents Net Income before: (i) income tax provision, (ii) net interest expense, (iii) depreciation and amortization, and (iv) unusual or non-recurring items. “Organic Sales” represent total net sales less net sales attributable to Haas Group, which was acquired in February 2014. “Free Cash Flow” represents cash from operations less purchases of property and equipment. Wesco Aircraft utilizes and discusses Adjusted Net Income, Adjusted Basic EPS, Adjusted Diluted EPS, Adjusted EBITDA, Organic Sales and Free Cash Flow, which are non-GAAP measures our management uses to evaluate our business, because we believe they assist investors and analysts in comparing our performance across reporting periods on a consistent basis by excluding items that we do not believe are indicative of our core operating performance. We believe these metrics are used in the financial community, and we present these metrics to enhance investors’ understanding of our operating performance. You should not consider Adjusted EBITDA and Adjusted Net Income as an alternative to Net Income, determined in accordance with GAAP, as an indicator of operating performance. Adjusted Net Income, Adjusted Basic EPS, Adjusted Diluted EPS, Adjusted EBITDA, Organic Sales and Free Cash Flow are not measurements of financial performance under GAAP, and these metrics may not be comparable to similarly titled measures of other companies. See following slides for a reconciliation of Adjusted Net Income, Adjusted Basic EPS, Adjusted Diluted EPS, Adjusted EBITDA and Organic Sales to the most directly comparable financial measures calculated and presented in accordance with GAAP. 12 Wesco Aircraft - Investor Relations |
|
|
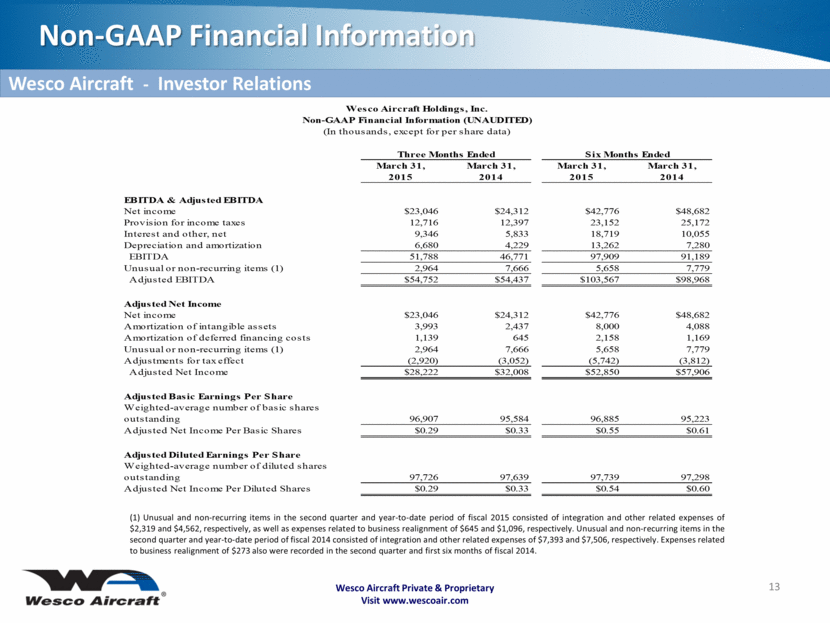
Wesco Aircraft Private & Proprietary Visit www.wescoair.com Non-GAAP Financial Information 13 Wesco Aircraft - Investor Relations (1) Unusual and non-recurring items in the second quarter and year-to-date period of fiscal 2015 consisted of integration and other related expenses of $2,319 and $4,562, respectively, as well as expenses related to business realignment of $645 and $1,096, respectively. Unusual and non-recurring items in the second quarter and year-to-date period of fiscal 2014 consisted of integration and other related expenses of $7,393 and $7,506, respectively. Expenses related to business realignment of $273 also were recorded in the second quarter and first six months of fiscal 2014. March 31, 2015 March 31, 2014 March 31, 2015 March 31, 2014 EBITDA & Adjusted EBITDA Net income $23,046 $24,312 $42,776 $48,682 Provision for income taxes 12,716 12,397 23,152 25,172 Interest and other, net 9,346 5,833 18,719 10,055 Depreciation and amortization 6,680 4,229 13,262 7,280 EBITDA 51,788 46,771 97,909 91,189 Unusual or non-recurring items (1) 2,964 7,666 5,658 7,779 Adjusted EBITDA $54,752 $54,437 $103,567 $98,968 Adjusted Net Income Net income $23,046 $24,312 $42,776 $48,682 Amortization of intangible assets 3,993 2,437 8,000 4,088 Amortization of deferred financing costs 1,139 645 2,158 1,169 Unusual or non-recurring items (1) 2,964 7,666 5,658 7,779 Adjustments for tax effect (2,920) (3,052) (5,742) (3,812) Adjusted Net Income $28,222 $32,008 $52,850 $57,906 Adjusted Basic Earnings Per Share Weighted-average number of basic shares outstanding 96,907 95,584 96,885 95,223 Adjusted Net Income Per Basic Shares $0.29 $0.33 $0.55 $0.61 Adjusted Diluted Earnings Per Share Weighted-average number of diluted shares outstanding 97,726 97,639 97,739 97,298 Adjusted Net Income Per Diluted Shares $0.29 $0.33 $0.54 $0.60 Wesco Aircraft Holdings, Inc. Non-GAAP Financial Information (UNAUDITED) (In thousands, except for per share data) Three Months Ended Six Months Ended |
|
|
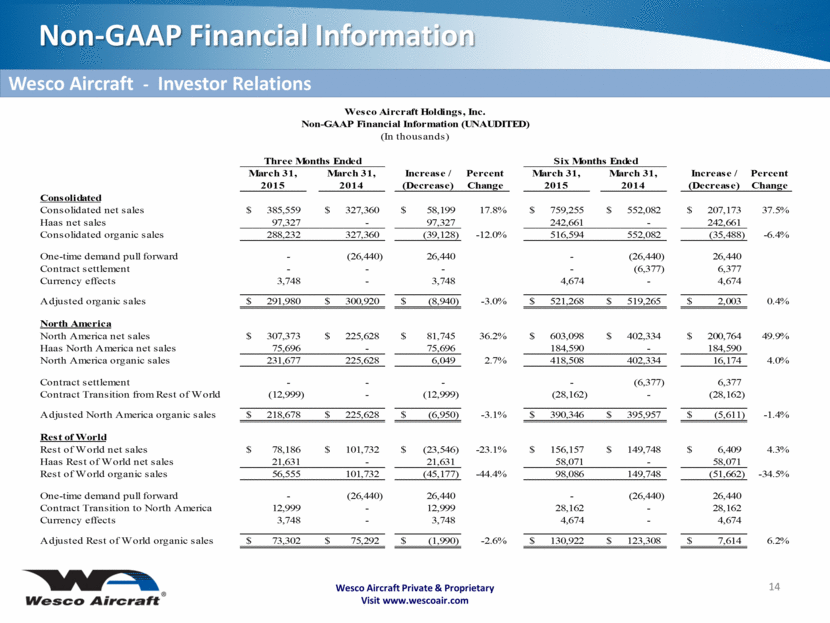
Wesco Aircraft Private & Proprietary Visit www.wescoair.com Non-GAAP Financial Information 14 Wesco Aircraft - Investor Relations March 31, 2015 March 31, 2014 Increase / (Decrease) Percent Change March 31, 2015 March 31, 2014 Increase / (Decrease) Percent Change Consolidated Consolidated net sales 385,559 $ 327,360 $ 58,199 $ 17.8% 759,255 $ 552,082 $ 207,173 $ 37.5% Haas net sales 97,327 - 97,327 242,661 - 242,661 Consolidated organic sales 288,232 327,360 (39,128) -12.0% 516,594 552,082 (35,488) -6.4% One-time demand pull forward - (26,440) 26,440 - (26,440) 26,440 Contract settlement - - - - (6,377) 6,377 Currency effects 3,748 - 3,748 4,674 - 4,674 Adjusted organic sales 291,980 $ 300,920 $ (8,940) $ -3.0% 521,268 $ 519,265 $ 2,003 $ 0.4% North America North America net sales 307,373 $ 225,628 $ 81,745 $ 36.2% 603,098 $ 402,334 $ 200,764 $ 49.9% Haas North America net sales 75,696 - 75,696 184,590 - 184,590 North America organic sales 231,677 225,628 6,049 2.7% 418,508 402,334 16,174 4.0% Contract settlement - - - - (6,377) 6,377 Contract Transition from Rest of World (12,999) - (12,999) (28,162) - (28,162) Adjusted North America organic sales 218,678 $ 225,628 $ (6,950) $ -3.1% 390,346 $ 395,957 $ (5,611) $ -1.4% Rest of World Rest of World net sales 78,186 $ 101,732 $ (23,546) $ -23.1% 156,157 $ 149,748 $ 6,409 $ 4.3% Haas Rest of World net sales 21,631 - 21,631 58,071 - 58,071 Rest of World organic sales 56,555 101,732 (45,177) -44.4% 98,086 149,748 (51,662) -34.5% One-time demand pull forward - (26,440) 26,440 - (26,440) 26,440 Contract Transition to North America 12,999 - 12,999 28,162 - 28,162 Currency effects 3,748 - 3,748 4,674 - 4,674 Adjusted Rest of World organic sales 73,302 $ 75,292 $ (1,990) $ -2.6% 130,922 $ 123,308 $ 7,614 $ 6.2% Three Months Ended Six Months Ended Wesco Aircraft Holdings, Inc. Non-GAAP Financial Information (UNAUDITED) (In thousands) |
|
|
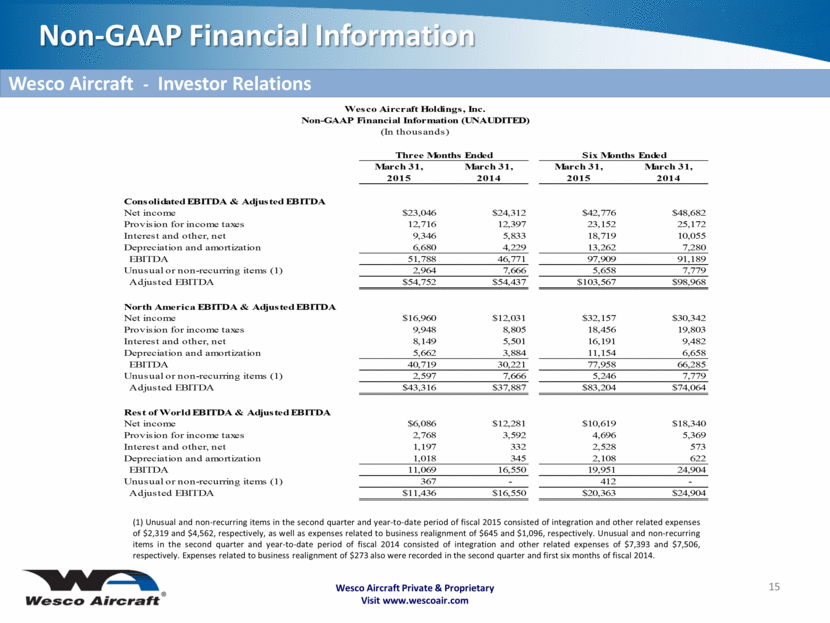
Wesco Aircraft Private & Proprietary Visit www.wescoair.com Non-GAAP Financial Information 15 Wesco Aircraft - Investor Relations (1) Unusual and non-recurring items in the second quarter and year-to-date period of fiscal 2015 consisted of integration and other related expenses of $2,319 and $4,562, respectively, as well as expenses related to business realignment of $645 and $1,096, respectively. Unusual and non-recurring items in the second quarter and year-to-date period of fiscal 2014 consisted of integration and other related expenses of $7,393 and $7,506, respectively. Expenses related to business realignment of $273 also were recorded in the second quarter and first six months of fiscal 2014. March 31, 2015 March 31, 2014 March 31, 2015 March 31, 2014 Consolidated EBITDA & Adjusted EBITDA Net income $23,046 $24,312 $42,776 $48,682 Provision for income taxes 12,716 12,397 23,152 25,172 Interest and other, net 9,346 5,833 18,719 10,055 Depreciation and amortization 6,680 4,229 13,262 7,280 EBITDA 51,788 46,771 97,909 91,189 Unusual or non-recurring items (1) 2,964 7,666 5,658 7,779 Adjusted EBITDA $54,752 $54,437 $103,567 $98,968 North America EBITDA & Adjusted EBITDA Net income $16,960 $12,031 $32,157 $30,342 Provision for income taxes 9,948 8,805 18,456 19,803 Interest and other, net 8,149 5,501 16,191 9,482 Depreciation and amortization 5,662 3,884 11,154 6,658 EBITDA 40,719 30,221 77,958 66,285 Unusual or non-recurring items (1) 2,597 7,666 5,246 7,779 Adjusted EBITDA $43,316 $37,887 $83,204 $74,064 Rest of World EBITDA & Adjusted EBITDA Net income $6,086 $12,281 $10,619 $18,340 Provision for income taxes 2,768 3,592 4,696 5,369 Interest and other, net 1,197 332 2,528 573 Depreciation and amortization 1,018 345 2,108 622 EBITDA 11,069 16,550 19,951 24,904 Unusual or non-recurring items (1) 367 - 412 - Adjusted EBITDA $11,436 $16,550 $20,363 $24,904 Wesco Aircraft Holdings, Inc. Non-GAAP Financial Information (UNAUDITED) (In thousands) Three Months Ended Six Months Ended |
|
|
Information is Wesco Aircraft Proprietary Visit www.wescoair.com 16 |