Attached files
| file | filename |
|---|---|
| EX-99.1 - EXHIBIT 99.1 - Time Inc. | exhibit9911q15pr.htm |
| 8-K - 8-K - Time Inc. | a8k3312015cover.htm |

First Quarter 2015 Financial Results May 7, 2015

2 This presentation contains forward-looking statements within the meaning of the Private Securities Litigation Reform Act of 1995; particularly statements regarding future financial and operating results of Time Inc. (the “Company”) and its business. These statements are based on management’s current expectations or beliefs, and are subject to uncertainty and changes in circumstances. Actual results may vary materially from those expressed or implied in this presentation due to changes in economic, business, competitive, technological, strategic, regulatory and/or other factors. More detailed information about these factors may be found in the Company’s filings with the Securities and Exchange Commission, including its Annual Report on Form 10-K for the year ended December 31, 2014. The Company is under no obligation, and expressly disclaims any such obligation, to update or alter its forward-looking statements, whether as a result of new information, future events or otherwise. Non-GAAP financial measures such as operating income before depreciation and amortization (“OIBDA”), Adjusted OIBDA, Adjusted Diluted EPS and Free Cash Flow, as included in this presentation, are supplemental measures that are not calculated in accordance with Generally Accepted Accounting Principles (“GAAP”). Definitions of these measures and reconciliations to the most directly-comparable GAAP measures are contained in the applicable earnings release and trending schedules for the relevant period, which are available on the Company’s Web site at https://invest.timeinc.com. Our non-GAAP financial measures have limitations as analytical and comparative tools and you should consider OIBDA, Adjusted OIBDA, and Free Cash Flow in addition to, and not as a substitute for, the Company’s Operating Income (Loss), Income (loss) from Continuing Operations, and various cash flow measures (e.g., Cash Provided by (Used in) Operations), as well as other measures of financial performance and liquidity reported in accordance with GAAP. Note: Throughout the presentation, certain numbers will not sum to the total due to rounding. Disclaimer

3 Adjusted OIBDA of $51 million versus $64 million last year Excluding the impact of the dispositions of CNNMoney and Grupo Editorial Expansión or “GEX” and the impact of the stronger US dollar relative to the British pound or “FX” - Digital advertising revenues would have grown 20% versus 1Q14 - Print and other advertising revenues would have declined 10% versus 1Q14 - Circulation revenues would have declined 5% versus 1Q14 - Other Revenues would have declined 6% versus 1Q14 - Operating expenses would have declined 3% versus 1Q14 We ended the quarter with a cash balance of $458 million Listed the Blue Fin Building for sale (Time Inc. UK executive offices) 1Q15 Financial Highlights

4 1Q15 Total Revenues $MM Total revenues down 9% - Dispositions of CNNMoney and GEX drove 3% pts decline - FX drove 1% pt decline $745 $680 1Q14 1Q15 Highlights

5 1Q15 Advertising Revenues Total advertising revenues down 9% - Dispositions of CNNMoney and GEX drove 3% pts decline - FX drove 1% pt decline Print and other advertising down 12% - Disposition of GEX drove 1% pt decline - FX drove 1% pt decline - Continued to outperform the industry; Time Inc. domestic share increased 0.8% pts to 26.3% year-to-date Digital Advertising up 1% - Dispositions of CNNMoney and GEX drove 19% pts decline - Includes positive impact from the launch of Fortune.com and Money.com (+6% pts) - March 2015 unique visitors up 30%1 versus 2014, excluding CNNMoney $MM Highlights Digital Advertising Print and Other Advertising $318 $72 $390 $280 $73 $353 1Q14 1Q15 1 Source: comScore March 2015. March 2015 total U.S. unique visitors to our U.S. sites totaled 106.8 million.

$1 $2 Other Circulation Revenues Newsstand Revenues Subscription Revenues 6 1Q15 Circulation Revenues Continued subscription and newsstand softness Subscription revenues down 8% - Disposition of GEX and FX drove 1% pt decline Newsstand revenues down 10% - FX drove 4% pts decline $MM $180 $165 $270 $250 Highlights $86 $77 $4 $8 1Q14 1Q15
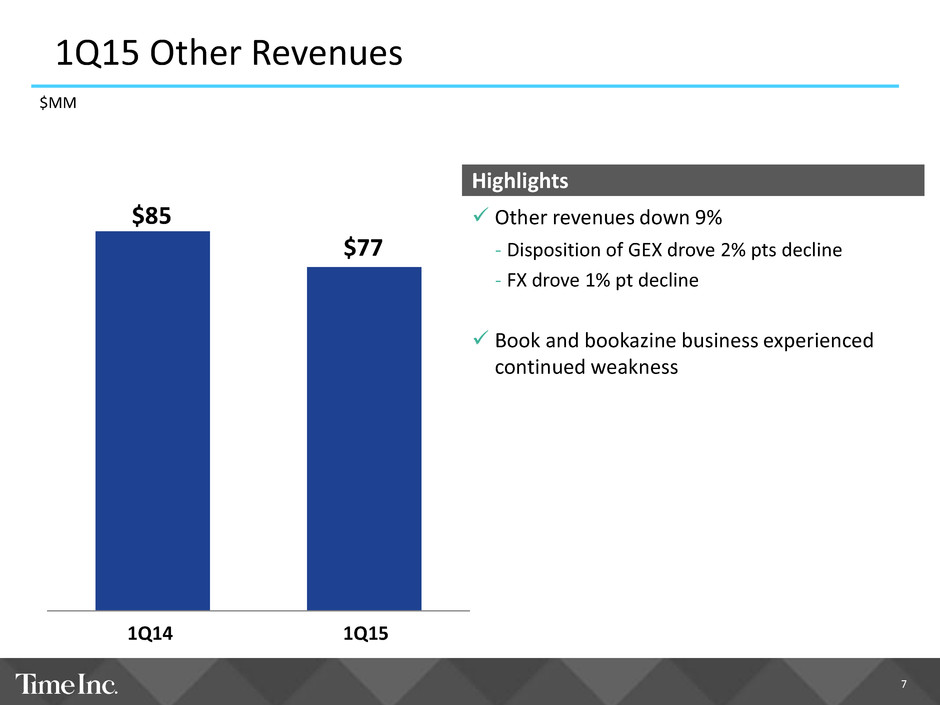
7 1Q15 Other Revenues Other revenues down 9% - Disposition of GEX drove 2% pts decline - FX drove 1% pt decline Book and bookazine business experienced continued weakness $MM $85 $77 Highlights 1Q14 1Q15

Costs of Revenues (COR) SG&A 8 1Q15 Operating Expenses Operating Expenses1 down 7% - Dispositions of CNNMoney and GEX drove 3% pts decline - FX drove 1% pt decline Costs of Revenues down 11% - Dispositions of CNNMoney and GEX drove 3% pts decline - FX drove 2% pts decline SG&A down 4% - Dispositions of CNNMoney and GEX drove 3% pts decline - FX drove 1% pt decline Stock compensation increased $10 million year over year ‒COR $1 million ‒SG&A $9 million $630 $681 $359 $MM Highlights $375 $306 $271 1Q14 1Q15 1 Other costs of $1 million related to acquisitions and dispositions during 1Q15 are included within SG&A within the Statement of Operations and are excluded from our definition of Adjusted OIBDA.

1 2 9 1Q15 Adjusted OIBDA Adjusted OIBDA of $51 million would have been essentially flat excluding: - Dispositions and FX (net) - Incremental stock compensation expense - Incremental real estate expense $MM $64 $51 Highlights 1Q 4 1Q15
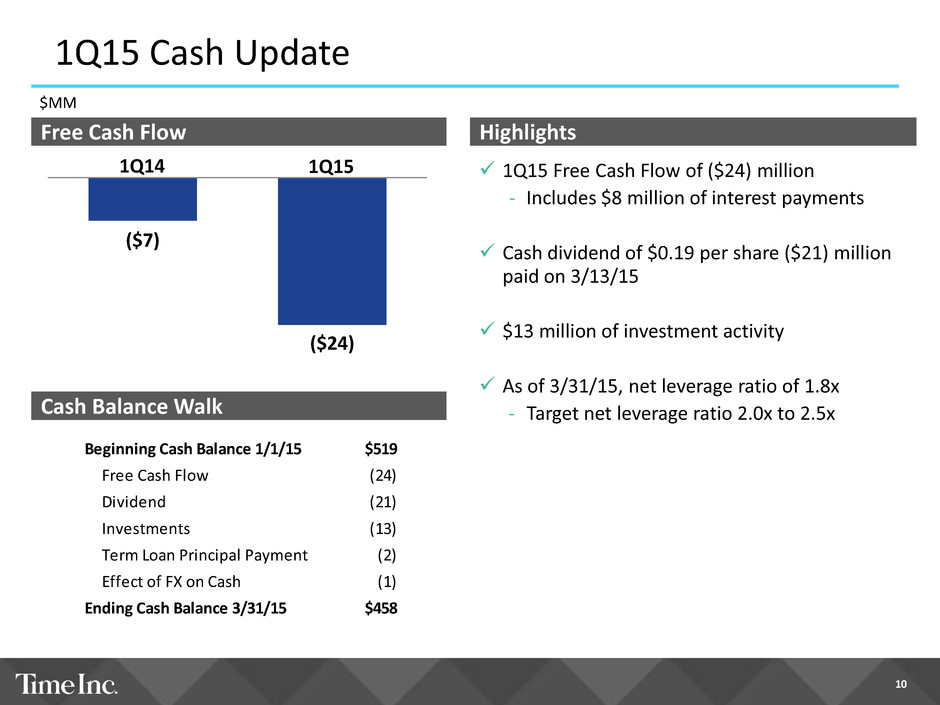
10 1Q15 Cash Update $MM Free Cash Flow 1Q15 Free Cash Flow of ($24) million - Includes $8 million of interest payments Cash dividend of $0.19 per share ($21) million paid on 3/13/15 $13 million of investment activity As of 3/31/15, net leverage ratio of 1.8x - Target net leverage ratio 2.0x to 2.5x Highlights ($7) ($24) 1Q14 1Q15 Cash Balance Walk Beginning Cash Balance 1/1/15 $519 Free Cash Flow (24) Dividend (21) Investments (13) Term Loan Principal Payment (2) Effect of FX on Cash (1) Ending Cash Balance 3/31/15 $458

11 Time Inc Outlook for 2015 $MM 2014 Actual Full Year 2015 Outlook Range Revenues – as reported (2.2%) (3%) to (6%) Revenues1 (5.3%) (1.5%) to (4.5%) Impact of 2014 wholesaler transition ($22) 70 bps Forecasted impact of stronger USD2 ------ (120 bps) Adjusted OIBDA3 $524 $440 to $490 Impact of 2014 wholesaler transition ($30) ------ One-time real estate expense ------ ($45) Investment spending, net ------ ($45) Capital expenditures $41 $210 to $220 Real estate related4 $9 $140 to $150 Core & growth $32 $70 1 2014 Actual Revenues exclude the impact of the AMG Acquisition and the CNNMoney.com and GEX dispositions. Full Year 2015 Outlook excludes the impact of the dispositions. 2 Assumes USD to GBP exchange rate of 1.50; 3 We define Adjusted OIBDA as OIBDA adjusted for impairments of Goodwill, intangibles, fixed assets and investments, Restructuring and severance costs, gains and losses on operating assets, pension plan settlements and/or curtailments and Other costs related to mergers, acquisitions, investments and dispositions. 4 Our Full Year 2015 Outlook includes capital expenditures of $185 million to $195 million offset by $45 million of tenant improvement allowances.

Q&A 12

13 APPENDIX
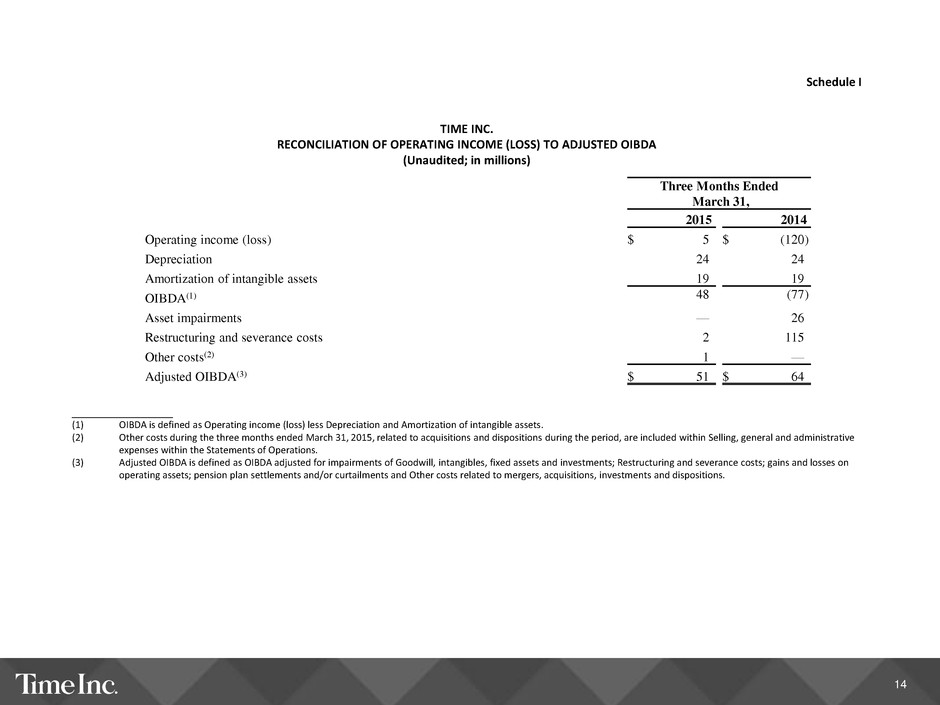
14 Schedule I TIME INC. RECONCILIATION OF OPERATING INCOME (LOSS) TO ADJUSTED OIBDA (Unaudited; in millions) ______________ (1) OIBDA is defined as Operating income (loss) less Depreciation and Amortization of intangible assets. (2) Other costs during the three months ended March 31, 2015, related to acquisitions and dispositions during the period, are included within Selling, general and administrative expenses within the Statements of Operations. (3) Adjusted OIBDA is defined as OIBDA adjusted for impairments of Goodwill, intangibles, fixed assets and investments; Restructuring and severance costs; gains and losses on operating assets; pension plan settlements and/or curtailments and Other costs related to mergers, acquisitions, investments and dispositions. Three Months Ended March 31, 2015 2014 Operating income (loss) $ 5 $ (120 ) Depreciation 24 24 Amortization of intangible assets 19 19 OIBDA(1) 48 (77 ) Asset impairments — 26 Restructuring and severance costs 2 115 Other costs(2) 1 — Adjusted OIBDA(3) $ 51 $ 64

15 Schedule II TIME INC. RECONCILIATION OF NET INCOME (LOSS) TO ADJUSTED NET INCOME (Unaudited; in millions) ______________ (1) Adjusted Net (Loss) Income is defined as Net income (loss) adjusted for impairments of Goodwill, intangibles, fixed assets and investments; Restructuring and severance costs; gains and losses on operating assets; pension plan settlements and/or curtailments; Other costs related to mergers, acquisitions, investments and dispositions; as well as the impact of income taxes on the above items. Three Months Ended March 31, 2015 Three Months Ended March 31, 2014 Gross Impact Tax Impact Net Impact Gross Impact Tax Impact Net Impact Net income (loss) $ (17 ) $ 8 $ (9 ) $ (116 ) $ 42 $ (74 ) Asset impairments — — — 26 (10 ) 16 Restructuring and severance costs 2 (1 ) 1 115 (41 ) 74 Other costs 1 — 1 — — — Adjusted Net (Loss) Income(1) $ (14 ) $ 7 $ (7 ) $ 25 $ (9 ) $ 16

16 Schedule III TIME INC. RECONCILIATION OF DILUTED EPS TO ADJUSTED DILUTED EPS (Unaudited) ______________ (1) Adjusted Diluted EPS is defined as Diluted EPS adjusted for impairments of Goodwill, intangibles, fixed assets and investments; Restructuring and severance costs; gains and losses on operating assets; pension plan settlements and/or curtailments; Other costs related to mergers, acquisitions, investments and dispositions; as well as the impact of income taxes on the above items. Three Months Ended March 31, 2015 2014 Diluted EPS $ (0.08 ) $ (0.68 ) Asset impairments, net of tax per share — 0.15 Restructuring and severance costs, net of tax per share 0.01 0.68 Other costs, net of tax per share 0.01 — Adjusted Diluted EPS(1) $ (0.06 ) $ 0.15
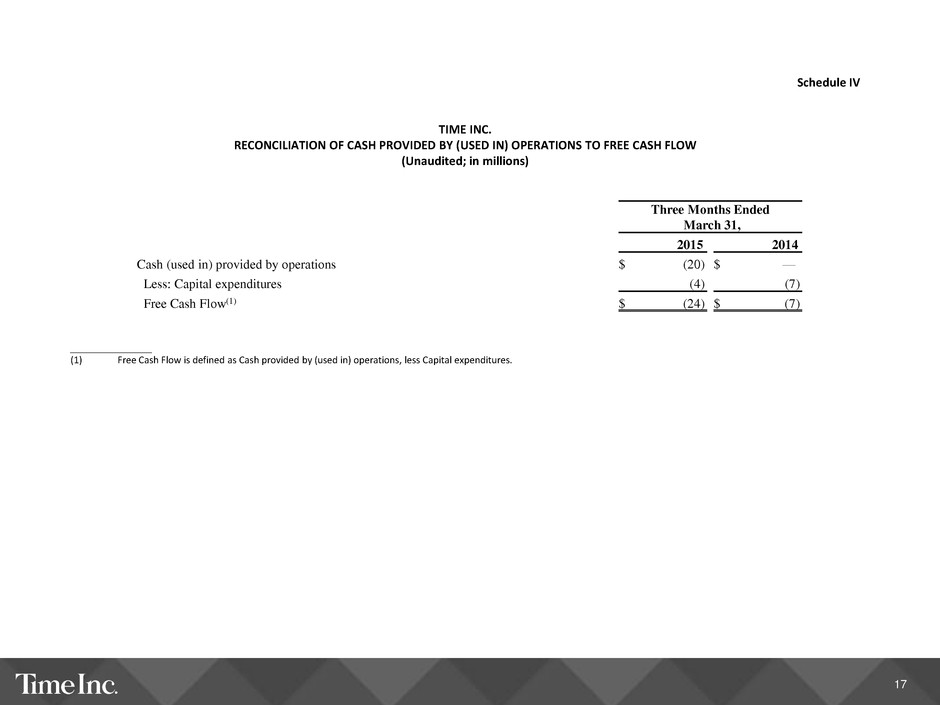
17 Schedule IV TIME INC. RECONCILIATION OF CASH PROVIDED BY (USED IN) OPERATIONS TO FREE CASH FLOW (Unaudited; in millions) ______________ (1) Free Cash Flow is defined as Cash provided by (used in) operations, less Capital expenditures. Three Months Ended March 31, 2015 2014 Cash (used in) provided by operations $ (20 ) $ — Less: Capital expenditures (4 ) (7 ) Free Cash Flow(1) $ (24 ) $ (7 )
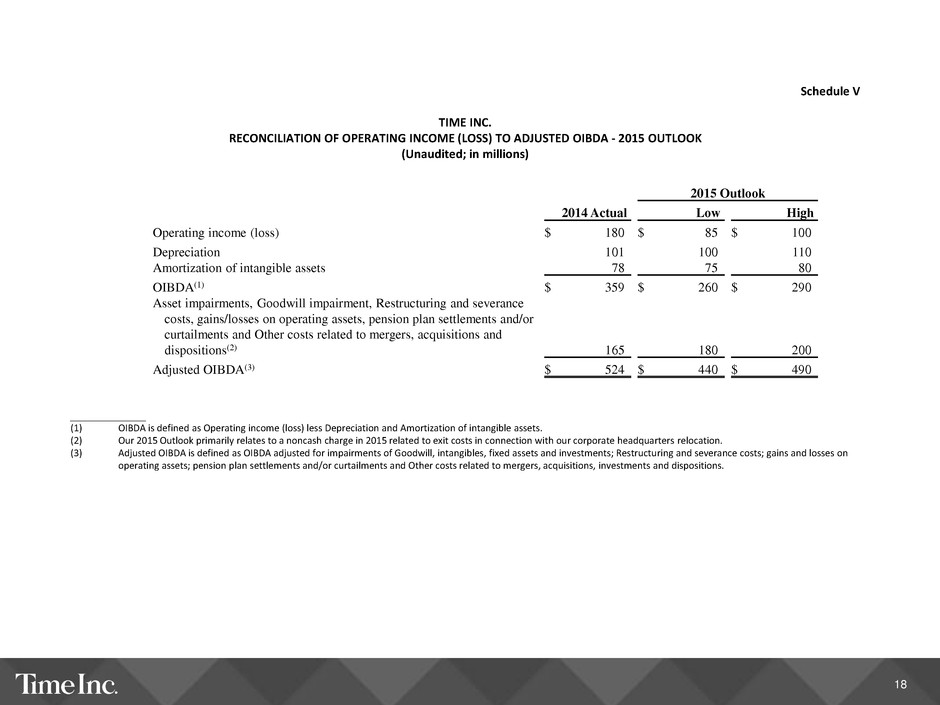
18 Schedule V TIME INC. RECONCILIATION OF OPERATING INCOME (LOSS) TO ADJUSTED OIBDA - 2015 OUTLOOK (Unaudited; in millions) _____________ (1) OIBDA is defined as Operating income (loss) less Depreciation and Amortization of intangible assets. (2) Our 2015 Outlook primarily relates to a noncash charge in 2015 related to exit costs in connection with our corporate headquarters relocation. (3) Adjusted OIBDA is defined as OIBDA adjusted for impairments of Goodwill, intangibles, fixed assets and investments; Restructuring and severance costs; gains and losses on operating assets; pension plan settlements and/or curtailments and Other costs related to mergers, acquisitions, investments and dispositions. 2015 Outlook 2014 Actual Low High Operating income (loss) $ 180 $ 85 $ 100 Depreciation 101 100 110 Amortization of intangible assets 78 75 80 OIBDA(1) $ 359 $ 260 $ 290 Asset impairments, Goodwill impairment, Restructuring and severance costs, gains/losses on operating assets, pension plan settlements and/or curtailments and Other costs related to mergers, acquisitions and dispositions(2) 165 180 200 Adjusted OIBDA(3) $ 524 $ 440 $ 490
