Attached files
| file | filename |
|---|---|
| 8-K - FORM 8-K - SunGard | d921745d8k.htm |
| EX-99.1 - EX-99.1 - SunGard | d921745dex991.htm |
| Exhibit 99.2
|
First Quarter 2015 Earnings Call
Supplemental Materials May 7, 2015
|
|
Forward Looking Statement
SunGard’s “Safe Harbor” Statement under Private Securities Litigation Reform Act of 1995
This presentation and other written and oral statements made from time to time by representatives of SunGard may constitute forward-looking statements. You can identify forward-looking statements because they contain words such as “believes,” “expects,” “may,” “will,” “would,” “should,” “seeks,” “approximately,” “intends,” “plans,” “estimates,” or “anticipates” or similar expressions which concern our strategy, plans or intentions. All statements we make relating to estimated and projected earnings, margins, costs, expenditures, cash flows, growth rates, financial results and pro forma estimates are forward-looking statements. In addition, we, through our senior management, from time to time make forward-looking public statements concerning our expected future operations and performance and other developments. All of these forward-looking statements are subject to risks and uncertainties that may change at any time, and, therefore, our actual results may differ materially from those we expected. We derive most of our forward-looking statements from our operating budgets and forecasts, which are based upon many detailed assumptions. While we believe that our assumptions are reasonable, we caution that it is very difficult to predict the impact of known factors, and, of course, it is impossible for us to anticipate all factors that could affect our actual results. Some of the factors that we believe could affect our results include: global economic and market conditions; the condition of the financial services industry, including the effect of any further consolidation among financial services firms; our high degree of debt-related leverage; the effect of war, terrorism, natural disasters or other catastrophic events; the effect of disruptions to our systems and infrastructure; the timing and magnitude of software sales; the timing and scope of technological advances; the market and credit risks associated with broker/dealer operations; the ability to retain and attract customers and key personnel; risks relating to the foreign countries where we transact business; the integration and performance of acquired businesses; the ability to obtain patent protection and avoid patent-related liabilities in the context of a rapidly developing legal framework for software and business-method patents; a material weakness in our internal controls; unanticipated changes in our income tax provision or the enactment of new tax legislation, issuance of regulations or relevant judicial decisions, and the split-off of the Availability Services business failing to qualify as a tax free transaction. The factors described in this paragraph and other factors that may affect our business or future financial results are discussed under the caption “Risk Factors” and “Management’s Discussion and Analysis of Financial Conditions and Results of Operations” in our most recent Annual Report on Form 10-K filed with the U.S. Securities and Exchange Commission, copies of which may be obtained from us without charge. We assume no obligation to update any written or oral forward-looking statement made by us or on our behalf as a result of new information, future events or other factors.
2
|
|
First Quarter 2015 Financial Highlights
$671 million of Revenue
up 3% year over year? up 6% adjusted for currency
$115 million of Operating Income
Margin of 17.1%
First quarter 2014 included a $339 million non-cash trade name impairment charge related to the split-off of the Availability Services business? Excluding the above charge, operating income increased 129% year over year and the operating income margin increased 9.4 points year over year
$26 million of Income from continuing operations
Margin of 3.9%
$175 million of Adjusted EBITDA*
Up 21% year over year? Margin of 26.1%, up 3.9 points
$126 million of Free Cash Flow**
Up $68 million year over year
*Refer to Appendix for reconciliation of GAAP to non-GAAP items and a description of non-GAAP financial measures **See page 7 for reconciliation of GAAP to non-GAAP item
3
|
|
Revenue
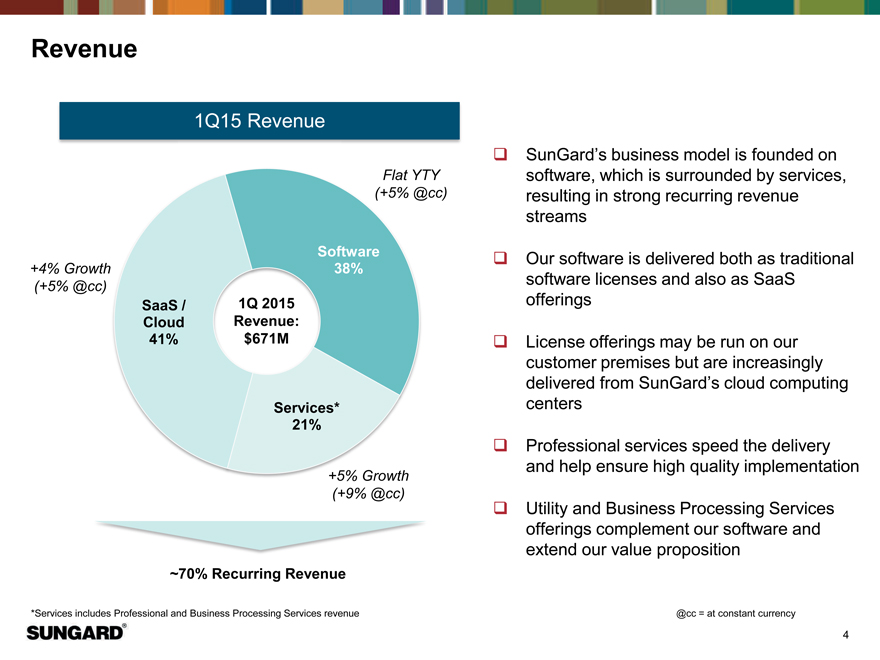
1Q15 Revenue
Flat YTY (+5% @cc)
Software
+4% Growth 38% (+5% @cc)
SaaS / 1Q 2015 Cloud Revenue: 41% $671M
Services* 21%
+5% Growth (+9% @cc)
SunGard’s business model is founded on software, which is surrounded by services, resulting in strong recurring revenue streams
Our software is delivered both as traditional software licenses and also as SaaS offerings
License offerings may be run on our customer premises but are increasingly delivered from SunGard’s cloud computing centers
Professional services speed the delivery and help ensure high quality implementation
Utility and Business Processing Services offerings complement our software and extend our value proposition
~70% Recurring Revenue
*Services includes Professional and Business Processing Services revenue
@cc = at constant currency
4
|
|
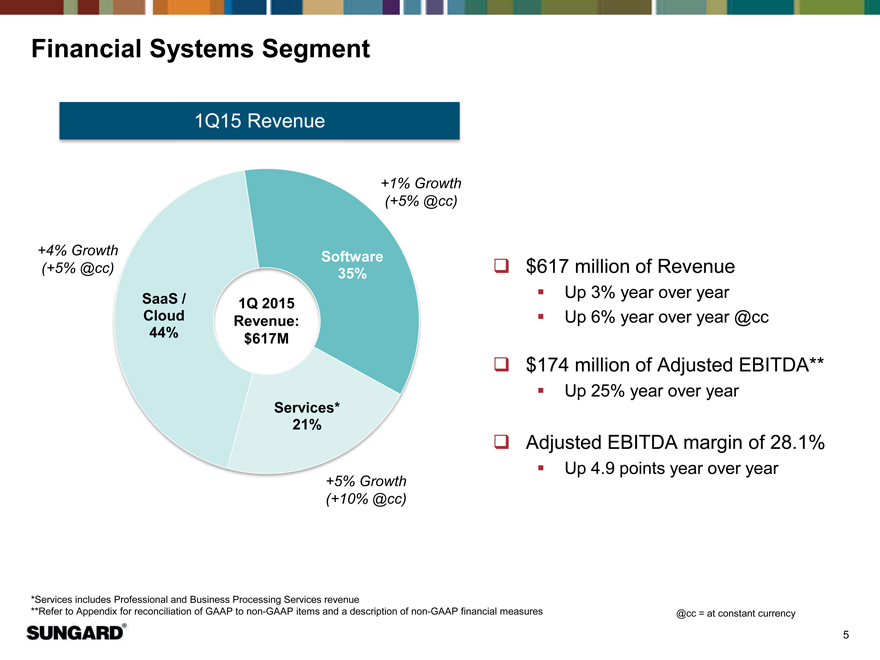
Financial Systems Segment
1Q15 Revenue
+1% Growth (+5% @cc)
+4% Growth Software (+5% @cc) 35% SaaS / 1Q 2015 Cloud Revenue: 44% $617M
Services* 21%
+5% Growth (+10% @cc)
$617 million of Revenue
Up 3% year over year? Up 6% year over year @cc
$174 million of Adjusted EBITDA**
Up 25% year over year
Adjusted EBITDA margin of 28.1%
Up 4.9 points year over year
*Services includes Professional and Business Processing Services revenue
**Refer to Appendix for reconciliation of GAAP to non-GAAP items and a description of non-GAAP financial measures @cc = at constant currency
5
|
|
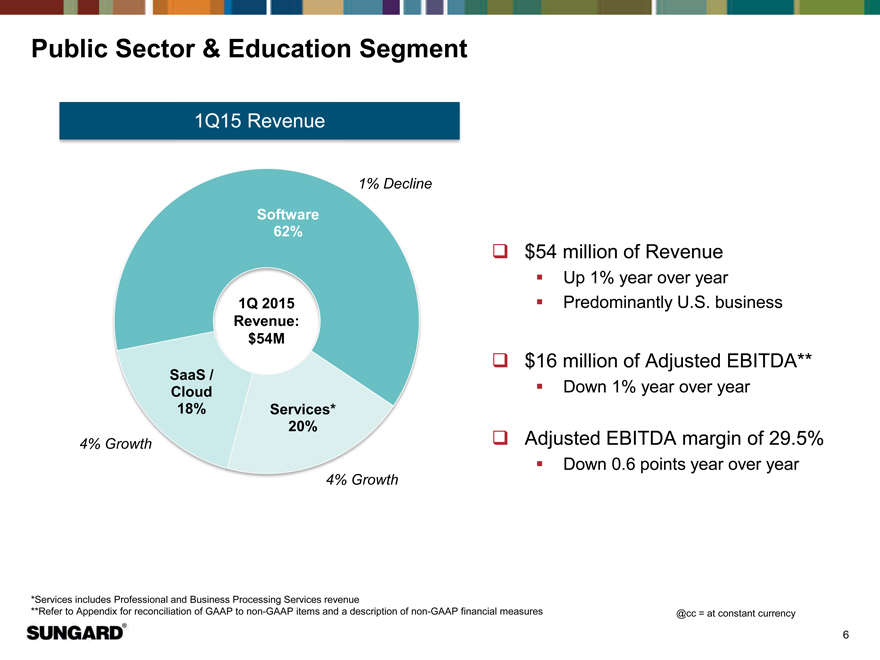
Public Sector & Education Segment
1Q15 Revenue
1% Decline
Software 62%
1Q 2015 Revenue: $54M
SaaS / Cloud
18% Services* 20%
4% Growth
4% Growth
$54 million of Revenue
Up 1% year over year ? Predominantly U.S. business
$16 million of Adjusted EBITDA**
Down 1% year over year
Adjusted EBITDA margin of 29.5%
Down 0.6 points year over year
*Services includes Professional and Business Processing Services revenue
**Refer to Appendix for reconciliation of GAAP to non-GAAP items and a description of non-GAAP financial measures @cc = at constant currency
6
|
|
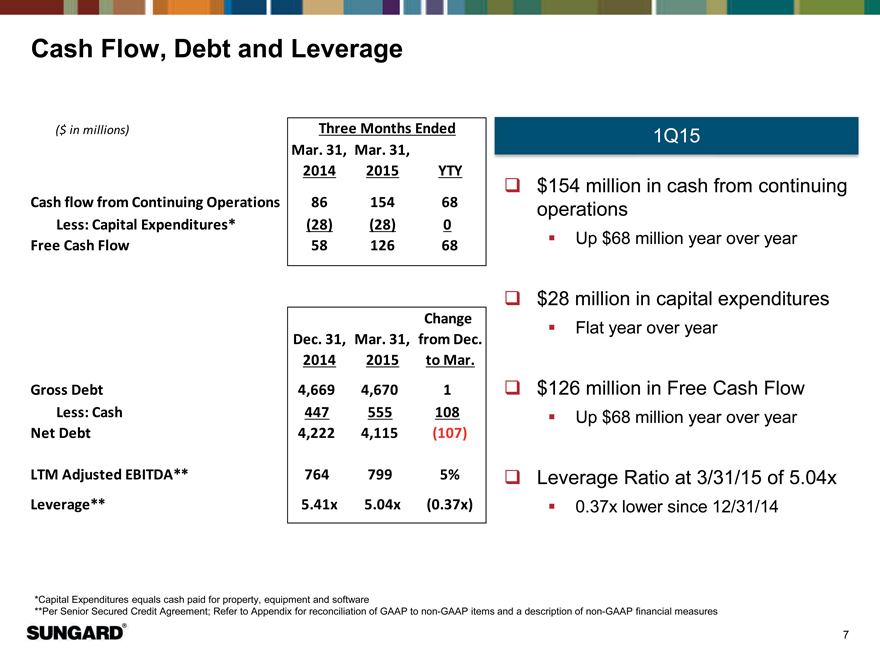
Cash Flow, Debt and Leverage
($ in millions) Three Months Ended 1Q15 Mar. 31, Mar. 31, 2014 2015 YTY
Cash flow from Continuing Operations 86 154 68? $154 million in cash from continuing
operations
Less: Capital Expenditures* (28) (28) 0
Free Cash Flow 58 126 68? Up $68 million year over year
$28 million in capital expenditures
Change
Flat year over year
Dec. 31, Mar. 31, from Dec. 2014 2015 to Mar.
Gross Debt 4,669 4,670 1? $126 million in Free Cash Flow
Less: Cash 447 555 108? Up $68 million year over year
Net Debt 4,222 4,115 (107)
LTM Adjusted EBITDA** 764 799 5%? Leverage Ratio at 3/31/15 of 5.04x
Leverage** 5.41x 5.04x (0.37x)? 0.37x lower since 12/31/14
*Capital Expenditures equals cash paid for property, equipment and software
**Per Senior Secured Credit Agreement; Refer to Appendix for reconciliation of GAAP to non-GAAP items and a description of non-GAAP financial measures
7
|
|

Appendix
8
|
|
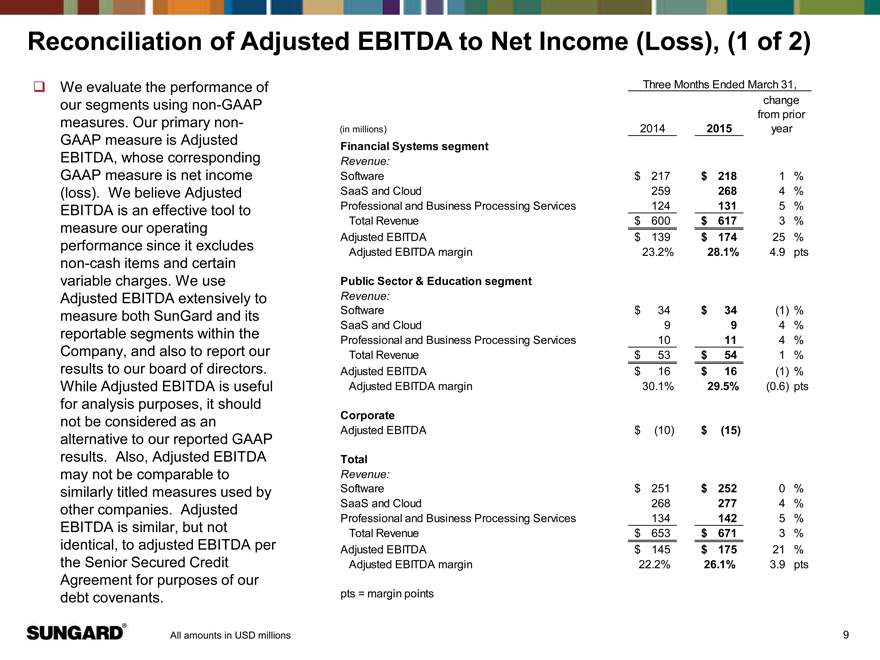
Reconciliation of Adjusted EBITDA to Net Income (Loss), (1 of 2)
We evaluate the performance of Three Months Ended March 31,
our segments using non-GAAP change
from prior
measures. Our primary non-(in millions) 2014 2015 year
GAAP measure is Adjusted Financial Systems segment
EBITDA, whose corresponding Revenue:
GAAP measure is net income Software $ 217 $ 218 1%
(loss). We believe Adjusted SaaS and Cloud 259 268 4%
EBITDA is an effective tool to Professional and Business Processing Services 124 131 5%
measure our operating Total Revenue $ 600 $ 617 3%
Adjusted EBITDA $ 139 $ 174 25%
performance since it excludes Adjusted EBITDA margin 23.2% 28.1% 4.9 pts
non-cash items and certain
variable charges. We use Public Sector & Education segment
Adjusted EBITDA extensively to Revenue:
measure both SunGard and its Software $ 34 $ 34(1)%
SaaS and Cloud 9 9 4%
reportable segments within the Professional and Business Processing Services 10 11 4%
Company, and also to report our Total Revenue $ 53 $ 54 1%
results to our board of directors. Adjusted EBITDA $ 16 $ 16(1)%
While Adjusted EBITDA is useful Adjusted EBITDA margin 30.1% 29.5%(0.6) pts
for analysis purposes, it should
not be considered as an Corporate
alternative to our reported GAAP Adjusted EBITDA $ (10) $(15)
results. Also, Adjusted EBITDA Total
may not be comparable to Revenue:
similarly titled measures used by Software $ 251 $ 252 0%
other companies. Adjusted SaaS and Cloud 268 277 4%
Professional and Business Processing Services 134 142 5%
EBITDA is similar, but not Total Revenue $ 653 $ 671 3%
identical, to adjusted EBITDA per Adjusted EBITDA $ 145 $ 175 21%
the Senior Secured Credit Adjusted EBITDA margin 22.2% 26.1% 3.9 pts
Agreement for purposes of our
debt covenants. pts = margin points
All amounts in USD millions
9
|
|
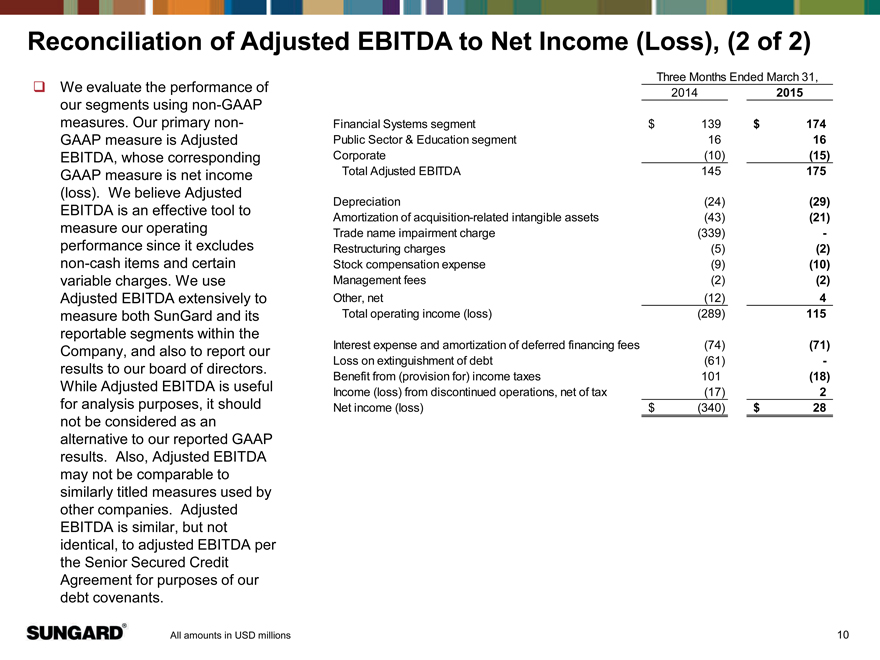
Reconciliation of Adjusted EBITDA to Net Income (Loss), (2 of 2)
Three Months Ended March 31,
We evaluate the performance of 2014 2015 our segments using non-GAAP
measures. Our primary non- Financial Systems segment $ 139 $ 174 GAAP measure is Adjusted Public Sector & Education segment 16 16
EBITDA, whose corresponding Corporate (10) (15)
GAAP measure is net income Total Adjusted EBITDA 145 175
(loss). We believe Adjusted
Depreciation (24) (29)
EBITDA is an effective tool to
Amortization of acquisition-related intangible assets (43) (21) measure our operating Trade name impairment charge (339) -
performance since it excludes Restructuring charges (5) (2)
non-cash items and certain Stock compensation expense (9) (10)
variable charges. We use Management fees (2) (2) Adjusted EBITDA extensively to Other, net (12) 4
measure both SunGard and its Total operating income (loss) (289) 115
reportable segments within the
Company, and also to report our Interest expense and amortization of deferred financing fees (74) (71) Loss on extinguishment of debt (61) -
results to our board of directors.
Benefit from (provision for) income taxes 101 (18) While Adjusted EBITDA is useful Income (loss) from discontinued operations, net of tax (17) 2 for analysis purposes, it should Net income (loss) $ (340) $ 28
not be considered as an alternative to our reported GAAP results. Also, Adjusted EBITDA may not be comparable to similarly titled measures used by other companies. Adjusted EBITDA is similar, but not identical, to adjusted EBITDA per the Senior Secured Credit Agreement for purposes of our debt covenants.
All amounts in USD millions
10
|
|
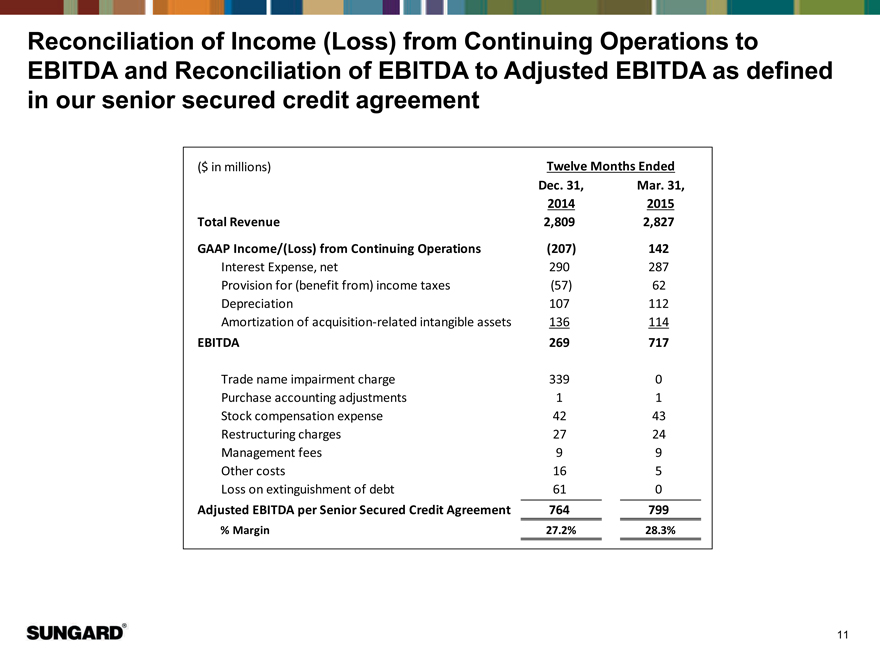
Reconciliation of Income (Loss) from Continuing Operations to EBITDA and Reconciliation of EBITDA to Adjusted EBITDA as defined in our senior secured credit agreement
($ in millions) Twelve Months Ended Dec. 31, Mar. 31, 2014 2015 Total Revenue 2,809 2,827 GAAP Income/(Loss) from Continuing Operations (207) 142
Interest Expense, net 290 287 Provision for (benefit from) income taxes (57) 62 Depreciation 107 112 Amortization of acquisition-related intangible assets 136 114
EBITDA 269 717
Trade name impairment charge 339 0 Purchase accounting adjustments 1 1 Stock compensation expense 42 43 Restructuring charges 27 24 Management fees 9 9 Other costs 16 5 Loss on extinguishment of debt 61 0
Adjusted EBITDA per Senior Secured Credit Agreement 764 799
% Margin 27.2% 28.3%
11