Attached files
| file | filename |
|---|---|
| EX-99.1 - EXHIBIT 99.1 - STONERIDGE INC | v409861_ex99-1.htm |
| 8-K - FORM 8-K - STONERIDGE INC | v409861_8k.htm |

1Q15 Earnings Release May 7, 2015 TECHNOLOGIES IN MOTION Exhibit 99.2

Forward Looking Statements Statements in this presentation that are not historical facts are forward - looking statements, which involve risks and uncertainties that could cause actual events or results to differ materially from those expressed or implied by the statements. Important factors that may cause actual re sul ts to differ materially from those in the forward - looking statements include, among other factors, the loss or bankruptcy of a major customer; the costs and timing of facility closures, business realignment or similar actions; a significant change in medium - and heavy - duty truck, automotive or agricultural and off - highway vehicle production; our ability to achieve cost reductions that offset or exceed customer - mandated selling price reductions; a significant change in general econom ic conditions in any of the various countries in which Stoneridge operates; labor disruptions at Stoneridge’s facilities or at any of Stoneridge’s signif ica nt customers or suppliers; the ability of suppliers to supply Stoneridge with parts and components at competitive prices on a timely basis; the amount of Stoneridge ’s indebtedness and the restrictive covenants contained in the agreements governing its indebtedness, including its asset - based credit facility and senior secured n otes; customer acceptance of new products; capital availability or costs, including changes in interest rates or market perceptions; the failure to achiev e s uccessful integration of any acquired company or business; the occurrence or non - occurrence of circumstances beyond Stoneridge’s control; and the items described in “ Risk Factors” and other uncertainties or risks discussed in Stoneridge’s periodic and current reports filed with the Securities and Exchange Commissi on. Important factors that could cause the performance of the commercial vehicle and automotive industry to differ materially fro m t hose in the forward - looking statements include factors such as (1) continued economic instability or poor economic conditions in the United States and gl oba l markets, (2) changes in economic conditions, housing prices, foreign currency exchange rates, commodity prices, including shortages of and increases or volatility in the price of oil, (3) changes in laws and regulations, (4) the state of the credit markets, (5) political stability, (6) international conflicts an d ( 7) the occurrence of force majeure events. These factors should not be construed as exhaustive and should be considered with the other cautionary statements in Stonerid ge’ s filings with the Securities and Exchange Commission. Forward - looking statements are not guarantees of future performance; Stoneridge’s actual results of operations, financial condit ion and liquidity, and the development of the industry in which Stoneridge operates may differ materially from those described in or suggested by the fo rwa rd - looking statements contained in this presentation. In addition, even if Stoneridge’s results of operations, financial condition and liquidity, a nd the development of the industry in which Stoneridge operates are consistent with the forward - looking statements contained in this presentation, those results or de velopments may not be indicative of results or developments in subsequent periods. This presentation contains time - sensitive information that reflects management’s best analysis only as of the date of this prese ntation. Any forward - looking statements in this presentation speak only as of the date of this presentation, and Stoneridge undertakes no obligation to up dat e such statements. Comparisons of results for current and any prior periods are not intended to express any future trends or indications of future performan ce, unless expressed as such, and should only be viewed as historical data. Stoneridge does not undertake any obligation to publicly update or revise any forward - looking statement as a result of new infor mation, future events or otherwise, except as otherwise required by law. Rounding Disclosure : There may be slight non - material differences between figures represented in our public filings compared to what is shown in t his presentation. The differences are the a result of rounding due to the representation of values in millions rather than thous and s in public filings.

Sales by Segment – 1Q15 vs 1Q14 CD ELEC PST SRI CD ELEC PST SRI Pass Car / Light Truck 64.7 0.4 0.0 65.1 61.7 0.9 0.0 62.6 Med / HD Truck 6.8 53.7 0.0 60.5 7.1 47.9 0.0 55.0 Ag 4.7 0.0 0.0 4.7 4.7 0.0 0.0 4.7 PST / Other 3.7 2.3 26.5 32.5 3.8 1.3 33.9 39.0 TOTAL 79.9 56.4 26.5 162.8 77.3 50.1 33.9 161.3 CD ELEC PST SRI CD ELEC PST SRI Pass Car / Light Truck 3.0 (0.5) 0.0 2.5 4.9% (55.6)% 0.0% 4.0% Med / HD Truck (0.3) 5.8 0.0 5.5 (4.2)% 12.1% 0.0% 10.0% Ag 0.0 (0.0) 0.0 (0.0) 0.0% (100.0)% 0.0% (0.1)% PST / Other (0.1) 1.0 (7.4) (6.5) (2.6)% 76.9% (21.8)% (16.7)% TOTAL 2.6 6.3 (7.4) 1.5 3.4% 12.6% (21.8)% 0.9% 1Q15 1Q14 Variance $ Variance % 1Q15 vs 1Q14 1Q15 vs 1Q14

Adjusted Electronics Segment Sales – 1Q15 vs 1Q14
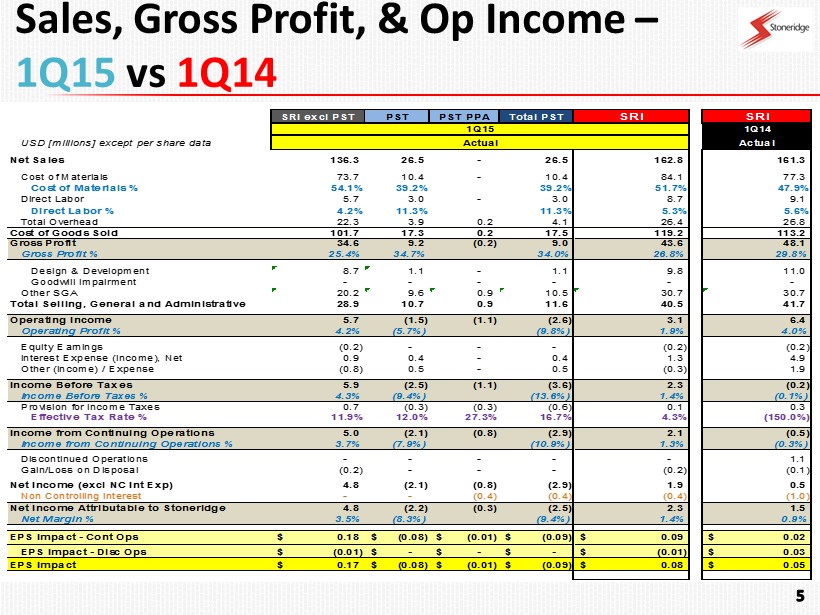
Sales, Gross Profit, & Op Income – 1Q15 vs 1Q14 SRI excl PST PST PST PPA Total PST SRI SRI 1Q15 1Q14 USD [millions] except per share data Actual Actual Net Sales 136.3 26.5 - 26.5 162.8 161.3 Cost of Materials 73.7 10.4 - 10.4 84.1 77.3 Cost of Materials % 54.1% 39.2% 39.2% 51.7% 47.9% Direct Labor 5.7 3.0 - 3.0 8.7 9.1 Direct Labor % 4.2% 11.3% 11.3% 5.3% 5.6% Total Overhead 22.3 3.9 0.2 4.1 26.4 26.8 Cost of Goods Sold 101.7 17.3 0.2 17.5 119.2 113.2 Gross Profit 34.6 9.2 (0.2) 9.0 43.6 48.1 Gross Profit % 25.4% 34.7% 34.0% 26.8% 29.8% Design & Development 8.7 1.1 - 1.1 9.8 11.0 Goodwill Impairment - - - - - - Other SGA 20.2 9.6 0.9 10.5 30.7 30.7 Total Selling, General and Administrative 28.9 10.7 0.9 11.6 40.5 41.7 Operating Income 5.7 (1.5) (1.1) (2.6) 3.1 6.4 Operating Profit % 4.2% (5.7%) (9.8%) 1.9% 4.0% Equity Earnings (0.2) - - - (0.2) (0.2) Interest Expense (Income), Net 0.9 0.4 - 0.4 1.3 4.9 Other (Income) / Expense (0.8) 0.5 - 0.5 (0.3) 1.9 Income Before Taxes 5.9 (2.5) (1.1) (3.6) 2.3 (0.2) Income Before Taxes % 4.3% (9.4%) (13.6%) 1.4% (0.1%) Provision for Income Taxes 0.7 (0.3) (0.3) (0.6) 0.1 0.3 Effective Tax Rate % 11.9% 12.0% 27.3% 16.7% 4.3% (150.0%) Income from Continuing Operations 5.0 (2.1) (0.8) (2.9) 2.1 (0.5) Income from Continuing Operations % 3.7% (7.9%) (10.9%) 1.3% (0.3%) Discontinued Operations - - - - - 1.1 Gain/Loss on Disposal (0.2) - - - (0.2) (0.1) Net Income (excl NC Int Exp) 4.8 (2.1) (0.8) (2.9) 1.9 0.5 Non Controlling Interest - - (0.4) (0.4) (0.4) (1.0) Net Income Attributable to Stoneridge 4.8 (2.2) (0.3) (2.5) 2.3 1.5 Net Margin % 3.5% (8.3%) (9.4%) 1.4% 0.9% EPS Impact - Cont Ops 0.18$ (0.08)$ (0.01)$ (0.09)$ 0.09$ 0.02$ EPS Impact - Disc Ops (0.01)$ -$ -$ -$ (0.01)$ 0.03$ EPS Impact 0.17$ (0.08)$ (0.01)$ (0.09)$ 0.08$ 0.05$
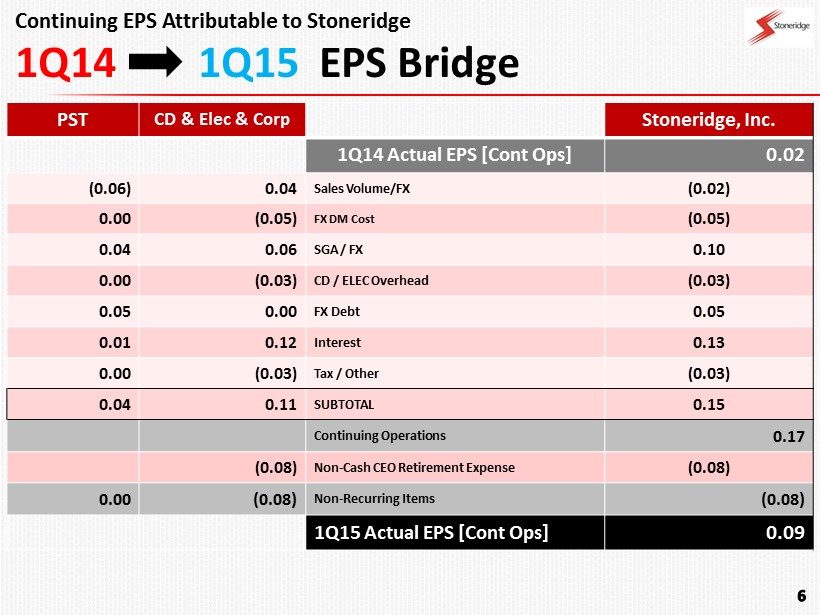
PST CD & Elec & Corp Stoneridge, Inc. 1Q14 Actual EPS [ Cont Ops] 0.02 (0.06) 0.04 Sales Volume/FX (0.02) 0.00 (0.05) FX DM Cost (0.05) 0.04 0.06 SGA / FX 0.10 0.00 (0.03) CD / ELEC Overhead (0.03) 0.05 0.00 FX Debt 0.05 0.01 0.12 Interest 0.13 0.00 (0.03) Tax / Other (0.03) 0.04 0.11 SUBTOTAL 0.15 Continuing Operations 0.17 (0.08) Non - Cash CEO Retirement Expense (0.08) 0.00 (0.08) Non - Recurring Items (0.08) 1Q15 Actual EPS [ Cont Ops] 0.09 Continuing EPS Attributable to Stoneridge 1Q14 1Q15 EPS Bridge
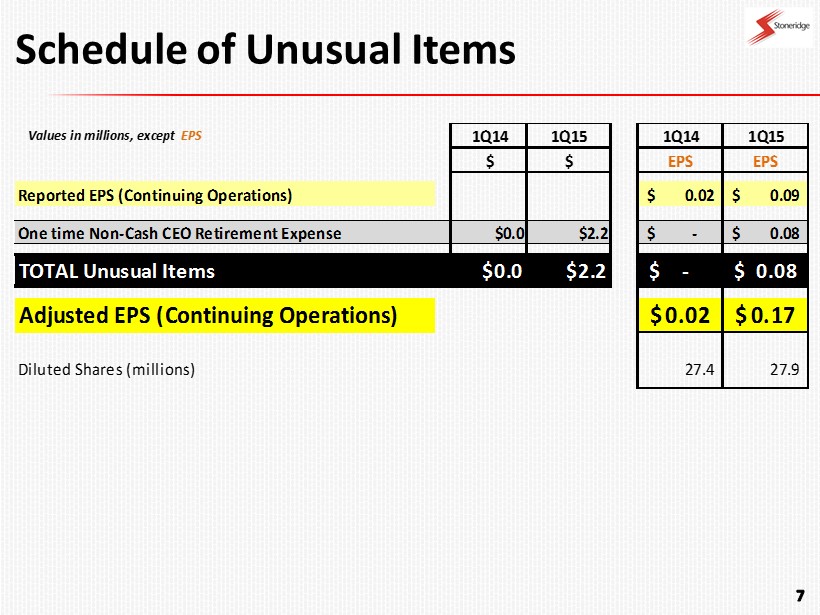
Schedule of Unusual Items Values in millions, except EPS 1Q14 1Q15 1Q14 1Q15 $ $ EPS EPS Reported EPS (Continuing Operations) 0.02$ 0.09$ One time Non-Cash CEO Retirement Expense $0.0 $2.2 -$ 0.08$ TOTAL Unusual Items $0.0 $2.2 -$ 0.08$ Adjusted EPS (Continuing Operations) 0.02$ 0.17$ Diluted Shares (millions) 27.4 27.9

40% 37% 16% 7% PassCar Lt Truck Comm'l Vehicle PST Ag / Other 55% 16% 29% North America South America Europe / Asia 49% 35% 16% Control Devices Electronics PST 1Q15 Sales $162.8 M NOTE: D oes not include revenue from India JV 1Q15 Sales: Market, Region, Segment Sales from Continuing Operations SERVED MARKETS REGIONS BUSINESS SEGMENTS

Strong New Business Awards 2015 2016 2017 2018 2019 13 - 17% % Range 65 - 69% 6 - 10% 0 - 3% 7 - 11% Expect approximately $106M in Net New Business in 2016 - 2017 Expect $130M in Net New Business [2015 – 2019] $ millions, excl Wiring 2011 2012 2013 2014 Sales $440 $612 $659 $661 D&D $29 $39 $40 $42 D&D % 7% 6% 6% 6% Cap Ex $17 $23 $22 $24 Cap Ex % 4% 4% 3% 4% Total Exp $46 $62 $62 $66 Total Exp % 10% 10% 9% 10% Net New Business Product Life Cycle Growth Continues to be Robust Efforts in R&D, Design, & Marketing will fill in 2017 to 2019 Sales Significant Increases in 2015 / 2016 are Main Focus for Net New Business in Current Projection Exchange Rates having negative impacts in Europe

PST CD & Elec & Corp Stoneridge, Inc. 4Q14 Actual EPS [ Cont Ops] (0.92) (0.07) 0.05 Sales Volume/FX (0.02) 0.01 (0.04) Mix / Direct Material (0.03) 0.03 (0.04) SGA / DD / DL Increase / Decrease (0.01) 0.01 0.04 Overhead / FX Translation 0.05 (0.01) 0.00 FX/ Div /Debt MTM (0.01) 0.00 (0.04) Tax / Other (0.04) 0.00 0.02 Int. Expense 0.02 (0.03) (0.01) SUBTOTAL (0.04) Continuing Operations (0.96) 0.78 PST Goodwill Impairment 0.78 0.35 Bond Extinguishment Loss 0.35 (0.08) Non - Cash CEO Retirement Expense (0.08) 0.78 0.27 Non - Recurring Items 1.05 1Q15 Actual EPS [ Cont Ops] 0.09 Continuing EPS Attributable to Stoneridge 4Q14 1Q15 EPS Bridge

Sales by Segment – 1Q15 vs 4Q14 CD ELEC PST SRI CD ELEC PST SRI Pass Car / Light Truck 64.7 0.4 0.0 65.1 59.4 0.3 0.0 59.7 Med / HD Truck 6.8 53.7 0.0 60.5 8.0 52.9 0.0 60.9 Ag 4.7 0.0 0.0 4.7 4.0 0.0 0.0 4.0 PST / Other 3.7 2.3 26.5 32.5 3.2 3.1 35.9 42.2 TOTAL 79.9 56.4 26.5 162.8 74.6 56.3 35.9 166.8 CD ELEC PST SRI CD ELEC PST SRI Pass Car / Light Truck 5.3 0.1 0.0 5.4 8.9% 33.3% 0.0% 9.0% Med / HD Truck (1.2) 0.8 0.0 (0.4) (15.0)% 1.4% 0.0% (0.7)% Ag 0.7 0.0 0.0 0.7 17.5% 0.0% 0.0% 17.5% PST / Other 0.5 (0.8) (9.4) (9.7) 15.6% (25.8)% (26.2)% (23.0)% TOTAL 5.3 0.1 (9.4) (4.0) 7.1% 0.1% (26.2)% (2.4)% 1Q15 4Q14 Variance $ Variance % 1Q15 vs 4Q14 1Q15 vs 4Q14

PST Purchase Price Accounting Expense [Non Cash] (millions) 1Q 2Q 3Q 4Q Full Year 2013 1Q 2Q 3Q 4Q Full Year 2014 1Q15 COGS / Depreciation – Fixed Asset Write Up $0.3 $0.3 $0.3 $0.3 $1.2 $0.3 $0.3 $0.3 $0.2 $1.1 $0.2 SGA / Amortized Intangibles $1.6 $1.5 $1.0 $1.0 $5.1 $1.2 $1.2 $1.0 $0.8 $4.2 $0.9 TOTAL $1.9 $1.8 $1.3 $1.3 $6.3 $1.5 $1.5 $1.3 $1.0 $5.3 $1.1 1Q 2Q 3Q 4Q 2013 1Q 2Q 3Q 4Q 2014 1Q15 Impact on Op Margin (0.81)% (0.74)% (0.56)% (0.55)% (0.66)% (0.63)% (0.93)% (0.76)% (0.60)% (0.80)% (0.68)% Impact on Diluted EPS $(0.04) $(0.04) $(0.02) $(0.03) $(0.13) $(0.03) $(0.03) $(0.02) $(0.02) $(0.10) $(0.02)

Debt / Net Debt DEBT LEVERAGE 4.1x 2.8x 2.5x 2.4x 2012 2013 2014 1Q15 Debt Leverage: Continuing Operations excluding PST PPA LTM EBITDA = Op Income + Depreciation + Amortization + Non - Depreciation / Amortization Purchase Accounting 100 175 300 Previous Structure Current Structure CAPITAL STRUCTURE $275 $300 New Revolving Credit Agreement saves approximately $12 million in Interest 10 17 19 9 14 5 10 13 24 23 29 22 2012 2013 2014 1Q15 Gov't Incentive Debt Other Debt BRAZIL DEBT 157 134 87 100 201 197 130 123 2012 2013 2014 1Q15 Net Debt Total Debt NET DEBT / TOTAL DEBT Bonds ABL Revolving Credit Facility $ millions $ millions $ millions * * Adjusted to exclude Non - Cash Restricted Stock for CEO Retirement

Export 5.5% OEM/OES 19.0% Mass Merchandisers 18.7% Aftermarket 29.4% Track & Trace 27.4% 2015 E Growth 25 - 30% ▲ 8 - 10 % ▲ 20 - 30% ▲ 3 - 4% ▲ (3%) * ▼ PST Growth 10% to 15% In local currency % of PST Sales Volume Major Growth Drivers Track & Trace • Serves Retail and Corporate Accounts • Retail – Solutions for Protection and Safety of Families • Corporate – Transport and Fleet Market • Products • GSM Tracking 900MHz – anti Jamming Capabilities (only system in Brazil) • Vehicles, Driver and Cargo • Control and Safety of Vehicle • Cargo Tracking (50% of Growth in 2015) Aftermarket • Maintain Alarm Systems Market Leadership • Continue Launching New Technology • Growing with Regional Distribution • Position Strong Brand Name Mass Merchandisers • Have Redesigned Complete Audio Product Line - # 2 market position • Substantially Improved Cost Position With Design House from China • Lower Cost Makes PST Competitive at All Price Points Across the Product Line OEM / OES • Market will continue to be flat for 2015 • Used Car sales grew by 7% in 2014. Trend expected to continue * FX Impact PST Growth Opportunities
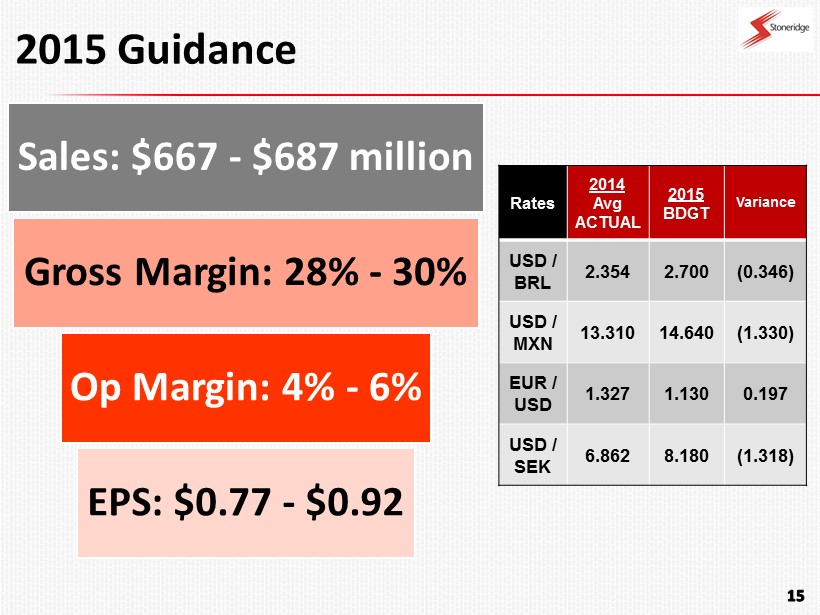
Sales: $667 - $687 million Gross Margin: 28% - 30% Op Margin: 4% - 6% EPS: $0.77 - $0.92 2015 Guidance Rates 2014 Avg ACTUAL 2015 BDGT Variance USD / BRL 2.354 2.700 (0.346) USD / MXN 13.310 14.640 (1.330) EUR / USD 1.327 1.130 0.197 USD / SEK 6.862 8.180 (1.318)