Attached files
| file | filename |
|---|---|
| 8-K - CURRENT REPORT - PNMAC Holdings, Inc. | pfsi_8k.htm |
| EX-99.1 - PRESS RELEASE - PNMAC Holdings, Inc. | pfsi_8k-ex9901.htm |
Exhibit 99.2

First Quarter 2015 Earnings Report

Forward - Looking Statements 2 This presentation contains forward - looking statements within the meaning of Section 21 E of the Securities Exchange Act of 1934 , as amended, regarding management’s beliefs, estimates, projections and assumptions with respect to, among other things, the Company’s financial results, future operations, business plans and investment strategies, as well as industry and market conditions, all of which are subject to change . Words like “believe,” “expect,” “anticipate,” “promise,” “plan,” and other expressions or words of similar meanings, as well as future or conditional verbs such as “will,” “would,” “should,” “could,” or “may” are generally intended to identify forward - looking statements . Actual results and operations for any future period may vary materially from those projected herein, from past results discussed herein, or from illustrative examples provided herein . Factors which could cause actual results to differ materially from historical results or those anticipated include, but are not limited to : changes in federal, state and local laws and regulations applicable to the highly regulated industry in which we operate ; lawsuits or governmental actions if we do not comply with the laws and regulations applicable to our businesses ; the creation of the Consumer Financial Protection Bureau, or CFPB, and enforcement of its rules ; changes in existing U . S . government - sponsored entities, their current roles or their guarantees or guidelines ; changes to government mortgage modification programs ; the licensing and operational requirements of states and other jurisdictions applicable to our businesses, to which our bank competitors are not subject ; foreclosure delays and changes in foreclosure practices ; certain banking regulations that may limit our business activities ; changes in macroeconomic and U . S . residential real estate market conditions ; difficulties in growing loan production volume ; changes in prevailing interest rates ; increases in loan delinquencies and defaults ; our reliance on PennyMac Mortgage Investment Trust as a significant source of financing for, and revenue related to, our correspondent lending business and purchased mortgage servicing rights ; availability of required additional capital and liquidity to support business growth ; our obligation to indemnify third - party purchasers or repurchase loans that we originate, acquire or assist in with fulfillment ; our obligation to indemnify advised entities or investment funds to meet certain criteria or characteristics or under other circumstances ; decreases in the historical returns on the assets that we select and manage for our clients, and our resulting management and incentive fees ; regulation applicable to our investment management segment ; conflicts of interest in allocating our services and investment opportunities among ourselves and our advised entities ; the potential damage to our reputation and adverse impact to our business resulting from ongoing negative publicity ; and our rapid growth . You should not place undue reliance on any forward - looking statement and should consider all of the uncertainties and risks described above, as well as those more fully discussed in reports and other documents filed by the Company with the Securities and Exchange Commission from time to time . The Company undertakes no obligation to publicly update or revise any forward - looking statements or any other information contained herein, and the statements made in this presentation are current as of the date of this presentation only .

First Quarter Highlights 3 ▪ Pretax income of $53.2 million; diluted earnings per common share of $0.42 – Segment pretax earnings: Production: $70.7 million; Servicing: $(18.5) million; Investment Management: $1.1 million – Servicing results negatively impacted by MSR value reduction due to higher prepayment speeds from lower interest rates and unanticipated change in FHA mortgage insurance premium (MIP), offset by higher production segment earnings driven by higher volume ▪ Loan production totaled $8.9 billion in UPB, up 12% from 4Q14, driven by a larger origination market and continued share gains in consumer direct originations – Correspondent production was $8.0 billion, up 10% from 4Q14; consumer direct originations were $897 million, up 31% from 4Q14 – Production revenue of $110.8 million, up 53% from 4Q14; increased contribution from consumer direct ▪ Servicing portfolio grew to $ 115.2 billion in UPB, up 9% from December 31, 2014 – Continued organic growth resulting from loan production, supplemented by mini - bulk and flow acquisitions of MSRs totaling $6.4 billion in UPB – Servicing revenue of $19.5 million, down 66% from 4Q14; reduction in MSR value net of hedge and excess servicing spread (ESS) performance totaled $22 million ▪ Net assets under management remained $2.0 billion – Revenue of $10.0 million, down 4% from 4Q14 as a result of lower incentive fees and carried interest

Activity After Quarter End 4 ▪ Completed the previously announced acquisition of $15 billion in UPB of Agency MSRs with associated ESS sold to PMT; servicing transfers in 2Q15 ▪ Entered into a letter of intent to acquire approximately $9 billion in UPB of Ginnie Mae MSRs; expect to close and transfer the portfolio and sell the associated excess servicing spread to PMT in early 3Q15 (1) ▪ Amended PFSI’s Ginnie Mae MSR facility to allow for pass - through financing of related ESS by PMT; facilitates continued co - investment by PMT in Ginnie Mae MSR acquisitions (1) The MSR acquisition by the Company and PMT’s purchase of excess servicing spread are subject to the negotiation and execution of definitive documentation, continuing due diligence and customary closing conditions, including required regulatory approvals. Th ere can be no assurance that the committed amounts will ultimately be acquired or that the transactions will be completed at all.

3.0% 3.5% 4.0% 4.5% 5.0% 140 150 160 170 180 Current Market Environment and Outlook 5 Average 30 - year fixed rate mortgage (1) ▪ Interest rates in 1Q15 reached their lowest levels since mid - 2013, driving higher refinancing volume – Industry forecasts now predict a $1.3 trillion mortgage origination market for 2015 ▪ FHA’s reduction in its annual mortgage insurance premium (MIP) has boosted refinance activity ▪ Home prices have been stagnant on a not - seasonally - adjusted basis since last summer – Housing values expected to increase, driven by underlying U.S. macroeconomic improvement and tight housing inventory in certain regions ▪ Recent regulatory actions against large non - bank mortgage companies underscore the importance of effective governance, compliance, and operating systems (1) Freddie Mac Primary Mortgage Market Survey. 3.68% as of 04/30/15 (2) Not seasonally adjusted; Index was 100 for January 2000 (3) Moody’s Analytics Case Shiller 20 - City Home Price Index (2) 3.87 % 3.69%

$105 $130 $141 $142 $140 $0 $30 $60 $90 $120 $150 1Q14 2Q14 3Q14 4Q14 1Q15 ▪ EPS increased to $ 0.42 per share driven by s trong contribution from production, partially offset by loss from servicing and lower investment management income ▪ Total net revenue decreased 1% Q/Q as growth from loan production was offset by lower revenues in loan servicing – Production revenue increased 53% Q/Q, driven by higher consumer direct and correspondent production volumes – Servicing revenue decreased 66% Q/Q due to reductions in MSR value – Investment management revenues decreased 4% Q/Q due to lower incentive fees Trends in PFSI Earnings and Revenue Composition Total Net Revenue ($ in millions) 6 Earnings per Share Ŷ Production Ŷ Servicing Ŷ Investment Management $0.38 $0.45 $0.49 $0.41 $0.42 $0.00 $0.15 $0.30 $0.45 $0.60 1Q14 2Q14 3Q14 4Q14 1Q15
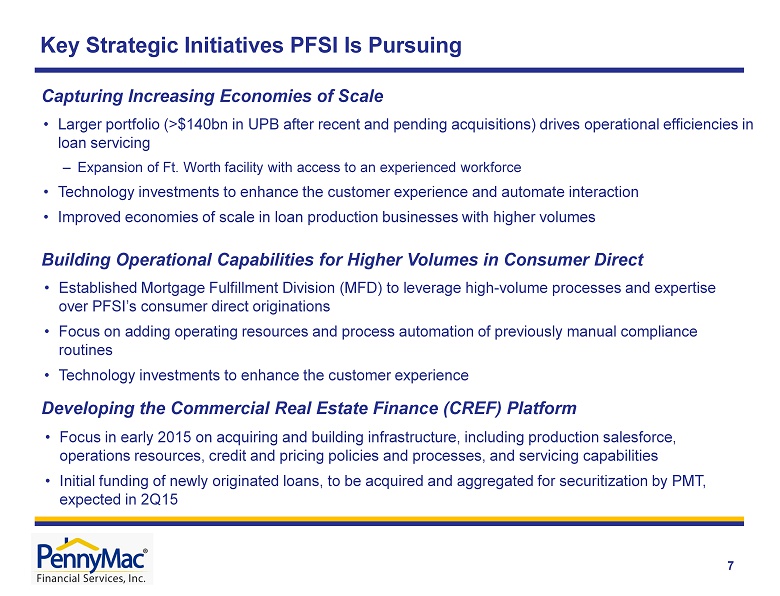
Key Strategic Initiatives PFSI Is Pursuing 7 Capturing Increasing Economies of Scale • Larger portfolio (>$140bn in UPB after recent and pending acquisitions) drives operational efficiencies in loan servicing – Expansion of Ft. Worth facility with access to an experienced workforce • Technology investments to enhance the customer experience and automate interaction • Improved economies of scale in loan production businesses with higher volumes Building Operational Capabilities for Higher Volumes in Consumer Direct Developing the Commercial Real Estate Finance (CREF) Platform • Established Mortgage Fulfillment Division (MFD) to leverage high - volume processes and expertise over PFSI’s consumer direct originations • Focus on adding operating resources and process automation of previously manual compliance routines • Technology investments to enhance the customer experience • Focus in early 2015 on acquiring and building infrastructure, including production salesforce, operations resources, credit and pricing policies and processes, and servicing capabilities • Initial funding of newly originated loans, to be acquired and aggregated for securitization by PMT, expected in 2Q15

7.83% 7.45% 0% 2% 4% 6% 8% 10% 1Q13 2Q13 3Q13 4Q13 1Q14 2Q14 3Q14 4Q14 1Q15 Trends in PennyMac Financial’s Businesses Correspondent Production (1) Market Share 0.35% 0.40% 0.00% 0.10% 0.20% 0.30% 0.40% 0.50% 0.60% 1Q13 2Q13 3Q13 4Q13 1Q14 2Q14 3Q14 4Q14 1Q15 Market Share Consumer Direct Production (1 ) $2.00 $1.96 $0.0 $0.5 $1.0 $1.5 $2.0 $2.5 1Q13 2Q13 3Q13 4Q13 1Q14 2Q14 3Q14 4Q14 1Q15 1.08% 1.17% 0.0% 0.2% 0.4% 0.6% 0.8% 1.0% 1.2% 1Q13 2Q13 3Q13 4Q13 1Q14 2Q14 3Q14 4Q14 1Q15 Loan Servicing (1) Market Share Investment Management AUM (billions) 8 (1) Source : Inside Mortgage Finance and company estimates. Inside Mortgage Finance estimates total 1Q15 origination market of $370 billion. Correspondent production share estimate is based on PFSI and PMT acquisition volume of $8.0 billion divided by $107 billion f or the correspondent market (estimated to be 29% of total origination market). Consumer direct production share is based on PFSI originations of $897 million divided by $225 billion for the retail market (estimated to be 61% of total origination market). Loan servicing mar ket share is based on PFSI’s servicing UPB of $115.2 billion divided by $9.83 trillion in mortgage debt outstanding as of December 31, 201 4.

9 $2.9 $4.0 $4.4 $4.4 $5.1 $1.9 $3.0 $3.7 $2.9 $2.9 $5.5 $8.1 $8.4 $7.5 $9.5 $0 $2 $4 $6 $8 $10 1Q14 2Q14 3Q14 4Q14 1Q15 (UPB in billions) Quarterly Highlights – Correspondent Production (1) For government - insured loans, PFSI earns gain on mortgage loans (2) For conventional loans, PFSI earns a fulfillment fee from PMT (3) Includes locks related to PMT loan acquisitions, for which PFSI earns a fulfillment fee upon loan funding Correspondent Volume and Mix Operational Highlights Ŷ Government - insured loans (1) Ŷ Fulfillment fees from PMT (2) Ŷ Total Locks (3) Strategic Initiatives ▪ Adding sales managers to continue growth of seller relationships, targeting 480 by year end ▪ Growing business from previously under - represented geographies, e.g., New England ▪ Building “development book” of typically smaller originators who can benefit from our operational and risk management expertise – Accounted for $1.5 billion of lock volume in 1Q15 compared to $80 million in 1Q14 ▪ Correspondent acquisitions by PMT in 1Q15 totaled $8.0 billion – 64% government - insured loans ; 36% conventional loans ▪ April correspondent acquisitions totaled $3.6 billion; locks totaled $4.6 billion ▪ Scalable model able to increase volumes while maintaining service levels, which benefits margins ▪ Initiated new program with a large bank to acquire and securitize their Ginnie Mae eligible loans 1Q15 4Q14 Correspondent seller relationships 356 344 Purchase money loans, as a % of total 60% 76% acquisitions Government-insured Conventional Selected Operational Metrics Selected Credit Metrics for 1Q15 WA FICO 695 748

(UPB in millions ) ▪ Consumer direct production totaled $897 million in 1Q15, up 31% from 4Q14 – Government - insured and guaranteed loans continue to drive growth ▪ April consumer direct production totaled $ 330 million ; locks totaled $638 million ▪ Recent and pending MSR acquisitions anticipated to drive additional recapture opportunities Quarterly Highlights – Consumer Direct Production Consumer Direct Production Volume Operational Highlights Strategic Initiatives Ŷ Portfolio - sourced fundings Ŷ Non - portfolio fundings Ŷ Committed pipeline (1) (1) C ommitments to purchase or originate mortgage loans at specified terms at 3/31/15 (2 ) Includes conforming and jumbo loan originations . ▪ Building capacity and infrastructure to address larger volumes (MFD) ▪ Growing leads generated through servicing call center ▪ Technology investments for long - term growth – Enhancing customer experience through new PennyMacUSA.com portal – Automation and readiness for new rules ( TRID) ▪ Continued focus on non - portfolio strategies; growth in affinity partnerships and volumes 10 $314 $403 $527 $682 $897 $232 $308 $370 $585 $713 $0 $200 $400 $600 $800 $1,000 1Q14 2Q14 3Q14 4Q14 1Q15 WA FICO Government-insured 699 Conventional (1) 749 Selected Credit Metrics for 1Q15

$106.0 $115.2 At 12/31/14 Runoff Additions from loan production MSR acquisitions At 3/31/15 (UPB in billions ) ▪ Servicing portfolio totaled $115.2 billion in UPB at quarter end, up 9% from 4Q14 ▪ Mini - bulk and flow MSR acquisitions totaled $6.4 billion in UPB during 1Q15 – Excess servicing spread (ESS) investments by PMT in 1Q15 totaled $46 million ▪ Recent and pending bulk MSR acquisitions continue to add to servicing platform’s scale (1) – Reviewed 55 new deals, bid on 10, won 3 in 1Q15 Quarterly Highlights – Loan Servicing Loan Servicing Portfolio Composition Operational Highlights Strategic Initiatives Ŷ Prime owned Ŷ Prime subserviced Ŷ Special Net Portfolio Growth ($6.1) $8.9 $6.4 (UPB in billions ) (2) $83.8 $93.6 $100.1 $ 106.0 $115.2 $0 $20 $40 $60 $80 $100 $120 1Q14 2Q14 3Q14 4Q14 1Q15 ▪ Continue to expand the operating platform – Full - scale operations in both Moorpark, CA and Fort Worth, TX – Access to high - quality labor pools for future growth ▪ Technology enhancements for greater self - service capabilities – Increased interaction via IVR and new website 11 (1) The pending MSR acquisition by the Company and PMT’s purchase of excess servicing spread are subject to the negotiation and execution of definitive documentation, continuing due diligence and customary closing conditions, including required regulatory approva ls. There can be no assurance that the committed amounts will ultimately be acquired or that the transaction will be completed at all . (2) Includes consumer direct originations, government correspondent acquisitions, and conventional conforming and jumbo loan acqu isi tions subserviced for PMT.

Recent and New Investments in Agency MSRs 12 ▪ New pending acquisition similar to previous acquisitions of high - quality, seasoned Ginnie Mae MSRs – Loans with above - market average note rates – low mortgage rate environment results in refinance recapture opportunities – Relatively low delinquency rates reduce exposure to credit losses on claims to government agencies ▪ Co - investment by PMT in the excess servicing spread cash flows (1) The MSR acquisition by the Company and the PMTs purchase of excess servicing spread is subject to the negotiation and execution of definitive documentation, continuing due diligence and customary closing conditions, including required regulatory approvals. There can be no assurance that the committed amount will ultimately be acquired or that the transactions will be completed at all. Unpaid Principal Balance $14.9 billion Unpaid Principal Balance $9.3 billion Weighted Avg. Note Rate 3.87% Weighted Avg. Note Rate 4.73% Delinquent Loans 2.87% Delinquent Loans 5.65% Weighted Avg. Time Since Origination 24 months Weighted Avg. Time Since Origination 57 months Total Servicing Fee 34.9 bp Total Servicing Fee 35.4 bp Base Servicing Fee 17.0 bp Base Servicing Fee 12.5 bp PFSI Investment in Base MSR $61.8 million PFSI Investment in Base MSR $22.4 million Recently Completed Acquisition ─ Previously Announced New Pending Acquisition (1)

$12.5 $12.8 $13.3 $10.4 $10.0 $0 $3 $6 $9 $12 $15 1Q14 2Q14 3Q14 4Q14 1Q15 Carried interest & incentive fees Base management fees & other revenue 13 ($ in millions) ▪ Net assets under management remained $2.0 billion at March 31, 2015 ▪ Several new initiatives that enable long - term growth for PMT – FHLB membership – Financing facilities for ESS and MSRs – Unique credit risk transfer structure with Fannie Mae Quarterly Highlights – Investment Management Investment Management Revenues Operational Highlights Strategic Initiatives ▪ Opportunities to grow PMT over time and manage additional capital for mortgage - related investments: – Distressed whole loans – MSRs resulting from correspondent acquisitions – Excess servicing spread on MSRs – Investments in prime non - Agency loans – Agency and non - Agency MBS – GSE risk transfers on PMT’s production – CRE loans and securitization interests ▪ Investment management revenues were $10.0 million, down 4% from 4Q14 – Carried interest from the Investment Funds increased to $1.2 million from $0.3 million in 4Q14 – Incentive fees declined 49% Q/Q, due to PMT’s reduced financial performance in 1Q15

1Q14 26.0$ 17.1$ 6.0$ 49.1$ 2Q14 32.8$ 20.0$ 5.3$ 58.0$ 3Q14 39.1$ 17.4$ 6.2$ 62.7$ 4Q14 37.8$ 11.4$ 2.6$ 51.9$ 1Q15 70.7$ (18.5)$ 1.1$ 53.2$ ($ in millions) Production Servicing Investment Management Total Pretax Income Financial Results by Operating Segment 14

Net gains on mortgage loans held for sale at fair value 76,979$ 44,811$ Loan origination fees 16,682 12,528 Fulfillment fees from PennyMac Mortgage Investment Trust 12,866 11,887 Net interest income 3,375 2,820 Other 913 386 110,815 72,432 40,132 34,607 Pretax Income 70,683$ 37,825$ Net gains on mortgage loans 76,979$ 44,811$ As % of IRLCs 0.99% 0.76% Loan origination fees 16,682$ 12,528$ As % of PFSI fundings 0.28% 0.25% Fulfillment fees from PMT 12,866$ 11,887$ Average fulfillment fee 45 bps 41 bps Expenses Production Segment Unaudited ($ in thousands) Revenue Production Segment Metrics Unaudited ($ in thousands) Quarter ended March 31, 2015 Quarter ended December 31, 2014 Quarter ended March 31, 2015 Quarter ended December 31 , 2014 15 Mortgage Banking – Production Segment Results ( 1 ) Fulfillment fees paid by PMT divided by unpaid principal balance of loans fulfilled for PMT during the quarter (2) Includes revenues from net gains on mortgage loans held for sale, loan origination fees and net interest income; adjusted for 43% expected fallout of consumer direct lock commitments (1) ▪ Significant increase in net gains on mortgage loans held for sale, loan origination fees and net interest income, driven by higher volumes ▪ Fulfillment fee revenue increased 8% Q/Q due to a higher weighted average rate in 1Q15 ▪ Strong contribution from the consumer direct channel – Gain related to consumer direct locks was approximately 314 bps in 1Q15 (2)

Revenue Net loan servicing fees 26,776$ 62,278$ Net interest expense (6,271) (4,812) Net gains on mortgage loans held for sale at fair value (1,601) (162) Other 618 261 19,522 57,565 Expenses 38,067 46,143 Pretax (loss) income (18,545)$ 11,422$ Servicing Segment Unaudited ($ in thousands) Quarter ended March 31 , 2015 Quarter ended December 31 , 2014 Unaudited ($ in thousands) Net loan servicing fees: Loan servicing fees (1) 72,924$ 69,901$ Effect of MSRs: Amortization and realization of cash flows (24,101) (21,690) Change in fair value and provision for impairment of MSRs carried at lower of amortized cost or fair value (46,701) (8,755) Change in fair value of excess servicing spread financing 7,536 4,271 Hedging gains (losses) 17,121 18,551 Total amortization, impairment and change in fair value of MSRs (46,148) (7,623) Net loan servicing fees 26,776$ 62,278$ Net Loan Servicing Fees Quarter ended March 31 , 2015 Quarter ended December 31 , 2014 Mortgage Banking – Servicing Segment Results (1) Includes contractually - specified servicing fees 16 ▪ Net servicing fee revenue declined 57% Q/Q ▪ Change in net servicing fees driven by lower mortgage rates during 1Q15 and the FHA’s unanticipated MIP reduction ▪ Change in fair value and provision for impairment of MSRs totaled $46.7 million, partially offset by $17.1 million of hedge gains and $7.5 million benefit from fair value reduction in ESS

Mortgage Servicing Rights (MSR) Asset Valuation 17 ▪ PFSI carries most of its originated MSRs at the lower of amortized cost or fair value (“LOCOM”) – MSRs where the note rate on the underlying loan is equal to or less than 4.5 % ▪ Purchased MSRs subject to ESS are carried at fair value and the ESS is also carried at fair value ▪ The fair value of MSRs carried at LOCOM was $8.8 million in excess of the carrying value at March 31, 2015 Note: Figures may not sum exactly due to rounding UPB $36,247 $2,596 $33,142 Weighted average coupon 3.81% 4.68% 4.11% Prepayment speed assumption (CPR) 9.4% 14.4% 11.6% Weighted average servicing fee rate 0.30% 0.30% 0.30% Fair value of MSR $437.8 $25.5 $335.9 As a multiple of servicing fee 4.01 3.36 3.36 Carrying value of MSR $429.0 $25.5 $335.9 Related excess servicing spread liability - - $222.3 March 31, 2015 Unaudited ($ in millions) Lower of amortized cost or fair value Fair value not subject to excess servicing spread Fair value subject to excess servicing spread

Management fees: From PennyMac Mortgage Investment Trust 7,003$ 8,426$ From Investment Funds 1,486 1,596 8,489 10,022 Carried Interest from Investment Funds 1,233 263 Other 255 65 9,977 10,350 8,877 7,742 Pretax income 1,100$ 2,608$ Expenses Unaudited – (in thousands) Revenue Quarter ended March 31 , 2015 Quarter ended December 31 , 2014 Investment Management Segment Results 18 ▪ Segment revenue decreased 4% Q/Q to $10.0 million ▪ Segment expense increased 15% Q/Q due to an increase in corporate overhead allocation

Appendix

PennyMac Financial’s Business Model Is Well Positioned for Growth • Complex and highly regulated mortgage industry requires effective governance, compliance, and operating systems • PFSI’s platform has been developed organically and is highly scalable • Commitment to strong corporate governance, compliance, and risk management since inception • PFSI is well positioned for continued growth in this market and regulatory environment Loan Production Loan Servicing Investment Management • Servicing for owned MSRs and subservicing for Advised Entities • Major loan servicer for Fannie Mae, Freddie Mac and Ginnie Mae • Industry - leading capabilities in special servicing • Organic growth results from loan production, supplemented by MSR acquisitions and PMT investment activity • Serve as external manager for investment vehicles focused on investing in mortgage - related assets: – Distressed whole loans – MSRs and ESS – Investments in prime non - Agency loans – MBS and ABS – GSE risk transfers – Commercial real estate loans and securitization interests • Synergistic partnership with PMT • Correspondent aggregation of newly originated loans from third - party sellers – PFSI earns gains on government - insured loans – Fulfillment fees for PMT’s conventional and jumbo loans • Consumer - direct origination of conventional, government - insured and jumb o loans • Newly launched commercial mortgage origination business 20

PFSI Has Developed in a Sustainable Manner for Long - Term Growth 72 128 230 435 1,008 1, 373 1,816 2,047 (1) • Operations launched • De novo build of legacy - free mortgage servicer 2008 E mployees at year end 21 2009 2010 2011 2012 2013 2014 2015 • Correspondent group established with a focus on operations development and process design • Added servicing leadership for prime portfolio and to drive scalable growth • Correspondent system launches • Expanded infrastructure with flagship operations facility in Moorpark, CA • Correspondent leadership team expands • Expanded infrastructure in Tampa, FL • Became largest non - bank correspondent aggregator • PFSI completed initial public offering • Expanded infrastructure in Fort Worth, TX • Continued organic growth • Servicing UPB reaches $100 bn • Launched Commercial Real Estate Finance (PCREF) • Disciplined growth to address the demands of the GSEs, Agencies, regulators and our financing partners - Since inception, PennyMac has focused on building and testing processes and systems before adding significant transaction volumes • Highly experienced management team has created a robust corporate governance system centered on compliance, risk management and quality control (1) As of March 31, 2015

• Over 2,000 employees • Highly experienced management team – 60 senior - most executives have on average 23 years of relevant industry experience Strong governance and compliance culture • Led by distinguished board which includes seven independent Directors • Robust management governance structure with 10 committees that oversee key risks and controls • External oversight by regulators, business partners and other third parties Desired structure in place to compete effectively as a non - bank • Synergistic partnership with PMT, a leading residential mortgage REIT and long - term investment vehicle • Provides access to efficient capital and reduces balance sheet constraints on growth

Opportunity for PFSI and PMT in MSR Acquisitions 23 Why Are MSR Sales Occurring? How Do MSRs Come to Market? • Large servicers are selling MSRs due to continuing operational pressures, higher regulatory capital requirements for banks (treatment under Basel III) and a re - focus on core customers/businesses • Independent mortgage banks are selling MSRs due to reduced origination volumes, operational losses, and a need for capital • Intermittent large bulk portfolio sales ($10+ billion in UPB) – Require considerable coordination with selling institutions and Agencies • Mini - bulk sales (typically $500 million to $5 billion in UPB) – Increased activity as originators sell MSRs retained in 2012 and 2013 • Flow/co - issue MSR transactions (monthly commitments, typically $20 - 100 million in UPB) – Alternative delivery method typically from larger independent originators Which MSR Transactions Are Attractive? • GSE and Ginnie Mae servicing in which PFSI has distinctive expertise • MSRs sold and operational servicing transferred to PFSI (not subserviced by a third party) • Measurable rep and warranty liability for PFSI PFSI is uniquely positioned to be a successful acquirer of MSRs • Proven track record of complex MSR and distressed loan transfers • Operational platform that addresses the demands of the Agencies, regulators, and financing partners • Physical capacity in place to service $200 billion in UPB • Co - investment opportunity for PMT in the excess servicing spread

24 PFSI’s Mortgage Servicing Rights Investments in Partnership with PMT Excess Servicing Spread (e.g., 12.5bp) MSR Asset (e.g., 25bp servicing fee) Acquired by PFSI from Third - Party Seller (1) ▪ PMT co - invests in Agency MSRs acquired from third - party sellers by PFSI ▪ PMT acquires the right to receive the excess servicing spread cash flows over the life of the underlying loans ▪ PFSI owns the MSRs, and services the loans (1) The contractual servicer and MSR owner is PennyMac Loan Services, LLC, an indirect subsidiary of PennyMac Financial Services, Inc. (2) Subject and subordinate to Agency rights (under the related servicer or issuer guide ) and, as applicable, to PFSI’s pledge of MSRs under a note payable; does not change the contractual servicing fee paid by the Agency to the servicer. Excess Servicing Spread (2) ▪ Interest income from a portion of the contractual servicing fee – Realized yield dependent on prepayment speeds and recapture Base MSR ▪ Income from a portion of the contractual servicing fee ▪ Also entitled to ancillary income ▪ Bears expenses of performing loan servicing activities ▪ Required to advance certain payments largely for delinquent loans Base MSR (e.g., 12.5bp) Acquired by PMT from PFSI (1) Example transaction: actual transaction details may vary materially
