Attached files
| file | filename |
|---|---|
| 8-K - FORM 8-K - LOJACK CORP | a8-kq1earningsrelease2015.htm |
| EX-99.1 - EXHIBIT 99.1 EARNINGS RELEASE - LOJACK CORP | q1earningsrelease2015.htm |
1 © 2015 LoJack Corporation. All Rights Reserved. LoJack and the LoJack logo are trademarks or registered trademarks of the LoJack Corporation in the United States and other countries. LoJack Corporation Q1 2015 Results May 7, 2015
2 Forward-looking Statements Statements in this presentation that are not statements of historical fact are forward-looking statements. Such forward- looking statements, which include statements regarding the Company’s strategic plans and initiatives, markets and future financial performance, are based on a number of assumptions and involve a number of risks and uncertainties, and accordingly, actual results could differ materially. Factors that may cause such differences include, but are not limited to: (1) the continued and future acceptance of the Company's products and services, including the Company's Pre-Install Program and inventory management, fleet management and telematics solutions; (2) the Company's ability to obtain financing from lenders and to satisfy or obtain waivers for covenant requirements under its credit facility; (3) the outcome of ongoing litigation involving the Company; (4) the Company’s ability to enforce the terms of the settlement agreement with Tracker do Brasil LTDA and its impact on the Company's future relationships with Tracker and its affiliates; (5) the rate of growth in the industries of the Company's customers; (6) the presence of competitors with greater technical, marketing, and financial resources; (7) the Company's customers' ability to access the credit markets, including changes in interest rates; (8) the Company's ability to promptly and effectively respond to technological change to meet evolving customer needs; (9) the Company's ability to successfully expand its operations, including through the introduction of new products and services; (10) changes in general economic or geopolitical conditions; (11) conditions in the automotive retail market and the Company's relationships with dealers, licensees, partners, agents and local law enforcement; (12) delays or other changes in the timing of purchases by the Company's customers; (13) the Company's ability to achieve the expected benefits of its strategic alliances with TomTom and Trackunit; (14) financial and reputational risks related to product quality and liability issues; (15) the Company's ability to re-enter the Brazilian market in a timely manner and/or on favorable terms; and (16) trade tensions and governmental regulations and restrictions in Argentina, Brazil and the Company's other international markets. For a further discussion of these and other significant factors to consider in connection with forward-looking statements concerning the Company, reference is made to the Company's Annual Report on Form 10-K for the year ended December 31, 2014 and the Company's other filings with the Securities and Exchange Commission. Such forward-looking statements speak only as of the date made. Except as required by law, the Company undertakes no obligation to update these forward-looking statements.
3 In addition to financial measures prepared in accordance with generally accepted accounting principles (GAAP), this presentation also contains certain non-GAAP financial measures including EBITDA, Adjusted EBITDA and non-GAAP gross profit (and the corresponding gross margin percentages). The Company believes that the inclusion of this non-GAAP financial measure in this presentation helps investors to gain a meaningful understanding of changes in the Company's core operating results, and can also help investors who wish to make comparisons between LoJack and other companies on both a GAAP and a non-GAAP basis. LoJack management uses this non-GAAP measure, in addition to GAAP financial measures, as the basis for measuring our core operating performance and comparing such performance to that of prior periods and to the performance of our competitors. These measures are also used by management to assist with their financial and operating decision making. The non-GAAP financial measures included in this presentation are not meant to be considered superior to or a substitute for results of operations prepared in accordance with GAAP. In addition, the non-GAAP financial measures included in this presentation may be different from, and therefore may not be comparable to, similar measures used by other companies. Reconciliations of the non- GAAP financial measures used in this presentation to the most directly comparable GAAP financial measures are set forth in the accompanying appendix to this presentation. Use of Non-GAAP Financial Measures

4 Overview • Revenue of $28.8 million • U.S. pre-install unit volume increases 24% • Domestic LoJack business keeps pace with the U.S. auto industry growth • Company realizes benefits of cost-cutting plan and expects to reduce fixed overhead expenses by $6 million to $8 million on an annualized basis
5 Quality Assurance Program Update • $9.1 million accrued to date to cover costs with the Quality Assurance Program – these amounts are set aside to cover global obligations • US Program is making progress; expected to be complete in Q2 2016 • International program – we have reached agreements with all major international licensees • Continue to pursue a claim against our former battery supplier, EVE in order to enforce terms of agreement

6 Advancing the Pre-Install Strategy Pre-Install Program Sales Mix % Share of Dealer Channel Volume Strong Pre-Install sales in the quarter were further validated by signing our 3rd and our 5th largest accounts ever. 31% 32% 34% 43% 44% 45% 46% 51% 52% 55% 54% 61% 62% 0% 10% 20% 30% 40% 50% 60% 70% Q1 2012 Q2 2012 Q3 2012 Q4 2012 Q1 2013 Q2 2013 Q3 2013 Q4 2013 Q1 2014 Q2 2014 Q3 2014 Q4 2014 Q1 2015
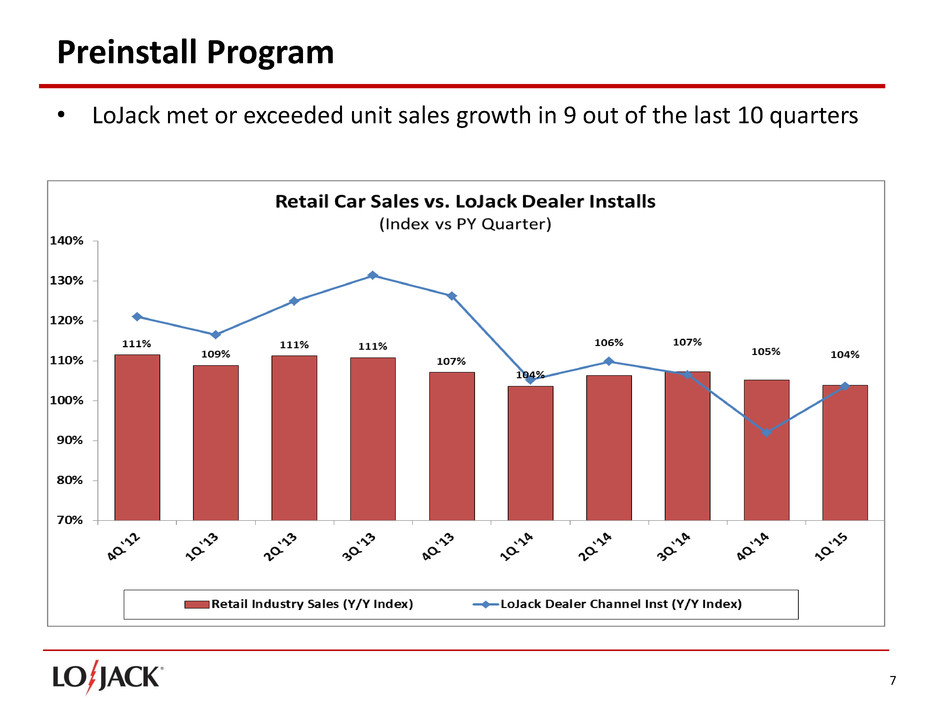
7 Preinstall Program • LoJack met or exceeded unit sales growth in 9 out of the last 10 quarters
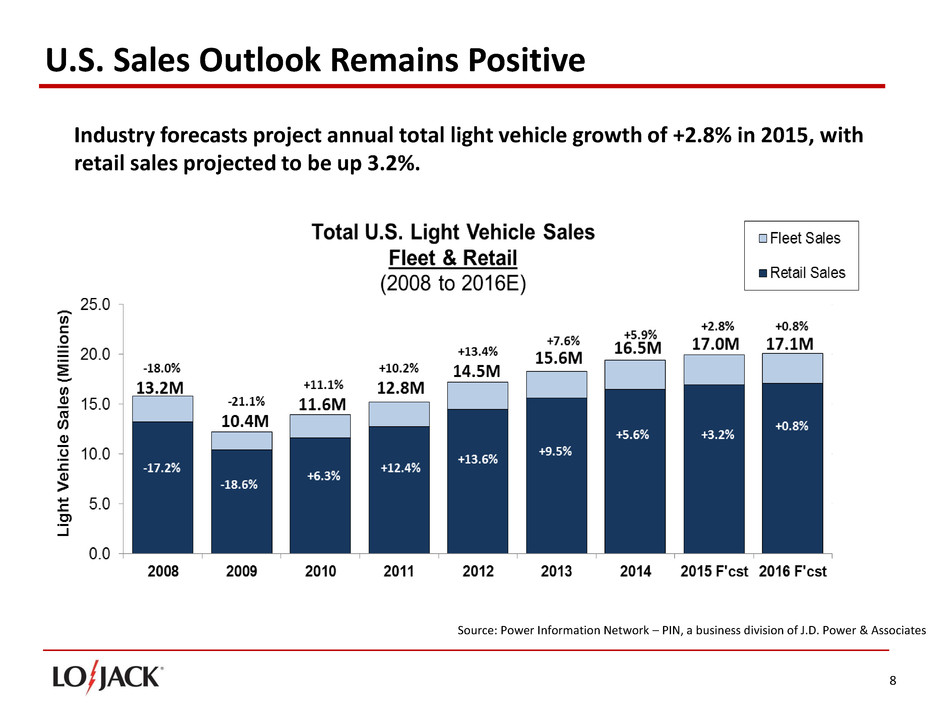
8 U.S. Sales Outlook Remains Positive Industry forecasts project annual total light vehicle growth of +2.8% in 2015, with retail sales projected to be up 3.2%. Source: Power Information Network – PIN, a business division of J.D. Power & Associates
9 International International revenue was up 9% vs. Year Ago Argentina • Delivered orders in successive quarters despite market restrictions, to support more balanced ordering Brazil Update • Recent in-market visits assessed the market and helped to reduce the applicant pool to four motivated candidates who are interested in working with LoJack to bring our products to the Brazilian market Italy • Stronger than expected growth continues to deliver profitability • Surpassed 50,000 subscribers in Italy in Q1 2014
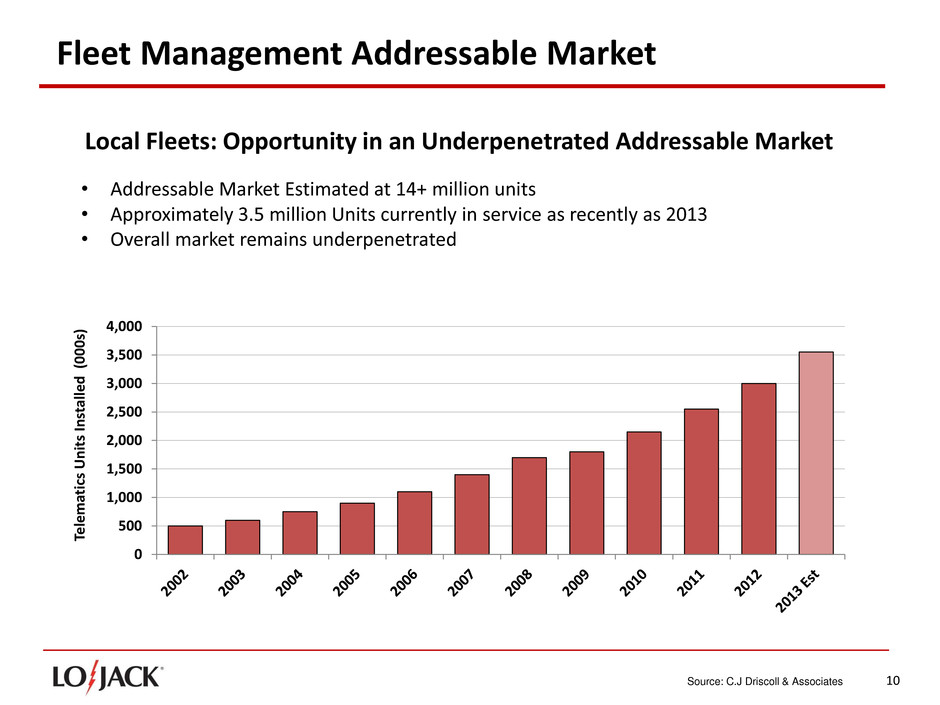
10 Fleet Management Addressable Market 0 500 1,000 1,500 2,000 2,500 3,000 3,500 4,000 Te le m at ics Un it s In st al le d (0 0 0 s) Local Fleets: Opportunity in an Underpenetrated Addressable Market • Addressable Market Estimated at 14+ million units • Approximately 3.5 million Units currently in service as recently as 2013 • Overall market remains underpenetrated Source: C.J Driscoll & Associates

11 LoJack® Fleet Management Recent announcements set the stage to broaden appeal of the Fleet Management offering • Integration with Intuit’s QuickBase allows businesses to integrate mission critical systems together; including LoJack Fleet Management • Retriever Communications is developing applications for our customers so that their field workers can complete more connected tasks and streamline work processes • Have begun selling LoJack Fleet Management LITE in the US, targeting smaller fleet sizes, while still offering world-class quality using TomTom’s back-end system and a simple to use OBDII plug-in device
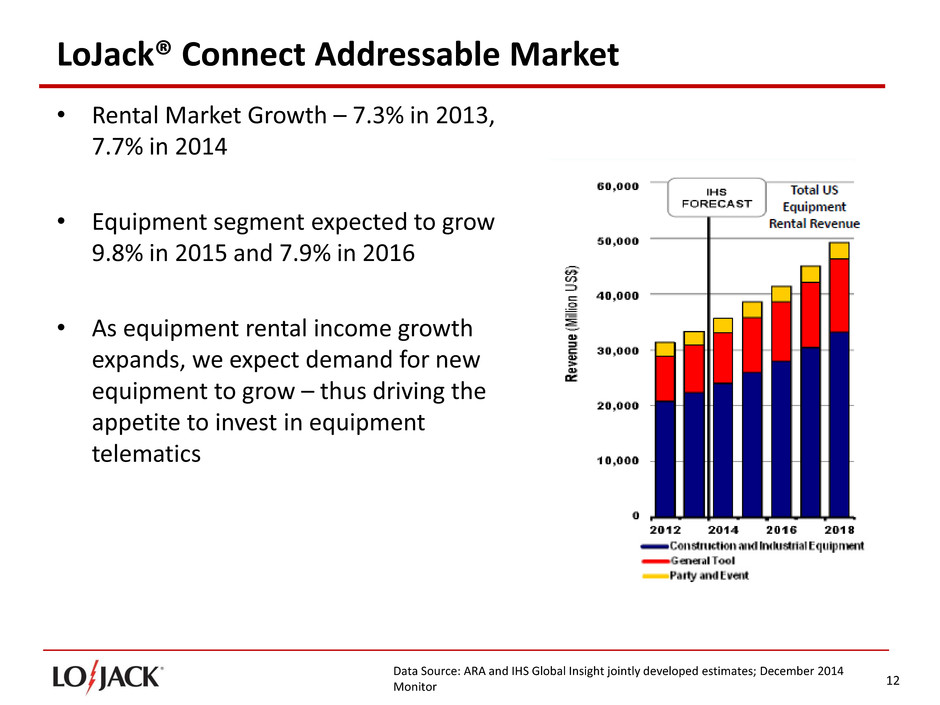
12 LoJack® Connect Addressable Market • Rental Market Growth – 7.3% in 2013, 7.7% in 2014 • Equipment segment expected to grow 9.8% in 2015 and 7.9% in 2016 • As equipment rental income growth expands, we expect demand for new equipment to grow – thus driving the appetite to invest in equipment telematics Data Source: ARA and IHS Global Insight jointly developed estimates; December 2014 Monitor

13 LoJack® Connect for Equipment Started selling LoJack Connect for Equipment in Q1 2015 • Six of the top 12 rental firms have LoJack Connect for Equipment installed ‒ Well liked for its ease of use and integrations capability, as well as ease of installation • Have installations with large US construction firms as end-users indicate that they too see our value in the marketplace
14 LoJack Dealer Inventory Management – LoJack IM1 • Continued success at Braman Motorcars, a top 30 auto retailer* – Refinements are helping us ready the offer for the broader market – Results are helping to reduce Dealer headaches, while helping them to streamline their business • Continued interest from other dealers who are reaching out to LoJack for this product • Expect rollout in Q2 of this year *source: US Auto News
15 Financial Review
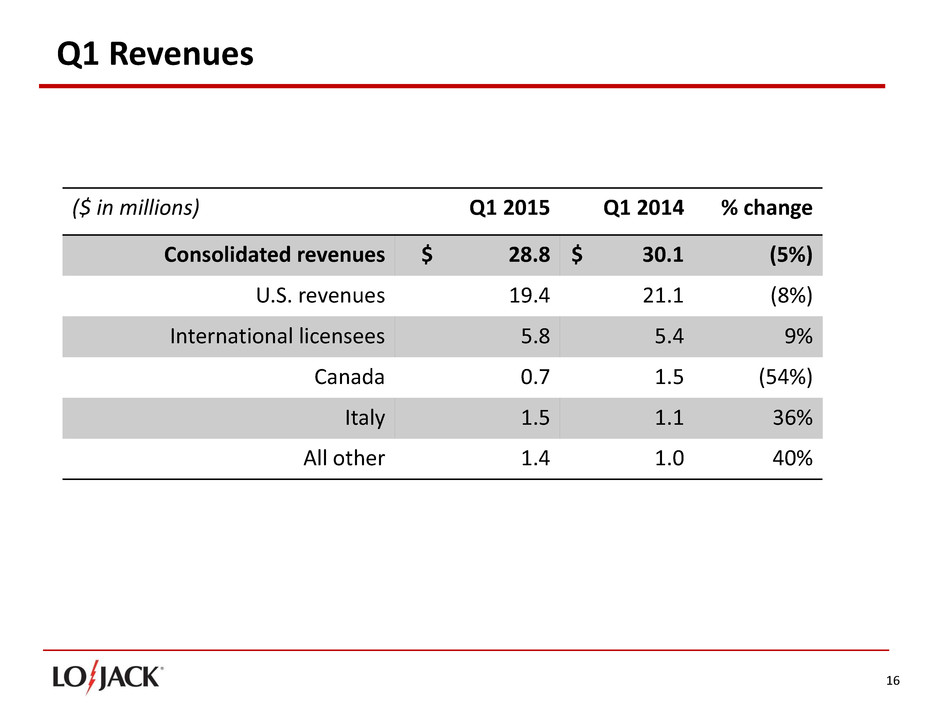
16 Q1 Revenues ($ in millions) Q1 2015 Q1 2014 % change Consolidated revenues $ 28.8 $ 30.1 (5%) U.S. revenues 19.4 21.1 (8%) International licensees 5.8 5.4 9% Canada 0.7 1.5 (54%) Italy 1.5 1.1 36% All other 1.4 1.0 40%
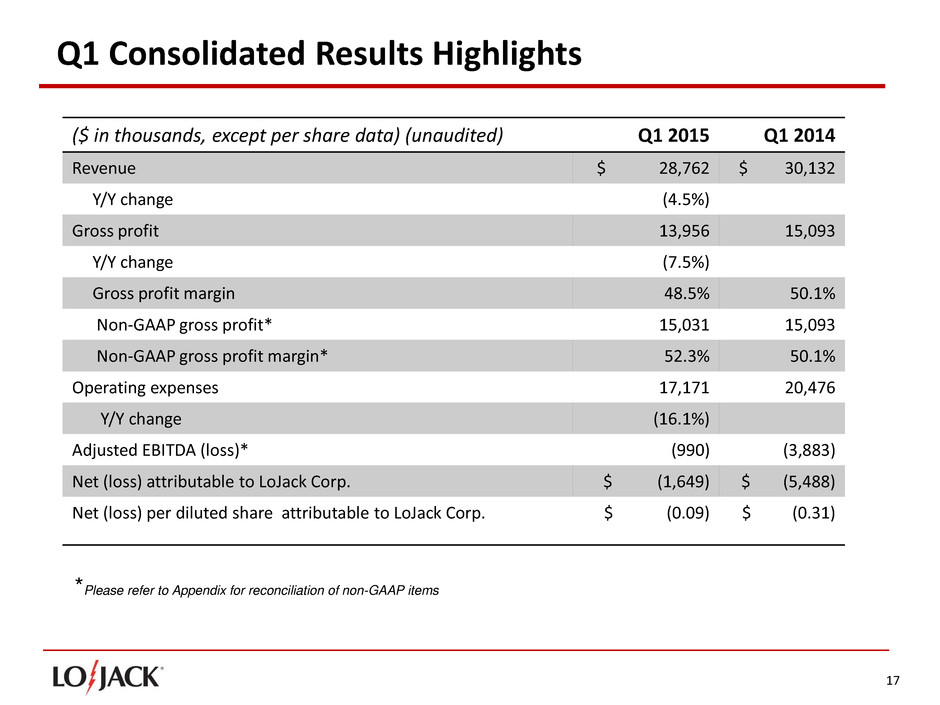
17 Q1 Consolidated Results Highlights *Please refer to Appendix for reconciliation of non-GAAP items ($ in thousands, except per share data) (unaudited) Q1 2015 Q1 2014 Revenue $ 28,762 $ 30,132 Y/Y change (4.5%) Gross profit 13,956 15,093 Y/Y change (7.5%) Gross profit margin 48.5% 50.1% Non-GAAP gross profit* 15,031 15,093 Non-GAAP gross profit margin* 52.3% 50.1% Operating expenses 17,171 20,476 Y/Y change (16.1%) Adjusted EBITDA (loss)* (990) (3,883) Net (loss) attributable to LoJack Corp. $ (1,649) $ (5,488) Net (loss) per diluted share attributable to LoJack Corp. $ (0.09) $ (0.31)
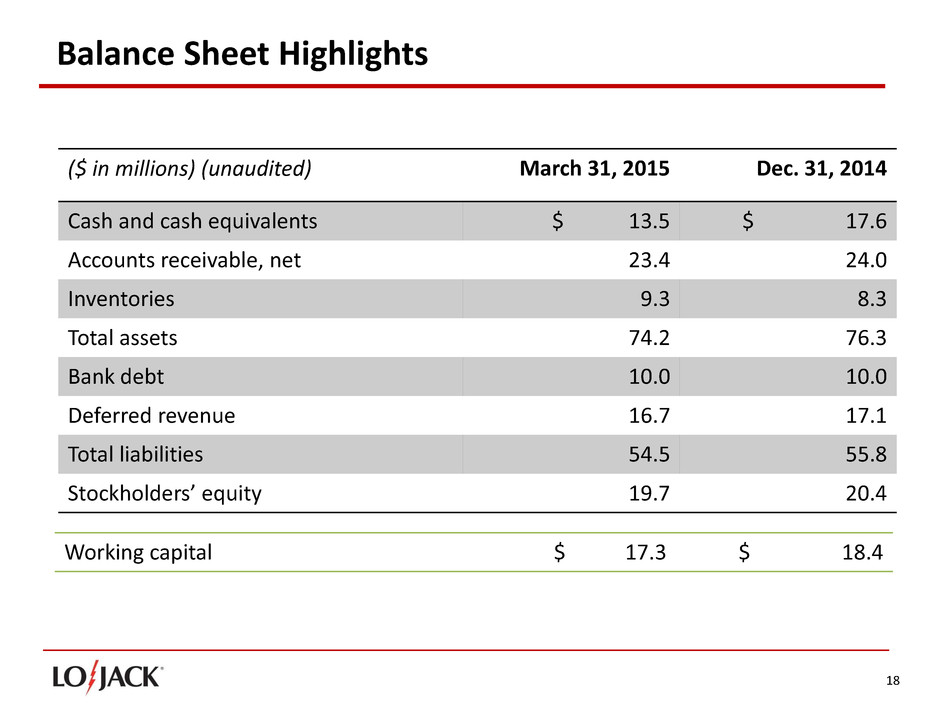
18 Balance Sheet Highlights ($ in millions) (unaudited) March 31, 2015 Dec. 31, 2014 Cash and cash equivalents $ 13.5 $ 17.6 Accounts receivable, net 23.4 24.0 Inventories 9.3 8.3 Total assets 74.2 76.3 Bank debt 10.0 10.0 Deferred revenue 16.7 17.1 Total liabilities 54.5 55.8 Stockholders’ equity 19.7 20.4 Working capital $ 17.3 $ 18.4

19 Quality Assurance Program Reserve (QAP) ($ in thousands) QAP Reserve Balance at December 31, 2014 $ 6,406 Additions $ 1,076 Payments/reductions $ (1,474) Foreign exchange impact $ (81) Balance at March 31, 2015 $ 5,927
20 Appendix
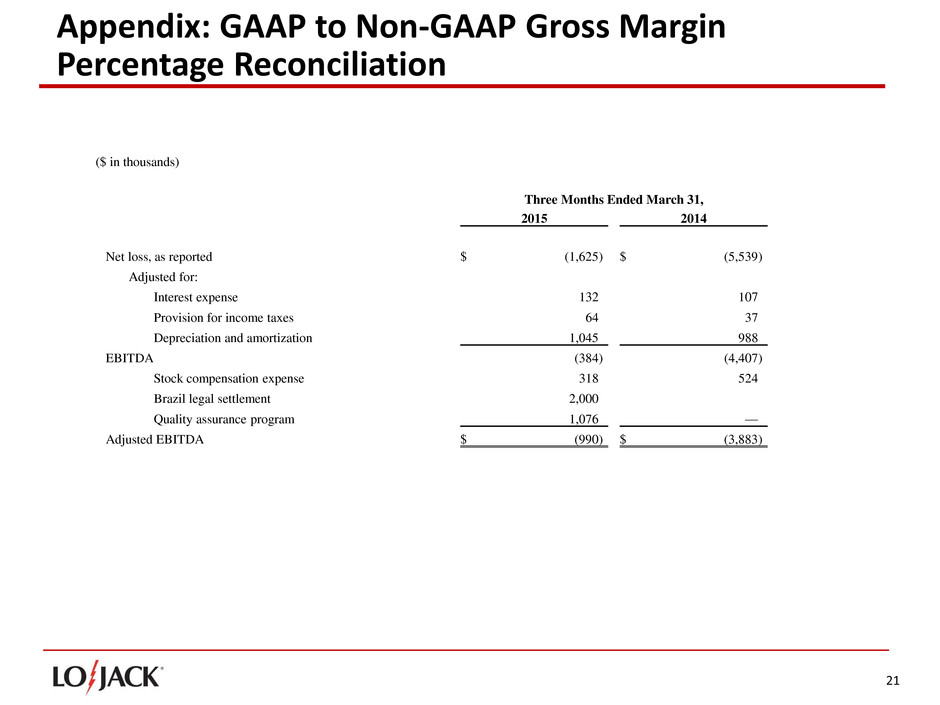
21 Appendix: GAAP to Non-GAAP Gross Margin Percentage Reconciliation ($ in thousands) Three Months Ended March 31, 2015 2014 Net loss, as reported $ (1,625 ) $ (5,539 ) Adjusted for: Interest expense 132 107 Provision for income taxes 64 37 Depreciation and amortization 1,045 988 EBITDA (384 ) (4,407 ) Stock compensation expense 318 524 Brazil legal settlement 2,000 Quality assurance program 1,076 — Adjusted EBITDA $ (990 ) $ (3,883 )
