Attached files
| file | filename |
|---|---|
| 8-K - 8-K - Intrawest Resorts Holdings, Inc. | s000892x2_8k.htm |
| EX-99.1 - EXHIBIT 99.1 - Intrawest Resorts Holdings, Inc. | s000892x2_ex99-1.htm |
Exhibit 99.2
Intrawest Resorts Holdings, Inc. Fiscal 2015 Third Quarter Earnings Presentation May 7, 2015
Important Information 1 This document contains forward - looking statements . These forward - looking statements are based on current expectations, estimates and projections about the industry and markets in which Intrawest operates as well as the Company’s beliefs and assumptions regarding our operations and financial performance, all of which are subject to known and unknown risks, uncertainties and other factors that may cause our actual results, performance or achievements, industry results or market trends to differ materially from those expressed or implied by such forward - looking statements . Therefore any statements contained herein that are not statements of historical fact may be forward - looking statements and should be evaluated as such . Without limiting the foregoing, words such as “Expects”, “Anticipates”, “Should”, “Intends”, “Plans”, “Believes”, “Seeks”, “Estimates”, “Projects”, and variations of such words and similar expressions are intended to identify such forward - looking statements . These statements are not guarantees of future performance and involve certain risks, uncertainties and assumptions which are difficult to predict, including those described in Part I - Item 1 A, ‘‘Risk Factors’’ in our Annual Report on Form 10 - K for the fiscal year ended June 30 , 2014 filed with the Securities and Exchange Commission (“SEC”) on September 23 , 2014 , as may be revised in subsequent SEC filings . Therefore , actual outcomes and results may differ materially from what is expressed or forecasted in such forward - looking statements . The actual performance of Intrawest may differ from the budget, projections and returns set forth herein and may differ materially . Certain information contained herein has been obtained from published and non - published sources . Such information has not been independently verified by Intrawest . Except where otherwise indicated, the information provided herein is based on matters as they exist as of the date of preparation and not as of any future date, and will not be updated or otherwise revised to reflect information that subsequently becomes available, or circumstances existing or changes occurring after the date hereof . This presentation includes certain non - GAAP financial measures, including Adjusted EBITDA (“Adj . EBITDA ”) . Non - GAAP financial measures such as Adj . EBITDA should be considered only as supplemental to, and not as superior to, financial measures prepared in accordance with GAAP . Please refer to our Current Report on Form 10 - Q filed May 7 , 2015 with the SEC for a reconciliation of the non - GAAP financial measures included in this presentation to the most directly comparable financial measures prepared in accordance with GAAP . We use Adj . EBITDA as a measure of our operating performance . Adj . EBITDA is a supplemental non - GAAP financial measure . Our board of directors and management team focus on Adj . EBITDA as a key performance and compensation measure . Adj . EBITDA assists us in comparing our performance over various reporting periods because it removes from our operating results the impact of items that our management believes do not reflect our core operating performance . The compensation committee of our board of directors will determine the annual variable compensation for certain members of our management team, based in part, on Adj . EBITDA . Adj . EBITDA is not a substitute for net income (loss), income (loss) from continuing operations, cash flows from operating activities or any other measure prescribed by GAAP . There are limitations to using non - GAAP measures such as Adj . EBITDA . Although we believe that Adj . EBITDA can make an evaluation of our operating performance more consistent because it removes items that do not reflect our core operations, other companies in our industry may define Adj . EBITDA differently than we do . As a result, it may be difficult to use Adj . EBITDA to compare the performance of those companies to our performance . Adj . EBITDA should not be considered as a measure of the income generated by our business or discretionary cash available to us to invest in the growth of our business . Our management compensates for these limitations by reference to our GAAP results and using Adj . EBITDA as a supplemental measure .
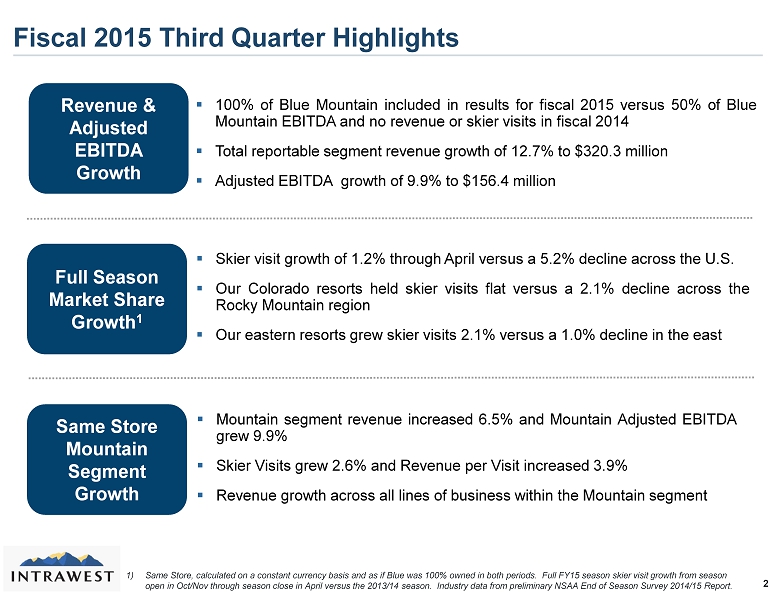
▪ Skier visit growth of 1 . 2 % through April versus a 5 . 2 % decline across the U . S . ▪ Our Colorado resorts held skier visits flat versus a 2 . 1 % decline across the Rocky Mountain region ▪ Our eastern resorts grew skier visits 2 . 1 % versus a 1 . 0 % decline in the east Fiscal 2015 Third Quarter Highlights 2 Revenue & Adjusted EBITDA Growth ▪ 100 % of Blue Mountain included in results for fiscal 2015 versus 50 % of Blue Mountain EBITDA and no revenue or skier visits in fiscal 2014 ▪ Total reportable segment revenue growth of 12 . 7 % to $ 320 . 3 million ▪ Adjusted EBITDA growth of 9 . 9 % to $ 156 . 4 million ▪ Mountain segment revenue increased 6 . 5 % and Mountain Adjusted EBITDA grew 9 . 9 % ▪ Skier Visits grew 2 . 6 % and Revenue per Visit increased 3 . 9 % ▪ Revenue growth across all lines of business within the Mountain segment Same Store Mountain Segment Growth Full Season Market Share Growth 1 1) Same Store, calculated on a constant currency basis and as if Blue was 100% owned in both periods. Full FY15 season skier vi sit growth from season open in Oct/Nov through season close in April versus the 2013/14 season. Industry data from preliminary NSAA End of Season S urv ey 2014/15 Report.
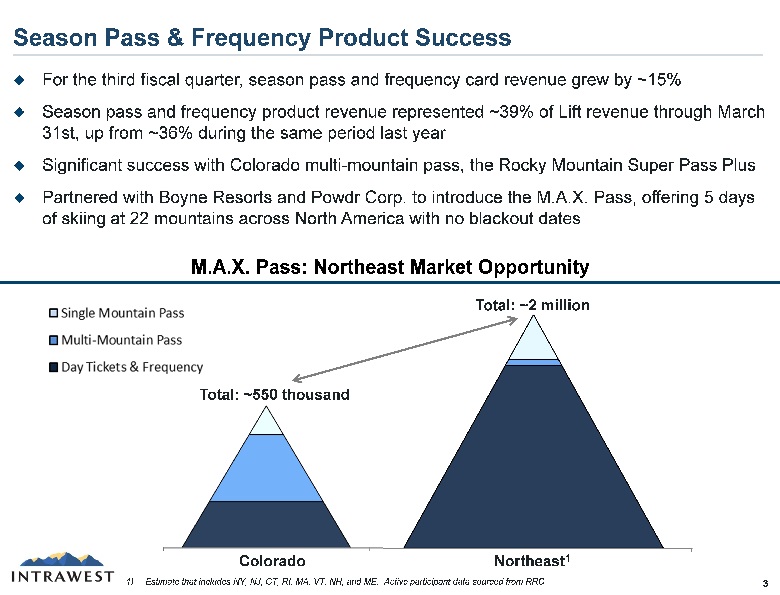
Colorado New England Single Mountain Pass Multi-Mountain Pass Day Tickets & Frequency Season Pass & Frequency Product Success 3 For the third fiscal quarter, season pass and frequency card revenue grew by ~15% Season pass and frequency product revenue represented ~39 % of Lift r evenue through March 31st, up from ~36 % during the same period last year Significant success with Colorado multi - mountain pass, the Rocky Mountain Super Pass Plus Partnered with Boyne Resorts and Powdr Corp. to introduce the M.A.X. Pass, offering 5 days of skiing at 22 mountains across North America with no blackout dates M.A.X. Pass: Northeast Market Opportunity 1) Estimate that includes NY, NJ, CT, RI, MA, VT, NH, and ME. Active participant data sourced from RRC. Total: ~2 million Colorado Northeast 1 Total: ~550 thousand
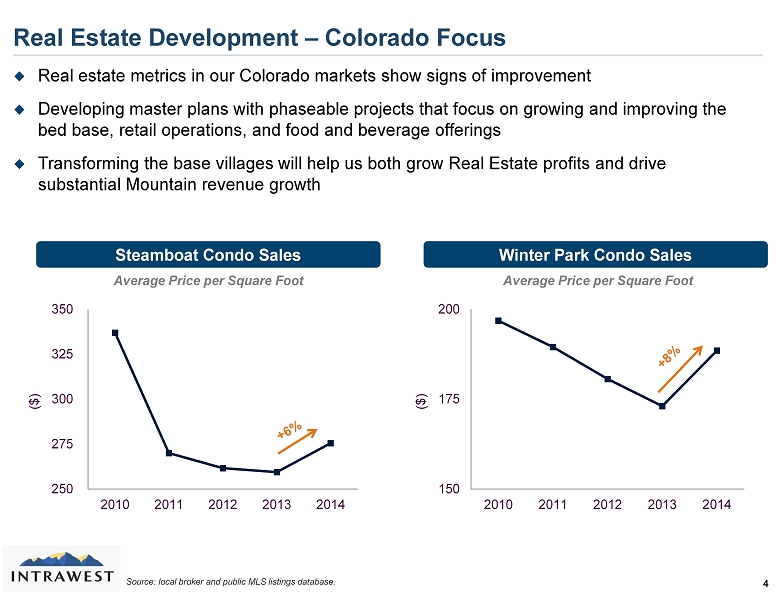
Real estate metrics in our Colorado markets show signs of improvement Developing master plans with phaseable projects that focus on growing and improving the bed base, retail operations, and food and beverage offerings Transforming the base villages will help us both grow Real Estate profits and drive substantial Mountain revenue growth Real Estate Development – Colorado Focus 4 250 275 300 325 350 2010 2011 2012 2013 2014 ($) 150 175 200 2010 2011 2012 2013 2014 ($) Steamboat Condo Sales Winter Park Condo Sales Average Price per Square Foot Average Price per Square Foot Source : local broker and public MLS listings database.
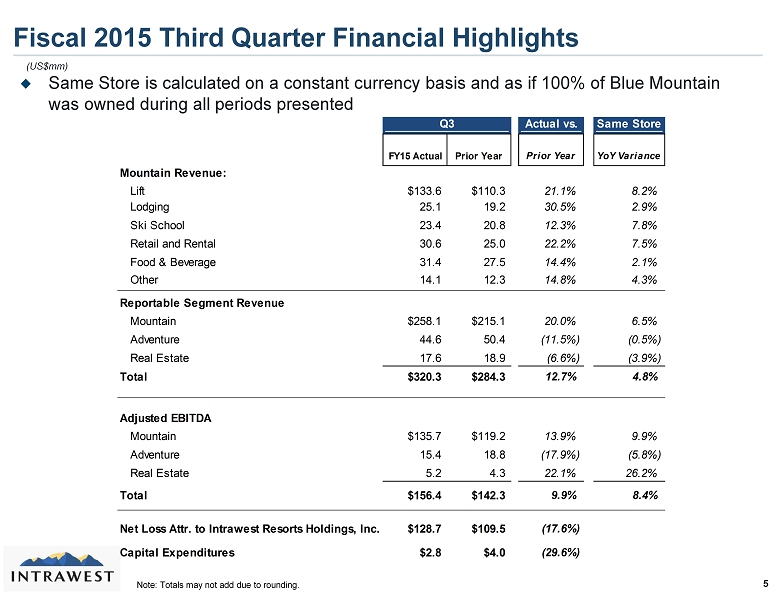
Q3 Actual vs. Same Store FY15 Actual Prior Year Prior Year YoY Variance Mountain Revenue: Lift $133.6 $110.3 21.1% 8.2% Lodging 25.1 19.2 30.5% 2.9% Ski School 23.4 20.8 12.3% 7.8% Retail and Rental 30.6 25.0 22.2% 7.5% Food & Beverage 31.4 27.5 14.4% 2.1% Other 14.1 12.3 14.8% 4.3% Reportable Segment Revenue Mountain $258.1 $215.1 20.0% 6.5% Adventure 44.6 50.4 (11.5%) (0.5%) Real Estate 17.6 18.9 (6.6%) (3.9%) Total $320.3 $284.3 12.7% 4.8% Adjusted EBITDA Mountain $135.7 $119.2 13.9% 9.9% Adventure 15.4 18.8 (17.9%) (5.8%) Real Estate 5.2 4.3 22.1% 26.2% Total $156.4 $142.3 9.9% 8.4% Net Loss Attr. to Intrawest Resorts Holdings, Inc. $128.7 $109.5 (17.6%) Capital Expenditures $2.8 $4.0 (29.6%) Fiscal 2015 Third Quarter Financial Highlights 5 (US$mm) Same Store is calculated on a constant currency basis and as if 100% of Blue Mountain was owned during all periods presented Note: Totals may not add due to rounding.
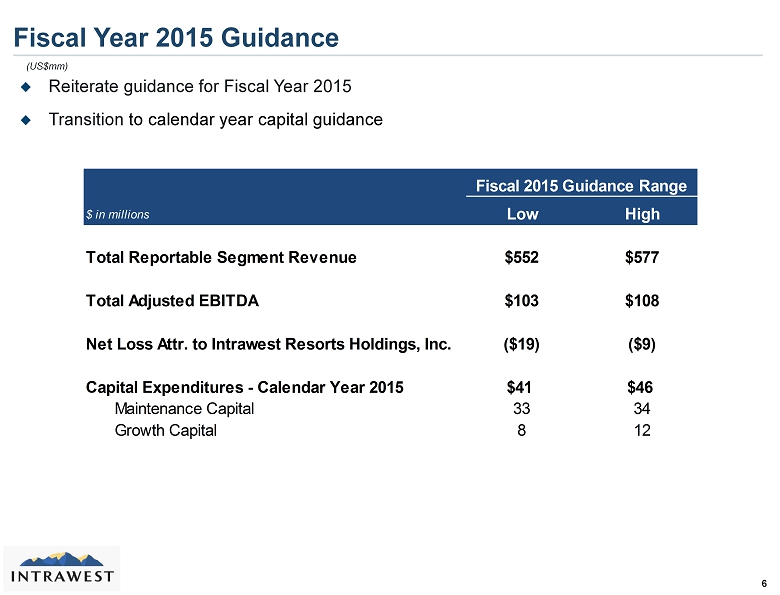
Fiscal Year 2015 Guidance 6 (US$mm) Reiterate guidance for Fiscal Year 2015 Transition to calendar year c apital guidance Fiscal 2015 Guidance Range % Change vs. Fiscal 2014 $ in millions Low High Total Reportable Segment Revenue $552 $577 Total Adjusted EBITDA $103 $108 Net Loss Attr. to Intrawest Resorts Holdings, Inc. ($19) ($9) Capital Expenditures - Calendar Year 2015 $41 $46 Maintenance Capital 33 34 Growth Capital 8 12
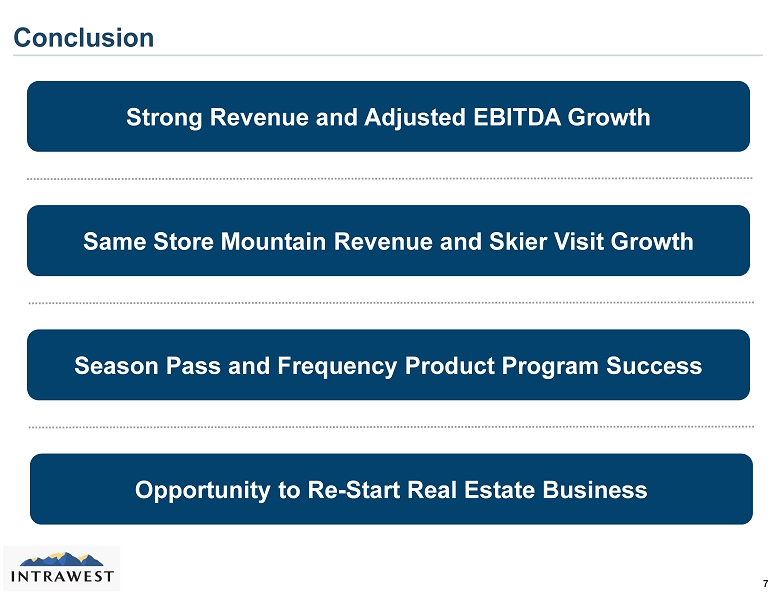
Conclusion 7 Strong Revenue and Adjusted EBITDA Growth Same Store Mountain Revenue and Skier Visit Growth Season Pass and Frequency Product Program Success Opportunity to Re - Start Real Estate Business