Attached files
| file | filename |
|---|---|
| EX-3.1 - EX-3.1 - eASIC Corp | d811104dex31.htm |
| EX-23.1 - EX-23.1 - eASIC Corp | d811104dex231.htm |
Table of Contents
As filed with the U.S. Securities and Exchange Commission on May 6, 2015.
Registration No. 333-202186
UNITED STATES
SECURITIES AND EXCHANGE COMMISSION
Washington, D.C. 20549
Amendment No. 5
to
Form S-1
REGISTRATION STATEMENT
Under
The Securities Act of 1933
eASIC Corporation
(Exact name of Registrant as specified in its charter)
| Delaware | 3674 | 77-0532688 | ||
| (State or other jurisdiction of incorporation or organization) |
(Primary Standard Industrial Classification Code Number) |
(I.R.S. Employer Identification Number) |
eASIC Corporation
2585 Augustine Drive, Suite 100
Santa Clara, California 95054
(408) 855-9200
(Address, including zip code, and telephone number, including area code, of Registrant’s principal executive offices)
Ronnie Vasishta
President and Chief Executive Officer
eASIC Corporation
2585 Augustine Drive, Suite 100
Santa Clara, California 95054
(408) 855-9200
(Name, address, including zip code, and telephone number, including area code, of agent for service)
Copies to:
| James F. Fulton, Jr. David G. Peinsipp Robert W. Phillips Cooley LLP 3175 Hanover Street Palo Alto, California 94304 (650) 843-5000 |
Richard J. Deranleau Senior Vice President, Finance and Chief Financial Officer eASIC Corporation 2585 Augustine Drive, Suite 100 Santa Clara, California 95054 (408) 855-9200 |
Jorge del Calvo Davina K. Kaile Alan B. Kalin Pillsbury Winthrop Shaw Pittman LLP 2550 Hanover Street Palo Alto, California 94304 (650) 233-4500 |
Approximate date of commencement of proposed sale to the public: As soon as practicable after this registration statement becomes effective.
If any of the securities being registered on this Form are to be offered on a delayed or continuous basis pursuant to Rule 415 under the Securities Act, check the following box: ¨
If this Form is filed to register additional securities for an offering pursuant to Rule 462(b) under the Securities Act, please check the following box and list the Securities Act registration statement number of the earlier effective registration statement for the same offering. ¨
If this Form is a post-effective amendment filed pursuant to Rule 462(c) under the Securities Act, check the following box and list the Securities Act registration statement number of the earlier effective registration statement for the same offering. ¨
If this Form is a post-effective amendment filed pursuant to Rule 462(d) under the Securities Act, check the following box and list the Securities Act registration statement number of the earlier effective registration statement for the same offering. ¨
Indicate by check mark whether the registrant is a large accelerated filer, an accelerated filer, a non-accelerated filer, or a smaller reporting company. See the definitions of “large accelerated filer,” “accelerated filer” and “smaller reporting company” in Rule 12b-2 of the Exchange Act. (Check one):
| Large accelerated filer | ¨ | Accelerated filer | ¨ |
| Non-accelerated filer | x (Do not check if a smaller reporting company) | Smaller reporting company | ¨ |
The Registrant hereby amends this Registration Statement on such date or dates as may be necessary to delay its effective date until the Registrant shall file a further amendment which specifically states that this Registration Statement shall thereafter become effective in accordance with Section 8(a) of the Securities Act of 1933 or until the Registration Statement shall become effective on such date as the Commission, acting pursuant to said Section 8(a), may determine.
Table of Contents
The information in this preliminary prospectus is not complete and may be changed. These securities may not be sold until the registration statement filed with the Securities and Exchange Commission is effective. This preliminary prospectus is not an offer to sell these securities and we and the selling stockholders are not soliciting offers to buy these securities in any jurisdiction where the offer or sale is not permitted.
PROSPECTUS
(Subject to Completion)
Issued May 6, 2015
Shares

COMMON STOCK
eASIC Corporation is offering shares of common stock and the selling stockholders are offering shares. We will not receive any of the proceeds from the sale of the shares being offered by the selling stockholders. This is our initial public offering and no public market currently exists for our shares. We anticipate that the initial public offering price will be between $ and $ per share.
We have applied to have our common stock listed on the NASDAQ Global Market under the symbol “EASI.”
We are an “emerging growth company” as defined under the federal securities laws and are subject to reduced public company reporting requirements. Investing in our common stock involves risks. See “Risk Factors” beginning on page 12.
PRICE $ A SHARE
| Price to Public |
Underwriting and |
Proceeds to eASIC |
Proceeds to the selling stockholders |
|||||||||||||
| Per share |
$ | $ | $ | $ | ||||||||||||
| Total |
$ | $ | $ | $ | ||||||||||||
| (1) | See “Underwriting” for a description of the compensation payable to the underwriters. |
The underwriters have the right to purchase up to an additional shares of common stock from us to cover over-allotments.
The Securities and Exchange Commission and state securities regulators have not approved or disapproved of these securities, or determined if this prospectus is truthful or complete. Any representation to the contrary is a criminal offense.
The underwriters expect to deliver the shares of common stock to purchasers on , 2015.
| MORGAN STANLEY | DEUTSCHE BANK SECURITIES | |||
| RAYMOND JAMES | BAIRD | WILLIAM BLAIR | ||
| ROTH CAPITAL PARTNERS | NORTHLAND CAPITAL MARKETS | |
, 2015
Table of Contents

Global Megatrends are driving the need for custom hardware
Global Networks
Mobility
Cloud
101100110101011
Big Data
Table of Contents

Think Custom IC
Think eASIC®
Custom ICs are essential to differentiate hardware in the marketplace
Wireless
Storage
Wired
eASIC®
nextremeTM
eASIC provides breakthrough solutions for delivering Custom ICs
Time-to-Market
Performance
Power
Cost
Table of Contents
None of us, the selling stockholders or the underwriters have authorized anyone to provide any information or to make any representations other than those contained in this prospectus or in any free writing prospectuses we have prepared. We, the selling stockholders and the underwriters take no responsibility for, and can provide no assurance as to the reliability of, any other information that others may give you. We and the selling stockholders are offering to sell, and seeking offers to buy, shares of our common stock only in jurisdictions where offers and sales are permitted. The information in this prospectus is accurate only as of the date of this prospectus, regardless of the time of delivery of this prospectus or any sale of shares of our common stock. Our business, financial condition, results of operations, and prospects may have and are likely to have changed since that date.
Through and including , 2015 (the 25th day after the date of this prospectus), all dealers effecting transactions in these securities, whether or not participating in this offering, may be required to deliver a prospectus. This delivery requirement is in addition to the obligation of dealers to deliver a prospectus when acting as underwriters and with respect to their unsold allotments or subscriptions.
For investors outside the United States: None of us, the selling stockholders or the underwriters have done anything that would permit this offering or possession or distribution of this prospectus in any jurisdiction where action for that purpose is required, other than in the United States. Persons outside the United States who come into possession of this prospectus must inform themselves about, and observe any restrictions relating to, the offering of the shares of our common stock and the distribution of this prospectus outside of the United States.
Table of Contents
This summary highlights information contained elsewhere in this prospectus. This summary is not complete and does not contain all of the information you should consider in making your investment decision. You should read the following summary together with the more detailed information appearing elsewhere in this prospectus, including “Risk Factors,” “Management’s Discussion and Analysis of Financial Condition and Results of Operations,” and our consolidated financial statements and related notes before deciding whether to purchase shares of our common stock. Unless the context otherwise requires, the terms “eASIC,” “the Company,” “we,” “us,” and “our” in this prospectus refer to eASIC Corporation.
eASIC CORPORATION
Overview
We have pioneered a differentiated solution that enables us to rapidly and cost-effectively deliver custom integrated circuits (ICs), creating value for our customers’ hardware and software systems. Our eASIC solution consists of our eASIC platform which incorporates a versatile, pre-defined and reusable base array and customizable single-mask layer, our ASICs, delivered using either our easicopy or standard ASIC methodologies, and our proprietary design tools. Customers can efficiently migrate to our easicopy ASIC from the eASIC platform using our easicopy methodology. We believe our eASIC solution provides the optimal combination of fast time-to-market, high performance, low power consumption, low development cost and low unit cost for our customers. Our solution has broad applicability across a wide range of customers, applications and end markets including communications infrastructure, storage and data processing and industrial applications. Our solution should position us to address additional end markets in the future. As of March 31, 2015, we have leveraged our eASIC platform to develop four generations of eASIC products with increasingly smaller process nodes, and we have designed over 200 custom ICs and shipped over 21 million units.
We believe the need for differentiation through custom ICs is driven by several megatrends, including the proliferation of mobile devices driving the deployment of high capacity and high bandwidth wireless infrastructure, the rapid transition to cloud computing and the emergence of big data analytics. We believe the ability to differentiate hardware and software systems through custom ICs is critical to helping our customers grow faster than their competitors and enhance their profit margins. Historical solutions for customized ICs have included Application Specific Integrated Circuits (ASICs), Application Specific Standard Products (ASSPs) and Field Programmable Gate Arrays (FPGAs). We believe our products avoid the painful tradeoffs associated with these historical solutions. For example, based on data provided by a majority of our customers for power consumption with respect to those customers’ designs using FPGAs, as well as our own internal analysis using the latest generation of custom ICs based on our eASIC platform, we believe that we can enable our customers to reduce power consumption by 50% to 80% compared to FPGAs at the same process node. In addition, in all five cases where customers have required that our design provide an increase in performance, as measured by clock speed of the chip, we have been able to improve performance by 60% to 120% compared to FPGAs at the same process node. With our eASIC platform, we believe our customers can significantly reduce non-recurring engineering (NRE) charges and lower design and manufacturing time by nine to 12 months or more when compared to traditional ASIC design and manufacturing processes. We believe our competitive advantages will increase over time as the costs and complexity associated with the development and manufacturing of future generations of ICs continue to rise.
We estimate that our addressable market opportunity across ASIC, ASSP and FPGA applications is approximately $78 billion, based on data from Gartner Research (Gartner). During the year ended December 31, 2014 and the three months ended March 31, 2015, we sold our products and services to over 14 customers and 10 customers, respectively, including Ericsson, Fujitsu, Huawei, NEC, Omnivision, Seagate and Toshiba. The number of customers varies between different periods due to timing of orders from customers. In 2012, 2013,
1
Table of Contents
2014 and the first three months of 2015, Ericsson and Seagate together accounted for 73%, 87%, 93% and 95%, respectively, of our total revenues. For the years ended December 31, 2013 and 2014, our total revenues were $29.8 million and $67.4 million, respectively, representing an annual growth rate of 126%. We do not expect our revenues to continue to grow at these historical rates in the future. Our net loss for 2013 and 2014 was $7.8 million and $1.1 million, respectively. For the three months ended March 31, 2014 and 2015, our revenues were $13.6 million and $20.1 million, respectively, and our net income was $0.4 million and $0.7 million, respectively. We may not be able to grow or sustain our revenues in the future and expect our expenses to increase substantially in the near term. We design our ICs and use third-party vendors for substantially all of our manufacturing production and operations.
Industry Background
Key technology megatrends driving massive growth in the demand for network bandwidth, computing resources and data storage
The significant and growing demands on networking, compute and storage infrastructure have resulted in service providers, enterprises and datacenter operators requiring OEMs to rapidly introduce next generation networking, server and storage systems which deliver high return on investment with enhanced functionality and performance, while reducing power consumption and physical footprint.
Challenges with historical IC solutions for OEMs
In order to provide semiconductor-based differentiation and customization for their product offerings, OEMs have traditionally had to choose between ASICs, ASSPs and FPGAs. However, these solutions require increasingly painful tradeoffs among time-to-market, performance, power consumption, unit and development costs. As the costs and time required to develop ASICs and ASSPs have increased, we believe that OEMs have become increasingly receptive to finding a better solution to provide the custom ICs they desire. While FPGAs offer a time-to-market advantage, they consume significant amounts of power and are cost prohibitive to high-volume production.
Our Solution
We invented a way to customize ICs with a single mask layer base array that we believe better avoids the painful tradeoffs associated with traditional ASICs, ASSPs and FPGAs. Our eASIC platform utilizes a versatile, pre-defined and reusable base array, which is built using standard mask layers. One custom mask layer is then inserted into the base array, which customizes the IC to meet a specific customer’s requirements. The ability to customize an IC with a single mask layer is achieved using our proprietary architecture and design tools. Once the IC design is completed, the custom mask layer is fabricated and added to the pre-manufactured base array to complete the manufacturing process. Our easicopy ASICs are customized using a full set of masks and are developed using our easicopy methodology. The final packaged and tested IC is then shipped to the customer for implementation into their specific application. We believe this approach provides the optimal combination of benefits including fast time-to-market, high performance, low power consumption, low unit cost and low development cost for our customers.
2
Table of Contents
Benefits to Our Customers
Our customers are continuously developing new products in existing and new application areas as they look to differentiate themselves from their competitors, reduce time-to-market, increase market share and enhance margins. In our view, the key benefits of our solutions, as outlined below, help our customers to achieve their goals:
| • | Product Differentiation Through Custom ICs. Our custom ICs are designed to meet the specific technical requirements of our customers in their respective end-markets while balancing their time-to-market, performance, power consumption and overall cost needs. |
| • | Fast Time-to-Market. Our eASIC platform offers a time-to-market advantage of up to 12 months or more over traditional ASICs. |
| • | High Performance. Our eASIC platform is designed to meet the high performance requirements that our customers need. We believe that our solution has ASIC-comparable performance that is superior to that offered by FPGAs. |
| • | Low Power Consumption. In most of our end markets, power consumption is a key consideration in system design and operation. Our solution is power-efficient and can considerably lower a system’s overall operating cost and power consumption. |
| • | Low Development Cost. The versatility of our pre-designed base array and the need to customize only one mask layer in our eASIC platform allows us to lower development cost by significantly reducing design and NRE expenses. |
| • | Low Unit Cost. We are able to design and deliver ICs that have a smaller die size when compared with FPGAs. Due to the area efficient die and lower cost IC packaging, our solution offers an attractive cost per unit relative to FPGAs. |
Our Growth Strategy
Our objective is to be the leading provider of custom and affordable ICs with fast time-to-market. We believe our solution enables our customers to differentiate their products, become more competitive in their markets and enhance their growth rates, market share and profit margins. Key elements of our strategy include:
| • | Exploit the Multiple Benefits of our eASIC Platform. We intend to leverage the multiple benefits of our versatile eASIC platform to expand our customer base across a variety of end products. |
| • | Expand Market Share within Our Existing Customers. We intend to increase our market share by applying our differentiated design capabilities to new design programs and by continuing to foster deep customer relationships. We believe this will position us to expand into our customers’ adjacent and next generation products. |
| • | Sell into New Customers in Existing Markets. We have successfully demonstrated a number of key benefits to top customers within certain applications and markets, such as wireless communications infrastructure and storage. We plan to work with other top OEMs in our existing markets to bring the same benefits to them. |
| • | Expand into Adjacent Markets and Enhance Our Product Roadmap to Identify New Use Cases. We intend to leverage the versatility of our eASIC platform to develop new use cases and applications. As we deploy new capabilities including, but not limited to, higher-speed SerDes, increased logic and memory integration and lower power solutions, we plan to use our eASIC platform to expand into adjacent markets. |
3
Table of Contents
| • | Invest in Key Sales and Technical Talent. As we grow, we intend to build upon our top tier customer base by increasing our geographic sales and technical resources to enable us to expand our market share with new and existing customers and in adjacent markets. |
Risks Associated With Our Business
Our business is subject to numerous risks, as more fully described in the section entitled “Risk Factors” immediately following this prospectus summary. You should read these risks before you invest in our common stock. We may be unable, for many reasons, including those that are beyond our control, to implement our business strategy. In particular, risks associated with our business include:
| • | We depend on a limited number of customers for a substantial majority of our revenues. If we fail to retain or expand our customer relationships, our revenues would decline significantly. |
| • | Our success and future revenues depend on our winning designs with our customers, and those customers designing our solutions into their product offerings and successfully selling and marketing such products. The design win process is generally a lengthy, expensive and competitive process, with no guarantee of revenue, and if we fail to generate sufficient revenues to offset our expenses, our business and operating results would suffer. |
| • | Our customers may replace or substitute our custom IC solutions with different or lower cost solutions. |
| • | The complexity of our custom IC solutions could result in unforeseen delays or expenses from undetected defects, erroneous spins or other bugs which could adversely affect our operating costs, reduce the market adoption of our solutions and damage our reputation with current or prospective customers. |
| • | Our target markets may not grow or develop as we currently expect and if we fail to penetrate new markets and scale successfully within those markets, our revenues and financial condition would be harmed. |
| • | We may experience difficulties demonstrating the value to customers of newer, higher priced and higher margin solutions if they believe existing solutions are adequate to meet end customer expectations, and our business would be harmed. |
| • | Our VMI inventory strategy subjects us to risk of revenue volatility, which could negatively impact our operating results. |
| • | Fluctuations in the mix of our custom IC products that we sell may adversely affect our financial results. |
| • | We depend on third parties for substantially all of our manufacturing production and operations. |
| • | We identified material weaknesses in our internal controls over financial reporting that were a result of the limited internal accounting resources available to us while we were a private company. If not properly remediated, these weaknesses could result in material misstatements in our financial statements in future periods and impair our ability to comply with the accounting and reporting requirements applicable to public companies. |
Corporate Information
We were incorporated in Delaware in 1999. Our principal executive offices are located at 2585 Augustine Drive, Suite 100, Santa Clara, California 95054, and our telephone number is (408) 855-9200. Our corporate website address is www.easic.com. Information contained on or accessible through our website is not a part of this prospectus, should not be relied on in determining whether to make an investment decision, and the inclusion of our website address in this prospectus is an inactive textual reference only.
We have obtained registered trademarks for eASIC, easicopy and eASICore, The Configurable Logic Company and eZ-IP based on use of the trademarks in the United States. This prospectus contains references to
4
Table of Contents
our trademarks and to trademarks belonging to other entities. Solely for convenience, trademarks and trade names referred to in this prospectus, including logos, artwork and other visual displays, may appear without the ® or ™ symbols, but such references are not intended to indicate, in any way, that we will not assert, to the fullest extent under applicable law, our rights or the rights of the applicable licensor to these trademarks and trade names. We do not intend our use or display of other companies’ trade names or trademarks to imply a relationship with, or endorsement or sponsorship of us by, any other companies.
Implications of Being an Emerging Growth Company
As a company with less than $1.0 billion in revenues during our last fiscal year, we qualify as an “emerging growth company” as defined in the Jumpstart Our Business Startups Act (JOBS Act), enacted in April 2012. An emerging growth company may take advantage of reduced reporting requirements that are otherwise applicable to public companies. These provisions include, but are not limited to:
| • | being permitted to present only two years of audited financial statements and only two years of related Management’s Discussion and Analysis of Financial Condition and Results of Operations in this prospectus; |
| • | not being required to comply with the auditor attestation requirements of Section 404 of the Sarbanes-Oxley Act of 2002, as amended; |
| • | reduced disclosure obligations regarding executive compensation in our periodic reports, proxy statements and registration statements; and |
| • | exemptions from the requirements of holding a non-binding advisory vote on executive compensation and stockholder approval of any golden parachute payments not previously approved. |
We may use these provisions until the last day of our fiscal year following the fifth anniversary of the completion of this offering. However, if certain events occur prior to the end of such five-year period, including if we become a “large accelerated filer,” our annual gross revenues exceed $1.0 billion or we issue more than $1.0 billion of non-convertible debt in any three-year period, we will cease to be an emerging growth company prior to the end of such five-year period.
We have elected to take advantage of certain of the reduced disclosure obligations in the registration statement of which this prospectus is a part and may elect to take advantage of other reduced reporting requirements in future filings. As a result, the information that we provide to our stockholders may be different than you might receive from other public reporting companies in which you hold equity interests.
The JOBS Act provides that an emerging growth company can take advantage of an extended transition period for complying with new or revised accounting standards. We have irrevocably elected not to avail ourselves of this exemption and, therefore, we will be subject to the same new or revised accounting standards as other public companies that are not emerging growth companies.
5
Table of Contents
| Common stock offered by us |
shares | |
| Common stock offered by the selling stockholders |
shares | |
| Common stock to be outstanding after this offering |
shares | |
| Over-allotment option offered by us |
shares | |
| Use of proceeds |
We estimate that we will receive net proceeds of approximately $ million (or approximately $ million if the underwriters exercise their over-allotment option in full) from the sale of the shares of common stock offered by us in this offering, based on an assumed initial public offering price of $ per share (the midpoint of the price range set forth on the cover page of this prospectus), and after deducting the estimated underwriting discounts and commissions and estimated offering expenses payable by us. We intend to use the net proceeds that we receive from this offering primarily for general corporate purposes, including working capital, sales and marketing activities, product development, general and administrative matters, and capital expenditures, although we do not currently have any specific or preliminary plans with respect to use of proceeds for such purposes. We also currently intend to use approximately $ million of the net proceeds we receive from this offering to prepay the entirety of the outstanding indebtedness, including applicable prepayment penalties, under our existing debt obligations, though our intentions to prepay our debt obligations may change due to market or other factors. We also may use a portion of the net proceeds that we receive to acquire complementary businesses, products, services or technologies; however, we do not have agreements or commitments for any specific acquisitions at this time. See “Use of Proceeds.”
We will not receive any proceeds from the sale of shares to be offered by the selling stockholders. See “Principal and Selling Stockholders.” | |
| Risk factors |
You should read the “Risk Factors” section of this prospectus for a discussion of certain of the factors to consider carefully before deciding to purchase any shares of our common stock. | |
| Proposed NASDAQ trading symbol | EASI | |
The number of shares of our common stock to be outstanding after this offering is based on 15,055,418 pro forma shares of common stock outstanding as of March 31, 2015, and excludes:
| • | 3,413,188 shares of common stock issuable upon the exercise of outstanding stock options as of March 31, 2015, at a weighted-average exercise price of $1.39 per share; |
6
Table of Contents
| • | 2,865,129 shares of our common stock reserved for future issuance under our 2015 Equity Incentive Plan (2015 plan), which will become effective as of the date of the effectiveness of the registration statement of which this prospectus forms a part, which includes (i) 215,129 shares of common stock reserved for issuance under our 2010 Equity Incentive Plan, as amended (2010 plan), and (ii) stock options exercisable for an aggregate of 48,500 shares that our Compensation Committee has approved to be granted in connection with the pricing of our initial public offering with an exercise price equal to the initial public offering price; |
| • | 530,000 shares of common stock reserved for future issuance under our 2015 employee stock purchase plan (2015 ESPP), which will become effective upon the execution and delivery of the underwriting agreement for this offering; |
| • | 111,505 shares of common stock issuable upon the exercise of convertible preferred stock warrants outstanding as of March 31, 2015, at an exercise price of approximately $5.19 per share; |
| • | 32,268 shares of common stock issuable upon the exercise of common stock warrants outstanding as of March 31, 2015, at an exercise price of approximately $15.50 per share; and |
| • | 75,752 shares of common stock issuable upon the exercise of common stock warrants outstanding as of March 31, 2015, at a weighted-average exercise price of approximately $16.37 per share, that terminate unless exercised immediately prior to the completion of this offering. |
Unless otherwise indicated, all information contained in this prospectus assumes or gives effect to:
| • | the filing of our amended and restated certificate of incorporation and the adoption of our amended and restated bylaws immediately prior to the completion of this offering; |
| • | no exercise by the underwriters of their option to purchase up to an additional shares of our common stock to cover over-allotments, if any; |
| • | the conversion of all our convertible preferred stock outstanding as of March 31, 2015 into an aggregate of 5,145,683 shares of our common stock immediately prior to the completion of this offering; |
| • | the 75-for-one reverse split of our common stock and our preferred stock that was effected on August 6, 2014; |
| • | the termination and cancellation of all 533,301 outstanding shares of our Series A-1 non-convertible preferred stock upon the completion of this offering; and |
| • | the automatic conversion of warrants to purchase 98,221 shares of our Series A-2 convertible preferred stock outstanding as of March 31, 2015 into warrants to purchase an aggregate of 111,505 shares of our common stock immediately prior to the completion of this offering. |
7
Table of Contents
SUMMARY CONSOLIDATED FINANCIAL DATA
The summary consolidated statements of operations data presented below for the years ended December 31, 2012, 2013 and 2014 are derived from our audited consolidated financial statements included elsewhere in this prospectus. The summary consolidated statements of operations data presented below for the three months ended March 31, 2014 and 2015, and the summary consolidated balance sheet data as of March 31, 2015, are derived from our unaudited interim consolidated financial statements included elsewhere in this prospectus. The unaudited interim consolidated financial statements were prepared on a basis consistent with our audited consolidated financial statements and, in the opinion of management, include all adjustments of a normal, recurring nature that are necessary for the fair presentation of the financial statements. The following summary consolidated financial data should be read with “Management’s Discussion and Analysis of Financial Condition and Results of Operations” and our consolidated financial statements and related notes included elsewhere in this prospectus. Our historical results are not necessarily indicative of the results that may be expected for any period in the future, and the results for the three months ended March 31, 2015 are not necessarily indicative of results to be expected for the full year 2015 or any future period.
| Year Ended December 31, | Three Months Ended March 31, |
|||||||||||||||||||
| 2012 | 2013 | 2014 | 2014 | 2015 | ||||||||||||||||
| (Unaudited) | ||||||||||||||||||||
| (In thousands, except share and per share data) | ||||||||||||||||||||
| Consolidated statements of operations data: |
||||||||||||||||||||
| Revenues: |
||||||||||||||||||||
| Product |
$ | 11,843 | $ | 26,111 | $ | 65,086 | $ | 12,265 | $ | 19,658 | ||||||||||
| Service |
1,840 | 3,666 | 2,294 | 1,312 | 417 | |||||||||||||||
|
|
|
|
|
|
|
|
|
|
|
|||||||||||
| Total revenues |
13,683 | 29,777 | 67,380 | 13,577 | 20,075 | |||||||||||||||
|
|
|
|
|
|
|
|
|
|
|
|||||||||||
| Cost of revenues(1): |
||||||||||||||||||||
| Product |
8,707 | 14,968 | 37,366 | 7,040 | 11,178 | |||||||||||||||
| Service |
373 | 748 | 636 | 420 | 190 | |||||||||||||||
|
|
|
|
|
|
|
|
|
|
|
|||||||||||
| Total cost of revenues |
9,080 | 15,716 | 38,002 | 7,460 | 11,368 | |||||||||||||||
|
|
|
|
|
|
|
|
|
|
|
|||||||||||
| Gross profit |
4,603 | 14,061 | 29,378 | 6,117 | 8,707 | |||||||||||||||
|
|
|
|
|
|
|
|
|
|
|
|||||||||||
| Operating expenses(1): |
||||||||||||||||||||
| Research and development |
11,898 | 13,026 | 13,870 | 3,038 | 3,701 | |||||||||||||||
| Sales and marketing |
4,494 | 4,834 | 5,711 | 1,183 | 1,331 | |||||||||||||||
| General and administrative |
2,543 | 3,076 | 5,449 | 746 | 2,491 | |||||||||||||||
|
|
|
|
|
|
|
|
|
|
|
|||||||||||
| Total operating expenses |
18,935 | 20,936 | 25,030 | 4,967 | 7,523 | |||||||||||||||
|
|
|
|
|
|
|
|
|
|
|
|||||||||||
| Income (loss) from operations |
(14,332 | ) | (6,875 | ) | 4,348 | 1,150 | 1,184 | |||||||||||||
| Interest expense |
(1,042 | ) | (935 | ) | (1,443 | ) | (301 | ) | (445 | ) | ||||||||||
| Other income (expense), net |
72 | 12 | (836 | ) | (88 | ) | (38 | ) | ||||||||||||
|
|
|
|
|
|
|
|
|
|
|
|||||||||||
| Income (loss) before income taxes |
(15,302 | ) | (7,798 | ) | 2,069 | 761 | 701 | |||||||||||||
| Benefit from (provision for) income taxes |
(57 | ) | (44 | ) | (3,216 | ) | (360 | ) | 5 | |||||||||||
|
|
|
|
|
|
|
|
|
|
|
|||||||||||
| Net income (loss) |
$ | (15,359 | ) | $ | (7,842 | ) | $ | (1,147 | ) | $ | 401 | $ | 706 | |||||||
| Add/(Less): Capital contribution from/(deemed dividend to) common stockholders(2) |
83,386 | (338 | ) | — | — | — | ||||||||||||||
| Less: Undistributed earnings allocated to preferred stockholders |
— | — | — | (401 | ) | (706 | ) | |||||||||||||
|
|
|
|
|
|
|
|
|
|
|
|||||||||||
| Net income (loss) attributable to common stockholders |
$ | 68,027 | $ | (8,180 | ) | $ | (1,147 | ) | $ | — | $ | — | ||||||||
|
|
|
|
|
|
|
|
|
|
|
|||||||||||
| Net income (loss) per share attributable to common stockholders(3): |
||||||||||||||||||||
| Basic |
$ | 213.75 | $ | (0.90 | ) | $ | (0.12 | ) | $ | 0.00 | $ | 0.00 | ||||||||
|
|
|
|
|
|
|
|
|
|
|
|||||||||||
| Diluted |
$ | (4.06 | ) | $ | (0.90 | ) | $ | (0.12 | ) | $ | 0.00 | $ | 0.00 | |||||||
|
|
|
|
|
|
|
|
|
|
|
|||||||||||
| Weighted-average common shares used in computing net income (loss) per share attributable to common stockholders(3): |
||||||||||||||||||||
| Basic |
318,249 | 9,066,797 | 9,518,377 | 9,436,046 | 9,682,424 | |||||||||||||||
|
|
|
|
|
|
|
|
|
|
|
|||||||||||
| Diluted |
3,786,303 | 9,066,797 | 9,518,377 | 9,436,046 | 9,682,424 | |||||||||||||||
|
|
|
|
|
|
|
|
|
|
|
|||||||||||
| Pro forma net income (loss) attributable to common stockholders (unaudited)(3) |
$ | (364 | ) | $ | 545 | |||||||||||||||
|
|
|
|
|
|||||||||||||||||
| Pro forma net income (loss) per share attributable to common stockholders (unaudited)(3): |
||||||||||||||||||||
| Basic |
$ | (0.02 | ) | $ | 0.04 | |||||||||||||||
|
|
|
|
|
|||||||||||||||||
| Diluted |
$ | (0.02 | ) | $ | 0.03 | |||||||||||||||
|
|
|
|
|
|||||||||||||||||
| Pro forma weighted-average common shares used in computing net income (loss) per share attributable to common stockholders (unaudited)(3): |
||||||||||||||||||||
| Basic |
14,664,060 | 14,828,107 | ||||||||||||||||||
|
|
|
|
|
|||||||||||||||||
| Diluted |
14,664,060 | 17,828,111 | ||||||||||||||||||
|
|
|
|
|
|||||||||||||||||
8
Table of Contents
| (1) | Stock-based compensation included in the consolidated statements of operations data above was as follows: |
| Year Ended December 31, | Three Months Ended March 31, | |||||||||||||||||||
| 2012 | 2013 | 2014 | 2014 | 2015 | ||||||||||||||||
| (Unaudited) | ||||||||||||||||||||
| (In thousands) | ||||||||||||||||||||
| Cost of product revenues |
$ | 1 | $ | 5 | $ | 5 | $ | 1 | $ | 1 | ||||||||||
| Research and development |
75 | 256 | 485 | 33 | 141 | |||||||||||||||
| Sales and marketing |
17 | 485 | 286 | 12 | 70 | |||||||||||||||
| General and administrative |
150 | 573 | 558 | 40 | 136 | |||||||||||||||
|
|
|
|
|
|
|
|
|
|
|
|||||||||||
| Total |
$ | 243 | $ | 1,319 | $ | 1,334 | $ | 86 | $ | 348 | ||||||||||
|
|
|
|
|
|
|
|
|
|
|
|||||||||||
| (2) | See Note 6 to our consolidated financial statements appearing elsewhere in this prospectus for an explanation of the capital contribution from/(deemed dividend to) common stockholders. |
| (3) | See Notes 1 and 8 to our consolidated financial statements appearing elsewhere in this prospectus for an explanation of the calculations of our basic and diluted net income (loss) per share attributable to common stockholders and our basic and diluted pro forma net income (loss) per share attributable to common stockholders. |
Our consolidated balance sheet as of March 31, 2015 is presented on:
| • | an actual basis; |
| • | a pro forma basis, giving effect to the automatic conversion of all outstanding shares of our convertible preferred stock into 5,145,683 shares of common stock, the related reclassification of the preferred stock warrant liability to additional paid-in capital and the effectiveness of our amended and restated certificate of incorporation as of immediately prior to the completion of this offering, as if such conversion had occurred and our amended and restated certificate of incorporation had become effective on March 31, 2015; and |
| • | a pro forma as adjusted basis, giving effect to the pro forma adjustments and the sale of shares of common stock by us in this offering, based on an assumed initial public offering price of $ per share (the midpoint of the price range reflected on the cover page of this prospectus) after deducting the estimated underwriting discounts and commissions and estimated offering expenses payable by us. |
The pro forma as adjusted information set forth in the table below is illustrative only and will be adjusted based on the actual initial public offering price and other terms of this offering determined at pricing.
| As of March 31, 2015 | ||||||||||
| Actual | Pro Forma | Pro Forma As Adjusted(1) | ||||||||
| (Unaudited; In thousands) | ||||||||||
| Consolidated balance sheet data: |
||||||||||
| Cash and cash equivalents |
$ | 9,222 | $ | 9,222 | ||||||
| Working capital |
17,710 | 17,710 | ||||||||
| Total assets |
41,179 | 41,179 | ||||||||
| Total deferred revenues |
374 | 374 | ||||||||
| Total non-current income taxes payable |
3,079 | 3,079 | ||||||||
| Total capital lease, non-current portion |
221 | 221 | ||||||||
| Total long-term debt, non-current portion |
15,024 | 15,024 | ||||||||
| Vendor financing arrangement |
1,302 | 1,302 | ||||||||
| Convertible preferred stock warrant liabilities |
1,042 | — | ||||||||
| Total preferred stock |
41,286 | — | ||||||||
| Total stockholders’ equity (deficit) |
(33,974 | ) | 8,354 | |||||||
| (1) | Each $1.00 increase or decrease in an assumed initial public offering price of $ per share, which is the midpoint of the price range set forth on the cover page of this prospectus, would increase or decrease, as |
9
Table of Contents
| applicable, our pro forma as adjusted cash and cash equivalents, working capital, total assets and total stockholders’ equity (deficit) by $ million, assuming the number of shares offered by us, as set forth on the cover page of this prospectus, remains the same, and after deducting the estimated underwriting discounts and commissions and estimated offering expenses payable by us. Each one million increase (decrease) in the number of shares offered by us as set forth on the cover page of this prospectus, would increase (decrease) each of our cash and cash equivalents, working capital (deficit), total asset, additional paid-in capital, and total stockholders’ equity by approximately $ million, assuming that the assumed initial public offering price of $ per share, which is the midpoint of the estimated offering price range reflected on the cover page of this prospectus, remains the same and after deducting the estimated underwriting discounts and commissions and estimated offering expenses payable by us. |
Non-GAAP financial measures
We use the financial measures set forth below, which are non-GAAP financial measures, to help us analyze our financial results, establish budgets and operational goals for managing our business and to evaluate our performance. We also believe that the presentation of these non-GAAP financial measures in this prospectus provides an additional tool for investors to use in comparing our core business and results of operations over multiple periods with other companies in our industry, many of which present similar non-GAAP financial measures to investors. However, the non-GAAP financial measures presented in this prospectus may not be comparable to similarly titled measures reported by other companies due to differences in the way that these measures are calculated. The non-GAAP financial measures presented in this prospectus should not be considered as the sole measure of our performance and should not be considered in isolation from, or as a substitute for, comparable financial measures calculated in accordance with GAAP. The financial measures set forth below also contain certain comparable GAAP financial measures.
| Year Ended December 31, | Three Months Ended March 31, | |||||||||||||||||||
| 2012 | 2013 | 2014 | 2014 | 2015 | ||||||||||||||||
| (Unaudited) | ||||||||||||||||||||
| (In thousands, except percentages) | ||||||||||||||||||||
| GAAP gross profit |
$ | 4,603 | $ | 14,061 | $ | 29,378 | $ | 6,117 | $ | 8,707 | ||||||||||
| GAAP gross margins |
34 | % | 47 | % | 44 | % | 45 | % | 43 | % | ||||||||||
| Non-GAAP gross profit |
$ | 4,604 | $ | 14,066 | $ | 29,383 | $ | 6,118 | $ | 8,708 | ||||||||||
| Non-GAAP gross margins |
34 | % | 47 | % | 44 | % | 45 | % | 43 | % | ||||||||||
| GAAP income (loss) from operations |
$ | (14,332 | ) | $ | (6,875 | ) | $ | 4,348 | $ | 1,150 | $ | 1,184 | ||||||||
| GAAP operating margin (loss) |
(105 | %) | (23 | %) | 6 | % | 9 | % | 6 | % | ||||||||||
| Non-GAAP income (loss) from operations |
$ | (14,089 | ) | $ | (5,556 | ) | $ | 5,682 | $ | 1,236 | $ | 1,532 | ||||||||
| Non-GAAP operating margin (loss) |
(103 | %) | (19 | %) | 8 | % | 9 | % | 8 | % | ||||||||||
| Adjusted EBITDA |
$ | (13,609 | ) | $ | (5,010 | ) | $ | 6,589 | $ | 1,385 | $ | 1,959 | ||||||||
| Adjusted EBITDA margin |
(99 | %) | (17 | %) | 10 | % | 10 | % | 10 | % | ||||||||||
| Cash flow provided by (used in) operating activities |
$ | (10,442 | ) | $ | (13,478 | ) | $ | 542 | $ | (74 | ) | $ | 1,461 | |||||||
| Free cash flow |
$ | (10,966 | ) | $ | (15,607 | ) | $ | (4,774 | ) | $ | (1,852 | ) | $ | 1,100 | ||||||
Non-GAAP gross profit and margins. We define non-GAAP gross profit as gross profit as reported on our consolidated statements of operations, excluding the impact of stock-based compensation, which is a non-cash charge. We define non-GAAP gross margins as non-GAAP gross profit divided by revenues. We have presented non-GAAP gross profit and margins because we believe that the exclusion of stock-based compensation allows for more accurate comparisons of our results of operations to other companies in our industry. Please see “Management’s Discussion and Analysis of Financial Condition and Results of Operations—Non-GAAP Financial Measures” for information regarding the limitations of using non-GAAP gross profit and gross margin as financial measures and for a reconciliation of non-GAAP gross profit to gross profit, the most directly comparable financial measure calculated in accordance with U.S. generally accepted accounting principles (GAAP).
10
Table of Contents
Non-GAAP income (loss) from operations and operating margin (loss). We define non-GAAP income (loss) from operations as income (loss) from operations as reported on our consolidated statements of operations, excluding the impact of the stock-based compensation, which is a non-cash charge. We define non-GAAP operating margin (loss) as non-GAAP income (loss) from operations divided by revenues. We have presented non-GAAP income (loss) from operations and operating margin (loss) because we believe that the exclusion of stock-based compensation gain allows for more accurate comparisons of our results of operations to other companies in our industry. Please see “Management’s Discussion and Analysis of Financial Condition and Results of Operations—Non-GAAP Financial Measures” for information regarding the limitations of using non- GAAP income (loss) from operations and operating margin (loss) as financial measures and for a reconciliation of non-GAAP income (loss) from operations to income (loss) from operations, the most directly comparable financial measure calculated in accordance with GAAP.
Adjusted EBITDA and adjusted EBITDA margin. We define adjusted EBITDA as our net loss excluding: (1) stock-based compensation; (2) interest expense; (3) other income (expense), net, which primarily includes changes in value of preferred stock warrant liabilities and foreign exchange gains and losses; (4) depreciation and amortization; and (5) our provision for income taxes. We define adjusted EBITDA margin as adjusted EBITDA divided by revenues. We have presented adjusted EBITDA and adjusted EBITDA margin because we believe it is an important measure used by industry analysts and investors to compare our performance against our peer group and analyze our cash generation performance. In particular, we believe that the exclusion of the expenses eliminated in calculating adjusted EBITDA can provide a useful measure for period-to-period comparisons of our core operating performance. Please see “Management’s Discussion and Analysis of Financial Condition and Results of Operations—Non-GAAP Financial Measures” for information regarding the limitations of using adjusted EBITDA and adjusted EBITDA margin as financial measures and for a reconciliation of adjusted EBITDA to net loss, the most directly comparable financial measure calculated in accordance with GAAP.
Free cash flow. We define free cash flow as net cash provided by operating activities less property and equipment purchases, including certain mask sets. We consider free cash flow to be a liquidity measure that provides useful information to management and investors about the amount of cash generated by the business that, after capital purchases, can be used for strategic opportunities, including investing in our business, making strategic acquisitions, and strengthening the balance sheet. Please see “Management’s Discussion and Analysis of Financial Condition and Results of Operations—Non-GAAP Financial Measures” for more information and a reconciliation of free cash flow to cash flow provided used in operating activities, the most directly comparable financial measure calculated and presented in accordance with GAAP.
11
Table of Contents
Investing in our common stock involves a high degree of risk. You should carefully consider the risks and uncertainties described below, together with all of the other information in this prospectus, including our consolidated financial statements and related notes and “Management’s Discussion and Analysis of Financial Condition and Results of Operations,” before investing in our common stock. If any of the following risks are realized, in whole or in part, our business, financial condition, results of operations and prospects could be materially and adversely affected. In that event, the price of our common stock could decline, and you could lose part or all of your investment. Additional risks and uncertainties not presently known to us or that we currently deem immaterial also may impair our business operation.
Risks Related to Our Business and Our Industry
We depend on a limited number of customers for a substantial majority of our revenues. If we fail to retain or expand our customer relationships, our revenues would decline significantly.
We derive a substantial majority of our revenues from a limited number of customers. We believe that our operating results for the foreseeable future will continue to depend on sales to relatively small number of customers. In 2012, 2013, 2014 and the first three months of 2015, Ericsson Inc. (Ericsson) and Seagate Technology plc (Seagate) together accounted for 73%, 87%, 93% and 95%, respectively, of our total revenues. In the future, these significant customers may decide not to purchase our custom IC solutions at all, may purchase fewer units than they did in the past or may alter their purchasing patterns by replacing or substituting our IC solutions with different or lower cost solutions. For example, Ericsson, which represented approximately 62% and 79% of our total revenues in 2014 and the first three months of 2015, respectively, announced their intention to develop certain stock-keeping units for products using alternative solutions which will compete with stock-keeping units which utilize our solution. Over time, the alternative stock-keeping units may decrease the revenue and market acceptance of the stock-keeping units with our solution built in. While we expect the stock-keeping units with our solution to remain in production for the foreseeable future and expect to secure other design wins with Ericsson in the future, we cannot provide assurance that this will occur, and lower than expected sales of stock-keeping units with our solution or a failure to achieve design wins in the future would have an adverse impact on our revenues and harm our financial condition and results of operations.
In addition, our relationships with some customers may deter other potential customers that compete with these customers from buying our solutions. The loss of a key customer, such as Ericsson or Seagate, a reduction in sales to any key customer or the cancellation of a substantial order could happen at any time with limited notice, which in turn would negatively impact our revenues and harm our financial condition and results of operations. Further, the primary markets in which we participate including the wireless and wired infrastructure communications and storage markets, are highly concentrated in the number of companies that serve those markets. As a result, we expect that a high percentage of our revenues will be attributable to a small number of customers in these highly concentrated markets for the foreseeable future.
Our success and future revenues depend on us winning designs with our customers, and those customers designing our solutions into their product offerings and successfully selling and marketing such products. If we do not continue to win designs in the short term, our revenues in the following years will deteriorate.
We sell our custom IC solutions to original equipment manufacturer (OEM) customers that include our solutions in their hardware products. Our technology is generally incorporated into products at the design stage, which we refer to as a design win. As a result, our future revenues depend on our OEM customers designing our custom ICs into their products, and on those products being produced in volume and successfully commercialized. If we fail to convince our current or prospective OEM customers to include our custom ICs in their products and fail to achieve a consistent number of design wins, our results of operations and business will be harmed. In addition, if a current or prospective customer designs a competitor’s offering into its product, it becomes significantly more difficult for us to sell our custom IC solutions to that OEM because changing suppliers involves significant cost, time, effort and risk for the OEM. Even if an OEM customer designs one of
12
Table of Contents
our custom ICs into its product, we cannot be assured that the OEM’s product will be commercially successful over time or at all or that we will receive or continue to receive any revenues from that customer. Because of our extended sales cycle, our revenues in future years are highly dependent on design wins we are awarded today. For example, we are currently shipping a majority of our revenues from design wins that we were awarded more than 12 months ago, and it is typical that a design win today will not result in meaningful revenues until one year or later, if at all. If we do not continue to win designs in the short term, our revenues in the following years will deteriorate.
The design win process is generally a lengthy, expensive and competitive process, with no guarantee of revenue, and if we fail to generate sufficient revenues to offset our expenses, our business and operating results would suffer.
Achieving a design win is typically a lengthy, expensive and competitive process because our customers generally take a considerable amount of time to evaluate our custom IC solutions. The time from early engagement by our sales force to actual product introduction typically runs from 21 to 24 months for our current end markets, though it may take longer for new customers or markets we intend to address. In order to win designs, we are required to both incur design and development costs and dedicate substantial engineering resources in pursuit of a single customer opportunity. Even though we incur these costs, we may not prevail in the competitive selection process and, even if we do achieve a design win, we may never generate sufficient, or any, revenues to offset our development expenditures. For example, some of our end customers’ products may have short life cycles which would limit our ability to recoup our upfront expenditures for those customers’ products. In addition, for certain very high production volume ICs, customers may determine, and have in the past determined, that their products do not require our solution to address the needs of their consumers, and therefore use a standard ASIC from another supplier rather than our custom solution. The extent to which our solution is used will vary depending on a number of factors, many of which are out of our control. As a result, despite incurring significant expenses in the development and design of our custom IC solution for a particular customer, we may not be able to generate revenues to offset those expenses or at all to the extent that customer decides to choose an alternative supplier solution over ours.
Our customers have the option to decide whether or not to put our solutions into production after we have completed our design and prototype work. The delays inherent in our protracted sales cycle increase the risk that a customer will decide to cancel, curtail, reduce or delay its product plans, causing us to lose anticipated revenues. In addition, any change, delay or cancellation of a customer’s plans could harm our financial results, as we may have incurred significant expense while generating no revenues. For example, in August 2014, a large customer cancelled a program that included our product for which we had already produced a successful prototype custom IC and were beginning production of our customized IC in anticipation of substantial customer orders. This cancellation resulted in no return on the significant operating expenses we incurred and the write off of certain production assets, which had a negative impact on our gross margins and our quarterly results of operations.
Fluctuations in the mix of our custom IC products that we sell may adversely affect our financial results.
The average selling price, or ASP, for each of our ASIC designs can be determined by a number of factors, including the complexity of the design, the customer’s application, the customer’s relative negotiation power and the volume levels to be produced. ASPs are negotiated either when the initial design is awarded by the customer, or during annual negotiation cycles between us and the customer. Because of the wide price differences among our custom IC products, the mix of the ICs we sell affects the average selling price of such products and has a substantial impact on our revenues and gross margins. We offer custom ICs with both higher and lower gross margins in our eASIC platform and ASIC products designed using our easicopy or standard ASIC methodologies. A significant shift in the mix from high margin custom ICs to low margin custom ICs would have a material impact on our overall gross margins. Fluctuations in the mix and types of our products may also affect the extent to which we are able to recover our fixed costs and investments that are associated with a particular product, and as a result could adversely affect our financial results.
13
Table of Contents
The average selling prices of products in our markets have historically decreased over time and may do so in the future, which could harm our revenues and gross margins.
Average selling prices of semiconductor products in the markets we serve have historically decreased over time. Our revenues come from sales to large customers that have expectations of annual reductions in their purchase price. The average selling prices of our products generally decline as the products mature. In addition, our solutions are designed to address markets requiring high volumes of chips for their products and, at certain high volume levels, our competitors may offer our customers lower cost standard ASICs for their products. Although we can often address these customers’ needs through our easicopy ASICs or a standard ASIC methodology, our customers may design other solutions into their products. In addition, in order to compete with these lower-cost chips, we may be forced to lower the average selling prices of our solutions.
We seek to offset the reductions in our average selling prices and increase gross margins by reducing the development cost of our IC solutions, developing new or enhanced lower-cost solutions on a timely basis and increasing unit sales. However, there is no guarantee that our efforts will be successful or that they will keep pace with the decline in selling prices of our products, which could ultimately lead to a decline in our revenues and have a negative effect on our gross margins. We may also not be able to increase our sales volume of these lower-cost solutions or achieve the necessary volume of production that would lead to further per unit cost reductions. We expect that we will have to continue to address pricing pressures in the future, which could require us to reduce the prices of our solutions and harm our operating results. If we are unsuccessful in reducing our costs, developing new or enhanced products on a timely basis with higher selling prices or gross profits or increasing our volumes, our business will be harmed.
The complexity of our custom IC solutions could result in unforeseen delays or expenses from undetected defects, erroneous spins or other bugs which could adversely affect our operating costs, reduce the market adoption of our solutions and damage our reputation with current or prospective customers.
Our custom IC solutions are very complex. Given this complexity, our IC solutions have in the past and may in the future contain defects, errors and bugs in production and when they are first introduced or as new versions are released. These defects, errors or bugs could interrupt or delay sale to customers, thus delaying or reducing our revenues. If we incorrectly design a custom IC solution, we may need to modify such solution, which could require significant expenditures and would negatively impact our return on investment. Moreover, if such modifications negatively impact our customers’ product plans, our customers may cancel their program that uses our solution. For example, although the impact to our revenues for this particular case was minimal, in the third quarter of 2014, a customer cancelled a program due to a number of respins that led them to cancel their product plans. If any of our custom IC solutions have reliability, quality or compatibility problems, we may not be able to successfully correct these problems in a timely manner, or at all. If defects, errors or bugs are not found until late in the design cycle or even after we have commenced commercial production of a new product, we may incur significant additional development costs and product recall, repair or replacement costs. These problems may also result in claims against us by our customers or others. Any defects, errors or bugs may damage our reputation and harm our ability to retain existing customers or attract new customers, which in turn would adversely affect our business and financial results.
The success of our custom IC solutions is dependent on our customers’ ability to develop products that achieve market acceptance and are free of design flaws, and our customers’ failure to do so could have a material adverse effect on our business.
The success of our custom IC solutions is heavily dependent on the timely introduction, quality and market acceptance of our customers’ products incorporating our solutions. Our customers’ products are often very complex and subject to design complexities that may result in design flaws, as well as potential defects, errors and bugs. We have in the past been subject to delays and project cancellations as a result of design flaws in the products developed by our customers. In the past we have also been subject to delays and project cancellations as a result of changing market requirements, such as the customer adding a new feature, or because a customer’s
14
Table of Contents
product fails their end customer’s evaluation or field trial. Other times customer products are delayed due to incompatible deliverables or shortages in component parts from other vendors. We incur significant design and development costs in connection with designing our custom IC solutions for customers’ products and if our customers discover design flaws, defects, errors or bugs, in their products, or if they experience changing market requirements, failed evaluations or field trials, or incompatible deliverables or shortages in component parts from other vendors, they may delay, change or cancel a project, and we may have incurred significant additional development costs and may not be able to recoup our costs, which in turn would adversely affect our business and financial results.
Our target markets may not grow or develop as we currently expect, and if we fail to penetrate new markets and scale successfully within those markets, our revenues and financial condition would be harmed.
Approximately 87% of our revenues for 2013 and 94% of our revenues for 2014 were derived from customers participating in the wireless communications infrastructure and storage markets. Any deterioration in these markets or reduction in capital spending to support these markets could lead to a reduction in demand for our products, which would adversely affect our revenues and results of operations. Our operating results are increasingly affected by trends in these end markets, including increased demand for customization, faster time-to-market, lower costs and lower power consumption, and increased integration of functions into standard ASICs. We may be unable to predict the timing or development of trends in these end markets with any accuracy. While certain of these trends have been beneficial to us, it may not be the case in the future with other end market trends. A market shift towards a standard that we may not support could significantly decrease the demand for our solutions. If our target markets do not grow or develop in ways that we currently expect, demand for our technology may not materialize as expected and our business and operating results would suffer.
In the past several years, a significant amount of our revenues have been generated from sales of our solutions to customers that develop wireless communication infrastructure and storage products. Our future revenue growth, if any, will depend in part on our ability to expand within our existing markets, but also to enter new markets, such as the wired communication infrastructure, medical, and industrial markets. Each of these markets presents distinct and substantial challenges and risks and, in many cases, requires us to develop new customized solutions to address the particular requirements of that market. Meeting the technical requirements and securing design wins in any of these new markets will require a substantial investment of our time and resources. We cannot assure you that we will secure design wins from these or other new markets, or that we will achieve meaningful revenues from sales with these markets. Some of these markets are primarily served by only a few large, multinational OEMs with substantial negotiating and buying power relative to us and, in some instances, with internally developed silicon solutions that can be competitive to our products. If any of these markets do not develop as we currently anticipate or if we are unable to penetrate them and scale in them successfully, our future revenues would decline and our business would be negatively affected.
We may experience difficulties demonstrating the value to customers of newer, higher priced and higher margin solutions if they believe existing solutions are adequate to meet end customer expectations, and to that extent our business would be harmed.
As we develop and introduce new solutions, we face the risk that customers may not value or be willing to bear the cost of incorporating these newer solutions into their products, particularly if they believe their customers are satisfied with current solutions. Regardless of the improved features or superior performance of the newer solutions, customers may be unwilling to adopt our new solutions due to design or pricing constraints. Because of the extensive time and resources that we invest in developing new solutions, if we are unable to sell customers new generations of our solutions, our revenues could decline and our business, financial condition, results of operations and cash flows would be negatively affected.
15
Table of Contents
Our business depends substantially on our customers purchasing additional solutions from us. Any decline in our customer retention or expansion could harm our future results of operations.
As a critical component of maintaining or improving our results of operations, it is important that our customers purchase additional solutions from us after their initial orders. This may require increasingly sophisticated and costly sales efforts and may not result in additional sales. In addition, the rate at which our customers purchase additional solutions depends on a number of factors, including the perceived need for additional solutions for their product plans as well as general economic conditions. If our efforts to sell additional solutions to our customers are not successful, our business could suffer.
Our VMI inventory strategy subjects us to risk of revenue volatility, which could negatively impact our operating results.
Substantially all of our sales are made on a Vendor Managed Inventory (VMI) basis in which we maintain our product inventory at a customer specified location, which we refer to as a hub. Title to that inventory transfers to our customer, and revenues are recognized, when our products are “pulled” from our hub locations by, or delivered to, our customers, the timing for which is entirely determined by our customers. We invoice our customer when this pull transaction occurs. This VMI arrangement causes us to carry a significant amount of inventory on our balance sheet and extends our cash collection cycle. Moreover, our customers are generally not required to make any certain level of purchases within any given quarter and our customers typically do not provide us with firm, long-term purchase commitments, however, we do have certain contractual protections for inventory levels mandated by the customer. A substantial majority of our sales are made on a just-in-time basis through the hub. Accordingly, our customers may make frequent changes to their levels of product purchases with little or no notice to us and without penalty, which may include reductions, cancellations or delays in their product purchases. These changes make our revenues and gross margins volatile from period to period, as they will be highly dependent on the production schedules of our customers. Because production lead times often exceed the amount of time required by our customers to place their orders, we often must build our custom IC solutions in advance of the actual placement of orders, relying on an imperfect demand forecast to project volumes and customer mix. In addition, we maintain the risk of loss on such inventory, and though we cover insurance for lost inventory, such insurance may not be sufficient to cover any losses we may incur.
Our customers generally provide us with non-binding six-month rolling forecasts of their supply needs, and these forecasts vary significantly for each customer and for each six-month period. Accordingly, we have limited visibility as to our customers’ supply needs for more than two quarters out and those forecasts can vary widely from period to period and even within any quarterly period or periods, and as a result, are not always reliable indicators of future demand. In addition, our revenues are small relative to the large markets that we serve. As a result, we have limited understanding of the customer or end-user market drivers that could impact our revenue from one quarter to the next. As a result, our ability to accurately forecast demand is limited and can be adversely affected by a number of factors, including:
| • | inaccurate forecasting by our customers; |
| • | miscalculations by our customers of their inventory requirements; |
| • | changes in market conditions; and |
| • | fluctuations in demand for our customers’ products. |
Even after a forecast is received, our customers may not place orders or pull inventory from our hub locations. Forecasting our gross margins is difficult because a significant portion of our business is based on multiple pulls by large customers from a hub within the same quarter. If we fail to accurately forecast demand for our solutions or such demand is lower than we expect, then our anticipated sales may not materialize on schedule or at all, and we may experience unanticipated revenue volatility or shortfalls and could possess excess or obsolete inventory or lack sufficient inventory that we may be unable to sell to other customers, any of which could have an adverse impact on our business.
16
Table of Contents
If we or our customers are unable to project customer requirements accurately, we may not build enough units due to the long lead times for our products from our foundries, which could lead to delays in product shipments and lost sales opportunities in the near term, as well as force our customers to identify alternative solutions, including designing us out of their products, which could affect our ongoing relationships with these customers and decrease our revenues. We have in the past had customers significantly increase their requested production quantities with little or no advance notice. If we do not fulfill customer demands in a timely manner, our customers may cancel their orders, decrease their future orders, or not pull from our hub locations. In addition, the rapid pace of innovation in our industry could render portions of our inventory obsolete. Excess or obsolete inventory levels could result in unexpected expenses or increases in our reserves that could adversely affect our business, results of operations and financial condition.
Our gross margins may fluctuate due to a variety of factors, which could negatively impact our gross margins, results of operations and our financial condition.
Our gross margins may fluctuate due to a number of factors, including customer mix, market acceptance of our new products, yield, wafer pricing, competitive pricing dynamics, and geographic and market segment pricing strategies.
Further, because we are so dependent on a few large customers, these customers have significant leverage with respect to negotiating pricing and other terms with us and may put downward pressure on our margins. To attract new customers or retain existing customers, we have in the past and will in the future offer certain customers favorable prices on our solutions, which would decrease our average selling prices and may impact gross margins. To retain our revenues levels, we may also be forced to offer pricing incentives to our customers to incent them to continue current production levels or cancel or delay their cost reduction programs. For example, during the fourth quarter of 2014, we negotiated with one of our largest customers for a reduction in future pricing based on that customer having increased its forecasted purchase volume.
In addition, as we capitalize the cost of certain of our base arrays after we have tested the technological feasibility of the array and estimated market demand for products using the tested array, a subsequent determination that those base arrays will not be successful in the market would result in our expensing those assets to our cost of goods sold, which would hurt our gross margins and harm our financial condition and results of operations in the period we make that determination.
Because we do not operate our own manufacturing, assembly or testing facilities, we may not be able to reduce our costs as rapidly as companies that operate their own facilities, and our costs may even increase, which could further reduce our gross margins. We rely primarily on obtaining yield improvements and volume-based cost reductions to drive cost reductions in the manufacture of existing products, introducing new products that incorporate advanced features and optimize die size, and other price and performance factors that enable us to increase revenues while maintaining consistent margins. To the extent that such cost reductions and new product introductions do not occur in a timely manner, or to the extent that our products do not achieve market acceptance at prices with higher margins, our financial condition and results of operations could be adversely affected.
In addition, we maintain inventory of our products at various stages of production and in finished good inventory. We hold these inventories in anticipation of customer orders. If those customer orders do not materialize we may have excess or obsolete inventory which we would have to reserve or write off. In such case, our gross margins would be adversely affected.
If we are unable to successfully develop and introduce new products which achieve market acceptance, we may fail to maintain or increase our market share, which in turn would harm our competitive position and our business and operating results.
Our success depends in large part on our ability to develop and introduce new products based on our custom IC solutions that address customer requirements and compete effectively on the basis of price, functionality and
17
Table of Contents
performance. The success of new product introductions is dependent upon several factors, including:
| • | our ability to anticipate customer needs and determine market demand; |
| • | our ability to develop products that effectively address those needs and achieve our customers’ strategic goals; |
| • | timely completion and first pass success of new product designs; |
| • | customer acceptance of advanced features in our new products; |
| • | our ability to utilize advanced manufacturing process technologies on circuit geometries of 28nm and smaller; |
| • | our ability to develop and support our internally developed software design tools; |
| • | our ability to obtain advanced packaging; |
| • | our ability to generate new design opportunities and design wins; |
| • | the availability of specialized field application engineering resources supporting demand creation and customer adoption of new products; |
| • | our ability to compete successfully with the price, performance, functionality and power characteristics of alternative solutions such as standard ASICs, ASSPs or FPGAs; and |
| • | the timely introduction, quality and market acceptance of our customers’ products. |
Our product research and development efforts may not be successful and our new products may not address the needs of our current and prospective customers or achieve market acceptance. Revenues relating to our mature products are expected to decline in the future, which is normal for our product life cycles. As of March 31, 2015, substantially all of our revenues were from 45 nanometer or older process nodes from which we have been selling and shipping products since the third quarter of 2008. We estimate the life of each eASIC platform process technology to be at least eight years. As the process technology matures, we become increasingly dependent on revenues derived from design wins from newer process technologies as well as anticipated cost reductions in the manufacture of our current products. To the extent that such new product introductions do not occur in a timely manner, or to the extent that our products do not achieve market acceptance at prices with acceptable margins, our financial condition and results of operations would be adversely affected. In addition, we have only recently begun selling our 28 nanometer process node generation of our eASIC platform. As a result, revenues from our 28 nanometer process node products are just beginning to ramp. While we have been able to demonstrate to our customers certain levels of reductions in power consumption, increased performance or lower design and manufacturing time, the number of instances where we have had the opportunity to demonstrate such results to date has been limited. We cannot be certain that we will be able to demonstrate to our customers the same level of reductions in power consumption, increased performance or lower design and manufacturing time that we have seen to date or that such relative comparisons will not change over time. Accordingly, this generation of our eASIC platform has not generated significant revenues to date and may not achieve broad market adoption.
Our eASIC platform relies on base arrays which require significant expenditures and may not meet market requirements or be commercially successful.
Our solutions incorporate the architecture of our eASIC platform which relies on our versatile, pre-defined and reusable base array of standard mask layers and an adaptable single mask layer which is layered into the base array, and customized using our proprietary software tools. This platform requires substantial capital expenditures that we have historically funded with our own working capital. If the custom ICs that we have developed, or which we may develop in the future, based on our eASIC platform do not meet the requirements of our customers or otherwise gain market acceptance, then we will not experience revenue growth and our business and results of operations will be harmed. In addition, as we capitalize the cost of certain of our base arrays after we have tested the technological feasibility of the array and estimated market demand for products using the
18
Table of Contents
tested array, a subsequent determination that those base arrays will not be successful in the market would result in our expensing those assets to our cost of goods sold, which would hurt our gross margins and harm our financial condition and results of operations in the period we make that determination. Because we have expended, and expect to continue to expend, a substantial amount of our resources on the development of our eASIC platform and the base arrays utilized in our platform, we may not have sufficient cash to fund base arrays that are commercially viable or that will increase or sustain the market acceptance of our solutions, which could harm our revenues and competitive position.
If we fail to compete effectively, we may lose or fail to gain market share, which could negatively impact our operating results and our business.
The global semiconductor market in general, and the wireless communications infrastructure and storage markets in particular, are highly competitive. We compete in different target markets on the basis of a number of competitive factors. We expect competition to increase and intensify as additional semiconductor companies enter our markets, and as internal silicon design resources of large OEMs grow. Increased competition could result in price pressure, reduced gross margins and loss of market share, any of which could harm our business, revenues and results of operations.
Our competitors range from large, international companies offering a wide range of semiconductor products to smaller companies specializing in narrow market verticals. In our markets, our primary competitors are Altera, Avago, Broadcom, Marvell, Toshiba and Xilinx. We expect competition in our current markets to increase in the future as existing competitors improve or expand their product offerings and as new competitors enter these markets.
Our ability to compete successfully depends on elements both within and outside of our control, including industry and general economic trends. Many of our competitors are substantially larger, have greater financial, technical, marketing, distribution, customer support and other resources, are more established than we are and have significantly better brand recognition and broader product offerings which may enable them to better withstand adverse economic or market conditions in the future and reducing their pricing so as to compete against us. Our ability to compete successfully will depend on a number of factors, including:
| • | our ability to define, design and regularly introduce new products that anticipate the functionality and integration needs of our customers’ next-generation products and applications; |
| • | our ability to build strong and long-lasting relationships with our customers and other industry participants; |
| • | our ability to capitalize on, and prevent losses due to, vertical integration by significant customers, including Ericsson and Seagate; |
| • | our solutions’ performance and cost-effectiveness relative to that of competing products; |
| • | our ability to convince customers of our capability to create lower cost standard ASICs using our easicopy methodology, if and when required by the customer; |
| • | the effectiveness and success of our customers’ products utilizing our solutions within their competitive end markets; |
| • | our research and development capabilities to provide innovative solutions and maintain our product roadmap; |
| • | the strength of our sales and marketing efforts, and our brand awareness and reputation; |
| • | our ability to deliver products in volume on a timely basis at competitive prices; |
| • | our ability to expand international operations in a cost-effective manner; |
| • | our ability to protect our IP and obtain IP rights from third parties that may be necessary to meet the evolving demands of the market; |
19
Table of Contents
| • | our ability to promote and support our customers’ incorporation of our solutions into their products; |
| • | our ability to continue to develop products at each new technology node; and |
| • | our ability to retain high-level talent, including our management team and engineers. |
Our competitors may also establish cooperative relationships among themselves or with third parties or acquire companies that provide similar products to ours. As a result, new competitors or alliances may emerge that could acquire significant market share. Any of these factors, alone or in combination with others, could harm our business and result in a loss of market share and an increase in pricing pressure. In addition, a number of our competitors are able to sell their solutions through multiple channels, including through distributors and third-party sales organizations, while we rely primarily on direct sales, which may provide our competitors with a strategic advantage in sales of their solutions and could harm our prospects and business.
Our industry is subject to rapidly changing standards. We may be unable to make the substantial investments that are required to remain competitive in our business.
We design certain of our products to conform to current industry standards. Some industry standards may not be widely adopted or implemented uniformly, and competing standards may emerge that may be preferred by our customers or by our third party suppliers. If our customers or our third-party suppliers adopt new or competing industry standards with which our solutions are not compatible, or if the industry groups fail to adopt standards with which our solutions are compatible, our existing solutions would become less desirable to our current or prospective customers. As a result, our sales would suffer, and we could be required to make significant expenditures to develop new solutions. In addition, existing standards may be challenged as infringing upon the intellectual property rights of other companies or may be superseded by new innovations or standards.
The semiconductor industry requires substantial investment in research and development in order to bring to market new and enhanced solutions. Our research and development expense was $11.9 million, $13.0 million, $13.9 million, and $3.7 million for the years ended December 31, 2012, 2013 and 2014 and the three months ended March 31, 2015, respectively. We expect to increase our research and development expenditures as compared to prior periods as part of our strategy to increase demand for our solutions in our current markets and expanding into additional markets. We are a small company with limited resources, and limited experience achieving revenues. We may not have sufficient resources to maintain the level of investment in research and development required to remain competitive. In addition, we cannot assure you that the technologies which are the focus of our research and development expenditures will become commercially successful or generate any revenues.
If we fail to continue to develop internal design tools to differentiate our products, our future growth and revenues could suffer.
We have our own internally developed and maintained software design tools, which we refer to as eTools, that we and our customers use to design the single mask layer that is incorporated into our eASIC Nextreme product family. We depend on eTools to differentiate our custom IC solutions. We must enhance these tools when we advance to each new technology node, and potentially when we add new intellectual property (IP) into our base arrays. If we are unable to continue to develop and support these tools, including maintaining and increasing the usability of the tools by our customers, then our ability to retain existing customers and attract new ones could decline, which would harm our financial results and negatively impact our results of operations.
We rely on third parties to provide software tools and technology necessary for our solutions and on third-party services for the operation of our business. Any failure of one or more of our vendors, suppliers or licensors to provide such tools, technology or services could harm our business.
We rely on third-party software tools to assist us in the design and verification of new solutions, and we incorporate third-party technology into some of our solutions. To bring new solutions and enhancements to
20
Table of Contents
market in a timely manner, or at all, we need software and hardware development tools that are sophisticated enough or technologically advanced enough to complete our design and verifications. The design requirements necessary to meet consumer demands for solutions we may develop in the future may exceed the capabilities of the software design tools available today or that we may develop in the future. This, in turn, may result in our missing design cycles or losing design wins, either of which could result in a loss of market share or negatively impact our results of operations.
Our solutions often require that we invest in third-party IP to meet certain market expectations on functionality requirements, which can be expensive to procure and integrate into our products. If we select the wrong IP to integrate into our products, or we cannot obtain such IP on reasonable terms, we may not meet our revenue growth expectations, or we may be forced to write off the value of that IP and our financial results, cash flows and business would be harmed.
The commercial viability of our custom IC solutions could be impaired if errors occur in the third-party technology we use or if we are unable to access third-party software tools. It may be more difficult for us to correct any errors in a timely manner, if at all, because the development and maintenance of the technology is not within our control. We cannot assure you that these third parties will continue to make their technology, or improvements to the technology, available to us, or that they will continue to support and maintain their technology. For example, in 2012, one of our key partners, Magma Design Automation, Inc., which provided us with critical software tools for the production of our 90nm eASIC Nextreme platform, was acquired by Synopsys, Inc. Synopsys notified us of their intent to discontinue support for that product. Subsequently, we moved designs to the 45nm, which eliminated our need for this software. Further, due to the limited number of vendors of some types of technology, it may be time-consuming or expensive to obtain new licenses or replace existing technology. Any impairment of the technology of or our relationship with these third parties could harm our business.
We also rely on third-party vendors to provide critical design services and services for our operations that we cannot or do not create or provide ourselves. Although we believe that adequate substitutes are currently available, we depend on these vendors to consistently meet our business requirements. The ability of these third-party vendors to successfully provide reliable and high-quality services is subject to technical and operational uncertainties that are beyond our control. While we may be entitled to damages if our vendors fail to perform under their agreements with us, our agreements with these vendors may limit the amount of damages we may receive. In addition, we do not know whether we will be able to collect on any damages, and there is no guarantee that any award of damages we do collect would be sufficient to cover the actual costs we would incur or for which we may be liable to our customers as a result of any vendor’s failure to perform under its agreement with us. We may not be able to replace the services provided to us by any third-party vendors in a timely manner or on terms and conditions, including service levels and cost, that are favorable to us, and a transition from one vendor to another vendor could subject us to operational delays and inefficiencies until the transition is complete. Any disruption in critical services provided by these third-party vendors could harm our financial results and negatively impact our results of operations.
We depend on third parties for substantially all of our manufacturing operations, including our wafer fabrication, assembly and testing operations which exposes us to certain risks that may harm our business.
We rely on third parties for substantially all of our manufacturing production and operations, including wafer fabrication, assembly and testing. Although we use multiple third-party supplier sources, we depend on these third parties to supply us with material of a requested quantity in a timely manner that meets our standards for yield, cost and manufacturing quality. We do not have any long-term supply agreements with any of our manufacturing suppliers. These third-party manufacturers often serve customers that are larger than us or require a greater portion of their services, which may decrease our relative importance and negotiating leverage with these third parties.
21
Table of Contents
If market demand for wafers exceeds foundry capacity, if market demand for wafers or production and assembly materials increases, or if a supplier of our wafers ceases or suspends operations, our supply of wafers and other materials could become limited. Such shortages of wafers and materials as well as increases in wafer or materials prices could adversely affect our gross margins and could adversely affect our ability to meet customer demands in a timely manner, or at all, and lead to reduced revenues. Moreover, wafers constitute a large portion of our product cost. If we are unable to purchase wafers at favorable prices, our gross margins would be adversely affected.
To ensure continued wafer supply, we may be required to establish other wafer supply sources as these arrangements become economically advantageous or technically necessary, which could require significant expenditures and limit our negotiating leverage. In addition, only a few foundry vendors have the capability to manufacture our most advanced solutions. If we engage alternative supply sources, we may encounter start-up difficulties and incur additional costs. In addition, shipments could be significantly delayed while these sources are qualified for volume production.
Certain of our solutions are manufactured or tested in a single location, or a few locations. Certain of these facilities are located internationally, where we are subject to increased risk of political and economic instability, difficulties in managing operations, difficulties in enforcing contracts and our intellectual property rights, and employment and labor difficulties. Any of these factors could result in manufacturing and supply problems, and delays in our ability to provide our solutions to our customers on a timely basis. If we experience manufacturing problems at a particular location, we may be required to transfer manufacturing to a new location or supplier. Converting or transferring manufacturing from a primary location or supplier to a backup fabrication facility could be expensive and could take two or more quarters. During such a transition, we would be required to meet customer demand from our then-existing inventory, as well as any partially finished goods that could be modified to the required product specifications. We do not seek to maintain sufficient inventory to address a lengthy transition period because we believe it is uneconomical to keep more than minimal inventory on hand. As a result, we may not be able to meet customer needs during such a transition, which could delay shipments, cause production delays, result in a decline in our sales and damage our customer relationships.
If one or more of these vendors terminates its relationship with us, or if we encounter any problems with our manufacturing supply chain, our ability to ship our solutions to our customers on time and in the quantity required would be adversely affected, which in turn could cause an unanticipated decline in our sales and damage our customer relationships.
If our foundries do not achieve satisfactory yields or quality, our reputation and customer relationships could be harmed.
We depend not only on sufficient foundry manufacturing capacity and wafer prices, but also on good production yields (the number of good die per wafer) and timely wafer delivery to meet customer demand and maintain profit margins. The fabrication of our products is a complex and technically demanding process. Minor deviations in the manufacturing process can cause substantial decreases in yields, and in some cases, cause production to be suspended. Our foundry vendors, Fujitsu, Global Foundries (GF) and Taiwan Semiconductor Manufacturing Company (TSMC), collectively our foundries, from time to time, experience manufacturing defects and reduced manufacturing yields. Changes in manufacturing processes or the inadvertent use of defective or contaminated materials by our foundries could result in lower than anticipated manufacturing yields or unacceptable performance of our devices. Many of these problems are difficult to detect at an early stage of the manufacturing process and may be time consuming and expensive to correct. Poor yields from our foundries, or defects, integration issues or other performance problems in our solutions, could cause us significant customer relations and business reputation problems, harm our financial results and give rise to financial or other damages to our customers. Our customers might consequently seek damages from us for their losses. A product liability claim brought against us, even if unsuccessful, would likely be time consuming and costly to defend.
22
Table of Contents
We may experience difficulties in transitioning to new wafer fabrication process technologies or in achieving higher levels of design integration, which may result in reduced manufacturing yields, delays in product deliveries and increased costs.
We aim to use the most advanced manufacturing process technology appropriate for our solutions that is available from our third-party foundries. As a result, we periodically evaluate the benefits of migrating our solutions to other technologies in order to improve performance and reduce costs. These ongoing efforts require us from time to time to modify the manufacturing processes for our products and to redesign some products, which in turn may result in delays in product deliveries. We may face difficulties, delays and increased expense as we transition our products to new processes, and potentially to new foundries. We depend on our foundries as the principal foundries for our solutions, to transition to new processes successfully. We cannot assure you that our foundries will be able to effectively manage such transitions or that we will be able to maintain our relationship with our foundries or develop relationships with new foundries. If we or any of our foundries experience significant delays in transitioning to smaller geometries or fail to efficiently implement transitions, we could experience reduced manufacturing yields, delays in product deliveries and increased costs, any of which could harm our relationships with our customers and our operating results.
We have a limited history of profitability, and we may not achieve or sustain profitability in the future, on a quarterly or annual basis.
We incurred net loss for 2013 and 2014 in the amount of $7.8 million and $1.1 million, respectively. Even though we earned net income of $0.7 million for the three months ended March 31, 2015, our accumulated deficit was $45.7 million as of March 31, 2015. We expect to make significant expenditures related to the development of our products and expansion of our business, including research and development and sales and administrative expenses. Additionally, we may encounter unforeseen difficulties, complications, product delays and other unknown factors that may require additional expenditures. As a result of these expenditures, we may not generate sufficient revenues to achieve profitability.
If we do not sustain our growth rate, we may not be able to execute our business plan and our operating results and stock price could suffer.
We have recently experienced significant growth. Our revenues increased from $29.8 million in fiscal year 2013 to $67.4 million in fiscal year 2014, representing an annual growth rate of 126%. We do not expect to continue to grow at these historical percentage rates, and we may not be able to grow or sustain our revenues at all in the future. In addition, we expect expenses to increase substantially in the near term, particularly as we make significant investments in research and development and our sales and marketing organization, and expand our operations and infrastructure both domestically and internationally. In addition, in connection with operating as a public company, we will incur additional significant legal, accounting and other expenses that we did not incur as a private company. If our revenues do not increase to offset these increases in our operating expenses, we may not be profitable in future periods.
Our historical revenue growth should not be considered indicative of our future performance. You should not rely on our revenue growth, gross margins or operating results for any prior quarterly or annual periods as an indication of our future operating performance. If we are unable to maintain adequate revenue growth, our results of operations could suffer and our stock price could decline.
If we are unable to manage our future growth, we may not be able to execute our business plan and our operating results could suffer.
Our business has grown rapidly. Our future operating results depend to a large extent on our ability to successfully manage any expansion and growth, including the challenges of managing a company with headquarters in the United States and a large percentage of our employees and consultants in Malaysia, Romania
23
Table of Contents
and Russia. To manage our growth successfully and handle the responsibilities of being a public company, we believe we must, among other things, effectively:
| • | enhance our information technology systems for enterprise resource planning and design engineering by adapting and expanding our capabilities, and properly training new hires as to their use; |
| • | effectively recruit, hire, train and manage additional qualified engineers for our research and development activities, particularly in our foreign offices and especially for the positions of semiconductor design and systems and applications engineering; |
| • | build out our internal infrastructure and implement and improve our administrative, financial, management and operational systems, procedures and controls to scale with the business; |
| • | add additional sales, business development, finance and accounting personnel and retain such personnel; |
| • | protect and further develop our strategic assets, including our intellectual property rights; and |
| • | make business decisions in light of the scrutiny associated with operating as a public company. |
We may not be able to manage our future growth in an efficient or timely manner, or at all. In particular, any failure to successfully implement systems enhancements and improvements will likely have a negative impact on our ability to manage our expected growth, as well as our ability to ensure uninterrupted operation of key business systems and comply with the rules and regulations that are applicable to public reporting companies. If we are unable to manage our growth effectively, we may not be able to take advantage of market opportunities or develop new solutions, and we may fail to satisfy customer product or support requirements, maintain the quality of our solutions, execute our business plan or respond to competitive pressures, which could negatively affect our brand, results of operations and overall business.
A significant portion of our operations are located outside of the United States, which subjects us to additional risks, including increased complexity and costs of managing international operations and geopolitical instability.
We have research and development design centers in Malaysia, Romania and Russia, and we expect to continue to conduct business with companies that are located outside the United States, particularly in Eastern Europe and Asia. Our customers based in the United States often use contract manufacturers based in Eastern Europe or Asia to manufacture their products, and these contract manufacturers typically purchase products directly from us. As a result of our international focus, we face numerous challenges and risks, including:
| • | increased complexity and costs of managing international operations, including design and manufacture of our products; |
| • | more difficult collection of receivables and longer collection cycles; |
| • | difficulties in enforcing contracts generally; |
| • | geopolitical and economic instability and military conflicts; |
| • | limited protection of our intellectual property and other assets; |
| • | compliance with local laws and regulations and unanticipated changes in local laws and regulations, including tax laws and regulations; |
| • | trade and foreign exchange restrictions and higher tariffs; |
| • | timing and availability of import and export licenses and other governmental approvals, permits and licenses, including export classification requirements; |
| • | foreign currency fluctuations and exchange losses relating to our international operating activities; |
24
Table of Contents
| • | restrictions imposed by the U.S. government or foreign governments on our ability to do business with certain companies or in certain countries as a result of international political conflicts and the complexity of complying with those restrictions; |
| • | transportation delays and other consequences of limited local infrastructure, and disruptions, such as large scale outages or interruptions of service from utilities or telecommunications providers; |
| • | difficulties in staffing international operations; |
| • | local business and cultural factors that differ from our normal standards and practices; |
| • | differing employment practices and labor relations; |
| • | heightened risk of terrorist acts; |
| • | regional health issues, travel restrictions and natural disasters; and |
| • | work stoppages. |
We depend on our executive officers and other key employees and the loss of one or more of these employees or an inability to attract and retain highly skilled employees could adversely affect our business.
Our success depends largely upon the continued services of our executive officers and other key employees. From time to time, there may be changes in our executive management team, which could disrupt our business. We do not have employment agreements with our executive officers or other key personnel that require them to continue to work for us for any specified period and, therefore, they could terminate their employment with us at any time. The loss of one or more of our executive officers, especially our Chief Executive Officer, Chief Technology Officer, or other key employees could have an adverse effect on our business.
In addition, to execute our growth plan, we must attract and retain highly qualified personnel. Competition for these personnel in the San Francisco Bay Area, where our headquarters is located, and in other locations where we maintain offices, is intense, especially for engineers experienced in designing and developing semiconductor solutions. We have, from time to time experienced, and we expect to continue to experience, difficulty in hiring and retaining employees with appropriate qualifications. Many of the companies with which we compete for experienced personnel have greater resources than we have. If we hire employees from competitors or other companies, their former employers may attempt to assert that these employees or we have breached legal obligations, resulting in a diversion of our time and resources if we respond to them. In addition, job candidates and existing employees often consider the value of the equity awards they receive in connection with their employment. If the perceived value of our equity awards declines, it may adversely affect our ability to recruit and retain highly skilled employees. If we fail to attract new personnel or fail to retain and motivate our current personnel, our business and future growth prospects could be adversely affected.
We are an “emerging growth company,” and we cannot be certain whether the reduced reporting requirements applicable to emerging growth companies will make our shares of common stock less attractive to investors.
We are an “emerging growth company,” as defined in the Jumpstart Our Business Startups Act (JOBS Act), enacted in April 2012. For as long as we continue to be an emerging growth company, we may take advantage of exemptions from various reporting requirements that are applicable to public companies that are not emerging growth companies, including not being required to comply with the auditor attestation requirements of Section 404 of the Sarbanes-Oxley Act of 2002 (Sarbanes-Oxley Act), reduced disclosure obligations regarding executive compensation in our periodic reports and proxy statements, exemptions from the requirements of holding a nonbinding advisory vote on executive compensation, and stockholder approval of any golden parachute payments, which we do not currently have. We could be an emerging growth company for up to five years, although we will lose that status sooner if our annual revenues exceed $1 billion, if we issue more than $1 billion in non-convertible debt in a three year period, or if the market value of our shares of common stock
25
Table of Contents
held by non-affiliates exceeds $700 million (measured as of the last business day of our second fiscal quarter each year). We cannot predict if investors will find our shares of common stock less attractive because we may rely on these exemptions. If some investors find our shares of common stock less attractive as a result, there may be a less active trading market for our shares of common stock and our stock price may be more volatile.
Under the JOBS Act, emerging growth companies can also delay adopting new or revised accounting standards until such time as those standards apply to private companies. We have irrevocably elected not to avail ourselves of this exemption from new or revised accounting standards and, therefore, will be subject to the same new or revised accounting standards as other public companies that are not emerging growth companies.
Our management has limited public company experience and may not be able to effectively or efficiently manage or transition to a public company.
We have never operated as a public company and will incur significant legal, accounting and other expenses that we did not incur as a private company. The individuals who constitute our management team have limited experience managing a publicly traded company and limited experience complying with the increasingly complex and changing laws pertaining to public companies. Our management team and other personnel will need to devote a substantial amount of time to compliance, and we may not effectively or efficiently manage our transition into a public company.
We have in the past identified material weaknesses in our internal controls over financial reporting that, if not properly remediated, could result in material misstatements in our financial statements in future periods and impair our ability to comply with the accounting and reporting requirements applicable to public companies.
Our independent registered public accounting firm has not conducted an audit of our internal controls over financial reporting. However, in connection with the audit of our consolidated financial statements for 2012 to 2013, and the review of the nine month period ending September 30, 2014, we identified two material weaknesses in our internal control over financial reporting, as defined in the standards established by the Public Company Accounting Oversight Board of the United States. A material weakness is a deficiency, or a combination of deficiencies, in internal control over financial reporting such that there is a reasonable possibility that a material misstatement of our annual or interim financial statements will not be prevented or detected on a timely basis. The identified material weaknesses related to (1) our lack of sufficient, qualified personnel in accounting and financial reporting functions with sufficient experience and expertise with respect to the application of U.S. GAAP and related financial reporting during the fiscal years 2012 and 2013, and (2) our controls over the preparation of the provision for income taxes, resulting principally from the allocation of certain costs from our U.S. parent to one of our foreign subsidiaries which resulted in an adjustment to our income tax provision for the nine months ended September 30, 2014. Please see “Management’s Discussion and Analysis of Financial Condition and Results of Operations—Internal Control Over Financial Reporting” for information regarding our remediation efforts. Our management and independent registered public accounting firm did not and were not required to perform an evaluation of our internal control over financial reporting as of and for the years ended December 31, 2012, 2013 and 2014 in accordance with the provisions of the JOBS Act.
While we believe that we have put in place additional controls over our accounting close procedures, including adding additional staff, adding additional reviews and approvals over monthly provisions, including our income tax provision, our remediation efforts are still in process and have not yet been tested. Therefore, we cannot assure you that the material weaknesses in our internal control over financial reporting have been fully remediated as of March 31, 2015. In addition, we cannot be certain that any such measures we undertake will successfully remediate those two material weaknesses or that other material weaknesses and control deficiencies will not be discovered in the future. If our remediation efforts are not successful or other material weaknesses or control deficiencies occur in the future, we may be unable to report our financial results accurately or on a timely basis, which could cause our reported financial results to be materially misstated and result in the loss of investor confidence or delisting and cause the trading price of our common stock to decline. As a result of such failures,
26
Table of Contents
we could also become subject to investigations by the stock exchange on which our securities are listed, the SEC, or other regulatory authorities, and become subject to litigation from investors and stockholders, which could harm our reputation, financial condition or divert financial and management resources from our core business.
As a result of becoming a public company, we are subject to additional regulatory compliance requirements, including Section 404 of the Sarbanes-Oxley Act, and if we fail to maintain an effective system of internal controls, we may not be able to accurately report our financial results or prevent fraud.
Rules and regulations such as the Sarbanes-Oxley Act have increased our legal and finance compliance costs and made some activities more time consuming and costly. For example, Section 404 of the Sarbanes-Oxley Act requires that our management report on, and our independent auditors attest to, the effectiveness of our internal control structure and procedures for financial reporting. Effective internal controls are necessary for us to provide reliable financial reports and effectively prevent fraud. Section 404 compliance may divert internal resources and will take a significant amount of time and effort to complete. We may not be able to successfully complete the procedures and certification and attestation requirements of Section 404 by the time we will be required to do so. However, our auditors will not be required to formally attest to the effectiveness of our internal control over financial reporting pursuant to Section 404 until we are no longer an “emerging growth company” as defined in the JOBS Act if we take advantage of the JOBS Act exemptions available to us. In addition, these Sarbanes-Oxley Act requirements may be modified, supplemented or amended from time to time. Implementing these changes may take a significant amount of time and may require specific compliance training of our personnel. In the future, we may discover areas of our internal controls that need improvement. If our auditors or we discover a material weakness or significant deficiency, the disclosure of that fact, even if quickly remedied, could reduce the market’s confidence in our financial statements and harm our stock price. Any inability to provide reliable financial reports or prevent fraud would harm our business. We may not be able to effectively and timely implement necessary control changes and employee training to ensure continued compliance with the Sarbanes-Oxley Act and other regulatory and reporting requirements. If we fail to successfully complete the procedures and certification and attestation requirements of Section 404, or if in the future our Chief Executive Officer, Chief Financial Officer or independent registered public accounting firm determines that our internal controls over financial reporting are not effective as defined under Section 404, we could be subject to investigations or sanctions by the NASDAQ Stock Market (NASDAQ), the Securities and Exchange Commission (SEC) or other regulatory authorities. Furthermore, investor perceptions of our company may suffer, and this could cause a decline in the market price of our shares of common stock. We cannot assure you that we will be able to fully comply with the requirements of the Sarbanes-Oxley Act or that management or our auditors will conclude that our internal controls are effective in future periods. Irrespective of compliance with Section 404, any failure of our internal controls could have a material adverse effect on our stated results of operations and harm our reputation.
If we fail to hire additional finance personnel, strengthen our financial reporting systems and infrastructure, and improve our enterprise resource planning (ERP) system, we may not be able to timely and accurately report our financial results or comply with the requirements of being a public company, including compliance with the Sarbanes-Oxley Act and SEC reporting requirements.
We intend to hire additional accounting and finance personnel with system implementation experience and Sarbanes-Oxley Act compliance expertise. Any inability to recruit and retain such finance personnel would have an adverse impact on our ability to accurately and timely prepare our financial statements. We may be unable to locate and hire qualified professionals with requisite technical and public company experience when and as needed. In addition, new employees will require time and training to learn our business and operating processes and procedures. If our finance and accounting organization is unable for any reason to respond adequately to the increased demands that will result from being a public company, the quality and timeliness of our financial reporting may suffer, which could result in the identification of material weaknesses in our internal controls. Any consequences resulting from inaccuracies or delays in our reported financial statements could cause the trading price of our shares of common stock to decline and could harm our business, operating results and financial condition.
27
Table of Contents
If we fail to strengthen our financial reporting systems, infrastructure and internal control over financial reporting to meet the demands that will be placed upon us as a public company, including the requirements of the Sarbanes-Oxley Act, we may be unable to report our financial results timely and accurately and prevent fraud. We expect to incur significant expense and devote substantial management effort toward ensuring compliance with Section 404.
We have to improve our current ERP system and in the future may need to implement a new ERP system. This will require significant investment of capital and human resources, the re-engineering of many processes of our business and the attention of many employees who would otherwise be focused on other aspects of our business. Any disruptions, delays or deficiencies in the design and implementation of the improvements to our current ERP system or a new ERP system, if needed, could result in potentially much higher costs than we had anticipated and could adversely affect our ability to develop and launch solutions, fulfill contractual obligations, file reports with the SEC in a timely manner, otherwise operate our business or otherwise impact our controls environment. Any of these consequences could have an adverse effect on our results of operations and financial condition.
Our failure to adequately protect our intellectual property rights could impair our ability to compete effectively or defend ourselves from litigation, which could harm our business, financial condition and results of operations.
Our success depends, in part, on our ability to protect our intellectual property. We rely primarily on patent, copyright, trademark and trade secret laws, as well as confidentiality and non-disclosure agreements and other contractual protections, to protect our proprietary technologies and know-how, all of which offer only limited protection. The steps we have taken to protect our intellectual property rights may not be adequate to prevent misappropriation of our proprietary information or infringement of our intellectual property rights, and our ability to prevent such misappropriation or infringement is uncertain, particularly in countries outside of the United States. As of March 31, 2015, we had 35 issued and allowed patents in the United States, 16 issued international patents and four pending and provisional patent applications in the United States. Even if the pending patent applications are granted, the rights granted to us may not be meaningful or provide us with any commercial advantage. For example, these patents could be opposed, contested, circumvented, designed around by our competitors or be declared invalid or unenforceable in judicial or administrative proceedings. The failure of our patents to adequately protect our technology might make it easier for our competitors to offer similar products or technologies. Our foreign patent protection is generally not as comprehensive as our U.S. patent protection and may not protect our intellectual property in some countries where our products are sold or may be sold in the future. Many U.S.-based companies have encountered substantial intellectual property infringement in foreign countries, including countries where we sell products. Even if foreign patents are granted, effective enforcement in foreign countries may not be available. If such an impermissible use of our intellectual property or trade secrets were to occur, our ability to sell our solutions at competitive prices may be adversely affected and our business, financial condition, results of operations and cash flows could be adversely affected.
The legal standards relating to the validity, enforceability and scope of protection of intellectual property rights are uncertain and evolving. We cannot assure you that others will not develop or patent similar or superior technologies or solutions, or that our patents, trademarks and other intellectual property will not be challenged, invalidated or circumvented by others.
Unauthorized copying or other misappropriation of our proprietary technologies could enable third parties to benefit from our technologies without paying us for doing so, which could harm our business. Monitoring unauthorized use of our intellectual property is difficult and costly. Although we are not aware of any unauthorized use of our intellectual property in the past, it is possible that unauthorized use of our intellectual property may have occurred or may occur without our knowledge. We cannot assure you that the steps we have taken will prevent unauthorized use of our intellectual property. Our failure to effectively protect our intellectual property could reduce the value of our technology in licensing arrangements or in cross-licensing negotiations.
We may in the future need to initiate infringement claims or litigation in order to try to protect our intellectual property rights. Litigation, whether we are a plaintiff or a defendant, can be expensive, time-consuming and may
28
Table of Contents
divert the efforts of our technical staff and management, which could harm our business, whether or not such litigation results in a determination favorable to us. Litigation also puts our patents at risk of being invalidated or interpreted narrowly and our patent applications at risk of not issuing. Additionally, any enforcement of our patents or other intellectual property may provoke third parties to assert counterclaims against us. If we are unable to protect our proprietary rights or if third parties independently develop or gain access to our or similar technologies, our business, revenue, reputation and competitive position could be harmed.
Third parties’ assertions of infringement of their intellectual property rights could result in our having to incur significant costs and cause our operating results to suffer.
The semiconductor industry is characterized by vigorous protection and pursuit of intellectual property rights and positions, which has resulted in protracted and expensive litigation for many companies. We expect that in the future, particularly as a public company with an increased profile and visibility, we may receive communications from others alleging our infringement of patents, trade secrets or other intellectual property rights. Lawsuits resulting from such allegations could subject us to significant liability for damages and invalidate our proprietary rights. Any potential intellectual property litigation also could force us to do one or more of the following:
| • | stop selling solutions or using technology that contain the allegedly infringing intellectual property; |
| • | lose the opportunity to license our technology to others or to collect royalty payments based upon successful protection and assertion of our intellectual property against others; |
| • | incur significant legal expenses; |
| • | pay substantial damages to the party whose intellectual property rights we may be found to be infringing; |
| • | redesign those products that contain the allegedly infringing intellectual property; or |
| • | attempt to obtain a license to the relevant intellectual property from third parties, which may not be available on reasonable terms or at all. |
Any significant impairment of our intellectual property rights from any litigation we face could harm our business and our ability to compete.
Any potential dispute involving our patents or other intellectual property could affect our customers, which could trigger our indemnification obligations to them and result in substantial expense to us.
In any potential dispute involving our patents or the intellectual property of others, our customers could also become the target of litigation. Our custom IC solutions are included in our customers’ products. Our agreements with customers and other third parties generally include indemnification or other provisions under which we agree to indemnify or otherwise be liable to them for losses suffered or incurred as a result of claims of intellectual property infringement, damages caused by us to property or persons, or other liabilities relating to or arising from our solutions, which include intellectual property from our customers’ designs. For example, in November 2014, we received a letter from counsel to Seagate notifying us that Seagate had been sued for patent infringement with respect to a Seagate product incorporating an eASIC product and asserting Seagate’s right to indemnification and defense costs pursuant to its agreement with us. Seagate subsequently agreed to limit our indemnification obligation for this specific matter to no more than $200,000, but large indemnity payments or damage claims from contractual breach in any such future matters could harm our business, operating results, and financial condition. From time to time, customers require us to indemnify or otherwise be liable to them for breach of confidentiality or failure to implement adequate security measures with respect to their intellectual property and trade secrets. Although we normally contractually limit our liability with respect to such obligations, we may still incur substantial liability related to them. Any litigation against our customers could trigger technical support and indemnification obligations under some of our agreements, which could result in substantial expense to us.
29
Table of Contents
In addition, other customers or end customers with whom we do not have formal agreements requiring us to indemnify them may ask us to indemnify them if a claim is made as a condition to awarding future design wins to us. Because most of our OEM customers are larger than we are and have greater resources than we do, they may be more likely to be the target of an infringement claim by third parties than we would be, which could increase our chances of becoming involved in a future lawsuit. If any such claims were to succeed, we might be forced to pay damages on behalf of our OEM customers that could increase our expenses, disrupt our ability to sell our solutions and reduce our revenues. Any dispute with a customer with respect to such obligations could have adverse effects on our relationship with that customer and other current and prospective customers, reduce demand for our solutions, and harm our business and results of operations. In addition to the time and expense required for us to supply support or indemnification to our customers, any such litigation could severely disrupt or shut down the business of our customers, which in turn could hurt our relations with our customers and cause the sale of our products to decrease.
We may be subject to warranty and product liability claims and to product recalls.
From time to time, we may be subject to warranty claims that may require us to make significant expenditures to replace our solutions, refund payments, defend these claims or pay damage awards. In the future, we may also be subject to product liability claims resulting from failure of our solutions. In the event of a warranty claim, we may also incur costs if we compensate the affected customer. Our product liability insurance is limited in amount and subject to significant deductibles. There is no guarantee that our insurance will be available or adequate to protect against all claims. We also may incur costs and expenses relating to a recall of one of our customers’ products containing one of our devices. The process of identifying a recalled product in consumer devices that have been widely distributed may be lengthy and require significant resources, and we may incur significant replacement costs, refund costs, contract damage claims from our customers and reputational harm. Costs or payments made in connection with warranty and product liability claims and product recalls could harm our financial condition and results of operations.
A breach of our security systems may damage our reputation and adversely affect our business.
Our security systems are designed to protect our customers’, suppliers’ and employees’ confidential information, as well as maintain the physical security of our facilities. We also rely on a number of third-party “cloud-based” service providers of corporate infrastructure services relating to, among other things, human resources, electronic communication services and some finance functions, and we are, of necessity, dependent on the security systems of these providers. Any security breaches or other unauthorized access by third parties to the systems of our cloud-based service providers or the existence of computer viruses in their data or software could expose us to a risk of information loss and misappropriation of confidential information. Accidental or willful security breaches or other unauthorized access by third parties to our information systems or facilities, or the existence of computer viruses in our data or software, could expose us to a risk of information loss and misappropriation of proprietary and confidential information. Any theft or misuse of this information could result in, among other things, unfavorable publicity, damage to our reputation, difficulty in marketing our products, allegations by our customers that we have not performed our contractual obligations, litigation by affected parties and possible financial obligations for liabilities and damages related to the theft or misuse of this information, any of which could have a material adverse effect on our business, financial condition, our reputation, and our relationships with our customers and partners. Since the techniques used to obtain unauthorized access or to sabotage systems change frequently and are often not recognized until launched against a target, we may be unable to anticipate these techniques or to implement adequate preventative measures.
We may make acquisitions in the future that could disrupt our business, cause dilution to our stockholders, reduce our financial resources and harm our business.
In the future, we may acquire other businesses, products or technologies. We have not made any acquisitions to date and do not have any agreements or commitments for any specific acquisition at this time. Our
30
Table of Contents
ability to make and successfully integrate acquisitions is unproven. If we complete acquisitions, we may not achieve the combined revenues, cost synergies or other benefits from the acquisition that we anticipate, strengthen our competitive position or achieve our other goals in a timely manner, or at all, and these acquisitions may be viewed negatively by our customers, financial markets or investors. In addition, any acquisitions we make may not lead to the target revenues or cost synergies expected and could lead to difficulties in integrating personnel, technologies and operations from the acquired businesses and in retaining and motivating key personnel from these businesses. Acquisitions may disrupt our ongoing operations, divert management from their primary responsibilities, subject us to additional liabilities, increase our expenses and adversely impact our business, results of operations, financial condition and cash flows. Acquisitions may also reduce our cash available for operations and other uses, and could also result in an increase in amortization expense related to identifiable assets acquired, potentially dilutive issuances of equity securities or the incurrence of debt, any of which could harm our business.
We are subject to the cyclical nature of the semiconductor industry.
The semiconductor industry is highly cyclical and is characterized by constant and rapid technological change, rapid product obsolescence, price erosion, evolving standards, short product life cycles and wide fluctuations in product supply and demand. The industry experienced a significant downturn during the most recent global recession. These downturns have been characterized by diminished product demand, production overcapacity, high inventory levels and accelerated erosion of average selling prices. Any future downturns in the semiconductor industry could harm our business and operating results. Furthermore, any significant upturn in the semiconductor industry could result in increased competition for access to third-party foundry and assembly capacity. We are dependent on the availability of this capacity to manufacture and assemble our products. None of our foundries has provided assurances that adequate capacity will be available to us in the future.
Deterioration of the financial conditions of our customers could adversely affect our operating results.
The deterioration of the financial condition of our customers could adversely impact our collection of accounts receivable. We regularly review the collectability and creditworthiness of our customers to determine an appropriate allowance for doubtful accounts. Based on our review of our customers, many of which are very large OEMs, we currently have no reserve for doubtful accounts. If our doubtful accounts, however, were to exceed our current or future allowance for doubtful accounts, our quarterly and long-term results of operations would be negatively impacted.
In preparing our financial statements, we make good faith estimates and judgments that may change or turn out to be erroneous, which could adversely affect our operating results for the periods in which we revise our estimates or judgments.
In preparing our financial statements in conformity with U.S. generally accepted accounting principles (GAAP), we must make estimates and judgments in applying our most critical accounting policies. Those estimates and judgments have a significant impact on the results we report in our consolidated financial statements. The most difficult estimates and subjective judgments that we make relate to revenue recognition, inventories, long-lived assets including manufacturing tooling, deferred tax assets and stock-based compensation. We base our estimates on historical experience, input from outside experts and on various other assumptions that we believe to be reasonable under the circumstances, the results of which form the basis for making judgments about the carrying values of assets and liabilities that are not readily apparent from other sources. We also have other key accounting policies that are not as subjective, and therefore, their application would not require us to make estimates or judgments that are as difficult, but which nevertheless could significantly affect our financial reporting. Actual results may differ materially from these estimates. If these estimates, judgments or their related assumptions change, our operating results for the periods in which we revise our estimates, judgments or assumptions could be adversely and perhaps materially affected.
31
Table of Contents
Changes to financial accounting standards may affect our results of operations and could cause us to change our business practices.
We prepare our consolidated financial statements to conform to GAAP. These accounting principles are subject to interpretation by the American Institute of Certified Public Accountants, the SEC and various bodies formed to interpret and create accounting rules and regulations. Changes in accounting rules can have a significant effect on our reported financial results and may affect our reporting of transactions completed before a change is announced. Changes to those rules or the questioning of current practices may adversely affect our financial results or the way we conduct our business.
Changes in effective tax rates or adverse outcomes resulting from any future audit of our income tax returns, or a delay or failure to implement planned changes to how we transact business internationally could adversely affect our results.
A change in our effective tax rate could have a significant adverse impact on our business, and an adverse outcome resulting from any future audit of our income or other tax returns could adversely affect our results. We are subject to income tax in the United States and numerous foreign jurisdictions. Significant judgment is required in evaluating and estimating our provision and accruals for these taxes. During the ordinary course of business, there are many transactions for which the ultimate tax determination is uncertain. Our effective tax rates could be adversely affected by earnings being lower than anticipated in countries where we have lower statutory rates and higher than anticipated in countries where we have higher statutory rates, by losses incurred in jurisdictions for which we are not able to realize the related tax benefit, by changes in foreign currency exchange rates, by entry into new business and geographies and changes to our existing businesses, by acquisitions (including integrations) and investments, and by changes in the valuation of our deferred tax assets and liabilities. In addition, our effective tax rate could be impacted by changes in the relevant tax, accounting and other laws, regulations, administrative practices, principles, and interpretations, including fundamental changes to the tax laws applicable to corporate multinationals. The United States, many countries in the European Union, and a number of other countries are actively considering changes in this regard. We may be subject to audits in various jurisdictions, and such jurisdictions may assess additional income tax liabilities against us. Although we believe our tax estimates are reasonable, the final outcome of any such future tax audits, if any, and any related litigation could be materially different from our historical income tax provisions and accruals. Developments in an audit, litigation, or the relevant laws, regulations, administrative practices, principles, and interpretations could have a material effect on our results of operations or cash flows in the period or periods for which that development occurs, as well as for prior and subsequent periods.
In addition, we are currently in the process of implementing changes to how we transact business internationally to align our operations with that of our customers and suppliers, most of whom conduct business internationally. Accordingly, we are in process of transitioning certain business functions and activities to our foreign entities, which will result in our revenue and profits from our international customers being recognized by our international entities. Such entities have lower effective tax rates than the United States and, accordingly, we anticipate the change will lower our overall consolidated effective tax rate. While we believe we will implement these changes consistent with the estimates used in the determination of our 2015 effective tax rate, we can provide no assurance that the changes will be completed according to our planned timing and that we will realize our estimated effective tax rate. Nor can we provide any assurance that even if our international changes are completed on time, that various tax jurisdictions will recognize the validity of the corresponding changes to our tax structure, and may challenge our tax structure by audit or other means. If our international business changes are not completed in the time we expect, or if the corresponding changes to our tax structure are found to be invalid by audit or other means, our effective tax rate will be higher than we expect, and our profitability after tax will be negatively impacted.
32
Table of Contents
Our loan agreements contain certain restrictive and financial covenants that may limit our operating flexibility.
Our Amended and Restated Venture Loan and Security Agreement with Horizon Technology Finance Corporation, Horizon Funding Trust 2013-1, DBD Credit Funding LLC and Fortress Credit Opportunities I, LP, dated September 12, 2014, and our Loan and Security Agreement with Silicon Valley Bank, as amended, dated as of September 29, 2010, both contain certain restrictive covenants that either limit our ability to, or require a mandatory prepayment in the event we, incur additional indebtedness and liens, merge with other companies or consummate certain changes of control, acquire other companies, make certain investments, pay dividends, transfer or dispose of assets, amend certain material agreements or enter into various specified transactions. Our loan agreements also contain certain financial covenants, including minimum revenues and maximum cash balance amounts to be held in foreign deposit accounts, and financial reporting requirements. Our obligations under the loan agreements are secured by all of our property, other than our intellectual property, with limited exceptions. We may not be able to generate sufficient cash flow or sales to meet the financial covenants or pay the principal and interest under our outstanding debt obligations. Furthermore, our future working capital, borrowings, or equity financing could be unavailable to repay or refinance the amounts outstanding under our current debt obligations. In the event of a liquidation, our lender would be repaid all outstanding principal and interest prior to distribution of assets to unsecured creditors, and the holders of our common stock would receive a portion of any liquidation proceeds only if all of our creditors, including our lender, were first repaid in full.
We cannot predict our future capital needs, and we may not be able to obtain additional financing to fund our operations.
We may need to raise additional funds in the future. Any required additional financing may not be available on terms acceptable to us, or at all. If we raise additional funds by issuing equity securities or convertible debt, investors may experience significant dilution of their ownership interest, and the newly-issued securities may have rights senior to those of the holders of our common stock. If we raise additional funds by obtaining loans from third parties, the terms of those financing arrangements may include negative covenants or other restrictions on our business that could impair our operational flexibility and would also require us to incur interest expense. If additional financing is not available when required or is not available on acceptable terms, we may have to scale back our operations or limit our production activities, and we may not be able to expand our business, develop or enhance our solutions, take advantage of business opportunities or respond to competitive pressures, which could result in lower revenues and reduce the competitiveness of our products.
Fluctuations in exchange rates between and among the currencies of the countries in which we do business could adversely affect our results of operations.
Our sales have been historically denominated in U.S. dollars. An increase in the value of the U.S. dollar relative to the currencies of the countries in which our customers operate could impair the ability of our customers to cost-effectively purchase or integrate our products into their devices, which may materially affect the demand for our solutions and cause these customers to reduce their orders, which in turn would adversely affect our revenues and business. We may in the future, if we increase operations in other currencies, experience foreign exchange gains or losses due to the volatility of other currencies compared to the U.S. dollar. Certain of our employees are located in Europe and Asia, principally Romania and Malaysia. Accordingly, a portion of our payroll as well as certain other operating expenses are paid in currencies other than the U.S. dollar. Our results of operations are denominated in U.S. dollars, and the difference in exchange rates in one period compared to another may directly impact period-to-period comparisons of our results of operations. Furthermore, currency exchange rates have been especially volatile in the recent past, and these currency fluctuations may make it difficult for us to predict our results of operations.
33
Table of Contents
Failure to comply with the laws associated with our activities outside of the United States could subject us to penalties and other adverse consequences.
We face significant risks if we fail to comply with anti-corruption laws and anti-bribery laws, including, without limitation, the U.S. Foreign Corrupt Practices Act of 1977, as amended (FCPA), the U.S. Travel Act and the UK Bribery Act 2010, that prohibit improper payments or offers of payment to foreign governments and political parties by us for the purpose of obtaining or retaining business. In many foreign countries, particularly in countries with developing economies, it may be a local custom that businesses operating in such countries engage in business practices that are prohibited by the FCPA or other applicable laws and regulations. We are in the early stages of implementing our FCPA compliance program and cannot assure you that all of our employees and agents, as well as those companies to which we outsource certain of our business operations, will not take actions in violation of our policies and applicable law, for which we may be ultimately held responsible. Any violation of these laws could result in severe criminal or civil sanctions and, in the case of the FCPA, suspension or debarment from U.S. government contracting, which could have an adverse effect on our reputation, business, financial condition and results of operations.
We, our customers and third-party contractors are subject to increasingly complex environmental regulations, and compliance with these regulations may delay or interrupt our operations and adversely affect our business.
We face increasing complexity in our procurement, design, and research and development operations as a result of requirements relating to the materials composition of our products. Failure to comply with these and similar laws and regulations could subject us to fines, penalties, civil or criminal sanctions, contract damage claims, or take-back of non-compliant products, which could harm our business, reputation and results of operations. The passage of similar requirements in additional jurisdictions or the tightening of these standards in jurisdictions where our products are already subject to such requirements could cause us to incur significant expenditures to make our products compliant with new requirements, or could limit the markets into which we may sell our products.
Some of our operations, as well as the operations of our contract manufacturers and foundries and other suppliers, are also regulated under various other federal, state, local, foreign and international environmental laws and requirements, including those governing, among other matters, the management, disposal, handling, use, labeling of, and exposure to hazardous substances, and the discharge of pollutants into the air and water. Liability under environmental laws can be joint and several and without regard to comparative fault. We cannot assure you that violations of these laws will not occur in the future, as a result of human error, accident, equipment failure or other causes. Environmental laws and regulations have increasingly become more stringent over time. We expect that our products and operations will be affected by new environmental requirements on an ongoing basis, which will likely result in additional costs, which could adversely affect our business.
Our failure to comply with present and future environmental, health and safety laws could cause us to incur substantial costs, result in civil or criminal fines and penalties or result in decreased revenues, any of which could adversely affect our results of operations. Failure by our foundry vendors or other suppliers to comply with applicable environmental laws and requirements could cause disruptions and delays in our product shipments, which could adversely affect our relations with our customers and adversely affect our business and results of operations.
Regulations related to “conflict minerals” may force us to incur additional expenses, may make our supply chain more complex and may result in damage to our reputation with customers.
Pursuant to the Dodd-Frank Wall Street Reform and Consumer Protection Act of 2010 (Dodd-Frank Act), the SEC has adopted requirements for companies that use certain minerals and metals, known as conflict minerals, in their products, whether or not these products are manufactured by third parties. These requirements require companies to diligence, disclose and report whether or not such minerals originate from the Democratic Republic of Congo and adjoining countries. The implementation of these new requirements could adversely
34
Table of Contents
affect the sourcing, availability and pricing of minerals used in the manufacture of semiconductor devices, including our products. In addition, we will continue to incur additional costs to comply with the disclosure requirements, including costs related to determining the source of any of the relevant minerals and metals used in our products. Since our supply chain is complex, we may not be able to sufficiently verify the origins for these minerals and metals used in our products through the due diligence procedures that we implement, which may harm our reputation. In such event, we may also face difficulties in satisfying customers that require that all of the components of our products are certified as conflict mineral free.
Catastrophic events may disrupt our business.
Our corporate headquarters are located in Santa Clara, California. The west coast of the United States contains active earthquake zones. In the event of a major earthquake, hurricane, or catastrophic event such as fire, power loss, telecommunications failure, cyber-attack, war, terrorist attack or disease outbreak, including Ebola, we may be unable to continue our operations and may endure system interruptions, reputational harm, delays in our application development, lengthy interruptions in our platform, breaches of data security, or loss of critical data, any of which could have an adverse effect on our future results of operations.
Risks Related to Ownership of Our Common Stock and this Offering
There has been no prior market for our common stock, and an active market may not develop or be sustained and investors may not be able to resell their shares at or above the initial public offering price.
There has been no public market for our common stock prior to this offering. The initial public offering price for our common stock will be determined through negotiations between the underwriters and us and may vary from the market price of our common stock following this offering. If you purchase shares of our common stock in this offering, you may not be able to resell those shares at or above the initial public offering price, if at all. An active or liquid market in our common stock may not develop upon the closing of this offering or, if it does develop, it may not be sustainable.
Our stock price may be volatile or may decline, regardless of our operating performance, resulting in substantial losses for investors purchasing shares in this offering.
The trading price and volume of our common stock is likely to be volatile and could fluctuate significantly regardless of our operating performance, in response to numerous factors, many of which are beyond our control, including those discussed elsewhere in this “Risk Factors” section, as well as:
| • | actual or anticipated fluctuations in our results of operations; |
| • | the financial projections we may provide to the public, any changes in these projections or our failure to meet these projections; |
| • | failure of securities analysts to initiate or maintain coverage of our company, changes in financial estimates by any securities analysts who follow our company, or our failure to meet these estimates or the expectations of investors; |
| • | ratings changes by any securities analysts who follow our company; |
| • | announcements by us or our competitors of significant technical innovations, acquisitions, strategic partnerships, joint ventures or capital commitments; |
| • | changes in operating performance and stock market valuations of other technology companies generally, or those in our industry in particular; |
| • | price and volume fluctuations in the overall stock market from time to time, including as a result of trends in the economy as a whole; |
35
Table of Contents
| • | actual or anticipated developments in our business or our competitors’ businesses or the competitive landscape generally; |
| • | new laws or regulations or new interpretations of existing laws, or regulations applicable to our business; |
| • | any major change in our management; |
| • | lawsuits threatened or filed against us; and |
| • | other events or factors, including those resulting from war, incidents of terrorism or responses to these events. |
In addition, the market for technology stocks and the stock markets in general have experienced extreme price and volume fluctuations. Stock prices of many technology companies have fluctuated in a manner unrelated or disproportionate to the operating performance of those companies. In the past, stockholders have instituted securities class action litigation following periods of market volatility. If we were to become involved in securities litigation, it could subject us to substantial costs, divert resources and the attention of management from our business and adversely affect our business, results of operations, financial condition and cash flows.
Substantial future sales of shares of our common stock could cause the market price of our common stock to decline.
The market price of our common stock could decline as a result of substantial sales of our common stock, particularly sales by our directors, executive officers and significant stockholders, a large number of shares of our common stock becoming available for sale or the perception in the market that holders of a large number of shares intend to sell their shares. Upon the completion of this offering, there will be approximately shares of our common stock outstanding, assuming no exercise of the underwriters’ over-allotment option. All of the shares of common stock sold in this offering will be freely transferable without restriction or additional registration under the Securities Act of 1933, as amended (Securities Act). Our directors, officers and other existing security holders will be subject to lock-up agreements described under the caption “Shares Eligible for Future Sale.” Subject to the restrictions under Rule 144 under the Securities Act, approximately shares of common stock will be eligible for resale 180 days after the date of this prospectus following the expiration of these lockup agreements, subject to extension in certain circumstances. In addition, at any time and without public notice, Morgan Stanley & Co. LLC and Deutsche Bank Securities Inc., as representatives of the underwriters, may in their discretion also release shares subject to the lock-up prior to the expiration of the lock-up period; provided, however, that if the release is granted for one of our officers or directors, (i) Morgan Stanley & Co. LLC and Deutsche Bank Securities Inc., as representatives of the underwriters, agree that at least three business days before the effective date of the release or waiver, Morgan Stanley & Co. LLC and Deutsche Bank Securities Inc., as representatives, will notify us of the impending release or waiver, and (ii) we are obligated to announce the impending release or waiver by press release through a major news service at least two business days before the effective date of the release or waiver. As resale restrictions end, the market price of our common stock could decline if the holders of those shares sell them or are perceived by the market as intending to sell them.
After this offering, the holders of an aggregate of shares of our common stock as of March 31, 2015 will have rights, subject to certain conditions, to require us to file registration statements covering their shares or to include their shares in registration statements that we may file for ourselves or our stockholders. We also intend to register shares of common stock that we may issue under our employee equity incentive plans. Once we register these shares, they will be able to be sold freely in the public market upon issuance, subject to existing market stand-off or lock-up agreements.
36
Table of Contents
Our directors, officers, and principal stockholders beneficially own a significant percentage of our stock and will be able to exert significant control over matters subject to stockholder approval.
Upon the closing of this offering, our directors, officers, greater than 5% stockholders and their respective affiliates will beneficially own in the aggregate approximately % of our outstanding stock. Therefore, after this offering these stockholders will continue to have the ability to influence us through this ownership position. These stockholders may be able to determine all matters requiring stockholder approval. For example, these stockholders will be able to control elections of directors, amendments of our organizational documents, or approval of any merger, sale of assets or other major corporate transaction. This may prevent or discourage unsolicited acquisition proposals or offers for our common stock that you may feel are in your best interest as one of our stockholders.
If securities analysts or industry analysts downgrade our common stock, publish negative research or reports or fail to publish reports about our business, our stock price and trading volume could decline.
The trading market for our common stock will be influenced by the research and reports that industry or securities analysts publish about us, our business and our market. If one or more analysts adversely changes their recommendation regarding our stock or changes their recommendation about our competitors’ stock, our stock price would likely decline. If one or more analysts cease coverage of us or fail to regularly publish reports on us, we could lose visibility in the financial markets which in turn could cause our stock price or trading volume to decline.
Our actual operating results may not meet our guidance and investor expectations, which would likely cause our stock price to decline.
From time to time, we may release guidance in our earnings releases, earnings conference calls or otherwise, regarding our future performance that represent our management’s estimates as of the date of release. If given, this guidance, which will include forward-looking statements, will be based on projections prepared by our management. Projections are based upon a number of assumptions and estimates that, while presented with numerical specificity, are inherently subject to significant business, economic and competitive uncertainties and contingencies, many of which are beyond our control. The principal reason that we expect to release guidance is to provide a basis for our management to discuss our business outlook with analysts and investors. With or without our guidance, analysts and other investors may publish expectations regarding our business, financial performance and results of operations. We do not accept any responsibility for any projections or reports published by any such third parties.
Guidance is necessarily speculative in nature, and it can be expected that some or all of the assumptions of the guidance furnished by us will not materialize or will vary significantly from actual results. If our actual performance does not meet or exceed our guidance or investor expectations, the trading price of our common stock is likely to decline.
Anti-takeover provisions in our charter documents and under Delaware law could make an acquisition of our company more difficult, limit attempts by our stockholders to replace or remove our current management and limit the market price of our common stock.
Provisions in our amended and restated certificate of incorporation and amended and restated bylaws to be effective in connection with this offering, may have the effect of delaying or preventing a change of control or changes in our management. Our amended and restated certificate of incorporation and amended and restated bylaws include provisions that:
| • | authorize our board of directors to issue, without further action by the stockholders, shares of undesignated preferred stock with terms, rights, and preferences determined by our board of directors that may be senior to our common stock; |
37
Table of Contents
| • | require that any action to be taken by our stockholders be effected at a duly called annual or special meeting and not by written consent; |
| • | specify that special meetings of our stockholders can be called only by our board of directors, the Chairman of our board of directors, or our Chief Executive Officer; |
| • | establish an advance notice procedure for stockholder proposals to be brought before an annual meeting, including proposed nominations of persons for election to our board of directors; |
| • | establish that our board of directors is divided into three classes, with each class serving three-year staggered terms; |
| • | prohibit cumulative voting in the election of directors; |
| • | provide that our directors may be removed only for cause; |
| • | provide that vacancies on our board of directors may be filled only by a majority of directors then in office, even if less than a quorum; and |
| • | require the approval of our board of directors or the holders of at least seventy-five percent (75%) of our outstanding shares of capital stock to amend our bylaws and certain provisions of our certificate of incorporation. |
These provisions may frustrate or prevent any attempts by our stockholders to replace or remove our current management by making it more difficult for stockholders to replace members of our board of directors, which is responsible for appointing the members of our management. In addition, because we are incorporated in Delaware, we are governed by the provisions of Section 203 of the Delaware General Corporation Law, which generally prohibits a Delaware corporation from engaging in any of a broad range of business combinations with any “interested” stockholder for a period of three years following the date on which the stockholder became an “interested” stockholder. Any delay or prevention of a change of control transaction or changes in our management could cause the market price of our common stock to decline.
Our charter documents designate the Court of Chancery of the State of Delaware as the sole and exclusive forum for certain types of actions and proceedings that may be initiated by our stockholders, which could limit our stockholders’ ability to obtain what they believe to be a favorable judicial forum for disputes with us or our directors, officers, or other employees.
Our certificate of incorporation and bylaws, as amended and restated in connection with this offering, provide that, unless we consent in writing to the selection of an alternative forum, the Court of Chancery of the State of Delaware shall be the sole and exclusive forum for (A) any derivative action or proceeding brought on our behalf, (B) any action asserting a claim of breach of a fiduciary duty owed by any of our directors, officers or other employees to us or our stockholders, (C) any action asserting a claim arising pursuant to any provision of the Delaware General Corporation Law, our certificate of incorporation or our bylaws or (D) any action asserting a claim against us governed by the internal affairs doctrine. Any person or entity purchasing or otherwise acquiring any interest in shares of our capital stock shall be deemed to have notice of and consented to the provisions of our certificate of incorporation described above. This choice of forum provision may limit a stockholder’s ability to bring a claim in a judicial forum that it finds favorable for disputes with us or our directors, officers or other employees, which may discourage such lawsuits against us and our directors, officers, and other employees. Alternatively, if a court were to find these provisions of our certificate of incorporation inapplicable to, or unenforceable in respect of, one or more of the specified types of actions or proceedings, we may incur additional costs associated with resolving such matters in other jurisdictions, which could adversely affect our business, financial condition or results of operations and result in a diversion of the time and resources of our management and board of directors.
38
Table of Contents
We may invest or spend the proceeds of this offering in ways with which you may not agree or in ways which may not yield a return.
Our management will have considerable discretion in the application of the net proceeds we receive in this offering, and you will not have the opportunity, as part of your investment decision, to assess whether the proceeds are being used appropriately. The net proceeds we receive may be used for corporate purposes that do not increase the value of our business, which could cause our stock price to decline.
We do not intend to pay dividends on our common stock so any returns will be limited to changes in the value of our common stock.
We have never declared or paid any cash dividends on our common stock. We currently anticipate that we will retain future earnings for the development, operation, and expansion of our business and do not anticipate declaring or paying any cash dividends for the foreseeable future. In addition, our ability to pay cash dividends on our common stock is restricted by the terms of our debt financing arrangements and may be prohibited or limited by the terms of any future debt financing arrangements. Any return to stockholders will therefore be limited to the increase, if any, in our stock price, which may never occur.
As a new investor, you will experience immediate and substantial dilution in the book value of the shares that you purchase in this offering.
The initial public offering price is substantially higher than the pro forma net tangible book value per share of our common stock immediately following this offering based on the total value of our tangible assets less our total liabilities. Therefore, if you purchase shares of our common stock in this offering, at the assumed initial public offering price of $ per share (the midpoint of the price range reflected on the cover page of this prospectus), you will experience immediate dilution of $ per share, the difference between the price per share you pay for our common stock and our pro forma net tangible book value per share as of March 31, 2015, after giving effect to the issuance by us of shares of our common stock in this offering. See “Dilution.” To the extent outstanding options or warrants to purchase our common stock are exercised, investors purchasing our common stock in this offering will experience further dilution.
39
Table of Contents
SPECIAL NOTE REGARDING FORWARD-LOOKING STATEMENTS
This prospectus, including the sections entitled “Prospectus Summary,” “Risk Factors,” “Management’s Discussion and Analysis of Financial Condition and Results of Operations” and “Business,” contains forward-looking statements. We may, in some cases, use words such as “anticipate,” “believe,” “could,” “estimate,” “expect,” “intend,” “may,” “plan,” “potential,” “predict,” “project,” “should,” “will,” “would” or the negative of those terms, and similar expressions that convey uncertainty of future events or outcomes to identify these forward-looking statements. Any statements contained herein that are not statements of historical facts may be deemed to be forward-looking statements. Forward-looking statements in this prospectus include, but are not limited to, statements about:
| • | our ability to retain and expand our customer relationships and to achieve design wins; |
| • | the success, cost and timing of new product designs; |
| • | our ability to address market and customer demands and to timely develop new or enhanced solutions to meet those demands; |
| • | anticipated trends, challenges and growth in our business and the markets in which we operate, including pricing expectations; |
| • | our expectations regarding our revenue, gross margins and expenses; |
| • | the size and growth potential of the markets for our solutions, and our ability to serve those markets; |
| • | our expectations regarding competition in our existing and new markets; |
| • | regulatory developments in the United States and foreign countries; |
| • | the performance of our third-party suppliers and manufacturers; |
| • | our and our customers’ ability to respond successfully to technological or industry developments; |
| • | our ability to attract collaborators and strategic partnerships; |
| • | our ability to attract and retain key management personnel; |
| • | the average selling prices of semiconductor solutions; |
| • | the accuracy of our estimates regarding capital requirements and needs for additional financing; |
| • | the industry standards to which our solutions conform; |
| • | our expectations regarding the period during which we qualify as an emerging growth company under the JOBS Act; |
| • | our use of the proceeds from this offering; and |
| • | our expectations regarding our ability to obtain and maintain intellectual property protection for our technology. |
These forward-looking statements reflect our management’s beliefs and views with respect to future events and are based on estimates and assumptions as of the date of this prospectus and are subject to risks and uncertainties. We discuss many of these risks in greater detail under “Risk Factors.” Moreover, we operate in a very competitive and rapidly changing environment. New risks emerge from time to time. It is not possible for our management to predict all risks, nor can we assess the impact of all factors on our business or the extent to which any factor, or combination of factors, may cause actual results to differ materially from those contained in any forward-looking statements we may make. Given these uncertainties, you should not place undue reliance on these forward-looking statements.
You should read this prospectus and the documents that we reference in this prospectus and have filed as exhibits to the registration statement, of which this prospectus is a part, completely and with the understanding
40
Table of Contents
that our actual future results may be materially different from what we expect. We qualify all of the forward-looking statements in this prospectus by these cautionary statements. Except as required by law, we undertake no obligation to publicly update any forward-looking statements, whether as a result of new information, future events or otherwise.
You should not rely upon forward-looking statements as predictions of future events. Although we believe that the expectations reflected in the forward-looking statements are reasonable, we cannot guarantee that the future results, levels of activity, performance or events and circumstances reflected in the forward-looking statements will be achieved or occur. We undertake no obligation to update publicly any forward-looking statements for any reason after the date of this prospectus to conform these statements to actual results or to changes in our expectations, except as required by law.
41
Table of Contents
This prospectus contains statistical data, estimates, and forecasts that are based on independent industry publications, such as those published by Gartner, Inc., or other publicly available information, as well as other information based on our internal sources. Although we believe that the third-party sources referred to in this prospectus are reliable, estimates as they relate to projections involve numerous assumptions, are subject to risks and uncertainties and are subject to change based on various factors, including those discussed under the section titled “Risk Factors” and elsewhere in this prospectus. These and other factors could cause results to differ materially from those expressed in the estimates made by the independent parties and by us.
Certain information in the text of this prospectus is contained in Gartner Forecast: ASIC/ASSP, FPGA/PLD and SLI/SoC Applications, Worldwide, 2012-2018, 4Q14 Update (December 30, 2014) (Summation of consumption values of each relevant segment).
The Gartner Report described herein represents data, research opinion, or viewpoints published as part of a syndicated subscription service by Gartner and are not representations of fact. The Gartner Report speaks as of its original publication date (and not as of the date of this prospectus) and the opinions expressed in the Gartner Report are subject to change without notice.
42
Table of Contents
The following capitalized phrases and their acronyms are used throughout this prospectus and have the meanings set forth below:
Application Specific Integrated Circuit (ASIC): a custom integrated circuit that is designed and manufactured for one customer and can only be used in one specific application.
Application Specific Standard Product (ASSP): an integrated circuit that is designed for a specific application but can be used by multiple customers.
Base Array: an uncommitted eASIC IC that has a specific amount of logic, memory and I/O capacity. The base arrays are versatile and can be used for multiple applications. The final customization is completed by only one mask layer and allows the IC to be used for many types of customers, applications and markets.
Complementary Metal Oxide Semiconductor (CMOS): a transistor technology used for the fabrication of integrated circuits.
Design Tools: a software application that is used to design, simulate, verify and implement the functionality of an integrated circuit. The final output of the design tools is used to create an IC mask layer.
Exabytes: one billion gigabytes.
Field Programmable Gate Array (FPGA): an integrated circuit whose functionality can be configured through software after the IC is manufactured.
Foundry: a factory where integrated circuits are manufactured.
Integrated Circuit (IC): a semiconductor device on which an electronic circuit is formed. This is also referred to as a “chip” or a microchip.
Input/Output (I/O): the part of an IC that enables electronic signals to either enter or exit the IC.
Mask Layer: a photolithographic mask that contains the circuitry patterns necessary to manufacture an IC. A typical IC requires approximately 50 mask layers. Each mask layer is used to transfer the circuitry pattern onto the wafer.
Moore’s Law: a quotation by Intel’s co-founder Gordon Moore stating that the number of transistors on an IC will double every 18 months. In 1975, Moore extended the 18-month timeframe to 24 months.
Non-Recurring Engineering (NRE) Charge: a one-time cost that is used for the design, development, and manufacture of a new IC.
Original Equipment Manufacturer (OEM): a company that designs, manufactures and sells products.
Performance: the clock speed of a particular chip, in each case as measured in megahertz.
Process Nodes: the transistor width used to define a semiconductor manufacturing process. Smaller widths allow more transistors to be manufactured in the same silicon area. Process node is measured in nanometers (nm), e.g., 28nm, 20nm, 14nm, etc.
Serializer/Deserializer (SerDes): a device that takes parallel data, such as 8 signals, and converts it into a single high speed serial stream for transmission. At the other end, it converts the serial data back to 8 parallel signals.
Vendor Managed Inventory (VMI): a means of optimizing the supply chain in which the manufacturer is responsible for maintaining inventory levels at a customer specified location under control of the manufacturer, which is usually referred to as a “hub.” The manufacturer owns and has access to the customer’s inventory, until such inventory is “pulled” by the customer, at which time the customer takes title to that inventory and is typically invoiced and revenues are recognized by the manufacturer.
43
Table of Contents
We estimate that we will receive net proceeds of approximately $ million (or approximately $ million if the underwriters exercise their over-allotment option in full) from the sale of the shares of common stock offered by us in this offering, based on an assumed initial public offering price of $ per share (the midpoint of the price range set forth on the cover page of this prospectus), and after deducting the estimated underwriting discounts and commissions and estimated offering expenses payable by us. We will not receive any proceeds from the shares of common stock to be offered by the selling stockholders, although we will pay the expenses, other than underwriting discounts and commissions, associated with the sale of those shares. See “Principal and Selling Stockholders.”
A $1.00 increase (decrease) in the assumed initial public offering price of $ per share would increase (decrease) the net proceeds to us from this offering by approximately $ million, assuming that the number of shares offered by us, as set forth on the cover page of this prospectus, remains the same and after deducting the estimated underwriting discounts and commissions and estimated offering expenses payable by us.
Similarly, a one million share increase (decrease) in the number of shares offered by us, as set forth on the cover of this prospectus, would increase (decrease) the net proceeds to us by $ million, assuming the assumed initial public offering price of $ per share (the midpoint of the price range set forth on the cover of this prospectus), remains the same, and after deducting estimated underwriting discounts and commissions and estimated offering expenses payable by us.
The principal purposes of this offering are to increase our capitalization and financial flexibility, facilitate our orderly distributions of shares for the selling stockholders, establish a public market for our common stock and to facilitate future access to the public equity markets by us, our employees and our stockholders, obtain additional capital to support our operations, and increase our visibility in the marketplace.
Our expected use of the net proceeds we receive from this offering represents our current intentions based upon our present plans and business condition. As of the date of this prospectus, we cannot predict with certainty all of the particular uses for the net proceeds to be received upon the completion of this offering or the amounts that we will actually spend on the uses set forth above. However, we currently intend to use the net proceeds to us from this offering primarily for general corporate purposes, including working capital, sales and marketing activities, product development, general and administrative matters, and capital expenditures, although we do not currently have any specific or preliminary plans with respect to the use of proceeds for such purposes. We also intend to use approximately $19.0 million of the net proceeds we receive from this offering to prepay the entirety of the outstanding indebtedness, including applicable prepayment penalties, if any, under (1) our revolving line of credit with Silicon Valley Bank (Line of Credit) and (2) each of our 2013 term loan facility (2013 Loan) and our 2014 term loan facility (2014 Loan) with Horizon Technology Finance Corporation, Horizon Funding Trust 2013-1, DBD Credit Funding LLC and Fortress Credit Opportunities I, LP. The Line of Credit carries a floating interest rate equal to prime plus 1.5% and matures on September 25, 2016. Secured notes issued by us under the 2013 Loan carry a fixed interest rate of 11% and mature on October 1, 2017. Secured notes issued by us under the 2014 Loan carry a fixed interest rate of 10.75% and mature on April 1, 2018. See the section titled “Management’s Discussion and Analysis of Financial Condition and Results of Operations—Liquidity and Capital Resources—Debt Obligations.” Our intentions to prepay our debt obligations with the net proceeds that we receive from this offering may change due to market or other factors. We also may use a portion of the net proceeds to acquire complementary businesses, products, services or technologies, however, we do not have agreements or commitments for any specific acquisitions at this time. We will have broad discretion over the use of the net proceeds we receive from this offering. Pending these uses, we intend to invest the net proceeds we receive from this offering in short-term, interest-bearing securities such as money market accounts, certificates of deposit, commercial paper and guaranteed obligations of the U.S. government. We may also make illiquid minority investments in private companies for strategic reasons, however, we do not have any agreements, commitments or plans for any specific minority investments at this time.
44
Table of Contents
The amounts and timing of our actual use of the net proceeds that we receive from this offering will vary depending on numerous factors, including our ability to gain access to additional financing, the relative success and cost of our research and development programs and whether we are able to enter into future licensing arrangements. As a result, our management will have broad discretion in the application of the net proceeds, and investors will be relying on our judgment regarding the application of the net proceeds of this offering. In addition, we might decide to postpone or not pursue certain development activities if the net proceeds from this offering and any other sources of cash are less than expected.
45
Table of Contents
We have never declared or paid cash dividends on our capital stock. We do not anticipate declaring or paying, in the foreseeable future, any cash dividends on our capital stock. We currently intend to retain all available funds and any future earnings to support our operations and finance the growth and development of our business. Any future determination related to our dividend policy will be made at the discretion of our board of directors and will depend upon, among other factors, our results of operations, financial condition, capital requirements, contractual restrictions, business prospects and other factors our board of directors may deem relevant. In addition, the terms of our existing Amended and Restated Venture Loan and Security Agreement with Horizon Technology Finance Corporation, Horizon Funding Trust 2013-1, DBD Credit Funding LLC and Fortress Credit Opportunities I, LP, dated September 12, 2014, and our Loan and Security Agreement with Silicon Valley Bank, as amended, dated September 29, 2010 restrict our ability to pay dividends or make distributions.
46
Table of Contents
The following table sets forth our cash and cash equivalents, and our capitalization as of March 31, 2015:
| • | on an actual basis; |
| • | on a pro forma basis, giving effect to: (1) the conversion of all our outstanding convertible preferred stock as of March 31, 2015 into an aggregate of 5,145,683 shares of our common stock immediately prior to the completion of this offering, (2) the termination and cancellation of all 533,301 outstanding shares of our Series A-1 non-convertible preferred stock immediately prior to the completion of this offering, (3) the automatic conversion of all our convertible preferred stock warrants outstanding as of March 31, 2015 into warrants exercisable for the purchase of an aggregate of 111,505 shares of our common stock immediately prior to the completion of this offering, and the related reclassification of the preferred stock warrant liability to additional paid-in capital, and (4) the filing of our amended and restated certificate of incorporation, which will occur immediately prior to the completion of this offering; and |
| • | on a pro forma as adjusted basis, reflecting the pro forma adjustments discussed above and giving further effect to the sale by us of shares of our common stock in this offering at an assumed initial public offering price of $ per share (the midpoint of the range set forth on the cover of this prospectus), and after deducting the estimated underwriting discounts and commissions and estimated offering expenses payable by us. |
The pro forma information below is illustrative only and our capitalization following the completion of this offering will be adjusted based on the actual initial public offering price and other terms of this offering determined at pricing. You should read this table together with “Selected Consolidated Financial Data” and “Management’s Discussion and Analysis of Financial Condition and Results of Operations” and our financial statements and the related notes appearing elsewhere in this prospectus.
| As of March 31, 2015 | ||||||||||
| Actual | Pro Forma | Pro Forma As Adjusted(1) | ||||||||
| (Unaudited; In thousands, except share and per share data) | ||||||||||
| Cash and cash equivalents |
$ | 9,222 | $ | 9,222 | ||||||
|
|
|
|
|
| ||||||
| Long-term debt, including current portion |
$ | 18,467 | $ | 18,467 | ||||||
| Preferred stock warrant liability |
1,042 | — | ||||||||
| Non-convertible Series A-1 preferred stock, $0.001 par value: 40,000,000 shares authorized and 533,301 shares issued and outstanding, actual; no shares authorized, issued or outstanding, pro forma and pro forma as adjusted |
17,783 | — | ||||||||
| Convertible Series A-2 preferred stock, $0.001 par value: 450,000,000 shares authorized and 4,532,662 issued and outstanding, actual; no shares authorized, issued or outstanding, pro forma and pro forma as adjusted |
23,503 | — | ||||||||
| Preferred stock, $0.001 par value: no shares authorized, issued or outstanding, actual; and 10,000,000 shares authorized and no shares issued or outstanding, pro forma and pro forma as adjusted |
— | — | ||||||||
| Common stock, $0.001 par value: 1,575,000,000 shares authorized and 9,909,735 shares issued and outstanding, actual; 100,000,000 shares authorized and 15,055,418 shares issued and outstanding, pro forma; and shares issued and outstanding, pro forma as adjusted |
11,740 | 54,068 | ||||||||
| Accumulated deficit |
(45,714 | ) | (45,714 | ) | ||||||
|
|
|
|
|
|||||||
| Total stockholders’ equity (deficit) |
(33,974 | ) | 8,354 | |||||||
|
|
|
|
|
| ||||||
| Total capitalization |
$ | 26,821 | $ | 26,821 | ||||||
|
|
|
|
|
| ||||||
47
Table of Contents
| (1) | Each $1.00 increase (decrease) in the assumed initial public offering price of $ per share (the midpoint of the price range set forth on the cover page of this prospectus) would increase (decrease) the amount of cash and cash equivalents, additional paid-in capital and total capitalization by approximately $ million, assuming the number of shares offered by us, as set forth on the cover page of this prospectus, remains the same and after deducting the estimated underwriting discounts and commissions and estimated offering costs payable by us. Each one million increase (decrease) in the number of shares offered by us as set forth on the cover page of this prospectus, would increase (decrease) each of our cash and cash equivalents, working capital (deficit), total assets, additional paid-in capital, and total stockholders’ equity by approximately $ million, assuming that the assumed initial public offering price of $ per share, which is the midpoint of the estimated offering price range reflected on the cover page of this prospectus, remains the same and after deducting the estimated underwriting discounts and commissions and estimated offering expenses payable by us. |
The number of shares of our common stock to be outstanding after this offering is based on 15,055,418 pro forma shares of common stock outstanding as of March 31, 2015, and excludes:
| • | 3,413,188 shares of common stock issuable upon the exercise of outstanding stock options as of March 31, 2015, at a weighted-average exercise price of $1.39 per share; |
| • | 2,865,129 shares of our common stock reserved for future issuance under our 2015 Plan, which will become effective as of the date of the effectiveness of the registration statement of which this prospectus forms a part, which includes (i) 215,129 shares of common stock reserved for issuance under our 2010 Plan, and (ii) stock options exercisable for an aggregate of 48,500 shares that our Compensation Committee has approved to be granted in connection with the pricing of our initial public offering with an exercise price equal to the initial public offering price; |
| • | 530,000 shares of common stock reserved for future issuance under our 2015 employee stock purchase plan, or the 2015 ESPP, which will become effective upon the execution and delivery of the underwriting agreement for this offering; |
| • | 111,505 shares of common stock issuable upon the exercise of convertible preferred stock warrants outstanding as of March 31, 2015, at an exercise price of approximately $5.19 per share; |
| • | 32,268 shares of common stock issuable upon the exercise of common stock warrants outstanding as of March 31, 2015, at an exercise price of approximately $15.50 per share; and |
| • | 75,752 shares of common stock issuable upon the exercise of common stock warrants outstanding as of March 31, 2015, at a weighted-average exercise price of approximately $16.37 per share, that terminate unless exercised immediately prior to the completion of this offering. |
48
Table of Contents
If you invest in our common stock in this offering, your ownership interest will be immediately diluted to the extent of the difference between the initial public offering price per share of our common stock and the pro forma as adjusted net tangible book value per share of our common stock after this offering.
Our historical net tangible book value as of March 31, 2015, was approximately $(34.1) million, or $(3.44) per share of our common stock. Our historical net tangible book value is the amount of our total tangible assets less our liabilities and convertible preferred stock which is not included within stockholders’ equity. Historical net tangible book value per share is our historical net tangible book value divided by the number of shares of common stock outstanding as of March 31, 2015.
Our pro forma net tangible book value as of March 31, 2015, was $8.3 million, or $0.54 per share of common stock. Pro forma net tangible book value gives effect to (1) the conversion of all of our outstanding convertible preferred stock as of March 31, 2015, into an aggregate of 5,145,683 shares of our common stock and (2) the conversion of all outstanding warrants to purchase shares of our convertible preferred stock into warrants to purchase an aggregate of 111,505 shares of our common stock upon the completion of this offering, and the related reclassification of the preferred stock warrant liability to additional paid-in capital.
Pro forma as adjusted net tangible book value is our pro forma net tangible book value (deficit), plus the effect of the sale of shares of our common stock in this offering at an assumed initial public offering price of $ per share (the midpoint of the range set forth on the cover of this prospectus), and after deducting the estimated underwriting discounts and commissions and estimated offering expenses payable by us. This amount represents an immediate increase in pro forma as adjusted net tangible book value of $ per share to our existing stockholders, and an immediate dilution of $ per share to new investors participating in this offering.
The following table illustrates this dilution on a per share basis:
| Assumed initial public offering price per share, the midpoint of the price range set forth on the cover page of this prospectus |
$ | |||||||
| Pro forma net tangible book value per share as of March 31, 2015 |
$0.54 | |||||||
| Pro forma increase in net tangible book value per share as of March 31, 2015 attributable to this offering |
||||||||
| Increase in pro forma net tangible book value per share attributable to investors participating in this offering |
||||||||
|
|
|
|||||||
| Pro forma as adjusted net tangible book value per share after this offering |
||||||||
|
|
|
|||||||
| Pro forma as adjusted dilution per share to investors participating in this offering |
$ | |||||||
|
|
|
A $1.00 increase (decrease) in the assumed initial public offering price of $ per share (the midpoint of the price range set forth on the cover page of this prospectus) would increase (decrease) the pro forma as adjusted net tangible book value per share after this offering by approximately $ per share and the dilution in pro forma per share to investors participating in this offering by approximately $ per share, assuming that the number of shares offered by us, as set forth on the cover page of this prospectus, remains the same and after deducting the estimated underwriting discounts and commissions and estimated offering expenses payable by us.
Similarly, a one million share increase (decrease) in the number of shares offered by us, as set forth on the cover of this prospectus, would increase (decrease) the pro forma as adjusted net tangible book value per share after this offering by approximately $ and decrease (increase) the dilution in pro forma per share to investors participating in this offering by approximately $ , assuming the assumed initial public offering price of
49
Table of Contents
$ per share (the midpoint of the price range set forth on the cover of this prospectus) remains the same, and after deducting the estimated underwriting discounts and commissions and estimated offering expenses payable by us.
If the underwriters exercise their over-allotment option in full, the pro forma as adjusted net tangible book value will increase to $ per share, representing an immediate increase in pro forma as adjusted net tangible book value to existing stockholders of $ per share and an immediate decrease of dilution of $ per share to new investors participating in this offering.
The following table summarizes, on a pro forma as adjusted basis as of March 31, 2015, the number of shares purchased or to be purchased from us, the total consideration paid or to be paid to us, and the average price per share paid by existing stockholders or to be paid to us by investors participating in this offering at an assumed initial public offering price of $ per share (the midpoint of the price range set forth on the cover of this prospectus), before deducting estimated underwriting discounts and commissions and estimated offering expenses payable by us. As the table below shows, investors participating in this offering will pay an average price per share higher than our existing stockholders paid.
| Shares Purchased | Total Consideration | Average Price Per Share |
||||||||||||||||||
| Number | Percent | Amount | Percent | |||||||||||||||||
| (In thousands) | ||||||||||||||||||||
| Existing stockholders before this offering |
15,055,418 | % | $ | 135,802 | % | $ | 9.02 | |||||||||||||
| Investors participating in this offering |
||||||||||||||||||||
|
|
|
|
|
|
|
|
|
|||||||||||||
| Total |
100 | % | $ | 100 | % | |||||||||||||||
|
|
|
|
|
|
|
|
|
|||||||||||||
A $1.00 increase (decrease) in the assumed initial public offering price of $ per share (the midpoint of the price range set forth on the cover page of this prospectus) would increase (decrease) the total consideration paid by investors participating in this offering, total consideration paid by all stockholders and the average price per share paid by all stockholders by approximately $ million, $ million and $ , respectively, assuming that the number of shares offered by us, as set forth on the cover page of this prospectus, remains the same and before deducting the estimated underwriting discounts and commissions and estimated offering expenses payable by us.
A one million share increase (decrease) in the number of shares offered by us, as set forth on the cover of this prospectus, would increase (decrease) the total consideration paid by investors participating in this offering, total consideration paid by all stockholders and the average price per share paid by all stockholders by approximately $ million, $ million and $ , respectively, assuming the assumed initial public offering price of $ per share (the midpoint of the price range set forth on the cover of this prospectus) remains the same, and after deducting the estimated underwriting discounts and commissions and estimated offering expenses payable by us.
The foregoing discussion and tables are based on 15,055,418 pro forma shares of common stock outstanding as of March 31, 2015 and exclude:
| • | 3,413,188 shares of common stock issuable upon the exercise of outstanding stock options as of March 31, 2015, at a weighted-average exercise price of $1.39 per share; |
| • | 2,865,129 shares of our common stock reserved for future issuance under our 2015 Plan, which will become effective as of the date of the effectiveness of the registration statement of which this prospectus forms a part, which includes (i) 215,129 shares of common stock reserved for issuance under our 2010 Plan, and (ii) stock options exercisable for an aggregate of 48,500 shares that our Compensation Committee has approved to be granted in connection with the pricing of our initial public offering with an exercise price equal to the initial public offering price; |
| • | 530,000 shares of common stock reserved for future issuance under our 2015 employee stock purchase plan, or the 2015 ESPP, which will become effective upon the execution and delivery of the underwriting agreement for this offering; |
50
Table of Contents
| • | 111,505 shares of common stock issuable upon the exercise of convertible preferred stock warrants outstanding as of March 31, 2015, at an exercise price of approximately $5.19 per share; |
| • | 32,268 shares of common stock issuable upon the exercise of common stock warrants outstanding as of March 31, 2015, at an exercise price of approximately $15.50 per share; and |
| • | 75,752 shares of common stock issuable upon the exercise of common stock warrants outstanding as of March 31, 2015, at a weighted-average exercise price of approximately $16.37 per share, that terminate unless exercised immediately prior to the completion of this offering. |
We may choose to raise additional capital through the sale of equity or convertible debt securities due to market conditions or strategic considerations even if we believe we have sufficient funds for our current or future operating plans. To the extent we issue additional shares of common stock or other equity or convertible debt securities in the future, there will be further dilution to investors participating in this offering.
51
Table of Contents
SELECTED CONSOLIDATED FINANCIAL DATA
The selected consolidated statements of operations data for the years ended December 31, 2012, 2013 and 2014 and the consolidated balance sheet data as of December 31, 2013 and 2014 are derived from our audited consolidated financial statements included elsewhere in this prospectus. The selected consolidated statements of operations data for the three months ended March 31, 2014 and 2015, and the selected consolidated balance sheet data as of March 31, 2015, are derived from our unaudited interim consolidated financial statements included elsewhere in this prospectus. The unaudited interim consolidated financial statements were prepared on a basis consistent with our audited consolidated financial statements and, in the opinion of management, include all adjustments of a normal, recurring nature that are necessary for the fair presentation of the financial statements. The selected consolidated financial data below should be read in conjunction with the section entitled “Management’s Discussion and Analysis of Financial Condition and Results of Operations” and our consolidated financial statements and related notes included elsewhere in this prospectus. The selected consolidated financial data in this section are not intended to replace our consolidated financial statements and the related notes, and are qualified in their entirety by the consolidated financial statements and related notes included elsewhere in this prospectus. Our historical results are not necessarily indicative of the results that may be expected for any period in the future and the results for the three months ended March 31, 2015 are not necessarily indicative of results to be expected for the full year 2015 or any future period.
| Year Ended December 31, |
Three Months Ended March 31, |
|||||||||||||||||||
| 2012 | 2013 | 2014 | 2014 | 2015 | ||||||||||||||||
| (Unaudited) | ||||||||||||||||||||
| (In thousands, except share and per share data) | ||||||||||||||||||||
| Consolidated statements of operations data: |
||||||||||||||||||||
| Revenues: |
||||||||||||||||||||
| Product |
$ | 11,843 | $ | 26,111 | $ | 65,086 | $ | 12,265 | $ | 19,658 | ||||||||||
| Service |
1,840 | 3,666 | 2,294 | 1,312 | 417 | |||||||||||||||
|
|
|
|
|
|
|
|
|
|
|
|||||||||||
| Total revenues |
13,683 | 29,777 | 67,380 | 13,577 | 20,075 | |||||||||||||||
|
|
|
|
|
|
|
|
|
|
|
|||||||||||
| Cost of revenues(1): |
||||||||||||||||||||
| Product |
8,707 | 14,968 | 37,366 | 7,040 | 11,178 | |||||||||||||||
| Service |
373 | 748 | 636 | 420 | 190 | |||||||||||||||
|
|
|
|
|
|
|
|
|
|
|
|||||||||||
| Total cost of revenues |
9,080 | 15,716 | 38,002 | 7,460 | 11,368 | |||||||||||||||
|
|
|
|
|
|
|
|
|
|
|
|||||||||||
| Gross profit |
4,603 | 14,061 | 29,378 | 6,117 | 8,707 | |||||||||||||||
|
|
|
|
|
|
|
|
|
|
|
|||||||||||
| Operating expenses(1): |
||||||||||||||||||||
| Research and development |
11,898 | 13,026 | 13,870 | 3,038 | 3,701 | |||||||||||||||
| Sales and marketing |
4,494 | 4,834 | 5,711 | 1,183 | 1,331 | |||||||||||||||
| General and administrative |
2,543 | 3,076 | 5,449 | 746 | 2,491 | |||||||||||||||
|
|
|
|
|
|
|
|
|
|
|
|||||||||||
| Total operating expenses |
18,935 | 20,936 | 25,030 | 4,967 | 7,523 | |||||||||||||||
|
|
|
|
|
|
|
|
|
|
|
|||||||||||
| Income (loss) from operations |
(14,332 | ) | (6,875 | ) | 4,348 | 1,150 | 1,184 | |||||||||||||
| Interest expense |
(1,042 | ) | (935 | ) | (1,443 | ) | (301 | ) | (445 | ) | ||||||||||
| Other income (expense), net |
72 | 12 | (836 | ) | (88 | ) | (38 | ) | ||||||||||||
|
|
|
|
|
|
|
|
|
|
|
|||||||||||
| Income (loss) before income taxes |
(15,302 | ) | (7,798 | ) | 2,069 | 761 | 701 | |||||||||||||
| Benefit from (provision for) income taxes |
(57 | ) | (44 | ) | (3,216 | ) | (360 | ) | 5 | |||||||||||
|
|
|
|
|
|
|
|
|
|
|
|||||||||||
| Net income (loss) |
$ | (15,359 | ) | $ | (7,842 | ) | $ | (1,147 | ) | $ | 401 | $ | 706 | |||||||
| Add/(Less): Capital contribution from/(deemed dividend to) common stockholders(2) |
83,386 | (338 | ) | — | — | — | ||||||||||||||
| Less: Undistributed earnings allocated to preferred stockholders |
— | — | — | (401 | ) | (706 | ) | |||||||||||||
|
|
|
|
|
|
|
|
|
|
|
|||||||||||
| Net income (loss) attributable to common stockholders |
$ | 68,027 | $ | (8,180 | ) | $ | (1,147 | ) | $ | — | $ | — | ||||||||
|
|
|
|
|
|
|
|
|
|
|
|||||||||||
| Net income (loss) per share attributable to common stockholders(3): |
||||||||||||||||||||
| Basic |
$ | 213.75 | $ | (0.90 | ) | $ | (0.12 | ) | $ | 0.00 | $ | 0.00 | ||||||||
|
|
|
|
|
|
|
|
|
|
|
|||||||||||
| Diluted |
$ | (4.06 | ) | $ | (0.90 | ) | $ | (0.12 | ) | $ | 0.00 | $ | 0.00 | |||||||
|
|
|
|
|
|
|
|
|
|
|
|||||||||||
| Weighted-average common shares used in computing net income (loss) per share attributable to common stockholders(3): |
||||||||||||||||||||
| Basic |
318,249 | 9,066,797 | 9,518,377 | 9,436,046 | 9,682,424 | |||||||||||||||
|
|
|
|
|
|
|
|
|
|
|
|||||||||||
| Diluted |
3,786,303 | 9,066,797 | 9,518,377 | 9,436,046 | 9,682,424 | |||||||||||||||
|
|
|
|
|
|
|
|
|
|
|
|||||||||||
| Pro forma net income (loss) attributable to common stockholders (unaudited)(3) |
$ | (364 | ) | $ | 545 | |||||||||||||||
|
|
|
|
|
|||||||||||||||||
| Pro forma net income (loss) per share attributable to common stockholders (unaudited)(3): |
||||||||||||||||||||
| Basic |
$ | (0.02 | ) | $ | 0.04 | |||||||||||||||
|
|
|
|
|
|||||||||||||||||
| Diluted |
$ | (0.02 | ) | $ | 0.03 | |||||||||||||||
|
|
|
|
|
|||||||||||||||||
| Pro forma weighted-average common shares used in computing income (loss) per share attributable to common stockholders (unaudited)(3): |
||||||||||||||||||||
| Basic |
14,664,060 | 14,828,107 | ||||||||||||||||||
|
|
|
|
|
|||||||||||||||||
| Diluted |
14,664,060 | 17,828,111 | ||||||||||||||||||
|
|
|
|
|
|||||||||||||||||
52
Table of Contents
| (1) | Stock-based compensation included in the consolidated statements of operations data above was as follows: |
| Year Ended December 31, | Three Months Ended March 31, | |||||||||||||||||||
| 2012 | 2013 | 2014 | 2014 | 2015 | ||||||||||||||||
| (Unaudited) | ||||||||||||||||||||
| (In thousands) | ||||||||||||||||||||
| Cost of product revenues |
$ | 1 | $ | 5 | $ | 5 | $ | 1 | $ | 1 | ||||||||||
| Research and development |
75 | 256 | 485 | 33 | |
141 |
| |||||||||||||
| Sales and marketing |
17 | 485 | 286 | 12 | |
70 |
| |||||||||||||
| General and administrative |
150 | 573 | 558 | 40 | 136 | |||||||||||||||
|
|
|
|
|
|
|
|
|
|
|
|||||||||||
| Total |
$ | 243 | $ | 1,319 | $ | 1,334 | $ | 86 | $ | 348 | ||||||||||
|
|
|
|
|
|
|
|
|
|
|
|||||||||||
| (2) | See Note 6 to our consolidated financial statements appearing elsewhere in this prospectus for an explanation of the capital contribution from (deemed dividend) to common stockholders. |
| (3) | See Notes 1 and 8 to our consolidated financial statements appearing elsewhere in this prospectus for an explanation of the calculations of our basic and diluted net income per share attributable to common stockholders and our basic and diluted pro forma net income per share attributable to common stockholders. |
| As of December 31, | As of March 31, | |||||||||||
| 2013 | 2014 | 2015 | ||||||||||
| (Unaudited) | ||||||||||||
| (In thousands) | ||||||||||||
| Consolidated balance sheet data: |
||||||||||||
| Cash and cash equivalents |
$ | 7,423 | $ | 8,790 | $ | 9,222 | ||||||
| Working capital |
15,343 | 19,630 | 17,710 | |||||||||
| Total assets |
24,912 | 43,118 | 41,179 | |||||||||
| Total deferred revenues |
1,152 | 321 | 374 | |||||||||
| Total non-current income taxes payable |
— | 3,081 | 3,079 | |||||||||
| Total capital lease, non-current portion |
— | 255 | 221 | |||||||||
| Total long-term debt, non-current portion |
10,748 | 15,949 | |
15,024 |
| |||||||
| Vendor financing arrangement |
1,381 | 1,280 | 1,302 | |||||||||
| Convertible preferred stock warrant liabilities |
271 | 1,203 | |
1,042 |
| |||||||
| Total preferred stock |
41,286 | 41,286 | 41,286 | |||||||||
| Total stockholders’ deficit |
(35,508 | ) | (35,095 | ) | (33,974 | ) | ||||||
53
Table of Contents
MANAGEMENT’S DISCUSSION AND ANALYSIS OF FINANCIAL CONDITION AND RESULTS OF OPERATIONS
You should read the following discussion and analysis of our financial condition and results of operations together with the consolidated financial statements and related notes that are included elsewhere in this prospectus. This discussion contains forward-looking statements based upon current plans, expectations and beliefs that involve risks and uncertainties. Our actual results may differ materially from those anticipated in these forward-looking statements as a result of various factors, including those set forth under “Risk Factors” and in other parts of this prospectus.
Overview
We have pioneered a differentiated solution that enables us to rapidly and cost-effectively deliver custom integrated circuits (ICs), creating value for our customers’ hardware and software systems. Our eASIC solution consists of our eASIC platform which incorporates a versatile, pre-defined and reusable base array and customizable single-mask layer, our ASICs, delivered by using either our easicopy or standard ASIC methodologies, and our proprietary design tools. Customers can efficiently migrate to our easicopy ASIC from the eASIC platform using our easicopy methodology. We believe our eASIC solution provides the optimal combination of fast time-to-market, high performance, low power consumption, low development cost and low unit cost for our customers. Our solution has broad applicability across a wide range of customers, applications and end markets including communications infrastructure, storage and data processing and industrial applications. Our solution should position us to address additional end markets in the future. As of March 31, 2015, we have leveraged our eASIC platform to develop four generations of eASIC products with increasingly smaller process nodes, and we have designed over 200 custom ICs and shipped over 21 million units.
We believe the need for differentiation through custom ICs is driven by several megatrends, including the proliferation of mobile devices driving the deployment of high capacity and high bandwidth wireless infrastructure, the rapid transition to cloud computing and the emergence of big data analytics. We believe the ability to differentiate hardware and software systems through custom ICs is critical to helping our customers grow faster than their competitors and enhance their profit margins. Historical solutions for customized ICs have included Application Specific Integrated Circuits (ASICs), Application Specific Standard Products (ASSPs) and Field Programmable Gate Arrays (FPGAs). We believe our products avoid the painful tradeoffs associated with these historical solutions. For example, based on data provided by a majority of our customers for power consumption with respect to those customers’ designs using FPGAs, as well as our own internal analysis using the latest generation of custom ICs based on our eASIC platform, we believe that we can enable our customers to reduce power consumption by 50% to 80% compared to FPGAs at the same process node. In addition, in all five cases where customers have required that our design provide an increase in performance, as measured by clock speed of the chip, we have been able to improve performance by 60% to 120% compared to FPGAs at the same process node. With our eASIC platform, we believe our customers can significantly reduce non-recurring engineering (NRE) charges and lower design and manufacturing time by nine to 12 months or more when compared to traditional ASIC design and manufacturing processes. We believe our competitive advantages will increase over time as the costs and complexity associated with the development and manufacturing of future generations of ICs continue to rise.
We believe our competitive advantages should become more pronounced as continued technological advancements increase overall development and manufacturing costs for future generations of ICs. We estimate that our addressable market opportunity across ASIC, ASSP and FPGA applications is approximately $78 billion, based on data from Gartner Research. During the year ended December 31, 2014 and the three months ended March 31, 2015, we sold our products and services to over 14 customers and 10 customers, respectively, including Ericsson, Fujitsu, Huawei, NEC, Omnivision, Seagate and Toshiba. The number of customers varies between different periods due to timing of orders from customers.
For the years ended December 31, 2012, 2013 and 2014, our revenues were $13.7 million, $29.8 million and $67.4 million, respectively, and our net loss was $15.4 million, $7.8 million and $1.1 million, respectively. For
54
Table of Contents
the three months ended March 31, 2014 and 2015, our revenues were $13.6 million and $20.1 million, respectively, and our net income was $0.4 million and $0.7 million, respectively.
Our Business Model
We derive revenues from our eASIC solutions which include our eASIC platform as well as our easicopy and standard ASICs. We primarily generate product revenues from the sale of custom ICs to OEMs. We also generate service revenues from the design and development of ICs for customers and related design services and prototypes.
We shipped our first products in January 2008 and, since the beginning of 2013, our product revenues have grown rapidly. A significant portion of our total revenues to date has been generated from two customers, Ericsson and Seagate, including sales to contract manufacturers or original device manufacturers (ODM) at the direction of such end customers. In 2012, 2013, 2014 and the first three months of 2015, Ericsson and Seagate together accounted for 73%, 87%, 93% and 95% of our total revenues, respectively. For the year ended December 31, 2014 and the three months ended March 31, 2015, Ericsson alone represented 62% and 79% of our total revenues, respectively. To continue to grow our revenues, it is important that we both obtain new customers and sell additional products to existing customers. While we intend to expand our customer base over time, the markets we serve tend to be highly concentrated, and we expect that a large portion of our revenues will likely be derived from a relatively small number of customers for the foreseeable future.
We market and sell our products through our sales force and field applications engineers. For certain customers, we use independent sales representatives or non-stocking distributors. We have direct sales personnel covering the United States and Asia focusing primarily on major OEM customers and have sales offices in Santa Clara, California and Hong Kong. We also employ business development teams in China and Japan to work closely with local ODMs that support our broader customer base. During 2014, 2% of our revenues were generated from the Americas, substantially all from the United States, 51% from Europe, the Middle East and Africa and 47% from the Asia-Pacific region.
For select direct customers that represent a significant portion of our revenues, we maintain inventory of our product at a customer specified location (known as Vendor Managed Inventory, or VMI) and are notified when our products are either ordered or “pulled” by our customers to meet their manufacturing needs. We own and have access to the inventory, until such inventory is “pulled” by the customer, at which time the customer takes title to that inventory, we invoice the customer and recognize revenues. This VMI structure allows our customers the flexibility to modify their manufacturing volumes without being affected by the long production lead times typically required of custom ICs and provides us with enhanced insights into our customers’ supply needs. However, this may result in our revenues being more volatile.
55
Table of Contents
Non-GAAP Financial Measures
We use the financial measures set forth below, which are non-GAAP financial measures, to help us analyze our financial results, establish budgets and operational goals for managing our business and to evaluate our performance. We also believe that the presentation of these non-GAAP financial measures provides an additional tool for investors to use in comparing our core business and results of operations over multiple periods with other companies in our industry, many of which present similar non-GAAP financial measures to investors. However, the non-GAAP financial measures presented in this prospectus may not be comparable to similarly titled measures reported by other companies due to differences in the way that these measures are calculated. The non-GAAP financial measures presented in this prospectus should not be considered as the sole measure of our performance and should not be considered in isolation from, or as a substitute for, comparable financial measures calculated in accordance with GAAP. The financial measures set forth below also contain certain comparable GAAP financial measures.
| Year Ended December 31, | Three Months Ended March 31, |
|||||||||||||||||||
| 2012 | 2013 | 2014 | 2014 | 2015 | ||||||||||||||||
| (Unaudited) | ||||||||||||||||||||
| (In thousands, except percentages) | ||||||||||||||||||||
| GAAP gross profit |
$ | 4,603 | $ | 14,061 | $ | 29,378 | $ | 6,117 | $ | 8,707 | ||||||||||
| GAAP gross margins |
34 | % | 47 | % | 44 | % | 45 | % | 43 | % | ||||||||||
| Non-GAAP gross profit |
$ | 4,604 | $ | 14,066 | $ | 29,383 | $ | 6,118 | $ | 8,708 | ||||||||||
| Non-GAAP gross margins |
34 | % | 47 | % | 44 | % | 45 | % | 43 | % | ||||||||||
| GAAP income (loss) from operations |
$ | (14,332 | ) | $ | (6,875 | ) | $ | 4,348 | $ | 1,150 | $ | 1,184 | ||||||||
| GAAP operating margin (loss) |
(105 | %) | (23 | %) | 6 | % | 9 | % | 6 | % | ||||||||||
| Non-GAAP income (loss) from operations |
$ | (14,089 | ) | $ | (5,556 | ) | $ | 5,682 | $ | 1,236 | $ | 1,532 | ||||||||
| Non-GAAP operating margin (loss) |
(103 | %) | (19 | %) | 8 | % | 9 | % | 8 | % | ||||||||||
| Adjusted EBITDA |
$ | (13,609 | ) | $ | (5,010 | ) | $ | 6,589 | $ | 1,385 | $ | 1,959 | ||||||||
| Adjusted EBITDA margin |
(99 | %) | (17 | %) | 10 | % | 10 | % | 10 | % | ||||||||||
| Cash flow provided by (used in) operating activities |
$ | (10,442 | ) | $ | (13,478 | ) | $ | 542 | $ | (74 | ) | $ | 1,461 | |||||||
| Free cash flow |
$ | (10,966 | ) | $ | (15,607 | ) | $ | (4,774 | ) | $ | (1,852 | ) | $ | 1,100 | ||||||
Non-GAAP gross profit and margins. We define non-GAAP gross profit as gross profit as reported on our consolidated statements of operations, excluding the impact of stock-based compensation, which is a non-cash charge. We define non-GAAP gross margins as non-GAAP gross profit divided by revenues. We have presented non-GAAP gross profit and margins because we believe that the exclusion of stock-based compensation allows for more accurate comparisons of our results of operations to other companies in our industry. Please see “Reconciliation of Non-GAAP Financial Measures” below for information regarding the limitations of using non-GAAP gross profit and gross margins as financial measures and for a reconciliation of non-GAAP gross profit to gross profit, the most directly comparable financial measure calculated in accordance with U.S. generally accepted accounting principles (GAAP).
Non-GAAP income (loss) from operations and operating margin (loss). We define non-GAAP income (loss) from operations as income (loss) from operations as reported on our consolidated statements of operations, excluding the impact of stock-based compensation, which is a non-cash charge. We define non-GAAP operating margin (loss) as non-GAAP income (loss) from operations divided by revenues. We have presented non-GAAP income (loss) from operations and operating margin (loss) because we believe that the exclusion of stock-based compensation allows for more accurate comparisons of our results of operations to other companies in our industry. Please see “Reconciliation of Non-GAAP Financial Measures” below for information regarding the limitations of using non-GAAP income (loss) from operations and operating margin (loss) as financial measures and for a reconciliation of non-GAAP income (loss) from operations to income (loss) from operations, the most directly comparable financial measure calculated in accordance with GAAP.
Adjusted EBITDA and adjusted EBITDA margin. We define adjusted EBITDA as our net loss excluding: (1) stock-based compensation; (2) interest expense; (3) other income (expense), net, which primarily includes
56
Table of Contents
foreign exchange gains and losses; (4) depreciation and amortization; and (5) our provision for income taxes. We define adjusted EBITDA margin as adjusted EBITDA divided by revenues. We have presented adjusted EBITDA and adjusted EBITDA margin because we believe it is an important measure used by industry analysts and investors to compare our performance against our peer group and analyze our cash generation performance. In particular, we believe that the exclusion of the expenses eliminated in calculating adjusted EBITDA can provide a useful measure for period-to-period comparisons of our core operating performance. Please see “Reconciliation of Non-GAAP Financial Measures” below for information regarding the limitations of using adjusted EBITDA and adjusted EBITDA margin as financial measures and for a reconciliation of adjusted EBITDA to net loss, the most directly comparable financial measure calculated in accordance with GAAP.
Free cash flow. We define free cash flow as net cash used in operating activities less property and equipment purchases, including certain mask sets. We consider free cash flow to be a liquidity measure that provides useful information to management and investors about the amount of cash generated by the business that, after capital purchases, can be used for strategic opportunities, including investing in our business, making strategic acquisitions, and strengthening the balance sheet. Please see “Reconciliation of Non-GAAP Financial Measures” below for more information and a reconciliation of free cash flow to cash flow used in operating activities, the most directly comparable financial measure calculated and presented in accordance with GAAP.
Reconciliation of Non-GAAP Financial Measures
Our non-GAAP measures have limitations as analytical tools and you should not consider them in isolation or as a substitute for an analysis of our results under GAAP. There are a number of limitations related to the use of these non-GAAP financial measures versus their nearest GAAP equivalents. First, non-GAAP gross profit and gross margins and income (loss) from operations and operating margin (loss) are not substitutes for gross profit, gross margins, income (loss) from operations and operating margin (loss). Second, other companies may calculate non-GAAP financial measures differently or may use other measures to evaluate their performance, all of which could reduce the usefulness of our non-GAAP financial measures as tools for comparison. Finally, adjusted EBITDA, adjusted EBITDA margin and free cash flow exclude some costs, namely, non-cash stock-based compensation, interest expense and provision for income taxes, which are recurring. Therefore, adjusted EBITDA, adjusted EBITDA margin and free cash flow do not reflect the impact of stock-based compensation or working capital needs that will continue for the foreseeable future.
57
Table of Contents
The following tables reconcile the most directly comparable GAAP financial measure to each of these non-GAAP financial measures.
| Year Ended December 31, | Three Months Ended March 31, |
|||||||||||||||||||
| 2012 | 2013 | 2014 | 2014 | 2015 | ||||||||||||||||
| (In thousands, except percentages) | ||||||||||||||||||||
| Non-GAAP gross profit and margins: |
||||||||||||||||||||
| Total revenues |
$ | 13,683 | $ | 29,777 | $ | 67,380 | $ | 13,577 | $ | 20,075 | ||||||||||
| Gross profit |
4,603 | 14,061 | 29,378 | 6,117 | 8,707 | |||||||||||||||
| Stock-based compensation |
1 | 5 | 5 | 1 | 1 | |||||||||||||||
|
|
|
|
|
|
|
|
|
|
|
|||||||||||
| Non-GAAP gross profit |
$ | 4,604 | $ | 14,066 | $ | 29,383 | $ | 6,118 | $ | 8,708 | ||||||||||
|
|
|
|
|
|
|
|
|
|
|
|||||||||||
| Non-GAAP gross margins |
34 | % | 47 | % | 44 | % | 45 | % | 43 | % | ||||||||||
|
|
|
|
|
|
|
|
|
|
|
|||||||||||
| Non-GAAP income from operations and operating margin (loss): |
||||||||||||||||||||
| Total revenues |
$ | 13,683 | $ | 29,777 | $ | 67,380 | $ | 13,577 | $ | 20,075 | ||||||||||
| Income (loss) from operations |
(14,332 | ) | (6,875 | ) | 4,348 | 1,150 | 1,184 | |||||||||||||
| Stock-based compensation |
243 | 1,319 | 1,334 | 86 | 348 | |||||||||||||||
|
|
|
|
|
|
|
|
|
|
|
|||||||||||
| Non-GAAP income (loss) from operations |
$ | (14,089 | ) | $ | (5,556 | ) | $ | 5,682 | $ | 1,236 | $ | 1,532 | ||||||||
|
|
|
|
|
|
|
|
|
|
|
|||||||||||
| Non-GAAP operating margin (loss) |
(103 | %) | (19 | %) | 8 | % | 9 | % | 8 | % | ||||||||||
|
|
|
|
|
|
|
|
|
|
|
|||||||||||
| Adjusted EBITDA and adjusted EBITDA Margin: |
||||||||||||||||||||
| Total revenues |
$ | 13,683 | $ | 29,777 | $ | 67,380 | $ | 13,577 | $ | 20,075 | ||||||||||
| Net income (loss) |
(15,359 | ) | (7,842 | ) | (1,147 | ) | 401 | 706 | ||||||||||||
| Provision for (benefit from) income taxes |
57 | 44 | 3,216 | 360 | (5 | ) | ||||||||||||||
| Interest expense |
1,042 | 935 | 1,443 | 301 | 445 | |||||||||||||||
| Other (income) expense, net |
(72 | ) | (12 | ) | 836 | 88 | 38 | |||||||||||||
| Depreciation and amortization |
480 | 546 | 907 | 149 | 427 | |||||||||||||||
| Stock-based compensation |
243 | 1,319 | 1,334 | 86 | 348 | |||||||||||||||
|
|
|
|
|
|
|
|
|
|
|
|||||||||||
| Adjusted EBITDA |
$ | (13,609 | ) | $ | (5,010 | ) | $ | 6,589 | $ | 1,385 | $ | 1,959 | ||||||||
|
|
|
|
|
|
|
|
|
|
|
|||||||||||
| Adjusted EBITDA margin |
(99 | %) | (17 | %) | 10 | % | 10 | % | 10 | % | ||||||||||
|
|
|
|
|
|
|
|
|
|
|
|||||||||||
| Free cash flow: |
||||||||||||||||||||
| Cash flow provided by (used in) operating activities |
$ | (10,442 | ) | $ | (13,478 | ) | $ | 542 | $ | (74 | ) | $ | 1,461 | |||||||
| Less: purchases of property and equipment |
(524 | ) | (2,129 | ) | (5,316 | ) | (1,778 | ) | (361 | ) | ||||||||||
|
|
|
|
|
|
|
|
|
|
|
|||||||||||
| Free cash flow |
$ | (10,966 | ) | $ | (15,607 | ) | $ | (4,774 | ) | $ | (1,852 | ) | $ | 1,100 | ||||||
|
|
|
|
|
|
|
|
|
|
|
|||||||||||
Key Factors Affecting Our Performance
Design Wins with New and Existing Customers. Our solutions enable our customers to differentiate their products in order to drive their future revenue growth and profits. We view our solutions as a crucial aspect of our current and potential customers’ success and we work closely with our customers and targeted prospects to understand their product roadmaps and strategies. Our current customers and prospects tend to be multinational enterprises with large annual purchases of ICs and they continuously develop new products in existing and new application areas. We have programs in place to help our existing customers to utilize our solutions throughout their organizations. Because we expect our revenues relating to our mature products to decline in the future, we also consider design wins critical to our future success and anticipate being increasingly dependent on revenues from newer design wins for our newer products.
58
Table of Contents
Customer Demand and Product Life Cycles. Once customers design our ICs into their products, we closely monitor all aspects of their demand, including the initial design phase, prototype production, volume production and inventories, as well as end market demand, including seasonality, cyclicality and the competitive landscape. Given our customer relationships and the long-term aspects of our platform, we benefit from visibility into customer demand once we secure a design win, as the combination of the design and product life cycles provide an opportunity for us to monitor and hone our business fundamentals.
Product Adoption within New Markets and Applications. Due to the painful tradeoffs customers traditionally have been forced to make in order to utilize custom ICs in their products, we believe that our methodologies can be used to more efficiently develop ASICs to be used instead of traditional ASICs, ASSPs or FPGAs. We monitor the overall market to determine where our solutions can have a positive impact and we take a very strategic approach to target customers and applications that can benefit from our solutions in order to increase the breadth of our customer engagements and target end markets.
Pricing, Product Cost and Design Mix. Our pricing and margins depend on the volumes and the features of the custom ICs we provide to our customers. The average selling price, or ASP, for each ASIC design can be influenced by a number of factors, including the complexity of the design, the customer’s application, the customer’s relative negotiation power and the volume levels to be produced. ASPs are negotiated either when the initial design is awarded by the customer, or during annual negotiation cycles between us and the customer. Each of our custom ICs has its own ASP and cost of goods sold, or COGS, therefore the mix of custom ICs that we sell in any given quarter will have an impact on gross margins. A significant shift in mix from high margin custom ICs to low margin custom ICs would have a material impact on our gross margins. We continually monitor and work to improve the cost of our custom ICs and the potential value of our solution as we target new design win opportunities and manage the product life cycles of our existing customer designs. Since we rely on third-party wafer foundries and assembly and test contractors to manufacture, assemble and test our custom ICs, we maintain a close relationship with these suppliers to improve quality, increase yields and lower manufacturing costs.
Components of Operating Results
Revenues
We generate revenues primarily from the sales of our products and secondarily from services. As discussed further in “—Critical Accounting Policies and Estimates—Revenue Recognition” below, revenues are recognized when persuasive evidence of an arrangement exists, delivery has occurred, the fee is fixed or determinable and collectability is reasonably assured.
Our total revenues consist of the following:
| • | Product revenues. Our product revenues are generated from sales of our ICs. We recognize product revenues at the time of shipment, provided that all other revenue recognition criteria have been met. A substantial majority of our sales are made on a VMI basis in which we maintain inventory of our product at a customer specified location, which we refer to as a hub. Title to that inventory transfers to our customer, and revenues are recognized, when our products are “pulled” from our hub locations or delivered to our customers, as needed to meet their manufacturing requirements. We invoice our customer when this transaction occurs. In addition, we have sales to non-stocking distributors that sell directly to end-users for which we do not grant return privileges, except for defective products during the warranty period, nor do we grant pricing credits. Accordingly, we recognize revenues upon transfer of title and risk of loss or damage, generally upon shipment. |
| • | Service revenues. Our service revenues are generated from design and development of ICs for our customers and related design services and prototypes. Revenues are recognized based on attainment of contract milestones, including final acceptance of design and delivery of prototype ICs. |
59
Table of Contents
Cost of revenues
Cost of product revenues primarily consists of costs paid to our third-party contract manufacturers, and personnel and other costs associated with our manufacturing operations. Our cost of product revenues also includes product testing costs, as well as allocation of overhead costs for facilities, information technology, depreciation and amortization. We expect our cost of product revenues in absolute dollars to increase as our product revenues increase.
Cost of service revenues consists primarily of costs for personnel in our customer engineering group to complete the design work necessary to meet the contractual milestones with our customers, and engineering service and material charges from third-party vendors including our contract manufacturers. We expect our cost of service revenues in absolute dollars to increase as our service revenues increase.
Gross Margins
Gross margins, or gross profit as a percentage of revenues, has been and will continue to be affected by a variety of factors, including the specific ASP and COGS of a given custom IC, the mix of custom ICs in a given period, whether higher or lower margin IC designs and manufacturing operations costs. We believe the primary driver of product gross margins is the ASP negotiated between us and the customer on a specific ASIC design relative to the cost to manufacture that specific ASIC design.
We believe that by providing customers with the ability to choose among the methodologies we offer in designing and developing our custom ICs, customers benefit from minimizing the painful tradeoffs customers are forced to make using traditional ASICs, ASSPs or FPGAs. The choice of which methodology we use to design our ASICs is driven by the particular customer’s product requirements, including its project schedules, performance needs, power consumption needs and cost requirements, as well as the customer’s expected production volume. For the years ended December 31, 2012, 2013 and 2014 and the three months ended March 31, 2014 and 2015, our product revenues derived from our eASIC platform methodology represented 87%, 61%, 68%, 67% and 84%, respectively, of our total product revenues. The remainder of our product revenues was generated from our easicopy and ASIC methodologies.
The selection of a particular methodology to be used in the development of our ASICs is uncertain, as it continues to be subject to the specific needs of our customers and is not completely in our control. However, the custom ICs we sell that are derived from either our easicopy or to ASIC methodology is the same, so there is no impact on our product revenues or product gross margins as a result of one methodology being used over the other. Therefore, we do not believe that the selection of a particular ASICs design methodology is a meaningful indicator of future gross margins or operating results. While we expect our product gross margins to fluctuate on a quarterly basis as a result of these factors described above, we expect our overall gross margins to improve over time as we are able to reduce COGS by negotiating more favorable pricing from our suppliers as our volumes increase.
Operating expenses
Our operating expenses consist of research and development, sales and marketing, and general and administrative expense. Personnel costs are the most significant component of operating expenses and consist of salaries, benefits, bonuses, stock-based compensation and, with regard to sales and marketing expense, sales commissions. Operating expenses also include allocation of overhead costs for facilities, finance support, information technology and depreciation. Although our operating expenses may fluctuate, we expect our operating expenses to decline as a percentage of total revenues over time.
| • | Research and development. Research and development expense consists primarily of personnel, outside consulting and engineering services costs and allocated overhead. Research and development expense also includes the cost to develop our internal tools and service fees for third-party design tools. We |
60
Table of Contents
| have entered into easicopy or ASIC development agreements with customers for shared development, under which research and development costs are eligible for reimbursement. Amounts reimbursed under this arrangement are offset against research and development expenses. We expect research and development expense to continue to increase in absolute dollars as we continue to invest in our research and product development efforts to enhance our product capabilities, continue to invest in design tools, both third party and internally developed, and access new customer markets. |
| • | Sales and marketing. Sales and marketing expense consists primarily of personnel costs, incentive commission costs and allocated overhead. We expense commission costs as earned. Sales and marketing expense also includes costs for market development programs, promotional and other marketing activities, travel, office equipment, depreciation and outside consulting costs. We expect sales and marketing expense to continue to increase in absolute dollars as we increase the size of our sales and marketing organizations, increase marketing programs and expand our international operations. |
| • | General and administrative. General and administrative expense consists of personnel costs, professional services and allocated overhead. General and administrative personnel include our executive, finance, human resources, facilities, information technology and legal organizations. Professional services consist primarily of legal, auditing, accounting and other consulting costs. We allocate a portion of our general and administrative expense to cost of revenues, research and development and sales and marketing. We expect general and administrative expense to continue to increase in absolute dollars as we have recently incurred, and expect to continue to incur, additional general and administrative expenses as we grow our operations and prepare to operate as a public company, including higher legal, corporate insurance and accounting expenses. |
Interest expense and Other income (expense), net
Interest expense consists of interest on our outstanding debt. See Note 4 to our consolidated financial statements for more information about our debt.
Other expense, net consists primarily of the change in fair value of our preferred stock warrant liability and foreign exchange gains or losses. Convertible preferred stock warrants are classified as a liability on our consolidated balance sheets and remeasured to fair value at each balance sheet date with the corresponding change recorded as other expense. Upon the earlier of the exercise of the warrants or the completion of a liquidation event, including the completion of this offering, the liability will be reclassified to stockholders’ deficit, at which time it will no longer be subject to fair value accounting.
Provision for income taxes
Provision for income taxes consists primarily of U.S. federal and state income taxes in the United States and income taxes in certain foreign jurisdictions in which we conduct business. We have a full valuation allowance for deferred tax assets, including net operating loss carryforwards, and tax credits related primarily to research and development. We expect to maintain this full valuation allowance for the foreseeable future.
61
Table of Contents
Results of Operations
The following tables summarize our results of operations for the periods presented and as a percentage of our total revenues for those periods. The interim period is not necessarily indicative of results to be expected for a full year and the period-to-period comparison of results is not necessarily indicative of results for future periods.
| Year Ended December 31, | Three Months Ended March 31, |
|||||||||||||||||||
| 2012 | 2013 | 2014 | 2014 | 2015 | ||||||||||||||||
| (Unaudited) | ||||||||||||||||||||
| (In thousands) | ||||||||||||||||||||
| Revenues: |
||||||||||||||||||||
| Product |
$ | 11,843 | $ | 26,111 | $ | 65,086 | $ | 12,265 | $ | 19,658 | ||||||||||
| Service |
1,840 | 3,666 | 2,294 | 1,312 | 417 | |||||||||||||||
|
|
|
|
|
|
|
|
|
|
|
|||||||||||
| Total revenues |
13,683 | 29,777 | 67,380 | 13,577 | 20,075 | |||||||||||||||
|
|
|
|
|
|
|
|
|
|
|
|||||||||||
| Cost of revenues: |
||||||||||||||||||||
| Product |
8,707 | 14,968 | 37,366 | 7,040 | 11,178 | |||||||||||||||
| Service |
373 | 748 | 636 | 420 | 190 | |||||||||||||||
|
|
|
|
|
|
|
|
|
|
|
|||||||||||
| Total cost of revenues |
9,080 | 15,716 | 38,002 | 7,460 | 11,368 | |||||||||||||||
|
|
|
|
|
|
|
|
|
|
|
|||||||||||
| Gross profit |
4,603 | 14,061 | 29,378 | 6,117 | 8,707 | |||||||||||||||
|
|
|
|
|
|
|
|
|
|
|
|||||||||||
| Operating expenses: |
||||||||||||||||||||
| Research and development |
11,898 | 13,026 | 13,870 | 3,038 | 3,701 | |||||||||||||||
| Sales and marketing |
4,494 | 4,834 | 5,711 | 1,183 | 1,331 | |||||||||||||||
| General and administrative |
2,543 | 3,076 | 5,449 | 746 | 2,491 | |||||||||||||||
|
|
|
|
|
|
|
|
|
|
|
|||||||||||
| Total operating expenses |
18,935 | 20,936 | 25,030 | 4,967 | 7,523 | |||||||||||||||
|
|
|
|
|
|
|
|
|
|
|
|||||||||||
| Income (loss) from operations |
(14,332 | ) | (6,875 | ) | 4,348 | 1,150 | 1,184 | |||||||||||||
| Interest expense |
(1,042 | ) | (935 | ) | (1,443 | ) | (301 | ) | (445 | ) | ||||||||||
| Other income (expense), net |
72 | 12 | (836 | ) | (88 | ) | (38 | ) | ||||||||||||
|
|
|
|
|
|
|
|
|
|
|
|||||||||||
| Income (loss) before income taxes |
(15,302 | ) | (7,798 | ) | 2,069 | 761 | 701 | |||||||||||||
| Benefit from (provision for) income taxes |
(57 | ) | (44 | ) | (3,216 | ) | (360 | ) | 5 | |||||||||||
|
|
|
|
|
|
|
|
|
|
|
|||||||||||
| Net income (loss) |
$ | (15,359 | ) | $ | (7,842 | ) | $ | (1,147 | ) | $ | 401 | $ | 706 | |||||||
|
|
|
|
|
|
|
|
|
|
|
|||||||||||
62
Table of Contents
The following table sets forth our consolidated statements of operations data as a percentage of total revenues for the periods indicated:
| Year Ended December 31, | Three Months Ended March 31, | |||||||||||||||||||
| 2012 | 2013 | 2014 | 2014 | 2015 | ||||||||||||||||
| (Unaudited) | ||||||||||||||||||||
| (As a percentage of total revenues) | ||||||||||||||||||||
| Revenues: |
||||||||||||||||||||
| Product |
87 | % | 88 | % | 97 | % | 90 | % | 98 | % | ||||||||||
| Service |
13 | 12 | 3 | 10 | 2 | |||||||||||||||
|
|
|
|
|
|
|
|
|
|
|
|||||||||||
| Total revenues |
100 | 100 | 100 | 100 | 100 | |||||||||||||||
|
|
|
|
|
|
|
|
|
|
|
|||||||||||
| Cost of revenues: |
||||||||||||||||||||
| Product |
64 | 50 | 55 | 52 | 56 | |||||||||||||||
| Service |
3 | 3 | 1 | 3 | 1 | |||||||||||||||
|
|
|
|
|
|
|
|
|
|
|
|||||||||||
| Total cost of revenues |
67 | 53 | 56 | 55 | 57 | |||||||||||||||
|
|
|
|
|
|
|
|
|
|
|
|||||||||||
| Gross profit |
33 | 47 | 44 | 45 | 43 | |||||||||||||||
|
|
|
|
|
|
|
|
|
|
|
|||||||||||
| Operating expenses: |
||||||||||||||||||||
| Research and development |
87 | 44 | 21 | 22 | 18 | |||||||||||||||
| Sales and marketing |
33 | 16 | 8 | 9 | 7 | |||||||||||||||
| General and administrative |
19 | 10 | 8 | 5 | 12 | |||||||||||||||
|
|
|
|
|
|
|
|
|
|
|
|||||||||||
| Total operating expenses |
139 | 70 | 37 | 36 | 37 | |||||||||||||||
|
|
|
|
|
|
|
|
|
|
|
|||||||||||
| Income (loss) from operations |
(106 | ) | (23 | ) | 7 | 9 | 6 | |||||||||||||
| Interest expense |
(8 | ) | (3 | ) | (2 | ) | (2 | ) | (2 | ) | ||||||||||
| Other income (expense), net |
1 | — | (1 | ) | (1 | ) | — | |||||||||||||
|
|
|
|
|
|
|
|
|
|
|
|||||||||||
| Income (loss) before income taxes |
(113 | ) | (26 | ) | 4 | 6 | 4 | |||||||||||||
| Provision for income taxes |
— | — | (5 | ) | (3 | ) | — | |||||||||||||
|
|
|
|
|
|
|
|
|
|
|
|||||||||||
| Net income (loss) |
(113 | )% | (26 | )% | (1 | )% | 3 | % | 4 | % | ||||||||||
|
|
|
|
|
|
|
|
|
|
|
|||||||||||
Comparison of the Three Months Ended March 31, 2014 and 2015
Revenues
| Three Months Ended March 31, | Change | |||||||||||||||||||||||
| 2014 | % of Total Revenues |
2015 | % of Total Revenues |
$ | % | |||||||||||||||||||
| (Dollars in thousands) | ||||||||||||||||||||||||
| Revenues: |
||||||||||||||||||||||||
| Product |
$ | 12,265 | 90 | % | $ | 19,658 | 98 | % | $ | 7,393 | 60 | |||||||||||||
| Service |
1,312 | 10 | 417 | 2 | (895 | ) | (68 | )% | ||||||||||||||||
|
|
|
|
|
|
|
|
|
|
|
|||||||||||||||
| Total revenues |
$ | 13,577 | 100 | % | $ | 20,075 | 100 | % | $ | 6,498 | 48 | % | ||||||||||||
|
|
|
|
|
|
|
|
|
|
|
|||||||||||||||
Total revenues increased by $6.5 million, or 48%, for the three months ended March 31, 2015 compared to the three months ended March 31, 2014. Product revenues increased by $7.4 million, or 60%, for the three months ended March 31, 2015 compared to the three months ended March 31, 2014, primarily due to an increase in our sales to one of our largest customers, due to greater demand from their end customers in the wireless communications infrastructure segment, partially offset by a decrease in revenues generated from another large customer in the storage market related to softer demand in the PC market. Further, service revenues were lower in the three months ended March 31, 2015 compared to the three months ended March 31, 2014, primarily due to the timing of the attainment of design services and prototype milestones. In the three months ended March 31, 2014, we completed more designs and deliveries of prototypes compared to the three months ended March 31, 2015.
63
Table of Contents
We market and sell our products worldwide. We attribute revenues to the geography based on where customers are billed. Our revenues by geography for the periods indicated were as follows:
| Three Months Ended March 31, | Change | |||||||||||||||||||||||
| 2014 | % of Total Revenues |
2015 | % of Total Revenues |
$ | % | |||||||||||||||||||
| (Dollars in thousands) | ||||||||||||||||||||||||
| Revenues by geographic region: |
||||||||||||||||||||||||
| United States |
$ | 524 | 4 | % | $ | 50 | — | % | $ | (474 | ) | (90 | )% | |||||||||||
| Rest of Americas |
100 | 1 | — | — | (100 | ) | (100 | ) | ||||||||||||||||
| Europe |
4,441 | 33 | 15,904 | 79 | 11,463 | 258 | ||||||||||||||||||
| Asia Pacific |
8,512 | 62 | 4,121 | 21 | (4,391 | ) | (52 | ) | ||||||||||||||||
|
|
|
|
|
|
|
|
|
|
|
|||||||||||||||
| Total revenues |
$ | 13,577 | 100 | % | $ | 20,075 | 100 | % | $ | 6,498 | 48 | % | ||||||||||||
|
|
|
|
|
|
|
|
|
|
|
|||||||||||||||
The shift in revenues from the Asia Pacific region in the three months ended March 31, 2014 to Europe in the three months ended March 31, 2015 was primarily driven by a change in one of our largest end customer’s billing address, at the direction of that end customer.
See Note 9 to our consolidated financial statements for additional information regarding revenues by geography.
Cost of revenues and gross margins
| Three Months Ended March 31, | ||||||||||||||||||||
| 2014 | 2015 | |||||||||||||||||||
| Amount | Gross Margins | Amount | Gross Margins | Change | ||||||||||||||||
| (Dollars in thousands) | ||||||||||||||||||||
| Cost of revenues: |
||||||||||||||||||||
| Product |
$ | 7,040 | $ | 11,178 | $ | 4,138 | ||||||||||||||
| Service |
420 | 190 | (230 | ) | ||||||||||||||||
|
|
|
|
|
|
|
|||||||||||||||
| Total cost of revenues |
$ | 7,460 | $ | 11,368 | $ | 3,908 | ||||||||||||||
|
|
|
|
|
|
|
|||||||||||||||
| Gross margins: |
||||||||||||||||||||
| Product |
43 | % | 43 | % | — | % | ||||||||||||||
| Service |
68 | % | 54 | % | (14 | )% | ||||||||||||||
| Total gross margins |
45 | % | 43 | % | (2 | )% | ||||||||||||||
Cost of product revenues increased by $4.1 million for the three months ended March 31, 2015 compared to the three months ended March 31, 2014. The increase was primarily related to costs associated with an increase in the volume of products sold. Cost of service revenues decreased by $0.2 million for the three months ended March 31, 2015 compared to the three months ended March 31, 2014, corresponding to the decline in service revenues.
Total product gross margins remained the same for the three months ended March 31, 2015 compared to the three months ended March 31, 2014. For the three months ended March 31, 2015, our gross margins decreased by six percentage points due to declines in the average selling prices of our products. That adverse impact was offset primarily by cost reductions from our supply chain due to higher production volumes. Service revenues margin decreased by 14 percentage points for the three months ended March 31, 2015 compared to the three months ended March 31, 2014, primarily due to recognition of $0.3 million of nonrefundable customer payment as revenue upon cancellation of a design service contract by one customer in the first quarter of fiscal year 2014.
64
Table of Contents
Operating expenses
| Three Months Ended March 31, | Change | |||||||||||||||||||||||
| 2014 | % of Total Revenues |
2015 | % of Total Revenues |
$ | % | |||||||||||||||||||
| (Dollars in thousands) | ||||||||||||||||||||||||
| Operating expenses: |
||||||||||||||||||||||||
| Research and development |
$ | 3,038 | 22 | % | $ | 3,701 | 18 | % | $ | 663 | 22 | % | ||||||||||||
| Sales and marketing |
1,183 | 9 | 1,331 | 7 | 148 | 13 | ||||||||||||||||||
| General and administrative |
746 | 5 | 2,491 | 12 | 1,745 | 234 | ||||||||||||||||||
|
|
|
|
|
|
|
|
|
|
|
|||||||||||||||
| Total operating expenses |
$ | 4,967 | 36 | % | $ | 7,523 | 37 | % | $ | 2,556 | 51 | % | ||||||||||||
|
|
|
|
|
|
|
|
|
|
|
|||||||||||||||
| Includes stock-based compensation of: |
||||||||||||||||||||||||
| Research and development |
$ | 33 | $ | 141 | $ | 108 | ||||||||||||||||||
| Sales and marketing |
12 | 70 | 58 | |||||||||||||||||||||
| General and administrative |
40 | 136 | 96 | |||||||||||||||||||||
|
|
|
|
|
|
|
|||||||||||||||||||
| Total |
$ | 85 | $ | 347 | $ | 262 | ||||||||||||||||||
|
|
|
|
|
|
|
|||||||||||||||||||
Research and development. Research and development expense increased by $0.7 million, or 22%, for the three months ended March 31, 2015 compared to the three months ended March 31, 2014. The increase was due to an increase in our headcount to support the development of our future products and internal software development tools, as well as increased investment in third-party design tools. We enter into agreements with customers for shared development, under which research and development costs are eligible for reimbursement. Amounts reimbursed under these arrangements are offset against research and development expenses. In connection with such agreements, we offset against research and development expense an amount of $.02 million and $0.2 million, for the three months ended March 31, 2014 and 2015, respectively.
Sales and marketing. Sales and marketing expense increased by $0.1 million, or 13%, for the three months ended March 31, 2015 compared to the three months ended March 31, 2014, due to an increase in our headcount in sales and marketing.
General and administrative. General and administrative expense increased by $1.7 million, or 234%, for the three months ended March 31, 2015 compared to the three months ended March 31, 2014, due to an increase in our headcount and increased consulting expenses. We hired additional personnel in general and administrative functions and engaged external consultants to support revenue growth, improve financial systems and processes, and prepare for the Company’s anticipated initial public offering.
Interest expense and other income (expense), net
| Three Months Ended March 31, | Change | |||||||||||||||
| 2014 | 2015 | $ | % | |||||||||||||
| (Dollars in thousands) | ||||||||||||||||
| Interest and other expense, net: |
||||||||||||||||
| Interest expense |
$ | 301 | $ | 445 | $ | 144 | 48 | % | ||||||||
| Other (income) expense, net |
88 | 38 | (50 | ) | (57 | ) | ||||||||||
Interest expense increased by $0.1 million, or 48%, for the three months ended March 31, 2015 compared to the three months ended March 31, 2014, due to higher interest expense resulting from new borrowings and an increase in our revolving line of credit during the third quarter of fiscal year 2014. Other (income) expense, net, decreased by $0.1 million, or 57%, for the three months ended March 31, 2015 compared to the three months ended March 31, 2014 due to the change of the fair value of our preferred stock warrants and conversion of foreign currencies, partially offset by increased franchise tax charges.
65
Table of Contents
Provision for income taxes
| Three Months Ended March 31, | Change | |||||||||||||||
| 2014 | 2015 | $ | % | |||||||||||||
| (Dollars in thousands) | ||||||||||||||||
| Provision for (benefit from) income taxes: |
||||||||||||||||
| Provision for (benefit from) income taxes |
$ | 360 | $ | (5 | ) | $ | (365 | ) | (101 | )% | ||||||
| Effective tax rate |
47.3 | % | (0.7 | )% | (48 | )% | (101 | )% | ||||||||
The provision for (benefit from) income taxes was $(0.01) million and $0.4 million for the three months ended March 31, 2015 and 2014, respectively. The effective tax rate was (0.7)% and 47.3% for the three months ended March 31, 2015 and 2014, respectively. The decrease in the provision for income taxes and decrease in the tax rates were primarily due to a higher proportion of our fiscal year 2015 earnings being generated from lower tax rate countries. In 2015, we are completing our transition to having sales to foreign customers conducted by our Bermuda and Malaysia subsidiaries, which have 0% and 25% tax rates, respectively. This results in a decrease in the provision for income taxes and decrease in the tax rates due to a higher proportion of our fiscal year 2015 earnings being generated from these lower tax rate jurisdictions.
Comparison of the Years Ended December 31, 2013 and 2014
Revenues
| Year Ended December 31, | Change | |||||||||||||||||||||||
| 2013 | % of Total Revenues |
2014 | % of Total Revenues |
$ | % | |||||||||||||||||||
| (Dollars in thousands) | ||||||||||||||||||||||||
| Revenues: |
||||||||||||||||||||||||
| Product |
$ | 26,111 | 88 | % | $ | 65,086 | 97 | % | $ | 38,975 | 149 | % | ||||||||||||
| Service |
3,666 | 12 | 2,294 | 3 | (1,372 | ) | (37 | ) | ||||||||||||||||
|
|
|
|
|
|
|
|
|
|
|
|||||||||||||||
| Total revenues |
$ | 29,777 | 100 | % | $ | 67,380 | 100 | % | $ | 37,603 | 126 | % | ||||||||||||
|
|
|
|
|
|
|
|
|
|
|
|||||||||||||||
Total revenues increased by $37.6 million, or 126%, for 2014 compared to 2013. Product revenues increased by $39.0 million for 2014 compared to 2013, primarily due to an increase in our sales to our two largest customers, due to greater demand from their end customers. Further, service revenues and margin were higher in 2013 compared to 2014, primarily due to eASIC recognizing $0.8 million of revenue (which represented nonrefundable customer payments previously included in deferred revenue) upon cancellation of design services programs by two customers in 2013.
We market and sell our products worldwide. We attribute revenues to the geography based on where customers are billed. Our revenues by geography for the periods indicated were as follows:
| Year Ended December 31, | Change | |||||||||||||||||||||||
| 2013 | % of Total Revenues |
2014 | % of Total Revenues |
$ | % | |||||||||||||||||||
| (Dollars in thousands) | ||||||||||||||||||||||||
| Revenues by geographic region: |
||||||||||||||||||||||||
| United States |
$ | 788 | 3 | % | $ | 1,302 | 2 | % | $ | 514 | 65 | % | ||||||||||||
| Rest of Americas |
336 | 1 | 166 | — | (170 | ) | (51 | ) | ||||||||||||||||
| Europe |
13,265 | 44 | 34,177 | 51 | 20,912 | 158 | ||||||||||||||||||
| Asia Pacific |
15,388 | 52 | 31,735 | 47 | 16,347 | 106 | ||||||||||||||||||
|
|
|
|
|
|
|
|
|
|
|
|||||||||||||||
| Total revenues |
$ | 29,777 | 100 | % | $ | 67,380 | 100 | % | $ | 37,603 | 126 | % | ||||||||||||
|
|
|
|
|
|
|
|
|
|
|
|||||||||||||||
66
Table of Contents
See Note 9 to our consolidated financial statements for additional information regarding revenues by geography.
Cost of revenues and gross margin
| Year Ended December 31, | ||||||||||||||||||||
| 2013 | 2014 | |||||||||||||||||||
| Amount | Gross Margin | Amount | Gross Margin | Change | ||||||||||||||||
| (Dollars in thousands) | ||||||||||||||||||||
| Cost of revenues: |
||||||||||||||||||||
| Product |
$ | 14,968 | $ | 37,366 | $ | 22,398 | ||||||||||||||
| Service |
748 | 636 | (112 | ) | ||||||||||||||||
|
|
|
|
|
|
|
|||||||||||||||
| Total cost of revenues |
$ | 15,716 | $ | 38,002 | $ | 22,286 | ||||||||||||||
|
|
|
|
|
|
|
|||||||||||||||
| Gross margin: |
||||||||||||||||||||
| Product |
43 | % | 43 | % | — | % | ||||||||||||||
| Service |
80 | % | 72 | % | (8 | )% | ||||||||||||||
| Total gross margin |
47 | % | 44 | % | (3 | )% | ||||||||||||||
Cost of product revenues increased by $22.4 million for 2014 compared to 2013. The increase was primarily related to costs associated with increased product revenues. Cost of service revenues decreased by $0.1 million for 2014 compared to 2013. The decrease was primarily due to lower service revenues.
Total product gross margin remained relatively flat during 2014 compared to 2013. In 2014, our gross margin decreased by 12 percentage points due to declines in the average selling prices of our products. That adverse impact was offset primarily by cost reductions from our supply chain due to higher production volumes. Service revenues margin decreased by eight percentage points in 2014 compared to 2013 primarily due to recognizing $0.8 million of revenue (which represented nonrefundable customer payments previously included in deferred revenues) upon cancellation of design services programs by two customers in 2013.
Operating expenses
| Year Ended December 31, | Change | |||||||||||||||||||||||
| 2013 | % of Total Revenues |
2014 | % of Total Revenues |
$ | % | |||||||||||||||||||
| (Dollars in thousands) | ||||||||||||||||||||||||
| Operating expenses: |
||||||||||||||||||||||||
| Research and development |
$ | 13,026 | 44 | % | $ | 13,870 | 21 | % | $ | 844 | 6 | % | ||||||||||||
| Sales and marketing |
4,834 | 16 | 5,711 | 8 | 877 | 18 | ||||||||||||||||||
| General and administrative |
3,076 | 10 | 5,449 | 8 | 2,373 | 77 | ||||||||||||||||||
|
|
|
|
|
|
|
|
|
|
|
|||||||||||||||
| Total operating expenses |
$ | 20,936 | 70 | % | $ | 25,030 | 37 | % | $ | 4,094 | 20 | % | ||||||||||||
|
|
|
|
|
|
|
|
|
|
|
|||||||||||||||
| Includes stock-based compensation of: |
||||||||||||||||||||||||
| Research and development |
$ | 256 | $ | 485 | $ | 229 | ||||||||||||||||||
| Sales and marketing |
485 | 286 | (199 | ) | ||||||||||||||||||||
| General and administrative |
573 | 558 | (15 | ) | ||||||||||||||||||||
|
|
|
|
|
|
|
|||||||||||||||||||
| Total |
$ | 1,314 | $ | 1,329 | $ | 15 | ||||||||||||||||||
|
|
|
|
|
|
|
|||||||||||||||||||
Research and development. Research and development expense increased by $0.8 million, or 6%, for 2014 compared to 2013. The increase was due to an increase in personnel costs associated with increases in our headcount to support the development of our future products and internal software development tools. We enter into agreements with customers for shared development, under which research and development costs are eligible for reimbursement. Amounts reimbursed under this arrangement are offset against research and development expenses. In connection with such agreements, we offset against research and development expense by an amount of $1.3 million and $1.5 million, for 2013 and 2014, respectively.
67
Table of Contents
Sales and marketing. Sales and marketing expense increased by $0.9 million, or 18%, for 2014 compared to 2013, due to an increase in personnel costs associated with increases in our headcount in sales and marketing, higher sales commission payments and an increase in marketing programs to support our current revenues and drive future revenue growth.
General and administrative. General and administrative expense increased by $2.4 million, or 77%, for 2014 compared to 2013, as we increased consulting expenses to support revenue growth and improve financial systems and processes.
Interest expense and other income (expense), net
| Year Ended December 31, | Change | |||||||||||||||
| 2013 | 2014 | $ | % | |||||||||||||
| (Dollars in thousands) | ||||||||||||||||
| Interest and other expense, net: |
||||||||||||||||
| Interest expense |
$ | 935 | $ | 1,443 | $ | 508 | 54 | % | ||||||||
| Other (income) expense, net |
(12 | ) | 836 | 848 | 7,067 | |||||||||||
Interest expense increased by $0.5 million, or 54%, for 2014 compared to 2013, due to higher interest expense resulting from new borrowings and an increase in our revolving line of credit. Other (income) expense, net increased by $0.8 million, or 7,067%, for 2014 compared to 2013 mainly from foreign exchange losses and the change of the fair value of our preferred stock warrants.
Provision for income taxes
| Year Ended December 31, | Change | |||||||||||||||
| 2013 | 2014 | $ | % | |||||||||||||
| (Dollars in thousands) | ||||||||||||||||
| Provision for income taxes: |
||||||||||||||||
| Provision for income taxes |
$ | 44 | $ | 3,216 | $ | 3,172 | 7,209 | % | ||||||||
| Effective tax rate |
— | 155.4 | % | — | 155.4 | % | ||||||||||
Provision for income taxes increased as our profitability increased. The consolidated effective tax rate for 2014 exceeded the US statutory rate primarily due to taxes associated with certain unrecognized tax benefits related to an intercompany transfer pricing transaction partially offset by foreign income taxed at lower rates.
Capital contribution from/deemed dividend to common stockholders
In December 2012, under a new Certificate of Incorporation and pursuant to the Series A-2 Stock Purchase Agreement, the holders of the Company’s existing preferred stock (Series A through Series H) were offered the right to participate in the $10.0 million financing, on a pro-rata basis. This recapitalization was considered an extinguishment for accounting purposes. The extinguishment resulted in a contribution of capital to the common stock of $83.4 million, which was recorded within the stockholders’ accumulated deficit. The contribution of capital on the extinguishment was included in the adjustment to the Company’s net loss in arriving at the net loss attributable to common stockholders for the year ended December 31, 2012.
In January 2013, the Company completed the initial round of the Series A-2 financing and issued an additional 0.7 million shares of Series A-2 preferred, 0.2 million shares of Series A-1 preferred, and 2.4 million shares of common stock, in exchange for additional cash invested of $3.7 million and 0.3 million shares of Series A, B, C, D, E, F, F-1, G and H preferred stock. This exchange included the exercise of participation rights that had been reallocated from non-participating preferred holders and resulted in a deemed dividend to the preferred stock of $2.6 million related to holders who received reallocated rights and were not employees or service providers. The deemed dividend was charged to common stock and was included in the adjustment to the Company’s net loss in arriving at the net loss attributable to common stockholders for the year ended December 31, 2013.
68
Table of Contents
Comparison of Years Ended December 31, 2012 and 2013
Revenues
| Year Ended December 31, | Change | |||||||||||||||||||||||
| 2012 | % of Total Revenues |
2013 | % of Total Revenues |
$ | % | |||||||||||||||||||
| (Dollars in thousands) | ||||||||||||||||||||||||
| Revenues: |
||||||||||||||||||||||||
| Product |
$ | 11,843 | 87 | % | $ | 26,111 | 88 | % | $ | 14,268 | 120 | % | ||||||||||||
| Service |
1,840 | 13 | 3,666 | 12 | 1,826 | 99 | ||||||||||||||||||
|
|
|
|
|
|
|
|
|
|
|
|||||||||||||||
| Total revenues |
$ | 13,683 | 100 | % | $ | 29,777 | 100 | % | $ | 16,094 | 118 | % | ||||||||||||
|
|
|
|
|
|
|
|
|
|
|
|||||||||||||||
Total revenues increased by $16.1 million, or 118%, for 2013 compared to 2012. Product revenues increased by $14.3 million for 2013 compared to 2012, primarily due to an increase in sales to our two largest customers, due to greater demand from their end customers. Service revenues increased by $1.8 million for 2013 compared to 2012, primarily due to increased revenues from a higher number of designs and prototype sales.
Our revenues by geography for the periods indicated were as follows:
| Year Ended December 31, | Change | |||||||||||||||||||||||
| 2012 | % of Total Revenues |
2013 | % of Total Revenues |
$ | % | |||||||||||||||||||
| (Dollars in thousands) | ||||||||||||||||||||||||
| Revenues by geographic region: |
||||||||||||||||||||||||
| United States |
$ | 1,199 | 9 | % | $ | 788 | 3 | % | $ | (411 | ) | (34 | )% | |||||||||||
| Rest of Americas |
821 | 6 | 336 | 1 | (485 | ) | (59 | ) | ||||||||||||||||
| Europe |
6,266 | 46 | 13,265 | 44 | 6,999 | 112 | ||||||||||||||||||
| Asia Pacific |
5,397 | 39 | 15,388 | 52 | 9,991 | 185 | ||||||||||||||||||
|
|
|
|
|
|
|
|
|
|
|
|||||||||||||||
| Total revenues |
$ | 13,683 | 100 | % | $ | 29,777 | 100 | % | $ | 16,094 | 118 | % | ||||||||||||
|
|
|
|
|
|
|
|
|
|
|
|||||||||||||||
See Note 9 to our consolidated financial statements for additional information regarding revenues by geography.
Cost of revenues and gross margins
| Year Ended December 31, | ||||||||||||||||||||
| 2012 | 2013 | |||||||||||||||||||
| Amount | Gross Margin | Amount | Gross Margin | Change | ||||||||||||||||
| (Dollars in thousands) | ||||||||||||||||||||
| Cost of revenues: |
||||||||||||||||||||
| Product |
$ | 8,707 | $ | 14,968 | $ | 6,261 | ||||||||||||||
| Service |
373 | 748 | 375 | |||||||||||||||||
|
|
|
|
|
|
|
|||||||||||||||
| Total cost of revenues |
$ | 9,080 | $ | 15,716 | $ | 6,636 | ||||||||||||||
|
|
|
|
|
|
|
|||||||||||||||
| Gross margins: |
||||||||||||||||||||
| Product |
26 | % | 43 | % | 17 | % | ||||||||||||||
| Service |
80 | 80 | — | |||||||||||||||||
| Total gross margins |
34 | 47 | 13 | |||||||||||||||||
Cost of product revenues increased by $6.3 million for 2013 as compared to 2012. The increase was primarily related to increased product revenues. Cost of service revenues increased by $0.4 million for 2013 compared to 2012. The increase was primarily related due to higher costs associated with higher service revenues.
69
Table of Contents
Total product gross margins increased by 17 percentage points in 2013 compared to 2012. In 2013, our gross margins increased primarily due to cost reductions from our supply chain resulting from higher production volumes and favorable product mix contributing 21 percentage points in the aggregate, partially offset by a decline in average selling prices of our products of four percentage points. Service revenues margin remained relatively flat for 2013 compared to 2012.
Operating expenses
| Year Ended December 31, | Change | |||||||||||||||||||||||
| 2012 | % of Total Revenues |
2013 | % of Total Revenues |
$ | % | |||||||||||||||||||
| (Dollars in thousands) | ||||||||||||||||||||||||
| Operating expenses: |
||||||||||||||||||||||||
| Research and development |
$ | 11,898 | 87 | % | $ | 13,026 | 44 | % | $ | 1,128 | 9 | % | ||||||||||||
| Sales and marketing |
4,494 | 33 | 4,834 | 16 | 340 | 8 | ||||||||||||||||||
| General and administrative |
2,543 | 19 | 3,076 | 10 | 533 | 21 | ||||||||||||||||||
|
|
|
|
|
|
|
|
|
|
|
|||||||||||||||
| Total operating expenses |
$ | 18,935 | 139 | % | $ | 20,936 | 70 | % | $ | 2,001 | 11 | % | ||||||||||||
|
|
|
|
|
|
|
|
|
|
|
|||||||||||||||
| Includes stock-based compensation of: |
||||||||||||||||||||||||
| Research and development |
$ | 75 | $ | 256 | $ | 181 | ||||||||||||||||||
| Sales and marketing |
17 | 485 | 468 | |||||||||||||||||||||
| General and administrative |
150 | 573 | 423 | |||||||||||||||||||||
|
|
|
|
|
|
|
|||||||||||||||||||
| Total |
$ | 242 | $ | 1,314 | $ | 1,072 | ||||||||||||||||||
|
|
|
|
|
|
|
|||||||||||||||||||
Research and development. Research and development expense increased by $1.1 million, or 9%, for 2013 compared to 2012, due to an increase in our personnel costs associated with increases in our headcount to support the development of our future products and internal software development tools. We enter into agreements with customers for shared development, under which research and development costs are eligible for reimbursement. Amounts reimbursed under this arrangement are offset against research and development expenses. In connection with such agreements, we offset against research and development expenses an amount of $0.5 million and $1.3 million, for the years ended December 31, 2012 and 2013, respectively.
Sales and marketing. Sales and marketing expense increased by $0.3 million, or 8%, for 2013 compared to 2012, due to an increase in personnel costs associated with increases in our headcount in sales and marketing, higher sales commission payments and an increase in marketing programs to support our current revenues and drive future revenue growth.
General and administrative. General and administrative expense increased by $0.5 million, or 21%, for 2013 compared to 2012, primarily related to stock compensation expense and consulting expenses to support revenue growth and improve financial systems and processes.
Interest expense and other income (expense), net
| Year Ended December 31, | Change | |||||||||||||||
| 2012 | 2013 | $ | % | |||||||||||||
| (Dollars in thousands) | ||||||||||||||||
| Interest and other expense, net: |
||||||||||||||||
| Interest expense |
$ | 1,042 | $ | 935 | $ | (107 | ) | (10 | )% | |||||||
| Other (income) expense, net |
(72 | ) | (12 | ) | 60 | (83 | ) | |||||||||
Interest expense decreased primarily due to lower interest expense incurred as a result of payments towards term loans. Other (income) expense, net decreased primarily due to the increase in other expense from a change in the fair value of the preferred stock warrants.
70
Table of Contents
Provision for income taxes
| Year Ended December 31, | Change | |||||||||||||||
| 2012 | 2013 | $ | % | |||||||||||||
| (Dollars in thousands) | ||||||||||||||||
| Provision for income taxes: |
||||||||||||||||
| Provision for income taxes |
$ | 57 | $ | 44 | $ | (13 | ) | (23 | )% | |||||||
| Effective tax rate |
— | — | — | — | ||||||||||||
Tax expense consists principally of foreign taxes, as taxes in the United States are materially offset by usage of net operating loss carryforwards.
Capital contribution from/deemed dividend to common stockholders
In December 2012, under a new Certificate of Incorporation and pursuant to the Series A-2 Stock Purchase Agreement, the holders of the Company’s existing preferred stock (Series A through Series H) were offered the right to participate in the $10.0 million financing, on a pro-rata basis. This recapitalization was considered an extinguishment for accounting purposes. The extinguishment resulted in a contribution of capital to the common stock of $83.4 million, which was recorded within the stockholders’ accumulated deficit. The contribution of capital on the extinguishment was included in the adjustment to the Company’s net loss in arriving at the net loss attributable to common stockholders for the year ended December 31, 2012.
Quarterly Results of Operations
The following tables set forth selected unaudited quarterly consolidated statements of operations data for each of the quarterly periods for fiscal years 2013 and 2014, and the quarter ended March 31, 2015, as well as the percentage that each line item represents of total revenue for each quarter. The information for each of these quarters has been prepared on the same basis as the audited annual consolidated financial statements included elsewhere in this prospectus and, in the opinion of management, includes all adjustments of a normal, recurring nature that are necessary for the fair presentation of the results of operations for these periods in accordance with generally accepted accounting principles in the United States. This data should be read in conjunction with our audited consolidated financial statements and related notes included elsewhere in this prospectus. These quarterly operating results are not necessarily indicative of our operating results for a full fiscal year or any future period.
71
Table of Contents
| Three Months Ended |
|
|||||||||||||||||||||||||||||||||||
| March 31, 2013 |
June 30, 2013 |
September 30, 2013 |
December 31, 2013 |
March 31, 2014 |
June 30, 2014 |
September 30, 2014 |
December 31, 2014 |
March 31, 2015 |
||||||||||||||||||||||||||||
| (In thousands) | ||||||||||||||||||||||||||||||||||||
| Quarterly results of operations: |
||||||||||||||||||||||||||||||||||||
| Revenues: |
||||||||||||||||||||||||||||||||||||
| Product |
$ | 4,202 | $ | 5,295 | $ | 7,364 | $ | 9,250 | $ | 12,265 | $ | 14,411 | $ | 18,946 | $ | 19,464 | $ | 19,658 | ||||||||||||||||||
| Service |
502 | 1,035 | 1,280 | 849 | 1,312 | 184 | 150 | 648 | 417 | |||||||||||||||||||||||||||
|
|
|
|
|
|
|
|
|
|
|
|
|
|
|
|
|
|
|
|||||||||||||||||||
| Total revenues |
4,704 | 6,330 | 8,644 | 10,099 | 13,577 | 14,595 | 19,096 | 20,112 | 20,075 | |||||||||||||||||||||||||||
|
|
|
|
|
|
|
|
|
|
|
|
|
|
|
|
|
|
|
|||||||||||||||||||
| Cost of revenues: |
||||||||||||||||||||||||||||||||||||
| Product |
2,465 | 2,856 | 4,408 | 5,239 | 7,040 | 8,857 | 10,697 | 10,772 | 11,178 | |||||||||||||||||||||||||||
| Service |
224 | 291 | 105 | 128 | 420 | 93 | 53 | 70 | 190 | |||||||||||||||||||||||||||
|
|
|
|
|
|
|
|
|
|
|
|
|
|
|
|
|
|
|
|||||||||||||||||||
| Total cost of revenues |
2,689 | 3,147 | 4,513 | 5,367 | 7,460 | 8,950 | 10,750 | 10,842 | 11,368 | |||||||||||||||||||||||||||
|
|
|
|
|
|
|
|
|
|
|
|
|
|
|
|
|
|
|
|||||||||||||||||||
| Gross profit |
2,015 | 3,183 | 4,131 | 4,732 | 6,117 | 5,645 | 8,346 | 9,270 | 8,707 | |||||||||||||||||||||||||||
|
|
|
|
|
|
|
|
|
|
|
|
|
|
|
|
|
|
|
|||||||||||||||||||
| Operating expenses: |
||||||||||||||||||||||||||||||||||||
| Research and development |
3,300 | 3,164 | 3,235 | 3,327 | 3,038 | 3,270 | 3,531 | 4,031 | 3,701 | |||||||||||||||||||||||||||
| Sales and marketing |
1,448 | 1,173 | 1,064 | 1,149 | 1,183 | 1,447 | 1,372 | 1,709 | 1,331 | |||||||||||||||||||||||||||
| General and administrative |
1,060 | 664 | 809 | 543 | 746 | 870 | 1,598 | 2,235 | 2,491 | |||||||||||||||||||||||||||
|
|
|
|
|
|
|
|
|
|
|
|
|
|
|
|
|
|
|
|||||||||||||||||||
| Total operating expenses |
5,808 | 5,001 | 5,108 | 5,019 | 4,967 | 5,587 | 6,501 | 7,975 | 7,523 | |||||||||||||||||||||||||||
|
|
|
|
|
|
|
|
|
|
|
|
|
|
|
|
|
|
|
|||||||||||||||||||
| Income (loss) from operations |
(3,793 | ) | (1,818 | ) | (977 | ) | (287 | ) | 1,150 | 58 | 1,845 | 1,295 | 1,184 | |||||||||||||||||||||||
| Interest expense |
(207 | ) | (207 | ) | (230 | ) | (291 | ) | (301 | ) | (301 | ) | (372 | ) | (469 | ) | (445 | ) | ||||||||||||||||||
| Other income (expense), net |
(9 | ) | (1 | ) | 68 | (46 | ) | (88 | ) | (40 | ) | (149 | ) | (559 | ) | (38 | ) | |||||||||||||||||||
|
|
|
|
|
|
|
|
|
|
|
|
|
|
|
|
|
|
|
|||||||||||||||||||
| Income (loss) before income taxes |
(4,009 | ) | (2,026 | ) | (1,139 | ) | (624 | ) | 761 | (283 | ) | 1,324 | 267 | 701 | ||||||||||||||||||||||
| Benefit from (provision for) income taxes |
(11 | ) | (11 | ) | (16 | ) | (6 | ) | (360 | ) | (179 | ) | (934 | ) | (1,743 | ) | 5 | |||||||||||||||||||
|
|
|
|
|
|
|
|
|
|
|
|
|
|
|
|
|
|
|
|||||||||||||||||||
| Net income (loss) |
$ | (4,020 | ) | $ | (2,037 | ) | $ | (1,155 | ) | $ | (630 | ) | $ | 401 | $ | (462 | ) | $ | 390 | $ | (1,476 | ) | $ | 706 | ||||||||||||
|
|
|
|
|
|
|
|
|
|
|
|
|
|
|
|
|
|
|
|||||||||||||||||||
| Three Months Ended |
|
|||||||||||||||||||||||||||||||||||
| March 31, 2013 |
June 30, 2013 |
September 30, 2013 |
December 31, 2013 |
March 31, 2014 |
June 30, 2014 |
September 30, 2014 |
December 31, 2014 |
March 31, 2015 |
||||||||||||||||||||||||||||
| (As a percentage of total revenues) | ||||||||||||||||||||||||||||||||||||
| Revenues: |
||||||||||||||||||||||||||||||||||||
| Product |
89 | % | 84 | % | 85 | % | 92 | % | 90 | % | 99 | % | 99 | % | 97 | % | 98 | % | ||||||||||||||||||
| Service |
11 | 16 | 15 | 8 | 10 | 1 | 1 | 3 | 2 | |||||||||||||||||||||||||||
|
|
|
|
|
|
|
|
|
|
|
|
|
|
|
|
|
|
|
|||||||||||||||||||
| Total revenues |
100 | 100 | 100 | 100 | 100 | 100 | 100 | 100 | 100 | |||||||||||||||||||||||||||
|
|
|
|
|
|
|
|
|
|
|
|
|
|
|
|
|
|
|
|||||||||||||||||||
| Cost of revenues: |
||||||||||||||||||||||||||||||||||||
| Product |
52 | 45 | 51 | 52 | 52 | 61 | 56 | 54 | 56 | |||||||||||||||||||||||||||
| Service |
5 | 5 | 1 | 1 | 3 | 1 | — | — | 1 | |||||||||||||||||||||||||||
|
|
|
|
|
|
|
|
|
|
|
|
|
|
|
|
|
|
|
|||||||||||||||||||
| Total cost of revenues |
57 | 50 | 52 | 53 | 55 | 62 | 56 | 54 | 57 | |||||||||||||||||||||||||||
|
|
|
|
|
|
|
|
|
|
|
|
|
|
|
|
|
|
|
|||||||||||||||||||
| Gross profit |
43 | 50 | 48 | 47 | 45 | 38 | 44 | 46 | 43 | |||||||||||||||||||||||||||
|
|
|
|
|
|
|
|
|
|
|
|
|
|
|
|
|
|
|
|||||||||||||||||||
| Operating expenses: |
||||||||||||||||||||||||||||||||||||
| Research and development |
70 | 50 | 37 | 33 | 22 | 22 | 18 | 20 | 18 | |||||||||||||||||||||||||||
| Sales and marketing |
31 | 19 | 12 | 11 | 9 | 10 | 7 | 8 | 7 | |||||||||||||||||||||||||||
| General and administrative |
23 | 10 | 9 | 5 | 5 | 6 | 8 | 11 | 12 | |||||||||||||||||||||||||||
|
|
|
|
|
|
|
|
|
|
|
|
|
|
|
|
|
|
|
|||||||||||||||||||
| Total operating expenses |
124 | 79 | 58 | 49 | 36 | 38 | 33 | 39 | 37 | |||||||||||||||||||||||||||
|
|
|
|
|
|
|
|
|
|
|
|
|
|
|
|
|
|
|
|||||||||||||||||||
| Income (loss) from operations |
(81 | ) | (29 | ) | (10 | ) | (2 | ) | 9 | — | 11 | 7 | 6 | |||||||||||||||||||||||
| Interest expense |
(4 | ) | (3 | ) | (3 | ) | (3 | ) | (2 | ) | (2 | ) | (2 | ) | (2 | ) | (2 | ) | ||||||||||||||||||
| Other income (expense), net |
— | — | 1 | — | (1 | ) | — | (1 | ) | (3 | ) | — | ||||||||||||||||||||||||
|
|
|
|
|
|
|
|
|
|
|
|
|
|
|
|
|
|
|
|||||||||||||||||||
| Income (loss) before income taxes |
(85 | ) | (32 | ) | (12 | ) | (5 | ) | 6 | (2 | ) | 8 | 2 | 4 | ||||||||||||||||||||||
| Provision for income taxes |
— | — | — | — | (3 | ) | (1 | ) | (5 | ) | (9 | ) | — | |||||||||||||||||||||||
|
|
|
|
|
|
|
|
|
|
|
|
|
|
|
|
|
|
|
|||||||||||||||||||
| Net income (loss) |
(85 | )% | (32 | )% | (12 | )% | (5 | )% | 3 | % | (3 | )% | 3 | % | (7 | )% | 4 | % | ||||||||||||||||||
|
|
|
|
|
|
|
|
|
|
|
|
|
|
|
|
|
|
|
|||||||||||||||||||
72
Table of Contents
Quarterly Revenue Trends
Our quarterly revenue increased year-over-year for all periods presented primarily due to increased sales to our two largest customers. These increased sales were principally due to our customers deploying our solutions into more of their product variants, and additional demand from their end user customers. While we are not aware of any seasonal or cyclical trends that have influenced our business to date, we cannot assure you that our historical growth has not masked any such seasonal or cyclical trends and that, if such trends exist, they might materially impact our financial results at some point in the future. Therefore, historical patterns in our business may not be a reliable indicator of our future sales activity or performance.
Quarterly Gross Margins Trends
Total gross profit increased year-over-year for all periods presented. Our total quarterly gross margins ranged from 38% to 50% during the periods presented. Any fluctuations are primarily due to shifts in the mix of the types and volume of the products sold, pricing and yields from our contract manufacturer and the mix of sales between products and services.
Quarterly Expense Trends
Total operating expenses generally increased year-over-year for all periods presented primarily due to the addition of personnel in connection with the expansion of our business. Research and development expense generally increased year-over-year for all periods presented as we increased our headcount to support the development of our future product and internal software development tools. Despite the increase in headcount, the decrease in research and development expense from the quarter ended March 31, 2013 compared to the quarter ended March 31, 2014 was mainly due to lower engineering projects and test. Sales and marketing expense generally increased year-over-year for all periods presented due to an increase in personnel costs associated with increases in our headcount in sales and marketing, higher sales commission payments and an increase in marketing programs to support our current revenues and drive future revenue growth. The decrease in sales and marketing expense from the quarter ended March 31, 2013 compared to the quarter ended March 31, 2014 was mainly due to incremental stock-compensation expense resulting from the first round of Series A-2 financing which was completed during the quarter ended March 31, 2013. General and administrative expense generally increased year-over-year for all periods presented primarily due to an increase in personnel, legal expense and higher professional services fees for preparing to be a public company. The decrease in general and administrative expense from the quarter ended March 31, 2013 compared to the quarter ended March 31, 2014 was mainly due to incremental stock-compensation expense resulting from the first round of Series A-2 financing which was completed during the quarter ended March 31, 2013.
Internal Control Over Financial Reporting
Prior to this offering we were a private company and have had limited accounting and financial reporting personnel and other resources with which to address our internal controls and procedures. In connection with the audit of our consolidated financial statements as of and for the years ended December 31, 2012 and 2013 and the review of financial statements for the nine months ended September 30, 2014, we identified two material weaknesses in our internal control over financial reporting, as defined in the standards established by the Public Company Accounting Oversight Board of the U.S. A material weakness is a deficiency, or a combination of deficiencies, in internal control over financial reporting such that there is a reasonable possibility that a material misstatement of our financial statements will not be prevented or detected on a timely basis. The identified material weaknesses related to (1) our lack of sufficient, qualified personnel in accounting and financial reporting functions with sufficient experience and expertise with respect to the application of U.S. GAAP and related financial reporting, which resulted in a number of post-close adjustments to the consolidated financial statements as of and for the years ended December 31, 2012 and 2013, and (2) our controls for the preparation of the provision for income taxes, resulting principally from the allocation of certain costs from our U.S. parent to one of our foreign subsidiaries which resulted in adjustments to our income tax provision for the nine months ended September 30, 2014.
73
Table of Contents
Our management and independent registered public accounting firm did not and were not required to perform an evaluation of our internal control over financial reporting as of and for the years ended December 31, 2012, 2013 and 2014 in accordance with the provisions of the JOBS Act.
While we believe that we have put in place additional controls over our accounting close procedures, including hiring additional staff, adding additional reviews and approvals over monthly provisions, including our income tax provision, our remediation efforts are still in process and have not yet been tested. Therefore, we cannot assure you that the material weaknesses in our internal control over financial reporting have been fully remediated as of March 31, 2015. In addition, we cannot be certain that any such measures we undertake will successfully remediate those two material weaknesses or that other material weaknesses and control deficiencies will not be discovered in the future. If our remediation efforts are not successful or other material weaknesses or control deficiencies occur in the future, we may be unable to report our financial results accurately or on a timely basis, which could cause our reported financial results to be materially misstated and result in the loss of investor confidence or delisting and cause the trading price of our common stock to decline. As a result of such failures, we could also become subject to investigations by the stock exchange on which our securities are listed, the SEC, or other regulatory authorities, and become subject to litigation from investors and stockholders, which could harm our reputation, financial condition or divert financial and management resources from our core business. See “Risk Factors—We identified two material weaknesses in our internal controls over financial reporting that, if not properly remediated, could result in material misstatements in our financial statements in future periods and impair our ability to comply with the accounting and reporting requirements applicable to public companies.”
Liquidity and Capital Resources
| As of December 31, | As of March 31, |
|||||||||||||||||||
| 2013 | 2014 | 2015 |
||||||||||||||||||
| (In thousands) | (Unaudited) | |||||||||||||||||||
| Cash and cash equivalents |
$ | 7,423 | $ | 8,790 | $9,222 | |||||||||||||||
|
|
|
|
|
|
|
|||||||||||||||
| Year Ended December 31, | Three Months Ended March 31, |
|||||||||||||||||||
| 2012 | 2013 | 2014 | 2014 | 2015 | ||||||||||||||||
| (In thousands) | (Unaudited) | |||||||||||||||||||
| Cash flow provided by (used in) operating activities |
$ | (10,442 | ) | $ | (13,478 | ) | $ | 542 | $ | (74 | ) | $ | 1,461 | |||||||
| Cash flow used in investing activities |
(524 | ) | (2,129 | ) | (5,417 | ) | (1,778 | ) | (361 | ) | ||||||||||
| Cash flow provided by (used in) financing activities |
3,228 | 20,227 | 6,242 | (71 | ) | (668 | ) | |||||||||||||
|
|
|
|
|
|
|
|
|
|
|
|||||||||||
| Net increase (decrease) in cash and cash equivalents |
$ | (7,738 | ) | $ | 4,620 | $ | 1,367 | $ | (1,923 | ) | $ | 432 | ||||||||
|
|
|
|
|
|
|
|
|
|
|
|||||||||||
Primary sources of liquidity. As of December 31, 2013 and 2014 and March 31, 2015, our primary sources of liquidity consisted of cash and cash equivalents of $7.4 million, $8.8 million and $9.2 million, respectively. As of December 31, 2013 and 2014 and March 31, 2015, cash and cash equivalents included $0.5 million, $0.6 million and $0.6 million, respectively, held by our foreign subsidiaries, which we do not currently intend to repatriate. Our borrowings under our revolving line of credit as of December 31, 2013 and 2014 and March 31, 2015 was $5.0 million, $8.0 million and $8.0 million, respectively. As of December 31, 2013 and 2014 and March 31, 2015, our working capital was $15.3 million, $19.6 million and $17.7 million, respectively. We believe we have sufficient cash to meet operational and liquidity needs over the next 12 months.
Historically, our primary sources of liquidity have been from our revolving line of credit and term loans and proceeds from the issuance of preferred and common stock. From inception through March 31, 2015, we issued preferred and common stock with aggregate net proceeds of $129.8 million.
74
Table of Contents
Cash Flows from Operating Activities
Our primary source of cash from operating activities has been from cash collections from our customers. We expect cash inflows from operating activities to be affected by increases in sales and timing of collections. Our primary uses of cash from operating activities have been for personnel costs and investment in sales and marketing and research and development. We expect cash outflows from operating activities to increase as a result of further investment in sales and marketing and increases in personnel costs as we grow our business.
During the three months ended March 31, 2015, cash provided by operating activities was $1.5 million, primarily from net income of $0.7 million and non-cash charges of $0.8 million, primarily related to stock-based compensation and depreciation and amortization.
During the three months ended March 31, 2014, cash used in operating activities was $0.1 million, primarily from net change in our net operating assets and liabilities of $0.9 million, partially offset by a net income of $0.4 million and non-cash charges of $0.4 million, primarily related to stock-based compensation and depreciation and amortization.
During the year ended December 31, 2014, cash provided by operating activities was $0.6 million, primarily from net loss of $1.1 million, non-cash charges of $3.9 million, primarily related to depreciation and amortization and stock-based compensation, and a net change in our net operating assets and liabilities of $2.2 million. The change in our net operating assets and liabilities was primarily due to a $4.5 million increase in inventory for anticipated growth in our business, a $7.1 million increase in accounts receivable due to an increase in sales, a $3.1 million increase in non-current income taxes payable and a $0.9 million decrease in deferred revenues and other non-current liabilities. These changes were partially offset by a $5.4 million increase in accounts payable primarily attributable to inventory purchases and timing of payments, and a $1.7 million increase in accrued expenses primarily due to timing of payments and increased personnel costs associated with increases in our headcount and consulting expenses to support revenue growth and improve financial systems and processes.
During the year ended December 31, 2013, cash used in operating activities was $13.5 million, primarily from net loss of $7.8 million, non-cash charges of $2.6 million and a net change in our net operating assets and liabilities of $8.3 million. The change in our net operating assets and liabilities was primarily due to a $5.5 million increase in inventory due to inventory purchases, a $3.5 million increase in accounts receivable due to increased sales, a $0.3 million decrease in prepaid expenses and other current assets, a $0.1 million decrease in accrued expenses and other current liabilities and a $0.5 million decrease in deferred revenues due to timing of revenue recognition. This decrease was partially offset by a $1.0 million increase in accounts payable primarily attributable to inventory purchases and timing of payments.
During the year ended December 31, 2012, cash used in operating activities was $10.4 million, primarily from net loss of $15.4 million, non-cash charges of $1.0 million and a net change in our net operating assets and liabilities of $4.0 million. The change in our net operating assets and liabilities was primarily due to a $1.5 million decrease in inventory due to increased sales, a $1.3 million increase in accounts payable due to timing of payments, and a $0.3 million increase in accrued expenses and other current and non-current liabilities due to timing of payments and a $1.0 million increase in deferred revenues due to increased sales. This increase was partially offset by a $0.1 million increase in accounts receivable and prepaid expenses and other current assets.
Cash Flows from Investing Activities
Our investing activities have consisted primarily of purchases of property and equipment, including mask sets. We expect to continue to purchase property and equipment to support continued growth of our business. During the three months ended March 31, 2014 and 2015, cash used in investing activities was $1.8 million and $0.4 million, respectively, due to purchases of property and equipment, primarily mask sets. During the year ended December 31, 2014, cash used in investing activities was $5.4 million, due to purchases of property and
75
Table of Contents
equipment, primarily mask sets. During the year ended December 31, 2013, cash used in investing activities was $2.1 million, all of which was for property and equipment. During the year ended December 31, 2012, cash used in investing activities was $0.5 million, all of which was for property and equipment.
Cash Flows from Financing Activities
Cash flows from financing activities primarily include net proceeds from issuances of convertible preferred stock, proceeds from the issuance of common stock as a result of the exercise of stock options, and proceeds and payments related to our term loans and revolving line of credit.
During the three months ended March 31, 2015, cash used in financing activities was $0.7 million, mainly due to payment of deferred offering costs.
During the three months ended March 31, 2014, cash used in financing activities was $0.1 million, mainly due to payments on property and equipment acquired through financing arrangements.
During the year ended December 31, 2014, cash provided by financing activities was $6.2 million, mainly from proceeds from our term loans and revolving line of credit.
During the year ended December 31, 2013, cash provided by financing activities was $20.2 million, mainly consisting of $21.7 million in proceeds from our term loans and revolving line of credit, $15.5 million in proceeds from issuance of convertible preferred and common stock, and $1.5 million in proceeds from issuance of bridge notes, offset by $18.1 million in repayments on outstanding term loans and revolving line of credit and $0.4 million in payments on property and equipment acquired through financing arrangement.
During the year ended December 31, 2012, cash provided by financing activities was $3.2 million, mainly consisting of $5.0 million in proceeds from our term loans and revolving line of credit and $6.2 million in proceeds from issuance of convertible preferred and common stock and bridge notes, offset by $7.9 million in repayments on outstanding term loans and revolving line of credit and $0.1 million in payments on property and equipment acquired through financing arrangement.
Debt Obligations
The following is a summary of our debt obligations as of December 31, 2013 and 2014 and March 31, 2015:
| December 31, 2013 |
December 31, 2014 |
As of March 31, 2015 |
||||||||||
| (Unaudited) | ||||||||||||
| (In thousands) | ||||||||||||
| Term loans |
$ | 5,798 | $ | 8,817 | $ | 8,866 | ||||||
| Revolving line of credit |
4,950 | 7,950 | 7,950 | |||||||||
| Vendor financing arrangement |
1,381 | 1,280 | 1,302 | |||||||||
| Capital lease obligation |
— | 376 | 349 | |||||||||
|
|
|
|
|
|
|
|||||||
| $ | 12,129 | $ | 18,423 | $ | 18,467 | |||||||
|
|
|
|
|
|
|
|||||||
We intend to use approximately $19.0 million of the net proceeds we receive from this offering to prepay the entirety of the outstanding indebtedness, including applicable prepayment penalties, under our debt obligations described in this section titled “—Liquidity and Capital Resources—Debt Obligations.” However, our intentions to prepay our debt may change due to market or other factors.
76
Table of Contents
Term loans
In September 2010, we entered into a loan and security agreement, as amended at various dates from 2010 to 2014 (collectively, the Amended SVB Agreement), with Silicon Valley Bank (SVB) for a total growth capital loan of $5.0 million and advances under a revolving line of credit up to $8.0 million. The Amended SVB Agreement contains restrictive covenants, including covenants requiring us to meet quarterly gross revenues targets, limiting our ability to sell property, enter into mergers and acquisitions, or raise new debt and containing other restrictions typical of such debt. The Amended SVB Agreement contains usual and customary events of default, such as payment defaults, covenant defaults, investor abandonment, cross-default to material indebtedness and contracts, and insolvency defaults. Our borrowings under the Amended SVB Agreement are secured by a lien granted with respect to substantially all of our assets, excluding intellectual property. The amendment in December 2014 provides for a change in the covenant relating to the maximum amounts that can be held in foreign deposit accounts from $0.25 million to $0.8 million and also for the extension of the maturity date for the revolving line of credit from September 30, 2015 to September 25, 2016.
The $5.0 million growth capital loans were made in two tranches. The first $3.0 million tranche was available immediately upon execution of the Amended SVB Loan Agreement. The second $2.0 million tranche was contingent upon us achieving a certain milestone. Under the terms of the Amended SVB Loan Agreement, we borrowed $3.0 million under the growth capital facility during September 2010 and $2.0 million during January 2011. We paid off all the outstanding balance under the growth capital facility during September 2013.
In April 2011, we entered into a loan and security agreement (GHC Loan Agreement) with Gold Hill Capital 2008 L.P. (GHC) for a total growth capital facility of $3.0 million. Under the terms of the GHC Loan Agreement, we borrowed $3.0 million under the growth capital facility during the year ended December 31, 2011. We paid off all the outstanding balance under the growth capital facility during September 2013.
In September 2013, we entered into a venture loan and security agreement with Horizon Technology Finance Corporation and DBD Credit Funding LLC (Original Horizon Venture Loan Agreement) and immediately borrowed the entire $6.0 million in term loans available under that facility. Our obligations under the Original Horizon Venture Loan Agreement are secured by a lien granted with respect to substantially all of our assets, excluding intellectual property. The Original Horizon Venture Loan Agreement contained usual and customary events of default, such as payment defaults, covenant defaults, material adverse change, investor abandonment, cross-default to material indebtedness, and insolvency defaults. The notes carry a fixed interest rate of 11%, with interest-only payments through and including October 1, 2015 and then equal principal and interest payments for an additional 24 months. In connection with the issuance of the notes, we agreed to make a final payment of $0.15 million upon maturity of the notes, which is being recorded as additional interest expense using the effective interest method over the life of the notes. There are prepayment penalties with respect to the notes. In September 2013, we repaid the outstanding balance of the debts owed to SVB and GHC as discussed above, using the proceeds received from the Original Horizon Venture Loan Agreement.
In September 2014, the Original Horizon Venture Loan Agreement was amended and restated (Amended Horizon Venture Loan Agreement) mainly to make two new term loans available to us, and we immediately borrowed the entire $3.0 million in additional term loans available under the facility. Our borrowings under the Amended Horizon Venture Loan Agreement are secured by a lien granted with respect to substantially all of our assets, excluding intellectual property. The Amended Horizon Venture Loan Agreement prohibits the payment of dividends and contains restrictive covenants, including covenants limiting its ability to sell property, enter into merger and acquisitions, raise new debt, and other restrictions typical of such debt. The Amended Horizon Venture Loan Agreement contains usual and customary events of default, such as payment defaults, covenant defaults, material adverse change, investor abandonment, cross-default to material indebtedness, and insolvency defaults. The notes related to the new term loans carry a fixed interest rate of 10.75%, with interest-only payments through and including October 1, 2015 and then equal principal and interest payments for an additional 30 months. In connection with the issuance of the new term loan notes, we agreed to make a final payment of
77
Table of Contents
$0.1 million with respect to such term loans, which is being recorded as additional interest expense using the effective interest method over the life of the notes. There are prepayment penalties for the new term notes. In December 2014, the Horizon Venture Loan Agreement was amended to provide for a change in the covenant relating to the maximum amounts that can be held in foreign deposit accounts from $0.25 million to $0.8 million.
Revolving Line of Credit
Under the terms of the Amended SVB Loan Agreement, we are able to borrow up to $8.0 million under the revolving line of credit. The line of credit carries a floating interest rate equal to prime plus 1.5% and matures on September 25, 2016. Borrowings under the line of credit were collateralized by all of our assets, excluding intellectual property, and the availability of borrowings under the line of credit is subject to certain borrowing base limitations. Subject to reduction based upon revenue test, the maximum amount available for borrowing under the revolving line of credit is not to exceed the lesser of $8.0 million or 85% of eligible accounts receivable. The revolving line of credit includes both a material adverse change clause and a lock-box arrangement.
Vendor Financing Arrangement
We have an existing arrangement, as amended, with DNP America LLC (DNP) which provides for the purchase of mask sets to be paid over a period of time based on the actual purchase of additional mask sets over the remaining term of the agreement. The terms of the agreement initially provided for repayment of any unpaid amounts on the purchase of mask sets by December 2010, which date was later extended to December 2012. The terms of the agreement were modified in December 2012 as follows:
| (a) | The extension to December 2016 for the repayment of any unpaid amounts payable to DNP towards purchases of mask sets by us; and |
| (b) | An increase in the amounts due to DNP by a total of $0.2 million repayable by us at a pre-determined amount at the time of purchases of subsequent mask sets and any unpaid amounts remaining due of the $0.2 million to be paid prior to January 2015. |
The modification of the aggregate principal balance due to DNP with a net carrying amount of $1.4 million prior to the December 2012 modification resulted in a troubled debt restructuring accounting treatment under ASC Topic 470-60 where no gain or loss was recognized due to fact that the carrying amount of the debt balance was less than total future cash payments specified by the terms of the debt remaining unsettled after the modification. The net carrying amount due to DNP was $1.4 million, and $1.3 million at December 31, 2013 and 2014, respectively.
In February 2015, the terms of the agreement have been modified as follows:
| • | The extension to January 2016 of the repayment of the $0.2 million discussed in (b) above repayable by us at a pre-determined amount at the time of purchase of subsequent mask sets to the extent any amounts remaining due of the $0.2 million. |
| • | The extension to January 2017 for the repayment of any unpaid amounts payable to DNP towards purchase of mask sets by us. |
The net carrying amount due to DNP was $1.3 million as of March 31, 2015.
78
Table of Contents
Contractual Obligations and Commitments
The following is a summary of our contractual obligations as of December 31, 2014:
| Total | Less than 1 year |
1 to 3 years |
3 to 5 years |
Over 5 years |
||||||||||||||||
| (In thousands) | ||||||||||||||||||||
| Operating lease obligations(1) |
$ | 888 | $ | 433 | $ | 455 | $ | — | $ | — | ||||||||||
| Capital lease obligations(2) |
376 | 121 | 255 | — | — | |||||||||||||||
| Time-based software license commitments(3) |
4,484 | 2,521 | 1,963 | — | — | |||||||||||||||
| Non-cancellable open purchase orders |
3,774 | 3,774 | — | — | — | |||||||||||||||
| Vendor financing arrangement(4) |
1,280 | — | 1,280 | — | — | |||||||||||||||
| Debt maturities(5) |
16,767 | 818 | 15,949 | — | — | |||||||||||||||
|
|
|
|
|
|
|
|
|
|
|
|||||||||||
| Total |
$ | 27,569 | $ | 7,667 | $ | 19,902 | $ | — | $ | — | ||||||||||
|
|
|
|
|
|
|
|
|
|
|
|||||||||||
| (1) | Operating lease obligations primarily relate to our leases of office space with terms through 2017. |
| (2) | Capital lease obligations relate to the lease of certain data storage equipment with terms through 2017. |
| (3) | Time-based software license commitments represent time-based software license arrangements requiring quarterly payments through 2017. |
| (4) | Payables toward mask set dues represents the unpaid amounts payable to DNP towards purchases of mask sets by us to be settled by January 2017. |
| (5) | Debt maturities represent the outstanding principal balances under our revolving line of credit and term loans. |
As of December 31, 2014, we had a $3.1 million liability for uncertain tax positions. This was excluded from the above table due to uncertainty on the timing of payments.
Off-Balance Sheet Arrangements
During the periods presented, we did not have any relationships with unconsolidated entities or financial partnerships, such as entities often referred to as structured finance or special purpose entities, which would have been established for the purpose of facilitating off-balance sheet arrangements or other contractually narrow or limited purposes.
Segment Information
We have one primary business activity and operate in one reportable segment.
Quantitative and Qualitative Disclosures about Market Risk
Foreign Currency Risk
Our results of operations and cash flows are subject to fluctuations due to changes in foreign currency exchange rates.
Substantially all of our revenues are denominated in U.S. dollars. Our expenses are generally denominated in the currencies in which our operations are located, which is primarily in the United States and to a lesser extent in Europe and Asia. Our results of operations and cash flows are, therefore, subject to fluctuations due to changes in foreign currency exchange rates and may be adversely affected in the future due to changes in foreign exchange rates. The effect of a hypothetical 10% change in foreign currency exchanges rates applicable to our business would not have a material impact on our historical consolidated financial statements.
79
Table of Contents
Interest Rate Risk
We had cash and cash equivalents of $7.4 million, $8.8 million and $9.2 million as of December 31, 2013 and 2014 and March 31, 2015, respectively, consisting of bank deposits and money market funds. Such interest-earning instruments carry a degree of interest rate risk. To date, fluctuations in interest income have not been significant. We also had total outstanding debt of $12.1 million as of December 31, 2013, none of which was due within 12 months. As of December 31, 2014, we had total outstanding debt of $18.0 million, of which $2.2 million was due within 12 months. As of March 31, 2015, we had total outstanding debt of $18.1 million of which $1.8 million was due within 12 months. The outstanding debt relates to term loans, revolving line of credit and vendor financing arrangement.
We do not enter into investments for trading or speculative purposes and have not used any derivative financial instruments to manage our interest rate risk exposure. We have not been exposed to, nor do we anticipate being exposed to, material risks due to changes in interest rates. Our exposure to interest rates relates to the change in the amounts of interest we must pay on our variable rate borrowings. A hypothetical 10% increase in our borrowing rates would result in an approximately $0.1 million annual increase in interest expense on the existing principal balances.
Concentration
During the year ended December 31, 2014 and three months ended March 31, 2015, we generated revenues from over 14 customers and 10 customers, respectively, including Ericsson, Fujitsu, Huawei, NEC, Omnivision, Seagate and Toshiba. The number of customers varies between different periods due to timing of orders from customers. In 2012, 2013, 2014 and the first three months of 2015, Ericsson and Seagate together accounted for 73%, 87%, 93% and 95%, respectively, of our total revenues. For the three months ended March 31, 2015, Ericsson represented 79% of our total revenues. We currently expect that a relatively small number of customers will continue to account for a significant portion of our revenues for the foreseeable future. However, we believe that based on our existing design wins, our customer concentration will decrease over time. In addition, we believe that, given the market share concentration in our target markets, our customers’ ability to use our platform to provide differentiated products will allow us to expand our market share within our existing customer base and continue to penetrate new customers. We believe this will position us to gain market share within the $78 billion ASIC, ASSP and FPGA markets.
Critical Accounting Policies and Estimates
Our consolidated financial statements have been prepared in accordance with GAAP. The preparation of these consolidated financial statements requires us to make estimates and assumptions that affect the reported amounts of assets, liabilities, revenues, expenses and related disclosures. We base our estimates on historical experience and on various other assumptions that we believe are reasonable under the circumstances. We evaluate our estimates and assumptions on an ongoing basis. Actual results may differ from these estimates. To the extent that there are material differences between these estimates and our actual results, our future financial statements will be affected.
The critical accounting policies requiring estimates, assumptions and judgments that we believe have the most significant impact on our consolidated financial statements are described below.
Revenue Recognition
We earn revenues from the sale of custom ICs, design and development of ICs for customers and related design services and prototypes. When we enter into an arrangement that includes a design and development phase and a production phase, the production revenues are recognized when production ICs are shipped.
We recognize revenues when there is persuasive evidence of an arrangement, delivery has occurred, the price is fixed or determinable and collectability is reasonably assured. The delivery criterion for each type of product and service is discussed below.
80
Table of Contents
Product Revenues. Product revenues are generated from sales of our custom ICs. We recognize product revenues at the time of shipment to our customers. A substantial majority of our sales are made on a VMI basis in which we maintain inventory of our product at a hub. Title to that inventory transfers to our customer, and revenues are recognized, when our products are “pulled” from our hub locations or delivered to our customers, as needed to meet their manufacturing requirements. We invoice our customer when this pull transaction occurs. In addition, we sell to non-stocking distributors that sell directly to end-users for which we do not grant return privileges, except for defective products during the warranty period, nor do we grant pricing credits. Accordingly, we recognize revenues upon transfer of title and risk of loss or damage, generally upon shipment.
Service Revenues. We perform design and development services for ICs to a customer’s specifications and apply the proportional performance method based on the achievement of contractual milestones. We have identified the acceptance of the design and prototype delivery as separate elements in the design and development arrangement. The revenues are allocated between such elements based on relative selling price. The selling price for a deliverable is based on its vendor specific evidence of fair value (VSOE) if available; third-party evidence (TPE), if VSOE is not available, or estimated selling prices (ESP), if neither VSOE nor TPE is available. Revenues and the related costs for each of these elements are recognized upon completion of the substantive milestones. If achievement of milestones is subject to customer acceptance, such milestones are not considered achieved until customer acceptance is received. As we have not been able to establish VSOE or TPE for our products and most of our services, we generally utilize Best Estimated Selling Prices (BESP) for the purposes of allocating revenues to each unit of accounting. We limit the amount of revenue recognition for delivered elements to the amount that is not contingent on the future delivery of products or services or future performance obligations and not subject to customer-specific return or refund privileges.
Deferred revenues consists of amounts that have been invoiced relating to product revenues but that have not been recognized as revenues in accordance with our revenue recognition policy. Deferred revenues that will be realized during the succeeding 12 month period are recorded as current, and the remaining deferred revenues are recorded as non-current.
At the inception of the customer arrangement, and at each reporting date thereafter, we estimate the total cost to complete under its arrangements. If at any point of time during the arrangement, we estimate the total cost to complete is higher than the arrangement price, a provision for the entire loss is recorded in the period in which such estimation is made.
We also derive revenues from sale of third party IP solutions. At the request of our customers, we procure third party IP solutions in order for them to port such third party IP solutions on the design of the ICs, the costs of which are then passed through to our customers. The determination of whether revenues should be reported on a gross or net basis is based on our assessment of whether we are acting as the principal or an agent in the transaction. In determining whether we are the principal or an agent, we follow the accounting guidance for principal-agent considerations. When we determine we are not the primary obligor and (i) are not responsible for any development work on such third party IP (ii) do not have any discretion to select the third party IP provider, and (iii) do not have latitude in price setting, then we conclude that we are the agent in these arrangements, and therefore report revenues and cost of revenues on a net basis.
Stock-Based Compensation
Compensation expense related to stock-based transactions, including employee, consultants, and non-employee director stock options, is measured and recognized in the financial statements based on the fair value of the awards granted. The fair value of each option award is estimated on the grant date using the Black-Scholes option-pricing model and a single option award approach. Stock-based compensation expense is recognized, net of forfeitures, over the requisite service periods of the awards, which is generally four years.
81
Table of Contents
Our use of the Black-Scholes option-pricing model requires the input of highly subjective assumptions, including the fair value of the underlying common stock, the expected term of the option, the expected volatility of the price of our common stock, risk-free interest rates, and the expected dividend yield of our common stock. The assumptions used in our option-pricing model represent management’s best estimates. These estimates involve inherent uncertainties and the application of management’s judgment. If factors change and different assumptions are used, our stock-based compensation expense could be materially different in the future.
These assumptions and estimates are as follows:
| • | Fair value of common stock. Because our common stock is not yet publicly traded, we must estimate the fair value of common stock, as discussed in “Common Stock Valuations” below. |
| • | Risk-free interest rate. We base the risk-free interest rate used in the Black-Scholes option-pricing model on the implied yield available on U.S. Treasury zero-coupon issues with a remaining term equivalent to that of the options for each option group. |
| • | Expected term. The expected term represents the period that our stock-based awards are expected to be outstanding. We base the expected term assumption on our historical exercise behavior combined with estimates of the post-vesting holding period. |
| • | Volatility. We determine the price volatility factor based on the historical volatilities of our publicly traded peer group as we do not have a trading history for our common stock. Industry peers consist of several public companies in the technology industry that are similar to us in size, stage of life cycle, and financial leverage. We used the same set of peer group companies in all the relevant valuation estimates. We did not rely on implied volatilities of traded options in our industry peers’ common stock because the volume of activity was relatively low. We intend to continue to consistently apply this process using the same or similar public companies until a sufficient amount of historical information regarding the volatility of our own common stock share price becomes available, or unless circumstances change such that the identified companies are no longer similar to us, in which case, more suitable companies whose share prices are publicly available would be utilized in the calculation. |
| • | Dividend yield. We have never declared or paid any cash dividend and do not currently plan to pay a cash dividend in the foreseeable future. Consequently, we used an expected dividend yield of zero. |
The following table summarizes the assumptions used in the Black-Scholes option-pricing model to determine the fair value of our stock options as follows:
| Years Ended December 31, | Three Months Ended March 31, |
|||||||||||||||||||
| 2012 | 2013 | 2014 | 2014 | 2015 | ||||||||||||||||
| (Unaudited) | ||||||||||||||||||||
| Fair value per share of common |
$0.75 | $0.75 | $1.28 – $8.83 | $1.28 | $11.81 | |||||||||||||||
| Expected volatility |
54% | 46% | 46% – 49% | 49% | 43% | |||||||||||||||
| Expected life in years |
6.08 | 5.77 – 6.08 | 6.08 | 6.08 | 6.08 | |||||||||||||||
| Risk-free interest rate |
1.01% – 1.17% | 1.08% – 1.35% | 1.78% – 1.93% | 1.78% | 1.38% | |||||||||||||||
| Dividend yield |
— | — | — | — | — | |||||||||||||||
In addition to the assumptions used in the Black-Scholes option-pricing model, we must also estimate a forfeiture rate to calculate the stock-based compensation expense for our awards. Our forfeiture rate is based on an analysis of our actual forfeitures and was 15%, 13% and 20% for the years ended December 31, 2012, 2013 and 2014, respectively, and was 20% and 13% for the three months ended March 31, 2014 and 2015. We will continue to evaluate the appropriateness of the forfeiture rate based on actual forfeiture experience, analysis of employee turnover, and other factors. Quarterly changes in the estimated forfeiture rate can have a significant impact on our stock-based compensation expense as the cumulative effect of adjusting the rate is recognized in the period the forfeiture estimate is changed. If a revised forfeiture rate is higher than the previously estimated
82
Table of Contents
forfeiture rate, an adjustment is made that will result in a decrease to the stock-based compensation expense recognized in the financial statements. If a revised forfeiture rate is lower than the previously estimated forfeiture rate, an adjustment is made that will result in an increase to the stock-based compensation expense recognized in the financial statements.
We will continue to use judgment in evaluating the assumptions related to our stock-based compensation on a prospective basis. As we continue to accumulate additional data related to our common stock, we may have refinements to our estimates, which could materially impact our future stock-based compensation expense.
Common Stock Valuations
We are required to estimate the fair value of the common stock underlying our stock-based awards when performing the fair value calculations with the Black-Scholes option-pricing model. The fair values of the common stock underlying our stock-based awards were determined by our board of directors, with input from management and independent contemporaneous valuations. We believe that our board of directors has the relevant experience and expertise to determine the fair value of our common stock.
Given the absence of a public trading market of our common stock, and in accordance with the American Institute of Certified Public Accountants Practice Guide, Valuation of Privately-Held-Company Equity Securities Issued as Compensation, our board of directors exercised reasonable judgment and considered numerous objective and subjective factors to determine the best estimate of the fair value of our common stock, including:
| • | independent contemporaneous valuations; |
| • | the prices, rights, preferences, and privileges of our convertible preferred stock relative to those of our common stock; |
| • | the lack of marketability of our common stock; |
| • | our actual operating and financial performance; |
| • | current business conditions and projections; |
| • | our stage of development; |
| • | the likelihood of achieving a liquidity event, such as an initial public offering of our company given prevailing market conditions; |
| • | the illiquidity of stock-based awards involving securities in a private company; |
| • | the market performance of comparable publicly traded companies; and |
| • | the U.S. and global capital market conditions. |
In order to determine the fair value of our common stock underlying option grants, we first determined our business enterprise value (BEV), and then allocated the BEV to each element of our capital structure (preferred stock, common stock, warrants and options). Our BEV was estimated using an income approach.
The income approach estimates the equity value based on the present value of future estimated cash flows. These future cash flows are discounted to their present values using a discount rate, which is derived from an analysis of the cost of capital of comparable publicly traded companies in the same industry or similar lines of business, or guideline companies, as of each valuation date. This weighted-average cost of capital discount rate (WACC), is adjusted to reflect the risks inherent in the business. The WACC used for these valuations was determined to be reasonable and appropriate given our stage of development at the time of each respective valuation. The income approach also assesses the residual value beyond the forecast period utilizing the Gordon Growth Model, capitalizing cash flow in the final year of the projected forecast over the sum of the discount rate less the expected long-term growth rate.
83
Table of Contents
The market approaches were not relied upon for these valuations. However, the Public Company Market Multiple Method (PCMMM) was used as a reasonableness check. In addition, the PCMMM was utilized in our Probability-Weighted Expected Return Method (PWERM) approach discussed further below.
Our indicated BEV at each valuation date was allocated to the shares of preferred stock, common stock, warrants and options, using either an option pricing method (OPM) or PWERM.
The PWERM approach involves the estimation of future potential outcomes for us, as well as values and probabilities associated with each respective potential outcome. The common stock per share value determined using this approach is ultimately based upon probability-weighted per share values resulting from the various future scenarios, which can include an IPO, merger or sale, dissolution, or continued operation as a private company. The PWERM was determined to be the most appropriate methodology due to our expectations related to a potential liquidity event, as well as management’s ability to estimate probabilities related to identified exit scenarios.
Our equity value in an IPO scenario was estimated by evaluating multiples of the guideline companies’ enterprise values (EV), compared to trailing 12 months (TTM) revenues and/or EBITDA and forward 12 months (FTM) revenues and/or EBITDA. Our equity value in a merger, acquisition, or in a situation in which we would remain private was determined based on the equity value from our income approach, considering the probability-weighted equity value(s) attributable to all applicable IPO scenarios.
When considering which companies to include as our guideline companies, we focused on U.S. based companies in the semiconductor technology industry in which we operate. More specifically, we focused on companies with similar operations and geographic presence, financial size and performance, and stock liquidity.
The PWERM calculates all outstanding common equivalents and in-the-money warrants or options in order to determine the fully diluted shares outstanding of each share class. The expected future value per share is then calculated based on a liquidity event at the equity price determined using the market approach. This price is then discounted to its present value per share. Finally, the expected present value per share for each share class is then probability weighted according to the expectations regarding the respective likelihood of each liquidity event. Starting in February 2014, due to greater clarity on potential exit scenarios, we began using PWERM to allocate our equity value among the various outcomes.
For the scenario in which we remain private, there was a wide range of possible future exit events, so forecasting specific potential values associated with any future events would be highly speculative and imprecise. As such, the equity value determined by the income approach, and adjusted by the probability-weighted equity values of any other exit scenarios, was then allocated to the common stock using the OPM. The OPM treats common stock and convertible preferred stock as call options on a business, with exercise prices based on the liquidation preference of the convertible preferred stock. Therefore, the common stock has value only if the funds available for distribution to the stockholders exceed the value of the liquidation preference at the time of a liquidity event such as a merger, sale or initial public offering, assuming the business has funds available to make a liquidation preference meaningful and collectible by the stockholders. The common stock is modeled to be a call option with a claim on the business at an exercise price equal to the remaining value immediately after the convertible preferred stock is liquidated. The OPM uses the Black-Scholes option-pricing model to price the call option. The OPM is appropriate to use when the range of possible future outcomes is so difficult to predict that forecasts would be highly speculative.
In addition, we also considered an appropriate discount adjustment to recognize the lack of marketability within each valuation due to being a closely held entity.
84
Table of Contents
Between January 1, 2014 and the date of this prospectus, we granted the following stock options:
| Option grant date(1) |
Number of shares underlying options |
Exercise price per share |
Common stock fair value per share(2) |
|||||||||
| February 2014 |
148,807 | $ | 0.75 | $ | 1.28 | |||||||
| June 2014 |
331,909 | 1.50 | 1.99 | |||||||||
| August 2014 |
417,437 | 2.20 | 3.28 | |||||||||
| October 2014 |
165,931 | 4.06 | 6.21 – 7.61 | |||||||||
| November 2014 |
27,000 | 4.06 | 8.83 | |||||||||
| January 2015 |
88,500 | 11.79 | 11.81 | |||||||||
| (1) | Table does not reflect the stock options to purchase an aggregate of 48,500 shares of common stock that our Compensation Committee has approved to be granted to two employees in connection with the pricing of our initial public offering with an exercise price equal to the initial public offering price. |
| (2) | As used for the determination of stock-based compensation expense. |
The fair value per share of common stock presented in the table above has been adjusted to reflect the 75-for-1 reverse stock split of shares of common stock effected in 2014.
The following discussion relates primarily to our determination of the fair value per share of our common stock for the purposes of calculating stock-based compensation expenses. No single event caused the valuation of our common stock to increase during each period. Instead, a combination of the factors in each period led to the changes in the fair value of our common stock. Notwithstanding the fair value reassessments described below, we believe we applied a reasonable valuation method to determine the common stock fair values on the respective stock option grant dates.
September 30, 2013 Valuation
Our September 30, 2013 valuation considered an independent contemporaneous valuation prepared on a minority, non-marketable basis. This independent third-party valuation was developed using the income approach, specifically a discounted cash flow analysis, to determine our equity value. The discounted cash flow analysis was developed based on our forecast and utilized a WACC of 40%, which is based upon the expected venture capital rates of return over the life of the company. The OPM was then utilized to allocate value for the scenario in which we remained private and included the following assumptions: a time to a liquidity event of two years, a risk-free rate of 0.35%, a dividend yield of 0%, and a volatility of 46% over the time to a liquidity event. The fair value of our common stock, as determined by our board of directors using the OPM and after applying a non-marketability discount of 19%, was $0.75 per share as of September 30, 2013. Our board of directors set an exercise price of $0.75 per share for the options granted in February 2014, taking into account the independent third-party valuation, as well as the factors discussed above under “Common Stock Valuations.”
March 31, 2014 Valuation
Our March 31, 2014 valuation considered an independent contemporaneous valuation prepared on a minority, non-marketable basis. This independent third-party valuation was developed using the income approach, specifically a discounted cash flow analysis, to determine our equity value. The discounted cash flow analysis was developed based on our forecast and utilized a WACC of 18.5%, which represents a blended rate over the life of the company, considering both the higher-risk explicit forecast period and the lower-risk terminal period. The income approach also assesses the residual value beyond the forecast period utilizing the Gordon Growth Model, capitalizing cash flow in the final year of the projected forecast over the sum of the discount rate less the expected long-term growth rate.
85
Table of Contents
The resulting equity value was then allocated to the common stock utilizing an OPM and the PWERM with two scenarios: (i) an IPO in September 2015 scenario and (ii) a merger/acquisition/stay private scenario. The OPM was utilized to allocate value for the scenario in which we remained private and included the following assumptions: a time to a liquidity event of two years, a risk-free rate of 0.44%, a dividend yield of 0%, and a volatility of 45% over the time to a liquidity event. The PWERM was utilized to allocate value in an IPO scenario, and we used an equity value for the IPO based on the PCMMM analysis. The multiples used were EV/TTM Revenue; EV/FTM Revenue; EV/TTM EBITDA; and EV/FTM EBITDA. The probabilities used in the PWERM for the IPO and stay private scenarios were 20% and 80%, respectively. The fair value of our common stock, as determined by our board of directors using the PWERM and after applying a marketability discount of 35%, was $1.50 per share as of March 31, 2014. Our board of directors set an exercise price of $1.50 per share for the options granted in June 2014, taking into account the independent third-party valuation, as well as the factors discussed above under “Common Stock Valuations.”
June 30, 2014 Valuation
Our June 30, 2014 valuation considered an independent contemporaneous valuation prepared on a minority, non-marketable basis. This independent third-party valuation was developed using the income approach, specifically a discounted cash flow analysis, to determine our equity value. The discounted cash flow analysis was developed based on our forecast and utilized a WACC of 17.5%, which represents a blended rate over the life of the company, considering both the higher-risk explicit forecast period and the lower-risk terminal period. The income approach also assesses the residual value beyond the forecast period utilizing the Gordon Growth Model, capitalizing cash flow in the final year of the projected forecast over the sum of the discount rate less the expected long-term growth rate.
The resulting equity value was then allocated to the common stock utilizing an OPM and the PWERM with two scenarios: (i) an IPO in September 2015 scenario and (ii) a merger/acquisition/stay private scenario. The OPM was utilized to allocate value for the scenario in which we remained private and included the following assumptions: a time to a liquidity event of two years, a risk-free rate of 0.47%, a dividend yield of 0%, and a volatility of 44% over the time to a liquidity event. The PWERM was utilized to allocate value in an IPO scenario, and we used an equity value for the IPO based on the PCMMM analysis. The multiples used were EV/TTM Revenue; EV/ FTM Revenue; EV/TTM EBITDA; and EV/FTM EBITDA. The probabilities used in the PWERM for the IPO and stay private scenarios were 25% and 75%, respectively. The fair value of our common stock, as determined by our board of directors using the PWERM and after applying a marketability discount of 35%, was $2.20 per share as of June 30, 2014. Our board of directors set an exercise price of approximately $2.20 per share for the options granted in August 2014, taking into account the independent third-party valuation, as well as the factors discussed above under “Common Stock Valuations.”
The primary reasons for the increase in fair value from the March 31, 2014 valuation to the June 30, 2014 valuation were (i) the decrease in the WACC due to positive changes in our risk profile and improved management expectations for the business and (ii) a 5% increase in the probability of an IPO scenario in the PWERM analysis due to management’s increased expectations related to an IPO.
August 31, 2014 Valuation
Our August 31, 2014 valuation considered an independent contemporaneous valuation prepared on a minority, non-marketable basis. This independent third-party valuation was developed using the income approach, specifically a discounted cash flow analysis, to determine our equity value. The discounted cash flow analysis was developed based on our forecast and utilized a WACC of 17.0%, which represents a blended rate over the life of the Company, considering both the higher-risk explicit forecast period and the lower-risk terminal period. The income approach also assesses the residual value beyond the forecast period utilizing the Gordon Growth Model, capitalizing cash flow in the final year of the projected forecast over the sum of the discount rate less the expected long-term growth rate.
86
Table of Contents
The resulting equity value was then allocated to the common stock utilizing an OPM and the PWERM with three scenarios: (i) and IPO in March 2015 scenario; (ii) an IPO in October 2015; and (iii) a stay private scenario. The OPM was utilized to allocate value for the scenario in which the Company remained private and included the following assumptions: a time to a liquidity event of two years, a risk-free rate of 0.48%, a dividend yield of 0%, and a volatility of 44% over the time to a liquidity event. The PWERM was utilized to allocate value in an IPO scenario, and we used an equity value for the IPO based on the PCMMM analysis. The multiples used were EV/TTM Revenue and EV/FTM Revenue. The probabilities used in the PWERM for the March 2015 IPO, the October 2015 IPO, and the stay private scenarios were 15%, 15%, and 70%, respectively. The fair value of our common stock, as determined by our board of directors using the PWERM and after applying a marketability discount of 30%, was $4.06 per share as of August 31, 2014. Our board of directors set an exercise price of $4.06 per share for the options granted in October 2014 and November 2014, taking into account the August independent third-party valuation as well as the factors discussed above under “Common Stock Valuations.”
The primary reasons for the increase in fair value from the June 30, 2014 valuation to the August 31, 2014 valuation were (i) the increase in the selected market multiples in the market approach due to improved expectations for the market and the business; (ii) the slight decrease in the WACC and improved forecast from management due to improved expectations by management; and (iii) a 5% increase in the probability of an IPO scenario in the PWERM analysis due to management’s increased visibility related to an IPO. In addition, the valuation used a lower marketability discount as we neared the expected liquidity events.
November 30, 2014 Valuation
Our November 30, 2014 valuation considered an independent contemporaneous valuation prepared on a minority, non-marketable basis. This independent third-party valuation was developed using the income approach, specifically a discounted cash flow analysis, to determine our equity value. The discounted cash flow analysis was developed based on our forecast and utilized a WACC of 16.5%, which represents a blended rate over the life of the Company, considering both the higher-risk explicit forecast period and the lower-risk terminal period. The income approach also assesses the residual value beyond the forecast period utilizing the Gordon Growth Model, capitalizing cash flow in the final year of the projected forecast over the sum of the discount rate less the expected long-term growth rate.
The resulting equity value was then allocated to the common stock utilizing an OPM and the PWERM with three scenarios: (i) an IPO in March 2015 scenario; (ii) an IPO in October 2015 scenario; and (iii) a stay private scenario. The OPM was utilized to allocate value for the scenario in which the Company remained private and included the following assumptions: a time to a liquidity event of two years, a risk-free rate of 0.47%, a dividend yield of 0%, and a volatility of 43% over the time to a liquidity event. The PWERM was utilized to allocate value in an IPO scenario, and we used an equity value for the IPO based on the PCMMM analysis. The multiples used were EV/FTM Revenue and EV/TTM Revenue. The probabilities used in the PWERM for the March 2015 IPO, the October 2015 IPO, and the stay private scenarios were 40%, 15%, and 45%, respectively. The fair value of our common stock, as determined by our board of directors using the PWERM and after applying a marketability discount of 12.5%, was $9.09 per share as of November 30, 2014, taking into account the independent third-party valuation, as well as the factors discussed above under “Common Stock Valuations.”
The primary reasons for the increase in fair value from the August 31, 2014 valuation to the November 30, 2014 valuation were (i) a new forecast provided by management; (ii) an increase in the expected equity values upon an exit event for both of the IPO scenarios; and (iii) a 25% increase in the probability of an IPO scenario in the PWERM analysis due to management’s increased visibility related to an IPO. In addition, the independent third-party valuation used a lower marketability discount as we neared the expected liquidity events.
December 31, 2014 Valuation
Our December 31, 2014 valuation considered an independent contemporaneous valuation prepared on a minority, non-marketable basis. This independent third-party valuation was developed using the income
87
Table of Contents
approach, specifically a discounted cash flow analysis, to determine our equity value. The discounted cash flow analysis was developed based on our forecast and utilized a WACC of 15.0%, which represents a blended rate over the life of the Company, considering both the higher-risk explicit forecast period and the lower-risk terminal period. The income approach also assesses the residual value beyond the forecast period utilizing the Gordon Growth Model, capitalizing cash flow in the final year of the projected forecast over the sum of the discount rate less the expected long-term growth rate.
The resulting equity value was then allocated to the common stock utilizing an OPM and the PWERM with three scenarios: (i) an IPO in March 2015 scenario; (ii) an IPO in October 2015 scenario; and (iii) a stay private scenario. The OPM was utilized to allocate value for the scenario in which the Company remained private and included the following assumptions: a time to a liquidity event of two years, a risk-free rate of 0.67%, a dividend yield of 0%, and a volatility of 43% over the time to a liquidity event. The PWERM was utilized to allocate value in an IPO scenario, and we used an equity value for the IPO based on the PCMMM analysis. The multiples used were EV/FTM Revenue and EV/TTM Revenue. The probabilities used in the PWERM for the March 2015 IPO, the October 2015 IPO, and the stay private scenarios were 50%, 25%, and 25%, respectively. The fair value of our common stock, as determined by our board of directors using the PWERM and after applying a marketability discount of 12.5%, was $11.79 per share as of December 31, 2014, taking into account the independent third-party valuation, as well as the factors discussed above under “Common Stock Valuations.” Our board of directors set an exercise price of $11.79 per share for the options granted in January 2015 taking into account the most recent independent third-party valuation prepared at that time as well as the factors discussed above under “Common Stock Valuations.”
The primary reasons for the increase in fair value from the November 30, 2014 valuation to the December 31, 2014 valuation were (i) a decrease in the WACC and (ii) a 20% increase in the probability of an IPO scenario in the PWERM analysis due to management’s increased visibility related to an IPO.
March 31, 2015 Valuation
Our previous common stock valuation was $11.79 as of December 31, 2014. After taking into consideration the current market conditions, our board of directors determined a common stock valuation estimate of $11.96 per share as of March 31, 2015. There has been no single material factor that has influenced the change in the fair value, except passage of time, as the Company gets closer to its anticipated initial public offering.
Repricing of Options
During the year ended December 31, 2013, we repriced a total of 581,285 outstanding options by way of canceling existing outstanding option grants at an exercise price of $2.25 in exchange for new option grants at an exercise price of $0.75. Except for the change in exercise price, the new options had the same terms and conditions as the original options including the contractual term, vesting schedule, and the vesting start date. As a result of such modification, we expensed incremental stock compensation on the date of modification of $0.1 million relating to options that were already vested and another $0.04 million relating to the options that were unvested is expensed over the remaining vesting term of the new options.
Property and Equipment
We incur costs for the fabrication of masks to manufacture our products. Our masks include (a) a proprietary standardized base array optimized for a generic application and (b) a custom layer to address a specific application. If we determine the product technological feasibility has been achieved and estimated market demand for products using the tested array exists when costs are incurred, the costs will be capitalized as manufacturing tooling under property and equipment. If product technological feasibility has not been achieved or the mask is not expected to be utilized in production manufacturing, the related mask costs are expensed to research and development when incurred. The amount capitalized will be amortized to cost of sales on a straight-line basis over the estimated life,
88
Table of Contents
which is estimated to be eight years for the base mask and three years for the custom layer mask commencing with the start of the commercial production. We periodically reassess the estimated useful lives for specific mask sets capitalized. We also periodically assess capitalized mask costs for impairment.
Income Taxes
We account for income taxes in accordance with ASC Topic 740, Income Taxes, under which deferred tax liabilities and assets are recognized for the expected future tax consequences of temporary differences between financial statement carrying amounts and the tax basis of assets and liabilities and net operating loss and tax credit carryforwards. Valuation allowances are established when necessary to reduce deferred tax assets to the amount expected to be realized.
We use a recognition threshold and measurement attribute for the financial statement recognition and measurement of a tax position taken or expected to be taken in a tax return. A tax position is recognized when it is more likely than not that the tax position will be sustained upon examination, including resolution of any related appeals or litigation processes. A tax position that meets the more-likely-than-not recognition threshold is measured at the largest amount of benefit that is greater than 50% likely of being realized upon ultimate settlement with a taxing authority. The standard also provides guidance on derecognition of tax benefits, classification on the balance sheet, interest and penalties, accounting in interim periods, disclosure and transition.
Recent Accounting Pronouncements
In April 2015, the Financial Accounting Standards Board (FASB) issued Accounting Standards Update (ASU) 2015-03 — Simplifying the Presentation of Debt Issuance Costs, which requires that debt issuance costs related to a recognized debt liability be presented in the balance sheet as a direct deduction from the carrying amount of that debt liability, consistent with debt discounts. This ASU requires retrospective adoption and will be effective for us beginning in our first quarter of 2016. Early adoption is permitted. We do not expect this adoption to have a material impact on our consolidated financial statements.
In August 2014, the FASB issued ASU 2014-15 — Disclosure of Uncertainties about an Entity’s Ability to Continue as a Going Concern. ASU 2014-15 requires management to evaluate whether there is substantial doubt about an entity’s ability to continue as a going concern and to provide related footnote disclosures. In doing so, companies will have reduced diversity in the timing and content of footnote disclosures than under today’s guidance. ASU 2014-15 is effective for us in our 2016 annual financial statements with early adoption permitted. We do not believe the impact of adopting ASU 2014-15 on our consolidated financial statements will be material.
In May 2014, the FASB issued ASU No. 2014-09 regarding ASC Topic 606—Revenue from Contracts with Customers. The standard provides principles for recognizing revenues for the transfer of promised goods or services to customers with the consideration to which the entity expects to be entitled in exchange for those goods or services. The guidance is effective for us in the first quarter of fiscal 2017 using either of two methods: (i) retrospective to each prior reporting period presented with the option to elect certain practical expedients as defined within the guidance; or (ii) retrospective with the cumulative effect of initially applying the guidance recognized at the date of initial application and providing certain additional disclosures as defined per the guidance. Early adoption is not permitted. We are currently evaluating the accounting, transition and disclosure requirements of the standard and cannot currently estimate the financial statement impact of adoption.
In July 2013, the FASB issued ASU 2013-11—Presentation of an Unrecognized Tax Benefit When a Net Operating Loss Carryforward, a Similar Tax Loss, or a Tax Credit Carryforward Exists (ASU 2013-11). This standard requires an entity to present an unrecognized tax benefit, or a portion of an unrecognized tax benefit, in the financial statements as a reduction to a deferred tax asset for a net operating loss carryforward, a similar tax loss, or a tax credit carryforward. To the extent a net operating loss carryforward, a similar tax loss, or a tax credit carryforward is not available at the reporting date under the tax law of the applicable jurisdiction to settle
89
Table of Contents
any additional income taxes that would result from the disallowance of a tax position or the tax law of the applicable jurisdiction does not require the entity to use, and the entity does not intend to use, the deferred tax asset for such purpose, the unrecognized tax benefit should be presented in the financial statements as a liability and should not be combined with deferred tax assets. This guidance is effective for fiscal years, and interim periods within those years, beginning after December 15, 2013. Early adoption is permitted. The adoption of ASU 2013-11 did not have a material impact on the consolidated financial statements.
90
Table of Contents
Overview
We have pioneered a differentiated solution that enables us to rapidly and cost-effectively deliver custom integrated circuits (ICs), creating value for our customers’ hardware and software systems. Our eASIC solution consists of our eASIC platform which incorporates a versatile, pre-defined and reusable base array and customizable single-mask layer, our ASICs, delivered by using either our easicopy or standard ASIC methodologies, and our proprietary design tools. Customers can efficiently migrate to our easicopy ASIC from the eASIC platform using our easicopy methodology. We believe our eASIC solution provides the optimal combination of fast time-to-market, high performance, low power consumption, low development cost and low unit cost for our customers. Our solution has broad applicability across a wide range of customers, applications and end markets including communications infrastructure, storage and data processing and industrial applications. Our solution should position us to address additional end markets in the future. As of March 31, 2015, we have leveraged our eASIC platform to develop four generations of eASIC products with increasingly smaller process nodes, and we have designed over 200 custom ICs and shipped over 21 million units.
We believe the need for differentiation through custom ICs is driven by several megatrends, including the proliferation of mobile devices driving the deployment of high capacity and high bandwidth wireless infrastructure, the rapid transition to cloud computing and the emergence of big data analytics. We believe the ability to differentiate hardware and software systems through custom ICs is critical to helping our customers grow faster than their competitors and enhance their profit margins. Historical solutions for customized ICs have included Application Specific Integrated Circuits (ASICs), Application Specific Standard Products (ASSPs) and Field Programmable Gate Arrays (FPGAs). We believe our products avoid the painful tradeoffs associated with these historical solutions. For example, based on data provided by a majority of our customers for power consumption with respect to those customers’ designs using FPGAs, as well as our own internal analysis using the latest generation of custom ICs based on our eASIC platform, we believe that we can enable our customers to reduce power consumption by 50% to 80% compared to FPGAs at the same process node. In addition, in all five cases where customers have required that our design provide an increase in performance, as measured by clock speed of the chip, we have been able to improve performance by 60% to 120% compared to FPGAs at the same process node. With our eASIC platform, we believe our customers can significantly reduce non-recurring engineering (NRE) charges and lower design and manufacturing time by nine to 12 months or more when compared to traditional ASIC design and manufacturing processes. We believe our competitive advantages will increase over time as the costs and complexity associated with the development and manufacturing of future generations of ICs continue to rise.
We estimate that our addressable market opportunity across ASIC, ASSP and FPGA applications is approximately $78 billion, based on data from Gartner Research (Gartner). During the year ended December 31, 2014 and the three months ended March 31, 2015, we sold our products and services to over 14 customers and 10 customers, respectively, including Ericsson, Fujitsu, Huawei, NEC, Omnivision, Seagate and Toshiba. The number of customers varies between different periods due to timing of orders from customers. For the years ended December 31, 2013 and 2014 and the three months ended March 31, 2015, our total revenues were $29.8 million, $67.4 million and $20.1 million, respectively, and our net loss was $7.8 million, and $1.1 million in 2013 and 2014, respectively, and net income was $0.7 million for the three months ended March 31, 2015.
Industry Background
Key technology megatrends driving massive growth in the demand for network bandwidth, computing resources and data storage
The proliferation of mobile devices and wireless connectivity, as users are seeking faster access to video content and applications, has driven the demand for wireless network infrastructure. Mobile users expect to be able to connect to high-speed wireless networks from virtually anywhere and at any time. According to the
91
Table of Contents
Ericsson Mobility Report, global mobile users will grow from 7.1 billion subscriptions in 2014 to 9.5 billion subscriptions in 2020. This growth is largely driven by smartphone adoption, as users increasingly migrate towards faster 3G and 4G (LTE) technologies. According to the same report, mobile data traffic is expected to grow from 3.2 exabytes per month in 2014 to over 25 exabytes per month in 2020, representing a compound annual growth rate (CAGR) of 40% during this period.
The ongoing shift to cloud computing, which allows multiple users to simultaneously execute applications and access data at high speeds, is also creating additional demand for network bandwidth, computing and data storage resources as many enterprise and consumer applications today are delivered as cloud services. The aggregate network bandwidth to support the increased demand for the cloud can be orders of magnitude higher than typical legacy networks. According to International Data Corporation (IDC), storage capacity for cloud deployments (including public and private clouds) is estimated to increase from 68 exabytes in 2014 to 317 exabytes in 2018, representing a CAGR of 47% during this period.
Increasingly, organizations are attempting to capture the value locked in their data to enable more effective application management, IT operations management, security and compliance, and derive intelligence and insight across their organizations. The large and diverse data sets that make up this digital information are often referred to as big data. According to IDC, global data usage is expected to increase from 4.4 trillion gigabytes in 2013 to 44 trillion gigabytes in 2020, a ten-fold increase, representing a CAGR of 39% during this period.
The significant and growing demands on networking, compute and storage infrastructure have resulted in service providers, enterprises and datacenter operators requiring OEMs to rapidly introduce next generation networking, server and storage systems that deliver high return on investment with enhanced functionality and performance, while reducing power consumption and physical footprint.
Historical IC solutions for OEMs
In order to provide semiconductor-based differentiation and customization for their product offerings, OEMs have traditionally had to choose between ASICs, ASSPs and FPGAs. However, these solutions require increasingly painful tradeoffs among time-to-market, performance, power consumption and cost.
An ASIC is a custom IC that is designed and manufactured for one OEM customer to be used in one specific application, and it will often include intellectual property from that OEM or a third party that is embedded into the ASIC. In the past, ASICs represented the most ideal solution for custom ICs since they are capable of offering the highest performance, lowest power and lowest unit production costs. ASIC vendors include Avago, Fujitsu, STMicroelectronics and Toshiba.
An ASSP uses the same design and manufacturing methodology as an ASIC, however, ASSPs are capable of supporting many customers for the same application. While OEMs often combine their own software with an ASSP to differentiate their products, this approach sacrifices performance. Similar to ASICs, ASSPs also offer high performance as well as silicon area and power efficiency. ASSP vendors include Broadcom, Intel, Marvell, MediaTek and Qualcomm.
ASICs and ASSPs both require customization of every mask layer. The need to customize every mask layer leads to long design and manufacturing cycles (typically 21–24 months) and high development cost for design, test and manufacturing setup. The high development cost required is only justified when the return on investment is high enough or the customer can accept the associated tradeoffs. As the costs associated with more complex designs and advanced process nodes have increased over time, these development costs become prohibitive unless the OEMs’ products are sold in sufficient volume to amortize the costs. Further, ASIC and ASSP vendors are unwilling to design them for OEM customers unless they are compensated for significant up-front development costs typically associated with the design.
92
Table of Contents
Given the challenges in providing ASIC and ASSP solutions, many vendors have either exited the market, consolidated or meaningfully reduced the number of designs they are willing to support. As a result, some of the largest OEMs, such as Amazon, Apple, Cisco, Google and Huawei have created or acquired semiconductor design teams to help them design internal ASICs to add unique value to their products. These in-house design teams, however, face the same financial and technical challenges as the traditional ASIC and ASSP vendors.
Given the cost and time-to-market challenges associated with custom ASICs and ASSPs, FPGAs with software-enabled customization were developed to provide OEMs with a solution that enables them to cost-effectively create a custom IC. FPGAs typically offer low development costs and enable fast time-to-market, but in order to be programmable, they require a significant number of transistors resulting in high unit costs, relatively limited performance and high power consumption. Historically, FPGAs have been the preferred solution for initial market validation, but due to their high unit costs, power consumption and performance limitations, they are not well-suited for high volume production or certain high performance or power efficient applications. Moreover, transitioning from an FPGA to an ASIC design can be time-consuming and expensive. FPGA vendors include Altera, Lattice Semiconductor and Xilinx.
Design costs have risen, creating challenges for OEMs leveraging ASICs
Key technology megatrends are increasing demand for ASICs. However, escalating research, development and design costs associated with the migration to smaller geometry and increasing density of transistors per unit area, are hampering the ability of OEMs to leverage ASICs to address that demand. The following chart shows estimated initial design costs of an IC at various process nodes as reported by International Business Strategies, Inc. (IBS):
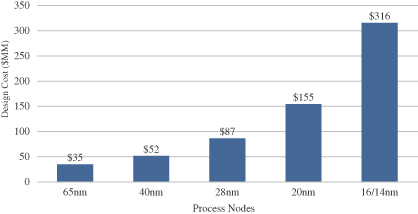
Source: IBS, January 2014
Costs per transistor are increasing, creating challenges for historical IC solutions
Historically, advances in manufacturing process technology have enabled engineers to approximately double the number of transistors in the same unit area approximately every 24 months, a trend referred to as Moore’s Law, leading to unit cost benefits. However, as semiconductor process nodes have moved to much smaller geometries, the challenges of patterning and manufacturing semiconductor transistors have reversed the cost reductions associated with Moore’s Law. As a result, semiconductor companies that have traditionally leveraged this unit cost benefit will no longer be able to produce a next generation product where the cost per transistor is lower than their current generation product. Therefore, the justification to use the next generation process node is going to be driven by either performance, power or integration.
93
Table of Contents
The following chart shows estimated manufacturing cost per 100 million gates at various process nodes, as reported by IBS:
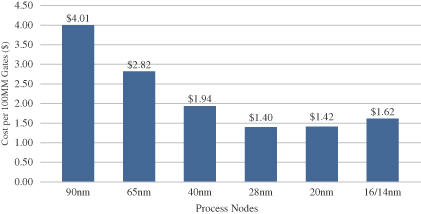
Source: IBS, January 2014
In our view, this point of inflection combined with the escalating design cost is further increasing the need for a new, reliable solution that combines innovation in the design process and IC architecture to cost-effectively deliver customized and differentiated ICs, while minimizing painful tradeoffs in time-to-market, performance, power consumption, development cost and unit cost.
Our Solution
We invented a way to customize ICs while avoiding the painful tradeoffs associated with ASICs, ASSPs and FPGAs. Our eASIC platform incorporates a versatile, pre-defined and reusable base array, which is built using standard mask layers. One custom mask layer is then inserted into the base array, which customizes the IC to meet a specific customer’s requirements. The ability to customize an IC with a single mask layer is achieved using our proprietary architecture and design tools. Once the IC design is completed, the custom mask layer is fabricated and added to the pre-manufactured base array to complete the manufacturing process. The final packaged and tested IC is then shipped to the customer for implementation into their specific application. We believe this approach provides the optimal combination of benefits including fast time-to-market, high performance, low power consumption, low unit cost and low development cost for our customers.
94
Table of Contents
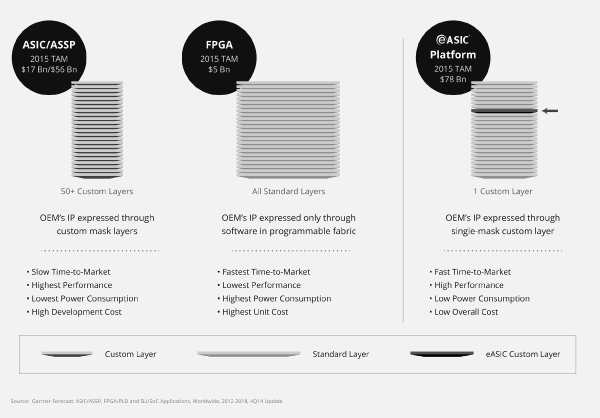
ASICs, ASSPs and FPGAs consist of approximately 50 individual mask layers in the manufacturing process. In an ASIC or ASSP, the multiple mask layers are fixed, but are customized for the specific customer design or application. The embedded logic, memory and other functions defined by these layers within the IC are fixed once the IC is designed and manufactured. The multiple mask layers of an FPGA are also fixed but are generic and not specific to a customer or application, and the logic, memory and metal interconnect that are defined by these layers are programmable through memory.
Advantages of Our Base Array
Our base arrays have been designed for maximum flexibility, which allows the same base array to be used for multiple applications and by a variety of customers. For example, the same base array has been used for solid-state drives in enterprise storage and for remote radio heads in wireless infrastructure, with the only difference between these two ICs being the single custom mask layer. This flexibility has been created in the base array by designing for versatility, including the layout of the logic and memory blocks and the input/output (I/O) circuitry in the IC. Many elements, such as test logic, clocking structures and power distribution layers that would normally be designed as part of the custom IC flow have been embedded into our base arrays. Because of the high relative performance of the base array, we do not need to pre-layout and “harden” high-speed interface protocol functions in the base array. This ability to use our high speed interfaces to support any industry standard or proprietary high-speed protocol significantly adds to the versatility of our base array.
In addition, we are able to manufacture our base arrays up to the point of the single mask inclusion, which can save up to ten weeks of manufacturing time.
95
Table of Contents
Advantages of Our Single-Mask Customization
Our highly differentiated technology enables us to use a single mask to customize the entire IC for a unique customer or application, while the rest of the approximately 50 mask layers are common among multiple customers or applications. Our OEM customers are able to express their own IP with a single mask generated by our proprietary design tools. This single custom mask is used to connect the embedded logic and memory in the correct sequence within the base array. We believe that using this single mask approach enables our product platform to provide customers with the optimal combination of fast time-to-market, high performance, low power consumption, low development cost and low unit cost for our customers.
Advantages of Our Proprietary Design Tools
The ability to customize an IC using a single mask and a versatile base array is enabled by our unique and proprietary physical place and route algorithms. These algorithms are the engine of our design tools, which we refer to as eTools, that creates the single mask to customize the base array. We have developed these algorithms and implemented them into our design tools enabling us to deliver a disruptive combination of time-to-market, performance, power and cost. We believe our proprietary eTools, developed and optimized over a number of years across four generations of products, are easy to use, address the various complexities associated with supporting advanced wafer manufacturing process nodes and create significant barriers to entry. The output of the design tools is a data file that is sent to the wafer fabrication facility to manufacture the custom single mask. We offer use of these tools to our customers at no charge. Consequently, the use of expensive electronic design automation (EDA) tools required by ASICs and ASSPs has been greatly minimized using our approach.
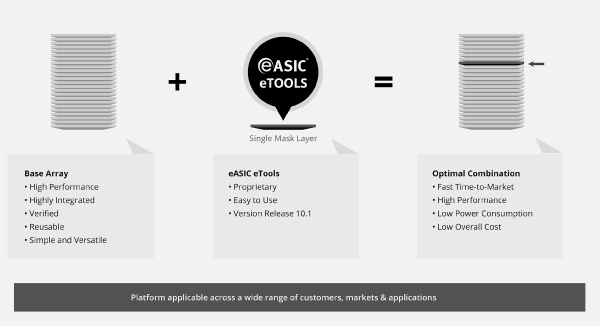
96
Table of Contents
easicopy ASIC and Standard ASIC
When customers design ICs with our eASIC platform, we are able to offer lower unit prices as their production volumes increase. If, at a later point, a customer needs even lower unit pricing, we offer the customer an efficient migration path from the eASIC platform product to an easicopy ASIC, thereby enabling customers to further reduce device cost and power consumption and increase performance. We also have the ability to directly design standard ASICs for our customers without use of our easicopy methodology. We believe we are unique in being able to offer this continuum of custom IC products that can be tailored to a customer’s market requirements.
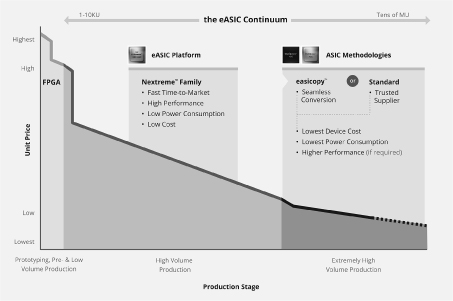
We offer our customers an efficient migration path using our easicopy methodology to produce a standard ASIC for very high-volume, cost sensitive use cases. This easicopy ASIC is manufactured using the most appropriate process technology from our foundry partners. easicopy can reuse portions of the eASIC platform design, timing and I/O files. In addition, I/O timing and electrical information can be duplicated when migrating from one product to another. When required, we are also able to supply a pin compatible product to reduce the need for system requalification and board redesign. easicopy therefore mitigates the risks normally associated with the design and manufacture of a standard ASIC, often accelerating the time-to-market. Customer supply chain management is made easier by working with a single supplier throughout the migration. For example, one of our customers, Seagate Technology, has leveraged this approach successfully to achieve a leadership position in the hybrid drive market for notebooks and PCs. In an easicopy migration, we charge a NRE and a unit price per IC.
Benefits We Provide Our Customers
Our customers are continuously developing new products in existing and new application areas as they look to differentiate themselves from their competitors, reduce time-to-market, increase market share and enhance margins. In our view, the key benefits of our solutions, as outlined below, help our customers to achieve their goals:
| • | Product Differentiation Through Custom ICs. Our custom ICs are designed to meet the specific technical requirements of our customers in their respective end-markets while balancing their time-to-market, performance, power consumption and overall cost needs. Our eASIC platform provides our customers with the ability to differentiate their product offerings, and our easicopy methodology provides them with an efficient migration path to a standard ASIC for very high-volume, cost sensitive use cases. |
97
Table of Contents
| • | Fast Time-to-Market. Our customers compete in markets that require reliable high-performance solutions that can be integrated into their systems expeditiously as new market opportunities develop. Our eASIC platform offers a time-to-market advantage of up to 12 months or more over traditional ASICs. We work closely with our customers to meet their time-to-market requirements through their design cycles and development processes. |
| • | High Performance. Our eASIC platform is designed to meet the high performance requirements that our customers need. We believe that our solution has ASIC-comparable performance that is superior to that offered by FPGAs. |
| • | Low Power Consumption. In most of our end markets, power consumption is a key consideration in system design and operation. Our solution is power-efficient and can considerably lower a system’s overall operating cost and power consumption. |
| • | Low Development Cost. The versatility of our pre-designed base array and the need to customize only one mask layer in our eASIC platform allows us to lower development cost by significantly reducing design and NRE expenses. Having a low development cost allows our solution to be considered for medium volume applications, which have traditionally been cost-prohibitive to address by using ASICs, putting us at a distinct advantage over our ASIC competitors. Combined with our solution’s low per-unit costs, we believe the total cost of ownership for our eASIC platform is highly competitive. |
| • | Low Unit Cost. We are able to design and deliver ICs that have a smaller die size when compared with FPGAs. Due to the area efficient die and lower cost IC packaging, our solution offers an attractive cost per unit relative to FPGAs. |
Customer Case Studies
Seagate Case Study:
One example of a customer for whom we successfully created a custom IC solution using our eASIC platform, and later migrated to our easicopy ASIC, is Seagate.
Problem Statement:
We were initially approached by Seagate in 2009, as they had a revolutionary idea of combining NAND FLASH (Solid State Memory) and conventional spinning disks on a drive for PC’s and notebooks. The drive had to meet high performance requirements and be priced effectively to sell into consumer applications. At the same time, the market for these products did not yet exist, so Seagate wanted to avoid the high NRE associated with an ASIC. Seagate also did not want to take the nearly two years typically required to develop an ASIC.
eASIC Solution:
We worked with Seagate on their product requirements and were awarded a design in 2009. Seagate viewed our unique eASIC platform as the only solution to their issue. Therefore, we did not have a direct competitor during this process. We created a custom IC utilizing this platform. Seagate chose our custom IC solution because of our ability to reduce time-to-market while maintaining high performance, low power consumption and low per unit costs. We began a volume ramp in 2010. For a subsequent Seagate product release, we then used our easicopy methodology to efficiently migrate to an easicopy ASIC. This enabled us to deliver a continuum of solutions for very high volume production at a lower unit price in a market where achieving low cost is critical. We have since deepened our customer relationship to support multiple additional Seagate products, which are shipping in mass volume today. For the year ended December 31, 2014 and three months ended March 31, 2015, Seagate accounted for approximately 31% and 16%, respectively, of our revenues.
98
Table of Contents
Huawei Case Study:
Huawei is an example of a customer that required a combination of high performance, low power and low unit cost, for whom we were able to showcase the multiple benefits of our eASIC platform. Additionally, Huawei is an example of how we benefit from the long product life cycle of our customers in the wireless communications infrastructure market.
Problem Statement:
Huawei faced a very typical customer challenge that required them to develop a new custom IC to overcome the data throughput bottlenecks in the backhaul transport network. These bottlenecks were driven by the increased demand for data throughput and required Huawei to develop a custom IC that required high performance but also meet the total cost of ownership targets set by the global operators. FPGAs were not able to meet the performance, power and cost targets, while the time-to-market requirements could not be met using an ASIC.
eASIC Solution:
Huawei provided us with the key parts of their design that required high performance. We were able to demonstrate the performance advantages and power benefits of our 28nm eASIC Nextreme-3 platform versus equivalent process node FPGAs while meeting Huawei’s requirements. We also presented a schedule that met Huawei’s time-to-market requirements. Huawei awarded the design to us in the second quarter of 2013, we delivered prototypes in the first quarter of 2014. This design is currently in production and is estimated to have a minimum of five years of production life.
Our Growth Strategy
Our objective is to be the leading provider of custom and affordable ICs with fast time-to-market. We believe our solution enables our customers to differentiate their products, become more competitive in their markets and enhance their growth rates, market share and profit margins. Key elements of our strategy include:
| • | Exploit the Multiple Benefits of our eASIC Platform. We intend to leverage the multiple benefits of our versatile eASIC platform to expand our customer base across a variety of end products. The benefits of our eASIC platform include fast time-to-market, high performance, low power consumption, low development costs and low unit price. |
| • | Expand Market Share within Our Existing Customers. Customers with whom we have now developed supplier relationships are continuously developing new products in existing and new application areas. These customers tend to be large multinational enterprises with large annual purchases of ICs. We target applications and markets with long product life cycles, which leads to extended customer engagements. We intend to increase our market share by applying our differentiated design capabilities to new design programs and by continuing to foster deep customer relationships. We believe this will position us to expand into our customers’ adjacent and next generation products. We believe our product roadmaps will enhance our ability to win new business as these new roadmap features have been developed with inputs from our existing customers. These customers are now using our products to develop their product roadmap plans. |
| • | Sell into New Customers in Existing Markets. We have successfully demonstrated a number of key benefits to top customers within certain applications and markets, such as wireless communications infrastructure and storage. We believe these customers’ products have become more competitive as a direct result of using our solution. We plan to work with other top OEMs in our existing markets to bring the same benefits to them. |
| • | Expand into Adjacent Markets and Enhance Our Product Roadmap to Identify New Use Cases. We have deployed our custom IC solution across a number of different use cases and applications. We |
99
Table of Contents
| intend to leverage the versatility of our eASIC platform to develop new use cases and applications. As we deploy new capabilities including but not limited to, higher-speed SerDes, increased logic and memory integration and lower power solutions, we plan to use our eASIC platform to expand into adjacent markets. |
| • | Invest in Key Sales and Technical Talent. Since 2010, our sales strategy has been to focus on key customers within a select set of application areas. As we grow, we intend to build upon our top tier customer base by increasing our geographic sales and technical resources to enable us to expand our market share with new and existing customers and in adjacent markets. We plan to expand our sales and distribution capabilities in select geographic regions. |
Our ASIC Design Methodologies
We offer highly integrated ICs that can be customized for a wide variety of customers, applications and end markets. Our design methodologies consist of the following:
| • | Our eASIC platform consists of our eASIC Nextreme product family, which incorporates a versatile, pre-defined and reusable base array, built using standard mask layers. One custom mask layer is then inserted into the base array, which customizes the IC to meet a specific customer’s requirements. |
| • | Our easicopy ASICs are customized using a full set of custom masks and are developed using our easicopy methodology. |
| • | We also have the ability to directly deliver our ASICs to our customers using standard ASIC methodologies. |
Our proprietary design tools, which we refer to as eTools, are used by us and our customers to design a single mask layer for our eASIC Nextreme product family. Our custom ICs are available in 28nm, 45nm and 90nm CMOS processes nodes. The following table shows the key product lines and features:
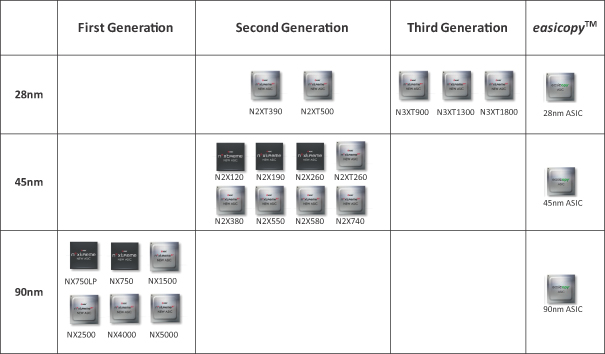
100
Table of Contents
We believe our eASIC Nextreme family enables our customers to reduce power consumption by 50% to 80% and in some case also increase performance by 60% to 120% compared to FPGAs at the same process node. These products are significantly smaller in device size relative to a FPGA, which often results in substantial unit cost savings.
We believe our eASIC Nextreme family enables our customers to significantly reduce design time against traditional ASIC, resulting in up to more than a year of time saved in the design cycle. This family requires only one mask for customization which reduces the NRE cost from multiple millions of dollars to low hundreds of thousand of dollars.
We use our easicopy methodology to provide our customers with an efficient migration path from the eASIC Nextreme product to an easicopy ASIC, as well as to directly design such ASICs, thereby enabling customers to further reduce device cost and power consumption and increase performance.
Some of our customers begin their design using an FPGA and switch to us to reduce power consumption, enhance performance and reduce costs. We then validate our customer’s product design and provide a device that is a “drop-in-replacement” of the FPGA. This allows our customers to replace an FPGA from any vendor without the need to create a new printed circuit board. We also offer our customers related design services.
Partnering with us helps ensure that our customers have low risk cost reduction solutions along the spectrum from pre-production to very high volume production. easicopy provides OEMs with a low risk, vital addition to their existing value engineering programs. OEMs can be confident that as their product succeeds in the market, they have a clear path to cost reduction.
Our Customers
We sell our products primarily to top-tier OEMs in our target markets. During the year ended December 31, 2014 and the three months ended March 31, 2015, we generated revenues from over 14 customers and 10 customers, respectively, including Ericsson, Fujitsu, Huawei, NEC, Omnivision, Seagate and Toshiba. The number of customers varies between different periods due to timing of orders from customers. In 2012, 2013 and 2014 and the first three months of 2015, Ericsson and Seagate, our two largest customers, together accounted for 73%, 87%, 93% and 95%, respectively, of our total revenues. We currently expect that a relatively small number of customers will continue to account for a significant portion of our revenues for the foreseeable future. However, we believe that based on our existing design wins, our customer concentration will decrease over time. In addition, we believe that, given the market share concentration in our target markets, our customers’ ability to use our platform to provide differentiated products will allow us to expand our market share within our existing customer base and penetrate new customers. We believe this will position us to gain market share within the $78 billion ASIC, ASSP and FPGA markets.
Sales and Marketing
We use a three stage engagement process with our top tier OEM customers. This consists of the following:
| • | Phase 1—Awareness and Evaluation. During this phase, we introduce our products to the potential customer. The goal in the awareness phase is to make the potential customer aware of eASIC. In the evaluation phase, we demonstrate the capabilities and value of our products. We also share detailed concepts of how our product brings value to our customer’s specific application. At the output of this phase, the customer provides us with a request for quote. |
| • | Phase 2—Initial Design Award. If the results of Phase 1 are positive, then we move to Phase 2. This phase consists of our customer awarding us with an initial design purchase order for design services and prototypes, recognizing the value provided by our products. During this phase, we also implement the customers’ design and provide prototypes. Our customers evaluate the prototypes and place orders for production units. |
101
Table of Contents
| • | Phase 3—Customer Acquired. We continue to build a deep technical relationship with our customers’ system architects and engineers. This allows our customers to share their specific technical requirements for further designs. This usually results in multiple design awards. Our customers also share their future technical requirements, which we use to enhance our future products. |
We work directly with our customers’ system designers to create demand for our products by providing them with application-specific product information for their system design, engineering and procurement groups. Our technical marketing, sales and field application engineers actively engage with customers during their vendor selection and design processes and provide them with our product capabilities and target applications. We design products to meet the increasingly complex and specific design requirements of our customers. Our typical sales engagement cycle is several months. If successful, this process culminates in a customer decision to use our product in their system, which we refer to as a design award. Typically, volume production begins from nine months to 18 months after the design award. Once one of our products is incorporated into a customer’s design, it is likely to be used for the life cycle of the customer’s product, because a redesign would be time consuming and expensive. We benefit from our deep engagement with our customers by being well-positioned to replace their maturing products and expand into adjacent products.
For select direct customers that represent a significant portion of our revenues, we maintain inventory of our product at a customer specified location (known as Vendor Managed Inventory, or VMI) and are notified when our products are either ordered or “pulled” by our customers to meet their manufacturing needs. We own and have access to the inventory, until such inventory is “pulled” by the customer, at which time the customer takes title to that inventory, we invoice the customer and recognize revenues. This VMI structure allows our customers the flexibility to modify their manufacturing volumes without being affected by the long production lead times typically required of custom ICs and provides us with enhanced insights into our customers’ supply needs.
Manufacturing
We use third-party foundries, assembly and test contractors to manufacture, assemble and test our ICs. This outsourced manufacturing approach is a capital efficient model that allows us to focus our resources on the design, sales and marketing of our platform solutions. Our engineers work closely with our foundries and other contractors to increase yields, lower manufacturing costs and improve quality.
Integrated Circuit Fabrication. Our ICs are fabricated using CMOS processes, which provide greater flexibility to engage independent foundries to manufacture our ICs. By outsourcing manufacturing, we are able to avoid the cost associated with owning and operating our own manufacturing facility. We currently outsource our IC manufacturing to Fujitsu, Global Foundries and Taiwan Semiconductor Manufacturing Company. We work closely with these foundries by forecasting our manufacturing capacity requirements on a monthly basis. Our ICs are currently fabricated in several advanced, sub-micron manufacturing processes. Because advanced manufacturing processes lead to enhanced performance, smaller size and lower power requirements, we continually evaluate the benefits and feasibility of migrating to smaller geometry process technology in order to reduce cost and improve performance.
Assembly and Test. Our products are shipped from our third-party foundries to third-party assembly and test facilities where they are assembled, packaged and tested. We outsource all product packaging and substantially all testing requirements for these products to several assembly and test subcontractors, including ASE Electronics in Taiwan and Malaysia, as well as Amkor in the United States. Our products are designed to use standard packages and to be tested with widely available test equipment.
Quality Assurance. We have implemented significant quality assurance and test procedures to assure high levels of product quality for our customers. Our designs are subjected to extensive circuit simulation under extreme conditions of temperature, voltage and processing before being committed to manufacture. We have
102
Table of Contents
completed and have been awarded ISO 9001:2008 certification. In addition, all of our independent foundries and assembly and test subcontractors have been awarded certifications including ISO 9001, TS16949 and ISO 14001.
Research and Development
Our research and development efforts are directed largely to the development of our fifth generation product focused on further increasing performance, lowering unit cost and lowering power consumption. We are also focused on integrating more system functions such as high performance single and multi-core processors and greater SerDes capabilities.
We have assembled a core team of experienced engineers and systems designers, including consultants, in four design centers located in the United States, Malaysia, Romania and Russia. As of March 31, 2015, we had 67 employees in our research and development group. Our technical team typically has, on average, more than 20 years of industry experience with more than 34% having advanced degrees and more than 7% having PhDs. These engineers and designers are involved in advancing our core technologies, as well as applying these core technologies to our product development activities across a number of areas. In 2012, 2013 and 2014 and the three months ended March 31, 2015, our research and development expenses were $11.9 million, $13.0 million, $13.9 million and $3.7 million, respectively.
Patent and Licenses
To protect our core technology and intellectual property, we rely on a combination of intellectual property rights, including patents, trade secrets, copyrights and trademarks and contractual protections. As of March 31, 2015, we had 35 issued and four pending patent applications in the United States. We also have a number of foreign counterparts of these patents and patent applications, consisting of 16 granted patents and two pending applications in the Japanese and European Patent Offices. Our issued patents expire between March 11, 2019 and January 12, 2033. As of March 31, 2015, we also had registered trademarks in the United States for eASIC, easicopy, eASICore, The Configurable Logic Company and eZ-IP. We have patented our proprietary base array, built using a single mask layer. This proprietary technology is critical to our ability to offer our solution to customers that want to avoid many of the potential tradeoffs, such as slow time to market, that occur with ASICs that have many more custom layers that are required to be built in. We are not currently aware of any other companies that can offer the same level of customization without significantly more costly mask layers. Accordingly, we believe that this patented technology represents a significant barrier to entry for potential competitors.
Our patent applications may not result in the issuance of any patents, and our issued patents may not provide us with any competitive advantages. In addition, any future patent may be opposed, contested, circumvented, designed around by a third party or found to be unenforceable or invalidated. Others may develop technologies that are similar or superior to our proprietary technologies, duplicate our proprietary technologies or design around patents owned or licensed by us.
In addition, we generally control access to and use of our proprietary software and other confidential information through the use of internal and external controls, including contractual protections with employees, contractors, customers and partners. We rely in part on U.S. and international copyright laws to protect our software. All employees and consultants are required to execute confidentiality agreements in connection with their employment and consulting relationships with us. We also require them to agree to disclose and assign to us all inventions conceived or made in connection with the employment or consulting relationship.
Despite our efforts to protect our intellectual property, unauthorized parties may still copy or otherwise obtain and use our software, technology or other information that we regard as proprietary intellectual property.
While we currently possess perpetual licenses on the intellectual property that we build into our products, we may be required in the future to seek additional licenses under patents or intellectual property rights owned by
103
Table of Contents
third parties. However, we cannot be certain that third parties will offer licenses to us or that the terms of any licenses offered to us will be acceptable. In addition, any intellectual property litigation could cause us to incur substantial expenses, materially and adversely affect our sales and divert the efforts of our technical and management personnel, regardless of the outcome of any such litigation. In the event we receive an adverse result in any litigation, we could be required to pay substantial damages, cease sale of products, expend significant resources to develop alternative technology and discontinue the use of processes requiring the relevant technology.
Competition
We compete with numerous domestic and international semiconductor companies. We consider our primary competitors to be other companies that can provide custom semiconductor solutions, including Altera, Avago, Broadcom, Marvell, Toshiba and Xilinx. Most of these competitors offer products that differ in the semiconductor device customization method.
The principal competitive factors in our market include:
| • | defining, designing and regularly introducing new products that anticipate the functionality and integration needs of our customers’ next-generation products and applications; |
| • | building strong and long-lasting relationships with our customers and other industry participants; |
| • | our research and development capabilities to provide innovative solutions and maintain our product roadmap; |
| • | the strength of our sales and marketing efforts; |
| • | brand awareness and reputation; |
| • | focusing on customer support; |
| • | retaining high-level talent, including our management team and engineers; and |
| • | protecting our IP. |
We believe we compete favorably with our competitors on the basis of these factors. However, many of our competitors have greater financial and other resources with which to pursue marketing, technology development, product design, manufacturing, quality, sales and distribution of their products.
Employees
As of March 31, 2015, we had 108 full-time employees located in the United States, Malaysia, Japan and Romania, which was comprised of 67 employees in engineering, research and development, 14 in sales and marketing, 19 in general and administrative and eight in operations. None of our employees is represented by a labor union and we consider our employee relations to be good.
Facilities
Our principal executive offices are located in a leased facility in Santa Clara, California, consisting of approximately 18,526 square feet of office space under a lease that expires at the end of October 2016. This facility accommodates product design and our principal software engineering, sales, marketing, operations and finance and administrative activities. Our offices in Malaysia are located in a leased facility in Penang, consisting of approximately 8,585 square feet total of office space under two leases that expire at the end of July 2017, and end of September 2017. This facility accommodates engineering, operations, customer engineering and administrative teams. Our offices in Romania are located at a leased facility in Brasov, consisting of
104
Table of Contents
approximately 2,950 square feet of office space under a lease that expires at the beginning of March 1, 2017. This facility accommodates customer engineering, engineering and administrative teams. We do not own any real property. We believe that our leased facilities are adequate to meet our current needs and that additional facilities are available for lease to meet future needs.
Legal Proceedings
From time to time, we may become involved in legal proceedings arising in the ordinary course of our business. We are not currently a party to any legal proceedings the outcome of which, if determined adversely to us, would individually or in the aggregate have a material adverse effect on our business, operating results, financial condition or cash flows.
105
Table of Contents
Executive Officers and Directors
The following table sets forth information regarding our executive officers and directors as of March 31, 2015:
| Name |
Age |
Position(s) | ||||
| Executive Officers | ||||||
| Ronnie Vasishta |
52 | President, Chief Executive Officer and Director | ||||
| Richard J. Deranleau |
57 | Chief Financial Officer and Senior Vice President, Finance | ||||
| Ranko Scepanovic, Ph.D. |
60 | Chief Technology Officer and Senior Vice President, Engineering | ||||
| Jasbinder Bhoot |
50 | Vice President, Worldwide Marketing | ||||
| Michael Stacy Fender |
54 | Vice President, Worldwide Sales | ||||
| Matthew Ng |
47 | Vice President, Legal, General Counsel and Corporate Secretary | ||||
| Non-Employee Directors |
||||||
| Wayne Cantwell(1)(2) |
50 | Director | ||||
| Edward H. Frank, Ph.D.(2)(3) |
58 | Director | ||||
| Ronald S. Jankov(1)(3) |
56 | Director | ||||
| Michael R. Kourey(1)(3) |
55 | Director | ||||
| Tara Long(2) |
47 | Director | ||||
| (1) | Member of the audit committee. |
| (2) | Member of the compensation committee. |
| (3) | Member of the nominating and corporate governance committee. |
Executive Officers
Ronnie Vasishta has served as our Chief Executive Officer since May 2009 and as a member of our board of directors since May 2005. From December 2004 to May 2009, Mr. Vasishta served in a number of positions at the Company, including Vice President of Marketing, Chief Executive Officer, President and Chief Operating Officer. From February 2001 to November 2004, Mr. Vasishta served as Vice President of Technology Marketing at LSI Corporation, an electronics company. Mr. Vasishta holds a B.S. in Electrical and Electronic Engineering from Trent University. Our board of directors believes that Mr. Vasishta’s extensive experience in marketing, manufacturing, design and operational management in the semiconductor field and his long-standing services in various management positions at the Company qualify him to serve on our board of directors.
Richard J. Deranleau has served as our Chief Financial Officer and Senior Vice President, Finance since June 2014. From January 2012 to June 2014, Mr. Deranleau served as Senior Vice President, Finance and Chief Financial Officer at Fujitsu America Inc., an information technology products and services company. From January 2006 to May 2011, Mr. Deranleau served as Vice President Finance and Chief Financial Officer at Brocade Communications Systems, Inc., an information technology company. Mr. Deranleau holds a B.S. in Economics from Iowa State University and an M.B.A. from San Jose State University.
Ranko Scepanovic, Ph.D. has served as our Chief Technology Officer and Senior Vice President, Engineering since February 2011. From May 2008 to January 2011, Dr. Scepanovic served as our Senior Vice President of Advanced Technology. From October 1997 to May 2008, Dr. Scepanovic served as Vice President of the Advanced Development Group at LSI Corporation, an electronics company. Dr. Scepanovic holds a Ph.D. in Mathematical Sciences from the University of Belgrade.
106
Table of Contents
Jasbinder Bhoot has served as our Vice President, Worldwide Marketing since April 2009. From October 2005 to April 2009, Mr. Bhoot served as our Senior Director of Intellectual Property Marketing. From November 1999 to October 2005, Mr. Bhoot served as Senior Manager of Vertical Marketing at Xilinx Inc., a technology company. Mr. Bhoot holds a B.S.Eng in Electronic Engineering from the University of Westminster and an M.B.A. from the University of Nottingham.
Michael Stacy Fender has served as our Vice President, Worldwide Sales since May 2014. From November 2012 to April 2014, Mr. Fender served as a consultant for several different companies in the electronics industry. From November 2008 to October 2012, Mr. Fender served as Corporate Vice President of Worldwide Sales at Lattice Semiconductor, a semiconductor company. Mr. Fender holds a B.S. in Computer Engineering from Auburn University.
Matthew Ng has served as our Vice President, Legal, General Counsel and Corporate Secretary since January 2015. From April 2012 until January 2015, Mr. Ng served as Senior Director, Legal at Brocade Communications, and as its acting Senior Director, Legal from October 2011 until April 2012. From July 2007 until October 2011, Mr. Ng served as an Axiom Attorney at Axiom Global, a legal services company. Mr. Ng previously held Associate General Counsel positions at Oracle Corporation and Knight-Ridder, Inc. Mr. Ng holds a B.S. in Business Administration and a J.D. from the University of California, Berkeley.
Non-Employee Directors
Wayne Cantwell has served as a member of our board of directors since July 2005. Since 2003, Mr. Cantwell has served as a General Partner at Crescendo Ventures, a venture capital firm, where he works with companies in the semiconductor, SIP and technical software arenas. From 1999 to January 2001, Mr. Cantwell served as President and Chief Executive Officer of inSilicon Corporation, a semiconductor intellectual property company. Mr. Cantwell holds a B.S. in Electronics Engineering from Devry Institute of Technology. We believe Mr. Cantwell’s extensive experience in the semiconductor and software industries qualifies him to serve on our board of directors.
Edward H. Frank, Ph.D. has served as a member of our board of directors since October 2013. From January 2014 to present, Dr. Frank has served as Chief Executive Officer of Cloud Parity, a mobile application company. From May 2009 to October 2013, Dr. Frank served as Vice President of Macintosh Hardware Systems Engineering at Apple, Inc., an electronics and software company. From May 1999 to March 2008, Dr. Frank served as Vice President of Research and Development at Broadcom Corporation, a broadband communications company, and in a consultant capacity from April 2008 to April 2009. Since June 1996, Dr. Frank has served as a Technology Partner at Advanced Technology Ventures, a venture capital firm. Dr. Frank holds an M.S. and B.S. in Electrical Engineering from Stanford University and a Ph.D. in Computer Science from Carnegie Mellon University where he has served as a Trustee since July 2000. Dr. Frank currently serves on the board of directors of Analog Devices, Inc. We believe Dr. Frank’s technical and design expertise in the semiconductor industry qualifies him to serve on our board of directors.
Ronald S. Jankov has served as a member of our board of directors since August 2014. From February 2012 to May 2014, Mr. Jankov served as Senior Vice President and General Manager, Processors and Wireless Infrastructure of Broadcom Corporation, a semiconductor company. From 2000 to 2012, Mr. Jankov served as President, Chief Executive Officer and Director of NetLogic Microsystems, Inc., a semiconductor company. Mr. Jankov also serves on the board of directors of Knowles Electronics Corp., a technology company. Mr. Jankov holds a B.S. in Physics from Arizona State University. We believe Mr. Jankov’s leadership experience and background in facilitating the growth of technical companies qualify him to serve on our board of directors.
Michael R. Kourey has served as a member of our board of directors since June 2013. Mr. Kourey has held executive, board and advisory roles at high-growth technology companies for more than 25 years. Mr. Kourey served at Khosla Ventures, a venture capital firm, from April 2012 to March 2015, most recently as a Partner. From July 1991 to February 2012, Mr. Kourey served at Polycom, Inc., a communications solutions company,
107
Table of Contents
most recently as Chief Financial Officer, and additionally as a board member from 1999 to 2011. Mr. Kourey is a board and audit committee member at RingCentral, Inc., Aruba Networks, Inc. and various private growth companies. Previously, he served on the board of directors and as audit committee chair at Riverbed Technology, Inc. Mr. Kourey holds a B.S from the University of California, Davis and an M.B.A from Santa Clara University. We believe Mr. Kourey’s experience in financial and accounting leadership positions and other board and audit committee experience qualify him to serve on our board of directors.
Tara Long has served as a member of our board of directors since June 2013. Since February 2006, Ms. Long has served as Vice President of Strategy and Corporate Development at Seagate, a data storage company. From September 2001 to December 2005, Ms. Long served as Managing Director at MCG Capital Corporation, a commercial finance company. Ms. Long also previously served as Managing Director at C.E. Unterberg Towbin, an investment banking firm. Ms. Long holds a B.A. in Economics from Marquette University and an M.B.A from the University of Maryland. We believe Ms. Long’s experience in corporate strategy, together with her historical perspective on the company, qualify her to serve on our board of directors.
Board Composition
Our business and affairs are organized under the direction of our board of directors, which currently consists of six members. The primary responsibilities of our board of directors are to provide oversight, strategic guidance, counseling and direction to our management. Our board of directors meets on a regular basis and additionally as required. The current composition of our board of directors is dictated by our voting agreement, although this agreement will terminate upon the completion of this offering.
Our board of directors has determined that all of our directors, except Mr. Vasishta and Mr. Kourey, are independent directors, as defined under the listing standards of the NASDAQ Stock Market LLC (NASDAQ).
In accordance with the terms of our amended and restated certificate of incorporation and bylaws, which will be effective immediately prior to consummation of this offering, our board of directors will be divided into three classes, Class I, Class II and Class III, with members of each class serving staggered three-year terms.
Effective upon the completion of this offering, our board of directors will be comprised of the following classes:
| • | Class I, which will consist of Michael R. Kourey and Tara Long, whose terms will expire at our annual meeting of stockholders to be held in 2016; |
| • | Class II, which will consist of Wayne Cantwell and Edward H. Frank, Ph.D., and whose terms will expire at our annual meeting of stockholders to be held in 2017; and |
| • | Class III, which will consist of Ronnie Vasishta and Ronald S. Jankov, and whose terms will expire at our annual meeting of stockholders to be held in 2018. |
At each annual meeting of stockholders to be held after the initial classification, the successors to directors whose terms then expire will serve until the third annual meeting following their election and until their successors are duly elected and qualified. The authorized size of our board of directors is currently eight members. The authorized number of directors may be changed only by resolution by a majority of the board of directors. This classification of the board of directors may have the effect of delaying or preventing changes in our control or management. Our directors may be removed for cause by the affirmative vote of the holders of at least 66 2/3% of our voting stock.
Role of the Board in Risk Oversight/Risk Committee
One of the key functions of our board of directors is informed oversight of our risk management process. Our board of directors does not have a standing risk management committee, but rather administers this oversight function directly through the board of directors as a whole, as well as through various standing committees of our board of directors that address risks inherent in their respective areas of oversight. In particular, our board of
108
Table of Contents
directors is responsible for monitoring and assessing strategic risk exposure and our audit committee has the responsibility to consider and discuss our major financial risk exposures and the steps our management has taken to monitor and control these exposures, including guidelines and policies to govern the process by which risk assessment and management is undertaken. The audit committee also monitors compliance with legal and regulatory requirements. Our compensation committee assesses and monitors whether any of our compensation policies and programs has the potential to encourage excessive risk-taking.
Board Committees
Our board of directors has established an audit committee, a compensation committee and a nominating and corporate governance committee. Our board of directors has adopted a charter for each of these committees, which complies with the applicable requirements of current NASDAQ rules. We intend to comply with future requirements to the extent they are applicable to us. Following the completion of this offering, copies of the charters for each committee will be available on the investor relations portion of our website.
Audit Committee
Our audit committee consists of Wayne Cantwell, Michael R. Kourey and Ronald S. Jankov. Under Rule 10A-3 under the Securities Exchange Act of 1934, as amended, or the Exchange Act, we are permitted to phase in our compliance with the independent audit committee requirements set forth in NASDAQ Marketplace Rule 5605(c) and Rule 10A-3 under the Exchange Act. Our board of directors has determined that each of Messrs. Jankov and Cantwell are independent directors under the NASDAQ Listing Rules and under Rule 10A-3 under the Exchange Act. Within one year of our listing on the NASDAQ Global Market, we expect that Mr. Kourey will have resigned from our audit committee and that any new directors added to the audit committee will be independent under NASDAQ Marketplace Rules and Rule 10A-3. Each member of our audit committee can read and understand fundamental financial statements in accordance with NASDAQ audit committee requirements. In arriving at this determination, the board has examined each audit committee member’s scope of experience and the nature of their prior and/or current employment.
Ronald S. Jankov serves as the chair of our audit committee. Our board of directors has determined that each of Messrs. Jankov, Cantwell and Kourey qualifies as an audit committee financial expert within the meaning of SEC regulations and meets the financial sophistication requirements of the NASDAQ Listing Rules. In making this determination, our board has considered each of Messrs. Jankov, Cantwell and Kourey’s formal education and previous and current experience in financial roles. Both our independent registered public accounting firm and management periodically meet privately with our audit committee.
The functions of this committee include, among other things:
| • | evaluating the performance, independence and qualifications of our independent auditors and determining whether to retain our existing independent auditors or engage new independent auditors; |
| • | reviewing our financial reporting processes and disclosure controls; |
| • | reviewing and approving the engagement of our independent auditors to perform audit services and any permissible non-audit services; |
| • | reviewing the adequacy and effectiveness of our internal control policies and procedures, including the responsibilities, budget, staffing and effectiveness of our internal audit function; |
| • | reviewing with the independent auditors the annual audit plan, including the scope of audit activities and all critical accounting policies and practices to be used by us; |
| • | obtaining and reviewing at least annually a report by our independent auditors describing the independent auditors’ internal quality control procedures and any material issues raised by the most recent internal quality-control review; |
| • | monitoring the rotation of partners of our independent auditors on our engagement team as required by law; |
| • | prior to engagement of any independent auditor, and at least annually thereafter, reviewing relationships that may reasonably be thought to bear on their independence, and assessing and otherwise taking the appropriate action to oversee the independence of our independent auditor; |
109
Table of Contents
| • | reviewing our annual and quarterly financial statements and reports, including the disclosures contained under the caption “Management’s Discussion and Analysis of Financial Condition and Results of Operations,” and discussing the statements and reports with our independent auditors and management; |
| • | reviewing with our independent auditors and management significant issues that arise regarding accounting principles and financial statement presentation and matters concerning the scope, adequacy and effectiveness of our financial controls and critical accounting policies; |
| • | reviewing with management and our auditors any earnings announcements and other public announcements regarding material developments; |
| • | reviewing and approving the selection and activities, organization structure and qualifications of any internal audit function; |
| • | establishing procedures for the receipt, retention and treatment of complaints received by us regarding financial controls, accounting or auditing matters and other matters; |
| • | preparing the report that the SEC requires in our annual proxy statement; |
| • | reviewing and providing oversight of any related person transactions in accordance with our related person transaction policy and reviewing and monitoring compliance with legal and regulatory responsibilities, including our code of ethics; |
| • | reviewing our major financial risk exposures, including the guidelines and policies to govern the process by which risk assessment and risk management is implemented; |
| • | reviewing on a periodic basis our cash investment policy; and |
| • | reviewing and evaluating on an annual basis the performance of the audit committee and the audit committee charter. |
We believe that the composition and functioning of our audit committee complies with all applicable requirements of the Sarbanes-Oxley Act, and all applicable SEC and NASDAQ rules and regulations. We intend to comply with future requirements to the extent they become applicable to us.
Compensation Committee
Our compensation committee consists of Wayne Cantwell, Edward H. Frank, Ph.D. and Tara Long. Mr. Cantwell serves as the chair of our compensation committee. Our board of directors has determined that each of the members of our compensation committee is a non-employee director, as defined in Rule 16b-3 promulgated under the Securities Exchange Act of 1934, or the Exchange Act, is an outside director, as defined pursuant to Section 162(m) of the Internal Revenue Code of 1986, as amended (Code), and satisfies the NASDAQ independence requirements. The functions of this committee include, among other things:
| • | reviewing and approving the corporate objectives that pertain to the determination of executive compensation; |
| • | reviewing and approving the compensation and other terms of employment of our executive officers; |
| • | evaluating the competitiveness of our overall compensation plan; |
| • | reviewing and approving performance goals and objectives relevant to the compensation of our executive officers and assessing their performance against these goals and objectives; |
| • | making recommendations to the board of directors regarding the adoption or amendment of equity and cash incentive plans and approving amendments to such plans to the extent authorized by the board of directors; |
110
Table of Contents
| • | reviewing and approving the type and amount of compensation to be paid or awarded to our non-employee board members; |
| • | reviewing and assessing the independence of compensation consultants, legal counsel and other advisors as required by Section 10C of the Exchange Act; |
| • | administering our equity incentive plans; |
| • | reviewing and approving the terms of any employment agreements, severance arrangements, change in control protections, indemnification agreements and any other material arrangements for our executive officers; |
| • | reviewing with management our disclosures under the caption “Executive and Director Compensation” in our periodic reports or proxy statements to be filed with the SEC, to the extent such caption is included in any such report or proxy statement; |
| • | preparing an annual report on executive compensation that the SEC requires in our annual proxy statement; and |
| • | reviewing and evaluating on an annual basis the performance of the compensation committee and recommending such changes as deemed necessary with the board of directors. |
We believe that the composition and functioning of our compensation committee complies with all applicable requirements of the Sarbanes-Oxley Act, and all applicable SEC and NASDAQ rules and regulations. We intend to comply with future requirements to the extent they become applicable to us.
Nominating and Corporate Governance Committee
Our nominating and corporate governance committee consists of Edward H. Frank, Ph.D., Ronald S. Jankov and Michael R. Kourey. Under NASDAQ Marketplace Rule 5615(b)(1), we are permitted to phase in our compliance with the independent nominating and corporate governance committee requirements set forth in NASDAQ Marketplace Rule 5605(e). Our board of directors has determined that each of Dr. Frank and Mr. Jankov are independent directors under the NASDAQ Listing Rules. Within one year of our listing on the NASDAQ Global Market, we expect that Mr. Kourey will have resigned from our nominating and corporate governance committee and that any new directors added to the nominating and corporate governance committee will be independent under NASDAQ Marketplace Rules. Mr. Kourey serves as the chair of our nominating and corporate governance committee. The functions of this committee include, among other things:
| • | identifying, reviewing and making recommendations of candidates to serve on our board of directors; |
| • | evaluating the performance of our board of directors, committees of our board of directors, and individual directors and determining whether continued service on our board is appropriate; |
| • | evaluating nominations by stockholders of candidates for election to our board of directors; |
| • | evaluating the current size, composition and organization of our board of directors and its committees and making recommendations to the board of directors for approvals; |
| • | developing a set of corporate governance policies and principles and recommending to our board of directors any changes to such policies and principles; |
| • | reviewing issues and developments related to corporate governance and identifying and bringing to the attention of our board of directors current and emerging corporate governance trends; and |
| • | reviewing periodically the nominating and corporate governance committee charter, structure, membership requirements and recommending any proposed changes to our board of directors; including undertaking an annual review of its own performance. |
We believe that the composition and functioning of our nominating and corporate governance committee complies with all applicable requirements of the Sarbanes-Oxley Act, and all applicable SEC and NASDAQ rules and regulations. We intend to comply with future requirements to the extent they become applicable to us.
111
Table of Contents
Compensation Committee Interlocks and Insider Participation
None of the members of our compensation committee has ever been an executive officer or employee of ours. None of our executive officers currently serves, or has served during the last completed fiscal year, on the compensation committee or board of directors of any other entity that has one or more executive officers serving as a member of our board of directors or compensation committee.
Limitation on Liability and Indemnification of Directors and Officers
Our amended and restated certificate of incorporation, which will be effective immediately prior to consummation of this offering, limits our directors’ liability to the fullest extent permitted under Delaware corporate law. Delaware corporate law provides that directors of a corporation will not be personally liable for monetary damages for breach of their fiduciary duties as directors, except for liability:
| • | for any transaction from which the director derives an improper personal benefit; |
| • | for any act or omission not in good faith or that involves intentional misconduct or a knowing violation of law; |
| • | under Section 174 of the Delaware General Corporation Law (unlawful payment of dividends or redemption of shares); or |
| • | for any breach of a director’s duty of loyalty to the corporation or its stockholders. |
If the Delaware General Corporation Law is amended to authorize corporate action further eliminating or limiting the personal liability of directors, then the liability of our directors shall be eliminated or limited to the fullest extent permitted by the Delaware General Corporation Law, as so amended.
Delaware corporate law and our amended and restated bylaws provide that we will, in certain situations, indemnify our directors and officers and may indemnify other employees and other agents, to the fullest extent permitted by law. Any indemnified person is also entitled, subject to certain limitations, to advancement, direct payment or reimbursement of reasonable expenses (including attorneys’ fees and disbursements) in advance of the final disposition of the proceeding.
In addition, we have entered, and intend to continue to enter, into separate indemnification agreements with our directors and officers. These agreements, among other things, require us to indemnify our directors and officers for certain expenses, including attorneys’ fees, judgments, fines and settlement amounts incurred by a director or officer in any action or proceeding arising out of their services as one of our directors or officers or any other company or enterprise to which the person provides services at our request.
We maintain a directors’ and officers’ insurance policy pursuant to which our directors and officers are insured against liability for actions taken in their capacities as directors and officers. We believe that these provisions in our amended and restated certificate of incorporation and amended bylaws and these indemnification agreements are necessary to attract and retain qualified persons as directors and officers.
Insofar as indemnification for liabilities arising under the Securities Act may be permitted to directors, officers or control persons, in the opinion of the SEC, such indemnification is against public policy as expressed in the Securities Act and is therefore unenforceable.
112
Table of Contents
EXECUTIVE AND DIRECTOR COMPENSATION
Our named executive officers for the year ended December 31, 2014, which consists of our principal executive officer and our two other most highly compensated executive officers, are:
| • | Ronnie Vasishta, our President and Chief Executive Officer; |
| • | Richard J. Deranleau, our Senior Vice President, Finance and Chief Financial Officer; and |
| • | Ranko Scepanovic, Ph.D., our Chief Technology Officer and Senior Vice President, Engineering. |
Summary Compensation Table
| Name and Principal |
Year | Salary | Option Awards(1) |
Bonus | Non-Equity Incentive Plan Compensation |
All Other Compensation |
Total | |||||||||||||||||||||
| Ronnie Vasishta |
2014 | $ | 293,750 | (2) | $ | 13,906 | (3) | — | $ | 62,059 | — | $ | 369,715 | |||||||||||||||
| President and Chief Executive Officer |
2013 | 275,000 | 182,206 | — | — | — | 457,206 | |||||||||||||||||||||
| Richard J. Deranleau |
2014 | 123,442 | (4) | 202,874 | $ | 24,500 | (5) | — | — | 350,816 | ||||||||||||||||||
| Senior Vice President, Finance and Chief Financial Officer |
2013 | — | — | — | — | — | — | |||||||||||||||||||||
| Ranko Scepanovic, Ph.D. |
2014 | 260,312 | (6) | — | — | 45,134 | — | 305,446 | ||||||||||||||||||||
| Chief Technology Officer and Senior Vice President, Engineering |
2013 | 250,000 | 101,240 | 50,000 | — | — | 401,240 | |||||||||||||||||||||
| (1) | In accordance with SEC rules, this column reflects the aggregate grant date fair value of the option awards granted during 2014 computed in accordance with Financial Accounting Standard Board Accounting Standards Codification Topic 718 for stock-based compensation transactions (FASB ASC Topic 718). Assumptions used in the calculation of these amounts are included in Note 6 to our audited financial statements included elsewhere in this prospectus. These amounts do not reflect the actual economic value that will be realized by the named executive officer upon the vesting of the stock options, the exercise of the stock options, or the sale of the common stock underlying such stock options. |
| (2) | Effective April 2014, Mr. Vasishta’s annual base salary was increased from $275,000 to $300,000. |
| (3) | Represents the aggregate incremental fair value calculated in accordance with FASB ASC Topic 718 in connection with an option amendment, effective May 2014, to vest 50% of the shares of common stock subject to an outstanding option covering 16,381 shares that was granted to Mr. Vasishta in October 2010. |
| (4) | Mr. Deranleau’s employment commenced in June 2014. |
| (5) | Represents Mr. Deranleau’s annual bonus which, per the terms of his offer letter agreement, is guaranteed to be paid from the commencement of his employment through the earlier of (i) three months following the lock-up expiration of an initial public offering of our stock or (ii) the closing of the sale of the majority or greater of our stock. |
| (6) | Effective April 2014, Dr. Scepanovic’s annual base salary was increased from $250,000 to $263,750. |
113
Table of Contents
Annual Base Salary
The compensation of our named executive officers is generally determined and approved by our board of directors, based on the recommendation of the compensation committee of our board of directors. The following 2014 base salaries were effective as of April 2014:
| Name |
2014 Base Salary |
|||
| Ronnie Vasishta |
$ | 300,000 | ||
| Richard J. Deranleau(1) |
245,000 | |||
| Ranko Scepanovic, Ph.D |
263,750 | |||
| (1) | Mr. Deranleau’s employment commenced in June 2014. |
Equity-Based Incentive Awards
Our equity-based incentive awards are designed to align our interests with those of our employees and consultants, including our named executive officers. Our board of directors is responsible for approving equity grants. Vesting of equity awards is generally tied to continuous service with us and serves as an additional retention measure. Our executives generally are awarded an initial new hire grant upon commencement of employment. Additional grants may occur periodically in order to specifically incentivize executives with respect to achieving certain corporate goals or to reward executives for exceptional performance.
All outstanding equity awards held by our current employees, consultants and directors were granted pursuant to the 2010 Plan, the terms of which are described below under “—Equity Benefit Plans.” All options are granted with a per share exercise price equal to no less than the fair market value of a share of our common stock on the date of the grant of such award. Generally our stock option awards vest over a four-year period subject to the holder’s continuous service to us and may be granted with an early exercise feature.
Effective May 2014, our board of directors vested 50% of the shares of common stock subject to an outstanding option covering 16,381 shares that was granted to Mr. Vasishta in October 2010. Absent this amendment, vesting of that portion of the option would have remained contingent on the satisfaction of certain performance thresholds established at the time of grant.
Bonus/Non-Equity Incentive Plan Compensation
Objectives for our named executive officers’ 2014 performance bonuses included gains over the course of the year in our revenue, gross margins, operating income and “design win”-based revenue results. Named executive officers’ target awards ranged from 40%-50% of base salary for accomplishment of all objectives, with escalators applicable in case of exceeded objectives.
In February 2015, our compensation committee approved a bonus program for the cash incentive bonuses for certain of our eligible executives, including our named executive officers for 2015. This program provides for bonus payments based upon the attainment of performance targets established by the compensation committee and related to financial and operational measures or objectives with respect to the company. These performance goals include revenue, gross margins, operating income and “design-win”-based revenue results. Target awards for executive officers range from 30%-68% of base salary for accomplishment of all objectives, with accelerators applicable in case of exceeded objectives. The performance goals will be measured at the end of fiscal 2015 after our financial reports have been published or such other appropriate time as the compensation committee determines. As a standing bonus program, the determination of payouts, if any, or any adjustments thereto, remain at the discretion of our compensation committee.
Agreements with our Named Executive Officers
Below are descriptions of our employment agreements and offer letter agreements with our named executive officers. The agreements generally provide for at-will employment and set forth the named executive officer’s
114
Table of Contents
initial base salary and eligibility for employee benefits and, in Mr. Vasishta’s and Mr. Deranleau’s cases, severance benefits upon a qualifying termination of employment. Furthermore, each of our named executive officers has executed a form of our standard proprietary information and inventions assignment agreement. The key terms of the employment agreements with our named executive officers are described below.
Amended and Restated Employment Agreement with Mr. Vasishta
On October 15, 2010, we entered into an amended and restated employment agreement with Mr. Vasishta, our President and Chief Executive Officer, which superseded and replaced Mr. Vasishta’s previous employment agreement. The amended and restated employment agreement sets forth Mr. Vasishta’s initial annual base salary (originally $250,000) and eligibility to participate in our employee benefit plans and programs, as in effect from time to time. The agreement also provides for an annual performance bonus of up to $100,000 based on the assessment by our board of directors of Mr. Vasishta’s performance and the attainment of annual targeted company goals set forth by our board of directors in their sole discretion. Under Mr. Vasishta’s agreement, we also agreed to grant an option to purchase 78,101 shares of common stock at an exercise price equal to fair market value on the date of grant. This option is fully vested and exercisable.
The agreement further provides for the following severance benefits payable in the event of Mr. Vasishta’s involuntary termination by the company without cause, or his termination for good reason, until he commences employment or a full-time consulting relationship with another company or employer, subject to Mr. Vasishta signing a general release in favor of the company, and agreeing to seek diligently a new position of comparable responsibility and compensation: (a) continuation of Mr. Vasishta’s base salary in effect as of the employment termination date for up to nine months after such termination, plus (b) subject to certain qualifications, payment of COBRA premiums to continue health insurance coverage for Mr. Vasishta and his eligible dependents for a period up to nine months following Mr. Vasishta’s termination date.
Agreement with Mr. Deranleau
We entered into a letter agreement with Mr. Deranleau, dated April 28, 2014, under which Mr. Deranleau was hired as our Senior Vice President, Finance and Chief Financial Officer. The letter agreement provides that Mr. Deranleau is an at-will employee and sets forth his annual base salary of $245,000 and his eligibility to participate in our employee benefit plans and programs, as in effect from time to time. Under Mr. Deranleau letter agreement, we granted Mr. Deranleau stock options to purchase 193,048 shares of common stock. The options were granted with an exercise price per share equal to the fair market value of our common stock on the date of grant and 25% of the shares underlying the option vested on the one year anniversary of the vesting commencement date (his initial date of employment) and thereafter 1/48th of the shares vested each month, subject to Mr. Deranleau’s continued employment with us on each applicable vesting date. Additionally, all unvested options are subject to acceleration of vesting in the event of Mr. Deranleau’s (i) involuntary termination by the Company without cause, or (ii) voluntary termination for good reason, in either case occurring after a change in control but not later than 12 months following a change in control, and subject to Mr. Deranleau signing a release in favor of the company. Mr. Deranleau’s letter agreement also provides for an annual bonus targeted at 40% of Mr. Deranleau’s annual salary, based on metrics tied to our overall performance as determined by our board of directors, provided that Mr. Deranleau’s bonus is guaranteed to be paid from the commencement of his employment through the earlier of (i) three months following the lock-up expiration of an initial public offering of our stock or (ii) the closing of the sale of the majority or greater of our stock.
Agreement with Dr. Scepanovic
We entered into a letter agreement with Dr. Scepanovic, dated April 29, 2008, under which Dr. Scepanovic was hired as our Senior Vice President of Advanced Technology. The letter agreement provides that Dr. Scepanovic is an at-will employee and sets forth his annual base salary of $250,000 and his eligibility to participate in our employee benefit plans and programs, as in effect from time to time. Under Dr. Scepanovic’s
115
Table of Contents
letter agreement, we granted Dr. Scepanovic stock options to purchase 19,314 shares of common stock. The options were granted with an exercise price per share equal to the fair market value of our common stock on the date of grant. Additionally, Dr. Scepanovic’s letter agreement provides that in the event of Dr. Scepanovic’s (i) involuntary termination by the Company without cause or (ii) voluntary termination for good reason, in either case occurring after a change in control but not later than 12 months following a change in control, and subject to Dr. Scepanovic signing a release in favor of the company, 50% of the then-unvested shares subject to the option shall vest. The option is fully vested and exercisable.
Potential Payments Upon Termination or Change of Control
Amended and Restated Employment Agreement with Mr. Vasishta; Agreement with Mr. Deranleau
Mr. Vasishta’s amended and restated employment agreement and Mr. Deranleau’s offer letter provides for certain severance and/or change in control benefits, as further described above under “—Agreements with our Named Executive Officers.”
Outstanding Equity Awards at Fiscal Year-End
The following table sets forth certain information regarding equity awards granted to our named executive officers that remain outstanding as of December 31, 2014:
| Option Awards(1) | ||||||||||||||||||||
| Grant Date | Number of Securities Underlying Unexercised Options (#) Exercisable |
Number of securities underlying unexercised options (#) unexercisable |
Option exercise price per share ($)(2) |
Option expiration date |
||||||||||||||||
| Ronnie Vasishta |
4/4/2006 | 10,666 | $ | 0.75 | 04/04/16 | |||||||||||||||
| 4/4/2006 | 10,187 | — | $ | 0.75 | 04/04/16 | |||||||||||||||
| 2/6/2007 | 10,094 | — | $ | 0.75 | 02/06/17 | |||||||||||||||
| 12/4/2007 | 3,172 | — | $ | 0.75 | 12/04/17 | |||||||||||||||
| 12/4/2007 | 9,245 | — | $ | 0.75 | 12/04/17 | |||||||||||||||
| 2/5/2008 | 1,583 | — | $ | 0.75 | 02/05/18 | |||||||||||||||
| 10/5/2010 | 16,381 | — | $ | 0.75 | 10/05/20 | |||||||||||||||
| 10/5/2010 | 27,392 | — | $ | 0.75 | 10/05/20 | |||||||||||||||
| 10/5/2010 | 34,328 | — | $ | 0.75 | 10/05/20 | |||||||||||||||
| 10/4/2011 | 33,086 | (3)(6) | — | $ | 0.75 | 10/04/21 | ||||||||||||||
| 8/23/2013 | 406,535 | (4)(6) | — | $ | 0.75 | 08/23/23 | ||||||||||||||
| 8/23/2013 | 133,333 | (4)(6) | — | $ | 0.75 | 08/23/23 | ||||||||||||||
| Richard J. Deranleau |
8/5/2014 | 45,506 | (5)(6) | — | $ | 2.1975 | 08/05/24 | |||||||||||||
| 8/5/2014 | 147,542 | (5)(6) | — | $ | 2.1975 | 08/05/24 | ||||||||||||||
| Ranko Scepanovic, Ph.D. |
6/2/2008 | 13,253 | — | $ | 0.75 | 06/02/18 | ||||||||||||||
| 6/2/2008 | 6,060 | — | $ | 0.75 | 06/02/18 | |||||||||||||||
| 10/5/2010 | 12,521 | — | $ | 0.75 | 10/05/20 | |||||||||||||||
| 2/1/2011 | 8,205 | — | $ | 0.75 | 02/01/21 | |||||||||||||||
| 2/1/2011 | 8,205 | — | $ | 0.75 | 02/01/21 | |||||||||||||||
| 2/1/2011 | 8,205 | — | $ | 0.75 | 02/01/21 | |||||||||||||||
| 2/1/2011 | 9,195 | (3)(6) | — | $ | 0.75 | 02/01/21 | ||||||||||||||
| 10/4/2011 | 9,859 | (3)(6) | — | $ | 0.75 | 10/04/21 | ||||||||||||||
| 10/4/2011 | 10,631 | (3)(6) | — | $ | 0.75 | 10/04/21 | ||||||||||||||
| 8/23/2013 | 166,636 | (4)(6) | — | $ | 0.75 | 08/23/23 | ||||||||||||||
| 8/23/2013 | 133,333 | (4)(6) | — | $ | 0.75 | 08/23/23 | ||||||||||||||
116
Table of Contents
| (1) | All of the option awards were granted under the 2010 plan, the terms of which plans are described below under “—Equity Benefit Plans.” |
| (2) | All of the option awards were granted with a per share exercise price equal to the fair market value of one share of our common stock on the date of grant, as determined in good faith by our board of directors. |
| (3) | 1/60th of the shares subject to the option vest monthly over five years. The shares subject to the options are exercisable prior to vesting. |
| (4) | 50% of the shares vested on the date of grants with the remaining shares vesting monthly over two years. The shares subject to the options are exercisable prior to vesting. |
| (5) | 1/48th of the shares subject to the option vest monthly over four years. The shares subject to the options are exercisable prior to vesting. |
| (6) | In the event of optionholder’s (i) involuntary termination by the Company without cause or (ii) voluntary termination for good reason in either case occurring after a change in control but not later than 12 months following a change in control, and subject to optionholder signing a release in favor of the Company, all unvested shares subject to the option shall accelerate in full. |
Health, Welfare and Retirement Benefits
All of our current named executive officers are eligible to participate in our employee benefit plans, including our medical, dental and vision insurance plans, in each case on the same basis as all of our other employees. We do not contribute to a retirement plan on behalf of employees.
Nonqualified Deferred Compensation
None of our named executive officers participate in or have account balances in nonqualified defined contribution plans or other nonqualified deferred compensation plans maintained by us. Our board of directors may elect to provide our officers and other employees with nonqualified defined contribution or other nonqualified deferred compensation benefits in the future if it determines that doing so is in our best interests.
Equity Benefit Plans
2015 Equity Incentive Plan
Our board of directors adopted our 2015 Equity Incentive Plan (2015 plan) in February 2015 and our stockholders approved the 2015 plan in March 2015, which will become effective upon the execution and delivery of the underwriting agreement related to this offering. Once the 2015 plan is effective, no further grants will be made under the 2010 plan.
Stock Awards. The 2015 plan provides for the grant of incentive stock options, or ISOs, nonstatutory stock options, or NSOs, stock appreciation rights, restricted stock awards, restricted stock unit awards, performance-based stock awards, and other forms of equity compensation, or collectively, stock awards, all of which may be granted to employees, including officers, non-employee directors and consultants of us and our affiliates. Additionally, the 2015 plan provides for the grant of performance cash awards. ISOs may be granted only to employees. All other awards may be granted to employees, including officers, and to non-employee directors and consultants.
Share Reserve. Initially, the aggregate number of shares of our common stock that may be issued pursuant to stock awards under the 2015 plan after the 2015 plan becomes effective is the sum of (1) 2,650,000 shares, plus (2) the number of shares (not to exceed 3,668,317 shares) (i) reserved for issuance under our 2010 plan at the time our 2015 plan becomes effective, and (ii) any shares subject to outstanding stock options or other stock awards that were granted under our 2010 plan that are forfeited, terminate, expire or are otherwise not issued. Additionally, the number of shares of our common stock reserved for issuance under our 2015 plan will
117
Table of Contents
automatically increase on January 1 of each year, beginning on January 1, 2016 (assuming the 2015 plan becomes effective before such date) and continuing through and including January 1, 2025, by 5% of the total number of shares of our capital stock outstanding on December 31 of the preceding calendar year, or a lesser number of shares determined by our board of directors. The maximum number of shares of our common stock that may be issued upon the exercise of ISOs under our 2015 plan is 31,000,000 shares.
No person may be granted stock awards covering more than 2,000,000 shares of our common stock under our 2015 plan during any calendar year pursuant to stock options, stock appreciation rights and other stock awards whose value is determined by reference to an increase over an exercise or strike price of at least 100% of the fair market value on the date the stock award is granted. Additionally, no person may be granted in a calendar year a performance stock award covering more than 2,000,000 shares of our common stock or a performance cash award having a maximum value in excess of $2,000,000. Such limitations are designed to help assure that any deductions to which we would otherwise be entitled with respect to such awards will not be subject to the $1,000,000 limitation on the income tax deductibility of compensation paid to any covered executive officer imposed by Section 162(m) of the Code.
If a stock award granted under the 2015 plan expires or otherwise terminates without being exercised in full, or is settled in cash, the shares of our common stock not acquired pursuant to the stock award again will become available for subsequent issuance under the 2015 plan. In addition, the following types of shares of our common stock under the 2015 plan may become available for the grant of new stock awards under the 2015 plan: (1) shares that are forfeited to or repurchased by us prior to becoming fully vested; (2) shares withheld to satisfy income or employment withholding taxes; or (3) shares used to pay the exercise or purchase price of a stock award. Shares issued under the 2015 plan may be previously unissued shares or reacquired shares bought by us on the open market. As of the date hereof, no awards have been granted and no shares of our common stock have been issued under the 2015 plan.
Administration. Our board of directors, or a duly authorized committee thereof, has the authority to administer the 2015 plan. Our board of directors may also delegate to one or more of our officers the authority to (1) designate employees (other than other officers) to be recipients of certain stock awards, and (2) determine the number of shares of common stock to be subject to such stock awards. Subject to the terms of the 2015 plan, our board of directors or the authorized committee, referred to herein as the plan administrator, determines recipients, dates of grant, the numbers and types of stock awards to be granted and the terms and conditions of the stock awards, including the period of their exercisability and vesting schedule applicable to a stock award. Subject to the limitations set forth below, the plan administrator will also determine the exercise price, strike price or purchase price of awards granted and the types of consideration to be paid for the award.
The plan administrator has the authority to modify outstanding awards under our 2015 plan. Subject to the terms of our 2015 plan, the plan administrator has the authority to reduce the exercise, purchase or strike price of any outstanding stock award, cancel any outstanding stock award in exchange for new stock awards, cash or other consideration, or take any other action that is treated as a repricing under generally accepted accounting principles, with the consent of any adversely affected participant.
Stock Options. ISOs and NSOs are granted pursuant to stock option agreements adopted by the plan administrator. The plan administrator determines the exercise price for a stock option, within the terms and conditions of the 2015 plan, provided that the exercise price of a stock option generally cannot be less than 100% of the fair market value of our common stock on the date of grant. Options granted under the 2015 plan vest at the rate specified by the plan administrator.
The plan administrator determines the term of stock options granted under the 2015 plan, up to a maximum of seven years. Unless the terms of an optionholder’s stock option agreement provide otherwise, if an optionholder’s service relationship with us, or any of our affiliates, ceases for any reason other than disability, death or cause, the optionholder may generally exercise any vested options for a period of three months
118
Table of Contents
following the cessation of service. The option term may be extended in the event that exercise of the option following such a termination of service is prohibited by applicable securities laws or our insider trading policy. If an optionholder’s service relationship with us or any of our affiliates ceases due to disability or death, or an optionholder dies within a certain period following cessation of service, the optionholder or a beneficiary may generally exercise any vested options for a period of 12 months in the event of disability and 18 months in the event of death. In the event of a termination for cause, options generally terminate immediately upon the termination of the individual for cause. In no event may an option be exercised beyond the expiration of its term.
Acceptable consideration for the purchase of common stock issued upon the exercise of a stock option will be determined by the plan administrator and may include (1) cash, check, bank draft or money order, (2) a broker-assisted cashless exercise, (3) the tender of shares of our common stock previously owned by the optionholder, (4) a net exercise of the option if it is an NSO, and (5) other legal consideration approved by the plan administrator.
Unless the plan administrator provides otherwise, options generally are not transferable except by will, the laws of descent and distribution, or pursuant to a domestic relations order. An optionholder may designate a beneficiary, however, who may exercise the option following the optionholder’s death.
Tax Limitations on Incentive Stock Options. The aggregate fair market value, determined at the time of grant, of our common stock with respect to ISOs that are exercisable for the first time by an optionholder during any calendar year under all of our stock plans may not exceed $100,000. Options or portions thereof that exceed such limit will generally be treated as NSOs. No ISO may be granted to any person who, at the time of the grant, owns or is deemed to own stock possessing more than 10% of our total combined voting power or that of any of our affiliates unless (1) the option exercise price is at least 110% of the fair market value of the stock subject to the option on the date of grant, and (2) the term of the ISO does not exceed five years from the date of grant.
Restricted Stock Awards. Restricted stock awards are granted pursuant to restricted stock award agreements adopted by the plan administrator. Restricted stock awards may be granted in consideration for (1) cash, check, bank draft or money order, (2) services rendered to us or our affiliates, or (3) any other form of legal consideration. Common stock acquired under a restricted stock award may, but need not, be subject to a share repurchase option in our favor in accordance with a vesting schedule to be determined by the plan administrator. A restricted stock award may be transferred only upon such terms and conditions as set by the plan administrator. Except as otherwise provided in the applicable award agreement, restricted stock awards that have not vested may be forfeited or repurchased by us upon the participant’s cessation of continuous service for any reason.
Restricted Stock Unit Awards. Restricted stock unit awards are granted pursuant to restricted stock unit award agreements adopted by the plan administrator. Restricted stock unit awards may be granted in consideration for any form of legal consideration. A restricted stock unit award may be settled by cash, delivery of stock, a combination of cash and stock as deemed appropriate by the plan administrator, or in any other form of consideration set forth in the restricted stock unit award agreement. Additionally, dividend equivalents may be credited in respect of shares covered by a restricted stock unit award. Except as otherwise provided in the applicable award agreement, restricted stock units that have not vested will be forfeited upon the participant’s cessation of continuous service for any reason.
Stock Appreciation Rights. Stock appreciation rights are granted pursuant to stock appreciation right agreements adopted by the plan administrator. The plan administrator determines the strike price for a stock appreciation right, which generally cannot be less than 100% of the fair market value of our common stock on the date of grant. Upon the exercise of a stock appreciation right, we will pay the participant an amount equal to the product of (1) the excess of the per share fair market value of our common stock on the date of exercise over the strike price, multiplied by (2) the number of shares of common stock with respect to which the stock appreciation right is exercised. Stock appreciation distribution may be paid in stock, cash, a combination of stock and cash as deemed appropriate by the plan administrator, or any other form of consideration set forth in the
119
Table of Contents
stock appreciation right agreement. A stock appreciation right granted under the 2015 plan vests at the rate specified in the stock appreciation right agreement as determined by the plan administrator.
The plan administrator determines the term of stock appreciation rights granted under the 2015 plan, up to a seven years. Unless the terms of a participant’s stock appreciation right agreement provides otherwise, if a participant’s service relationship with us or any of our affiliates ceases for any reason other than cause, disability or death, the participant may generally exercise any vested stock appreciation right for a period of three months following the cessation of service. The stock appreciation right term may be further extended in the event that exercise of the stock appreciation right following such a termination of service is prohibited by applicable securities laws. If a participant’s service relationship with us, or any of our affiliates, ceases due to disability or death, or a participant dies within a certain period following cessation of service, the participant or a beneficiary may generally exercise any vested stock appreciation right for a period of 12 months in the event of disability and 18 months in the event of death. In the event of a termination for cause, stock appreciation rights generally terminate immediately upon the occurrence of the event giving rise to the termination of the individual for cause. In no event may a stock appreciation right be exercised beyond the expiration of its term.
Performance Awards. The 2015 plan permits the grant of performance-based stock and cash awards that may qualify as performance-based compensation that is not subject to the $1,000,000 limitation on the income tax deductibility of compensation paid to a covered executive officer imposed by Section 162(m) of the Code. To help assure that the compensation attributable to performance-based awards will so qualify, our compensation committee can structure such awards so that stock or cash will be issued or paid pursuant to such award only after the achievement of certain pre-established performance goals during a designated performance period.
The performance goals that may be selected include one or more of the following: (1) earnings (including earnings per share and net earnings); (2) earnings before interest, taxes and depreciation; (3) earnings before interest, taxes, depreciation and amortization; (4) earnings before interest, taxes, depreciation, amortization and legal settlements; (5) earnings before interest, taxes, depreciation, amortization, legal settlements and other income (expense); (6) earnings before interest, taxes, depreciation, amortization, legal settlements, other income (expense) and stock-based compensation; (7) earnings before interest, taxes, depreciation, amortization, legal settlements, other income (expense), stock-based compensation and changes in deferred revenue; (8) total stockholder return; (9) return on equity or average stockholder’s equity; (10) return on assets, investment, or capital employed; (11) stock price; (12) margin (including gross margins); (13) income (before or after taxes); (14) operating income; (15) operating income after taxes; (16) pre-tax profit; (17) operating cash flow; (18) sales or revenue targets; (19) increases in revenues or product revenues; (20) annual or monthly recurring revenue; (21) improvement in or attainment of working capital levels; (22) economic value added (or an equivalent metric); (23) market share; (24) cash flow or operating cash flow; (25) cash flow per share; (26) share price performance; (27) debt reduction; (28) budget management, expenses or cost reduction goals; (29) stockholders’ equity; (30) capital expenditures; (31) debt levels; (32) operating profit or net operating profit; (33) workforce diversity; (34) growth of net income or operating income; (35) billings; (36) bookings or deployments; (37) employee retention; (38) partner satisfaction; (39) progress of partnered programs; (40) strategic partnerships or transactions (including in-licensing and out-licensing of intellectual property; and (41) to the extent that an award is not intended to comply with Section 162(m) of the Code, other measures of performance selected by our board of directors.
The performance goals may be based on a company-wide basis, with respect to one or more business units, divisions, affiliates, or business segments, and in either absolute terms or relative to the performance of one or more comparable companies or the performance of one or more relevant indices. Unless specified otherwise (i) in the award agreement at the time the award is granted or (ii) in such other document setting forth the performance goals at the time the goals are established, we will appropriately make adjustments in the method of calculating the attainment of performance goals as follows: (1) to exclude restructuring and/or other nonrecurring charges; (2) to exclude exchange rate effects; (3) to exclude the effects of changes to generally accepted accounting principles; (4) to exclude the effects of any statutory adjustments to corporate tax rates; (5) to exclude
120
Table of Contents
the effects of any “extraordinary items” as determined under generally accepted accounting principles; (6) to exclude the dilutive effects of acquisitions or joint ventures; (7) to assume that any business divested by us achieved performance objectives at targeted levels during the balance of a performance period following such divestiture; (8) to exclude the effect of any change in the outstanding shares of our common stock by reason of any stock dividend or split, stock repurchase, reorganization, recapitalization, merger, consolidation, spin-off, combination or exchange of shares or other similar corporate change, or any distributions to common stockholders other than regular cash dividends; (9) to exclude the effects of stock-based compensation and the award of bonuses under our bonus plans; (10) to exclude costs incurred in connection with potential acquisitions or divestitures that are required to be expensed under generally accepted accounting principles; (11) to exclude the goodwill and intangible asset impairment charges that are required to be recorded under generally accepted accounting principles; or (12) to exclude the effect of any other unusual, non-recurring gain or loss or other extraordinary item. In addition, we retain the discretion to reduce or eliminate the compensation or economic benefit due upon attainment of the performance goals and to define the manner of calculating the performance criteria we select to use for such performance period. The performance goals may differ from participant to participant and from award to award.
Other Stock Awards. The plan administrator may grant other awards based in whole or in part by reference to our common stock. The plan administrator will set the number of shares under the stock award and all other terms and conditions of such awards.
Changes to Capital Structure. In the event that there is a specified type of change in our capital structure, such as a stock split or recapitalization, appropriate adjustments will be made to (1) the class and maximum number of shares reserved for issuance under the 2015 plan, (2) the class and maximum number of shares by which the share reserve may increase automatically each year, (3) the class and maximum number of shares that may be issued upon the exercise of ISOs, (4) the class and maximum number of shares subject to stock awards that can be granted in a calendar year (as established under the 2015 plan pursuant to Section 162(m) of the Code) and (5) the class and number of shares and exercise price, strike price, or purchase price, if applicable, of all outstanding stock awards.
Corporate Transactions. In the event of certain specified significant corporate transactions, any surviving or acquiring company or parent company may assume or continue any or all stock awards or may substitute similar stock awards for them. The terms of any assumption, continuation or substitution will be set by our board of directors. In the event the surviving or acquiring company (or its parent company) does not assume, continue, or substitute a stock award and a participant’s service with us has not terminated prior to the effective time of the corporate transaction, the vesting of such participant’s stock awards will be accelerated in full to a date prior to the effective time of such corporate transaction. If a participant’s service with us has terminated prior to the effective time of the corporate transaction, the vesting of such participant’s stock awards will not be accelerated and such stock awards will terminate if not exercised prior to the effective time of the corporate transaction, unless otherwise provided in a written agreement between us and the participant. Notwithstanding the foregoing, in the event a participant’s stock awards will terminate if not exercised prior to the effective time of a corporate transaction, our board of directors may provide, in its sole discretion, that such participant may not exercise his or her stock awards but will receive a payment, in such form as may be determined by our board of directors, equal to the excess, if any, of (1) the value of the property the participant would have received upon the exercise of his or her stock award, over (2) any exercise price payable by such participant in connection with such exercise.
Our plan administrator is not obligated to treat all stock awards or portions of stock awards, even those that are of the same type, in the same manner.
Under the 2015 plan, a corporate transaction is generally the consummation of (1) a sale or other disposition of all or substantially all of our consolidated assets, (2) a sale or other disposition of at least 90% of our outstanding securities, (3) a merger, consolidation or similar transaction following which we are not the
121
Table of Contents
surviving corporation, or (4) a merger, consolidation or similar transaction following which we are the surviving corporation but the shares of our common stock outstanding immediately prior to such transaction are converted or exchanged into other property by virtue of the transaction.
Change in Control. The plan administrator may provide, in an individual award agreement or in any other written agreement between a participant and us that the stock award will be subject to additional acceleration of vesting and exercisability in the event of a change in control. Under the 2015 plan, a change in control is generally (1) the acquisition by a person or entity of more than 50% of our combined voting power other than by merger, consolidation or similar transaction subject to certain exceptions; (2) a consummated merger, consolidation or similar transaction immediately after which our stockholders cease to own more than 50% of the combined voting power of the surviving entity; (3) a consummated sale, lease or exclusive license or other disposition of all or substantially all of our consolidated assets; or (4) individuals who constitute our incumbent board of directors ceasing to constitute at least a majority of our board of directors.
Amendment and Termination. Our board of directors has the authority to amend, suspend, or terminate our 2015 plan, provided that such action does not materially impair the existing rights of any participant without such participant’s written consent. No ISOs may be granted after the tenth anniversary of the date our board of directors adopted our 2015 plan.
2010 Equity Incentive Plan
Our board of directors adopted our 2010 plan in April 2010, and our stockholders approved our 2010 plan in June 2010. Our 2010 plan was amended most recently in June 2014. Our 2010 plan provides for the grant of incentive stock options, or ISOs, within the meaning of Section 422 of the Code, to our employees, and for the grant of nonstatutory stock options, or NSOs, restricted stock awards, restricted stock unit awards and stock appreciation rights to our employees, directors and consultants.
Our 2015 plan will become effective upon the execution of the underwriting agreement related to this offering. As a result, we do not expect to grant any additional awards under the 2010 plan following that date, although any awards granted under the 2010 plan will remain subject to the terms of our 2010 plan and applicable award agreements, until such outstanding awards that are stock options are exercised, or until they terminate or expire by their terms, and until any restricted stock awards become vested, terminate or are forfeited.
Authorized Shares
The maximum number of shares of our common stock that may be issued under our 2010 plan is 4,193,563 shares. The maximum number of shares that may be issued upon the exercise of ISOs under our 2010 plan is two times the share reserve of the 2010 plan. Shares subject to stock awards granted under our 2010 plan that expire or terminate without being exercised in full or are settled in cash do not reduce the number of shares available for issuance under our 2010 plan. Additionally, shares issued pursuant to stock awards under our 2010 plan that we repurchase or that are forfeited, as well as shares used to pay the exercise price of a stock award or to satisfy the tax withholding obligations related to a stock award, become available for future grant under our 2010 plan, although such shares may not be subsequently issued pursuant to the exercise of an ISO.
Plan Administration
Our board of directors or a duly authorized committee of our board of directors administers our 2010 plan and the stock awards granted under it. Under our 2010 plan, the board of directors has the authority to determine and amend the terms of awards, including recipients, the exercise, purchase or strike price of stock awards, if any, the number of shares subject to each stock award, the vesting schedule applicable to the awards, together with any vesting acceleration, and the form of consideration, if any, payable upon exercise or settlement of the award and the terms of the award agreements for use under our 2010 plan. The board may amend the 2010 plan
122
Table of Contents
in these and other respects with the consent of any adversely affected participant, although certain material amendments to the 2010 plan require stockholder approval.
Under the 2010 plan, the board of directors also has the authority to modify outstanding awards, reprice any outstanding option, cancel any outstanding stock award in exchange for new stock awards, cash or other consideration, or take any other action that is treated as a repricing under GAAP, although if any such action adversely affects a participant, the written consent of that participant is required.
Corporate Transactions
Our 2010 plan provides that in the event of certain specified significant corporate transactions, as defined under our 2015 plan, each outstanding award will be treated as the administrator determines. The administrator may (1) arrange for the assumption, continuation or substitution of a stock award by a successor corporation; (2) arrange for the assignment of any reacquisition or repurchase rights held by us to a successor corporation; (3) accelerate the vesting, in whole or in part, of the stock award and provide for its termination prior to the transaction; (4) arrange for the lapse, in whole or in part, of any reacquisition or repurchase rights held by us; (5) cancel or arrange for the cancellation of the stock award prior to the transaction in exchange for a cash payment, if any, determined by the board; or (6) make a payment, in the form determined by the board, equal to the excess, if any, of the value of the property the participant would have received upon exercise of the awards prior to the transaction over any exercise price payable by the participant in connection with the exercise. The plan administrator is not obligated to treat all stock awards or portions of stock awards, even those that are of the same type, in the same manner.
Under the 2010 plan, a corporate transaction is generally the consummation of (1) a sale or other disposition of all or substantially all of our assets, (2) a sale or other disposition of at least 90% of our outstanding securities, (3) a merger, consolidation or similar transaction following which we are not the surviving corporation or (4) a merger, consolidation or similar transaction following which we are the surviving corporation but the shares of our common stock outstanding immediately prior to such transaction are converted or exchanged into other property by virtue of the transaction.
In the event of a change in control, awards granted under the 2010 plan will not receive automatic acceleration of vesting and exercisability, although this treatment may be provided for in an award agreement. Under the 2010 plan, a change in control is defined to include (a) the acquisition by any person of more than 50% of the combined voting power of our then outstanding stock; (b) a merger, consolidation or similar transaction in which the stockholders of the company immediately prior to the transaction do not own, directly or indirectly, more than 50% of the combined voting power of the surviving entity (or the parent of the surviving entity); (c) a sale, lease, exclusive license or other disposition of all or substantially all of the assets to an entity that did not previously hold more than 50% of the voting power of our stock; and (d) incumbent board members no longer constitute a majority of the members of the board (where incumbent members include those members of the board in April 2010 plus any members appointed, elected, or nominated for election by a majority of the incumbent board members).
Transferability
Under our 2010 plan, the board of directors may provide for limitations on the transferability of awards, in its sole discretion. Option awards are generally not transferable other than by will or the laws of descent and distribution, except as otherwise provided under our 2010 plan.
Plan Amendment or Termination
Our board of directors has the authority to amend, suspend, or terminate our 2010 plan, although certain material amendments require the approval of our stockholders, and amendments that would impair the rights of any participant require the consent of that participant.
123
Table of Contents
2015 Employee Stock Purchase Plan
Our board of directors adopted our 2015 Employee Stock Purchase Plan (2015 ESPP) in February 2015 and our stockholders approved the 2015 ESPP in March 2015. The 2015 ESPP will become effective immediately upon the execution and delivery of the underwriting agreement related to this offering. The purpose of the 2015 ESPP is to retain the services of new employees and secure the services of new and existing employees while providing incentives for such individuals to exert maximum efforts toward our success and that of our affiliates.
Share Reserve. Following this offering, the 2015 ESPP authorizes the issuance of 530,000 shares of our common stock pursuant to purchase rights granted to our employees or to employees of any of our designated affiliates. The number of shares of our common stock reserved for issuance will automatically increase on January 1 of each year, from January 1, 2016 through January 1, 2025 by the least of (1) 2% of the total number of shares of our capital stock outstanding on December 31 of the preceding calendar year, (2) 600,000 shares, or (3) a number determined by our board of directors that is less than (1) and (2). The 2015 ESPP is intended to qualify as an “employee stock purchase plan” within the meaning of Section 423 of the Code, however, the 2015 ESPP authorized the grant of purchase rights that do not meet the requirements of Section 423 of the Code. As of the date hereof, no shares of our common stock have been purchased under the 2015 ESPP.
Administration. Our board of directors has delegated its authority to administer the 2015 ESPP to our compensation committee. The 2015 ESPP is implemented through a series of offerings of purchase rights to eligible employees. Under the 2015 ESPP, we may specify offerings with durations of not more than 27 months, and may specify shorter purchase periods within each offering. Each offering will have one or more purchase dates on which shares of our common stock will be purchased for employees participating in the offering. An offering may be terminated under certain circumstances.
Payroll Deductions. Generally, all regular employees, including executive officers, employed by us or by any of our designated affiliates, may participate in the 2015 ESPP and may contribute, normally through payroll deductions, up to 15% of their earnings for the purchase of our common stock under the 2015 ESPP. Unless otherwise determined by our board of directors, common stock will be purchased for accounts of employees participating in the 2015 ESPP at a price per share equal to the lower of (1) 85% of the fair market value of a share of our common stock on the first date of an offering or (2) 85% of the fair market value of a share of our common stock on the date of purchase.
Limitations. Employees may have to satisfy one or more of the following service requirements before participating in the 2015 ESPP, as determined by our board of directors: (1) customarily employed for more than 20 hours per week, (2) customarily employed for more than five months per calendar year, or (3) continuous employment with us or one of our affiliates for a period of time (not to exceed two years). No employee may purchase shares under the 2015 ESPP at a rate in excess of $25,000 worth of our common stock based on the fair market value per share of our common stock at the beginning of an offering for each year such a purchase right is outstanding. Finally, no employee will be eligible for the grant of any purchase rights under the 2015 ESPP if immediately after such rights are granted, such employee has voting power over 5% or more of our outstanding capital stock measured by vote or value pursuant to Section 424(d) of the Code.
Changes to Capital Structure. In the event that there occurs a change in our capital structure through such actions as a stock split, merger, consolidation, reorganization, recapitalization, reincorporation, stock dividend, dividend in property other than cash, large nonrecurring cash dividend, liquidating dividend, combination of shares, exchange of shares or change in corporate structure or similar transaction, the board of directors will make appropriate adjustments to (1) the number of shares reserved under the 2015 ESPP, (2) the maximum number of shares by which the share reserve may increase automatically each year, (3) the number of shares and purchase price of all outstanding purchase rights and (4) the number of shares that are the subject of purchase limits under each ongoing offering.
124
Table of Contents
Corporate Transactions. In the event of certain significant corporate transactions, including the consummation of: (1) a sale of all or substantially all our assets, (2) the sale or disposition of at least 90% of our outstanding securities, (3) a merger or consolidation where we do not survive the transaction, and (4) a merger or consolidation where we do survive the transaction but the shares of our common stock outstanding immediately prior to such transaction are converted or exchanged into other property by virtue of the transaction, any then-outstanding rights to purchase our stock under the 2015 ESPP may be assumed, continued or substituted for by any surviving or acquiring entity (or its parent company). If the surviving or acquiring entity (or its parent company) elects not to assume, continue or substitute for such purchase rights, then the participants’ accumulated payroll contributions will be used to purchase shares of our common stock within ten business days prior to such corporate transaction under the outstanding purchase rights, and such purchase rights will terminate immediately.
Plan Amendments, Termination. Our board of directors has the authority to amend or terminate the 2015 ESPP, provided that except in certain circumstances any such amendment or termination may not materially impair any outstanding purchase rights without the holder’s consent. We will obtain stockholder approval of any amendment to the 2015 ESPP as required by applicable law or listing requirements.
Non-Employee Director Compensation
Our board of directors adopted a new non-employee director compensation policy in February 2015 that will become effective upon the execution and delivery of the underwriting agreement related to this offering and will be applicable to all of our non-employee directors. This compensation policy provides that each such non-employee director will receive the following compensation for service on our board of directors, provided, however, that in lieu of any cash payment in 2015, non-employee directors will instead receive restricted stock units of equal value:
| • | an annual cash retainer of $38,000; |
| • | an additional annual cash retainer of $9,000, $6,000 and $4,000 for service as a member of the audit committee, compensation committee and the nominating and corporate governance committee, respectively; |
| • | an additional annual cash retainer of $11,000, $7,000 and $4,000 for service as chairman of the audit committee, compensation committee and the nominating and corporate governance committee, respectively; |
| • | an initial option grant to purchase 7,000 shares of our common stock and a restricted stock unit grant covering 3,200 shares of common stock on the date of each such non-employee director’s appointment to our board of directors or upon the execution and delivery of the underwriting agreement related to this offering for directors of the company at such time; |
| • | an annual option grant to purchase 3,500 shares of our common stock and a restricted stock unit grant covering 1,600 shares of common stock on the date of each of our annual stockholder meetings. |
The following table sets forth information regarding compensation earned by or paid to our non-employee directors during 2014:
| Name |
Fees Earned or Paid in Cash |
Option Awards (1) |
Total | |||||||||
| Wayne Cantwell |
— | — | — | |||||||||
| Edward H. Frank, Ph.D.(2) |
— | $ | 65,895 | $ | 65,895 | |||||||
| Ronald S. Jankov(3) |
— | $ | 101,437 | $ | 101,437 | |||||||
| Michael R. Kourey(4) |
— | — | — | |||||||||
| Tara Long |
— | — | — | |||||||||
125
Table of Contents
| (1) | The amounts reported do not reflect the amounts actually received by our non-employee directors. Instead, these amounts reflect the aggregate grant date fair value of each stock option granted to our non-employee directors during the fiscal year ended December 31, 2014, as computed in accordance with FASB ASC Topic 718. Assumptions used in the calculation of these amounts are included in Note 6 to our audited financial statements included in this prospectus. As required by SEC rules, the amounts shown exclude the impact of estimated forfeitures related to service-based vesting conditions. Our non-employee directors who have received options will only realize compensation with regard to these options to the extent the trading price of our common stock is greater than the exercise price of such options. |
| (2) | On June 3, 2014, Dr. Frank was granted an option to purchase 91,930 shares of our common stock at an exercise price of $1.50 per share, vesting monthly over a 48 month period commencing on October 24, 2013, subject to acceleration of vesting in the event of a change in control. Dr. Frank early exercised all the shares issuable under his option on October 2, 2014. As of December 31, 2014, Dr. Frank did not hold any options to purchase shares of our common stock. |
| (3) | Mr. Jankov joined our board of directors in August 2014. On August 5, 2014, Mr. Jankov was granted an option to purchase 96,524 shares of our common stock at an exercise price of approximately $2.20 per share, vesting monthly over a 48 month period commencing on June 11, 2014, subject to acceleration of vesting in the event of a change in control. Mr. Jankov early exercised all the shares issuable under his option on October 20, 2014. As of December 31, 2014, Mr. Jankov did not hold any options to purchase shares of our common stock. |
| (4) | As of December 31, 2014, Mr. Kourey held an option to purchase 91,930 shares of our common stock, with an exercise price of $0.75 per share, vesting monthly over a 24 month period commencing on January 3, 2013. The option is now fully vested. No other non-employee directors held options as of December 31, 2014. |
Director Agreements
Offer Letter with Edward H. Frank, Ph.D.
In October 2013, we entered into an offer letter with Dr. Frank pursuant to which he commenced serving on our board of directors. Pursuant to the offer letter, we granted Dr. Frank an option to purchase 91,930 shares of our common stock at an exercise price of $1.50 per share, vesting monthly over a 48 month period commencing on the date of his appointment to our board of directors. The option is early exercisable pursuant to our standard form of early exercise stock purchase agreement. In the event of a change of control, as defined in the offer letter, the vesting of the options granted pursuant to the offer letter, and the unvested portion of any other options that may be granted to Dr. Frank, will be accelerated in full.
Prior Consulting Agreement with Michael R. Kourey
In January 2013, we entered into a consulting agreement with Mr. Kourey, which, as amended, expired pursuant to its terms in January 2015. Pursuant to the consulting agreement, Mr. Kourey commenced serving on our board of directors, and provided consulting services with respect to our business and operations, and such other services mutually agreed upon between Mr. Kourey and us. The consulting agreement was amended in September 2013, and the term of the consulting agreement was extended for a year. Pursuant to the consulting agreement, we granted Mr. Kourey an option to purchase 91,930 shares of our common stock, vesting monthly over a 24 month period beginning on January 3, 2013. The option is now fully vested.
126
Table of Contents
CERTAIN RELATIONSHIPS AND RELATED PARTY TRANSACTIONS
The following includes a summary of transactions since January 1, 2012 to which we have been a party, in which the amount involved in the transaction exceeded $120,000, and in which any of our directors, executive officers or beneficial owners of more than 5% of our capital stock or any member of the immediate family of any of the foregoing persons had or will have a direct or indirect material interest, other than equity and other compensation, termination, change of control and other arrangements, which are described under “Executive and Director Compensation.”
Convertible Note Financings and Preferred Stock Financings
Series A-2 Convertible Preferred Stock Financing
From December 2012 through July 2013, we issued and sold an aggregate of 4,532,662 shares of our Series A-2 convertible preferred stock, or Series A-2 stock, at a purchase price of approximately $5.20 per share, which included conversion of the principal amount and accrued interest on convertible promissory notes (as described below in “2013 Convertible Note Financing” and “2012 Convertible Note Financing”), for aggregate consideration of approximately $23,534,898. Also in connection with the initial issuance and sale of Series A-2 stock, each of the existing investors below also exchanged shares of existing convertible preferred stock held by them for Series A-1 non-convertible preferred stock (the Series A-1 stock) and common stock, pursuant to the Series A-2 preferred stock purchase agreement. For each $1.00 of Series A-2 stock purchased by an investor, such investor was entitled to exchange, for no additional consideration, shares of Series A Preferred Stock, Series B preferred stock, Series C preferred stock, Series D preferred stock, Series E preferred stock, Series F preferred stock, Series F-1 preferred stock, Series G preferred stock and/or Series H preferred stock (the Exchange Preferred Stock) held by them representing $4.00 of liquidation preference for: (i) four shares of Series A-1 stock, (ii) the number of shares of common stock issuable upon conversion of the Exchanged Preferred Stock at the current conversion rate and (iii) three shares of common stock for each share of Series A-2 stock purchased.
Immediately prior to the completion of this offering, all outstanding shares of Series A-2 stock will convert into shares of our common stock at a ratio of approximately 1-for-1.135 and all outstanding shares of Series A-1 stock will terminate and be cancelled upon completion of this offering.
The participants in this preferred stock financing included the following members of our board of directors and holders of more than 5% of our capital stock or entities affiliated with them. The following table sets forth the aggregate number of shares of Series A-2 stock, Series A-1 stock and common stock issued to these related parties in this preferred stock financing:
| Participants |
Shares of Series A-2 Stock |
Shares of Series A-1 Stock |
Shares of Common Stock |
Consideration in Cash |
Conversion of Principal Amount |
Conversion of Accrued Interest |
||||||||||||||||||
| Khosla Ventures I, LP(1) |
640,532 | 137,159 | 2,384,186 | $ | 1,255,300 | $ | 2,035,528 | $ | 34,977 | |||||||||||||||
| Entities affiliated with Crescendo Ventures(2) |
752,865 | 80,032 | 1,389,367 | 1,650,000 | 2,231,429 | 27,656 | ||||||||||||||||||
| Evergreen IV, LP |
195,836 | 54,230 | 942,770 | 1,016,830 | — | — | ||||||||||||||||||
| KPCB Holdings, Inc. |
220,513 | 60,886 | 1,056,980 | — | 1,127,015 | 17,944 | ||||||||||||||||||
| Entities affiliated with Advanced Equities, Inc.(3) |
90,674 | 25,107 | 780,442 | 470,820 | — | — | ||||||||||||||||||
| Seagate Singapore International Headquarters Pte. Ltd(4) |
1,925,947 | — | — | 10,000,000 | — | — | ||||||||||||||||||
| Wayne Cantwell(5) |
9,629 | — | — | 50,000 | — | — | ||||||||||||||||||
| (1) | Michael R. Kourey, a member of our board of directors, was a partner of Khosla Ventures until March 2015. |
127
Table of Contents
| (2) | Wayne Cantwell, one of our directors, is a general partner of Crescendo Ventures. Consists of the following: |
| Entities affiliated with Crescendo Ventures |
Series A-2 | Series A-1 | Common | |||||||||
| Crescendo IV, LP |
510,996 | 65,155 | 1,151,455 | |||||||||
| Crescendo IV Coinvestment Fund, LP |
78,460 | 10,004 | 159,338 | |||||||||
| Crescendo IV AG & Co. Beteiligungs KG |
27,241 | 3,473 | 54,262 | |||||||||
| Crescendo IV Entrepreneur Fund, LP |
7,795 | 994 | 17,255 | |||||||||
| Crescendo IV Entrepreneur Fund A, LP |
3,188 | 406 | 7,057 | |||||||||
| Crescendo Ventures 401k Profit Sharing Plan fbo Wayne Cantwell |
41,728 | — | — | |||||||||
| Crescendo Ventures 401k Profit Sharing Plan fbo John Borchers |
51,358 | — | — | |||||||||
| Crescendo Ventures 401k Profit Sharing Plan fbo David Spreng |
32,099 | — | — | |||||||||
| (3) | Consists of the following: |
| Entities affiliated with Advanced Equities, Inc. |
Series A-2 | Series A-1 | Common | |||||||||
| Advanced Equities eAsic Investments I, LLC |
8,082 | 2,238 | 94,352 | |||||||||
| Advanced Equities eAsic Investments II, LLC |
45,970 | 12,729 | 361,007 | |||||||||
| AEI 2007 Venture Access Fund I, LLC |
805 | 223 | 20,907 | |||||||||
| AEI 2007 Venture Investments I, LLC |
3,530 | 977 | 47,831 | |||||||||
| AEI 2007 Venture Investments II, LLC |
20,990 | 5,812 | 162,001 | |||||||||
| AEI 2007 Venture Access Fund II, LLC |
4,041 | 1,119 | 32,410 | |||||||||
| AEI eASIC Investments III, LLC |
1,015 | 281 | 10,110 | |||||||||
| AEI eASIC Investments IV, LLC |
6,241 | 1,728 | 51,824 | |||||||||
| (4) | Tara Long, a member of our board of directors, is an officer of Seagate Technology PLC. Additionally, we have entered into a product supply agreement with Seagate Technology LLC. See “Product Supply Agreement – Seagate” below. |
| (5) | Wayne Cantwell is a member of our board of directors. |
2013 Convertible Note Financing
On May 30, 2013, we entered into a note purchase agreement pursuant to which we issued and sold convertible promissory notes in an aggregate principal amount of $1,500,000. The promissory notes accrued interest at a rate of six percent per year and were due and payable at the election of the holders on or after June 29, 2013. The interest and principal of the promissory notes were, at the election of the holder, (i) convertible at any time into Series A-2 stock at a conversion price of approximately $5.20 per share or (ii) upon a qualified financing with proceeds of at least $3.0 million, either convertible into equity securities issued in such qualified financing or required to be repaid from the proceeds of such qualified financing. On July 2, 2013, the aggregate principal amount of the promissory notes and accrued interest of $1,508,136.99 were converted into 290,459 shares of Series A-2 preferred at a conversion price of approximately $5.20 per share.
The participants in this financing included the following members of our board of directors and holders of more than 5% of our capital stock or entities affiliated with them. The following table sets forth the aggregate principal amount of promissory notes purchased in this 2013 convertible note financing:
| Participants |
Loan Amount | |||
| Khosla Ventures I, LP(1) |
$ | 750,000 | ||
| Entities affiliated with Crescendo Ventures(2) |
$ | 750,000 | ||
| (1) | Michael R. Kourey, a member of our board of directors, was a partner of Khosla Ventures until March 2015. |
128
Table of Contents
| (2) | Consists of $610,575 invested by Crescendo IV, LP, $32,550 invested by Crescendo IV AG & Co. Beteiligungs KG, $9,315 invested by Crescendo IV Entrepreneur Fund, LP, $3,810 purchased by Crescendo IV Entrepreneur Fund A, LP, and $93,750 purchased by Crescendo IV Coinvestment Fund, LLC. Wayne Cantwell, a member of our board of directors, is a general partner of Crescendo Ventures. |
2012 Convertible Note Financing
In June 2012, we entered into a note purchase agreement pursuant to which we issued and sold convertible promissory notes in June and October of 2012 in an aggregate principal amount of $4,068,646. The promissory notes accrued interest at a rate of five percent per year and were due and payable upon the demand of the holders on or after 90 days from the date of execution of the note purchase agreement. The interest and principal of the promissory notes were automatically convertible into equity securities issued in connection with a qualified financing with proceeds of at least $7.5 million. On December 13, 2012, and January 28, 2013, respectively, principal amounts of the notes and accrued interest of $4,049,937.94 and $7,722.38 were converted into 779,995 and 1,487 shares of Series A-2 preferred at a conversion price of approximately $5.20 per share.
The participants in this financing included the following members of our board of directors and holders of more than 5% of our capital stock, or entities affiliated with them. The following table sets forth the aggregate principal amounts of convertible promissory notes purchased in this 2012 convertible note financing:
| Participants |
Loan Amount | |||
| Entities affiliated with Crescendo Ventures(1) |
$ | 1,481,429 | ||
| Khosla Ventures I, LP(2) |
$ | 1,285,528 | ||
| KPCB Holdings, Inc. |
$ | 1,127,015 | ||
| (1) | Consists of $1,206,031 purchased by Crescendo IV, LP; $185,179 purchased by Crescendo IV Coinvestment Fund, LP; $64,294 purchased by Crescendo IV AG & Co. Beteiligungs KG; $18,399 purchased by Crescendo IV Entrepreneur Fund, LP; and $7,526 purchased by Crescendo IV Entrepreneur Fund A, LP. Wayne Cantwell, a member of our board of directors, is a general partner of Crescendo Ventures. |
| (2) | Michael R. Kourey, a member of our board of directors, was a partner of Khosla Ventures until March 2015. |
Product Supply Agreement—Seagate
We have entered into a product supply agreement with Seagate Technology LLC, an affiliate of Seagate Technology PLC (collectively, “Seagate”) pursuant to which Seagate orders products from us from time to time. Sales to Seagate, including sales to contract manufacturers or ODMs at the direction of Seagate, accounted for $1.6 million, $9.8 million and $21.0 million of revenues during the years ended December 31, 2012, 2013 and 2014, respectively, and $4.1 million and $3.2 million for the three months ended March 31, 2014 and 2015. In connection with our transactions with Seagate, we offset against research and development expenses an amount of $0.5 million, $1.3 million and $1.5 million for the years ended December 31, 2012, 2013 and 2014, respectively, and $0 and $0.2 million for the three months ended March 31, 2014 and 2015, respectively.
In addition, Seagate Singapore International Headquarters Pte. Ltd., an entity affiliated with Seagate, purchased 1,925,947 shares of our Series A-2 stock. See “Convertible Note Financings and Preferred Stock Financings—Series A-2 Convertible Preferred Stock Financing” above.
Employment and Consulting Agreements
We have entered into employment agreements with our executive officers. See “Executive and Director Compensation—Agreements with our Named Executive Officers.” We have entered into an offer letter agreement with Dr. Frank, and previously entered into a consulting agreement with Mr. Kourey, each members of our board of directors. See “Executive and Director Compensation—Director Agreement.”
129
Table of Contents
Stock Option Grants to Executive Officers and Non-Employee Directors
We have granted stock options to our executive officers and non-employee directors. For a description of options granted to our named executive officers and non-employee directors, see the section titled “Executive and Director Compensation—Outstanding Equity Awards at Fiscal Year-End” and “Executive and Director Compensation” above.
Indemnification Agreements
We have entered, and intend to continue to enter, into separate indemnification agreements with our directors and executive officers, in addition to the indemnification provided for in our amended and restated bylaws. These agreements, among other things, require us to indemnify our directors and executive officers for certain expenses, including attorneys’ fees, judgments, fines and settlement amounts incurred by a director or executive officer in any action or proceeding arising out of their services as one of our directors or executive officers or as a director or executive officer of any other company or enterprise to which the person provides services at our request. For more information regarding these indemnification arrangements, see “Management—Limitation on Liability and Indemnification of Directors and Officers.” We believe that these bylaw provisions and indemnification agreements are necessary to attract and retain qualified persons as directors and officers.
The limitation of liability and indemnification provisions in our amended and restated certificate of incorporation and amended and restated bylaws may discourage stockholders from bringing a lawsuit against directors for breach of their fiduciary duties. They may also reduce the likelihood of derivative litigation against directors and officers, even though an action, if successful, might benefit us and our stockholders. A stockholder’s investment may decline in value to the extent we pay the costs of settlement and damage awards against directors and officers pursuant to these indemnification provisions.
Policies and Procedures for Transactions with Related Persons
We have adopted a written related-person transactions policy that sets forth our policies and procedures regarding the identification, review, consideration and oversight of “related-person transactions.” For purposes of our policy only, a “related-person transaction” is a transaction, arrangement or relationship (or any series of similar transactions, arrangements or relationships) in which we and any “related person” are participants involving an amount that exceeds $120,000.
Transactions involving compensation for services provided to us as an employee, consultant or director are not considered related-person transactions under this policy. A related person is any executive officer, director, nominee to become a director or a holder of more than 5% of our common stock, including any of their immediate family members and affiliates, including entities owned or controlled by such persons.
Under the policy, where a transaction has been identified as a related-person transaction, management must present information regarding the proposed related-person transaction to our audit committee (or, where review by our audit committee would be inappropriate, to another independent body of our board of directors) for review. The presentation must include a description of, among other things, all of the parties, the direct and indirect interests of the related persons, the purpose of the transaction, the material facts, the benefits of the transaction to us and whether any alternative transactions are available, an assessment of whether the terms are comparable to the terms available from unrelated third parties and management’s recommendation. To identify related-person transactions in advance, we rely on information supplied by our executive officers, directors and certain significant stockholders. In considering related-person transactions, our audit committee or another independent body of our board of directors takes into account the relevant available facts and circumstances including, but not limited to:
| • | the risks, costs and benefits to us; |
| • | the impact on a director’s independence in the event the related person is a director, immediate family member of a director or an entity with which a director is affiliated; |
130
Table of Contents
| • | the terms of the transaction; |
| • | the availability of other sources for comparable services or products; and |
| • | the terms available to or from, as the case may be, unrelated third parties. |
In the event a director has an interest in the proposed transaction, the director must recuse himself or herself from the deliberations and approval.
131
Table of Contents
PRINCIPAL AND SELLING STOCKHOLDERS
The following table sets forth information regarding beneficial ownership of our capital stock by:
| • | each person, or group of affiliated persons, known by us to beneficially own more than 5% of our common stock; |
| • | each of our directors; |
| • | each of our named executive officers; |
| • | all of our current executive officers and directors as a group; and |
| • | each of the selling stockholders. |
The percentage ownership information under the column entitled “Before offering” is based on 15,055,418 shares of common stock outstanding as of March 31, 2015, assuming conversion of all outstanding shares of our Series A-2 stock into 5,145,683 shares of common stock and the termination and cancellation of 533,301 outstanding shares of our Series A-1 stock upon the completion of this offering. The percentage ownership information under the column entitled “After offering” is based on the sale of shares of common stock in this offering (including by selling stockholders), assuming an initial public offering price of $ per share (the midpoint of the price range set forth on the cover page of this prospectus).
Information with respect to beneficial ownership has been furnished by each director, officer, beneficial owner of more than 5% of our common stock, or selling stockholders. We have determined beneficial ownership in accordance with the rules of the SEC. These rules generally attribute beneficial ownership of securities to persons who possess sole or shared voting power or investment power with respect to those securities. In addition, the rules include shares of our common stock issuable pursuant to the exercise of stock options or warrants that are either immediately exercisable or exercisable within 60 days of March 31, 2015. As noted in the applicable footnotes to the table, some of the options are not vested but are exercisable at any time and, if exercised, subject to a lapsing right of repurchase until the options are fully vested. These shares are deemed to be outstanding and beneficially owned by the person holding those options or warrants for the purpose of computing the percentage ownership of that person, but they are not treated as outstanding for the purpose of computing the percentage ownership of any other person. Unless otherwise indicated, the persons or entities identified in this table have sole voting and investment power with respect to all shares shown as beneficially owned by them, subject to applicable community property laws.
132
Table of Contents
Except as otherwise noted below, the address for each person or entity listed in the table is c/o eASIC Corporation, 2585 Augustine Drive, Suite 100, Santa Clara, California 95054.
| Name and Address of Beneficial Owner |
Shares beneficially owned prior to this offering |
Number of shares being offered |
Shares beneficially owned after this offering |
|||||||||||||
| Shares | % | Shares | % | |||||||||||||
| Greater than 5% stockholders |
||||||||||||||||
| Khosla Ventures I, LP(1) 2128 Sand Hill Road Menlo Park, CA 94025 |
3,131,530 | 20.8 | % | % | ||||||||||||
| Entities affiliated with Crescendo Ventures(2) 600 Hansen Way Palo Alto, CA 94304 |
2,256,961 | 15.0 | % | % | ||||||||||||
| Seagate Singapore International Headquarters Pte. Ltd.(3) c/o Seagate Technology LLC 10200 S. De Anza Boulevard Cupertino, CA 95014 |
2,186,437 | 14.5 | % | % | ||||||||||||
| KPCB Holdings, Inc.(4) c/o Kleiner Perkins Caufield & Byers 2750 Sand Hill Road Menlo Park, CA 94025 |
1,315,965 | 8.7 | % | % | ||||||||||||
| Evergreen IV, L.P.(5) 25 Habarzel Street Tel-Aviv 69710 Israel |
1,168,319 | 7.8 | % | % | ||||||||||||
| Entities Affiliated with Advanced Equities(6) 311 S. Wacker Drive, Suite 1650 Chicago, IL 60606 |
892,372 | 5.9 | % | % | ||||||||||||
| Directors and Named Executive Officers |
||||||||||||||||
| Ronnie Vasishta(7) |
704,001 | 4.5 | % | % | ||||||||||||
| Ranko Scepanovic, Ph.D.(8) |
386,103 | 2.5 | % | % | ||||||||||||
| Richard J. Deranleau(9) |
193,048 | 1.3 | % | % | ||||||||||||
| Wayne Cantwell(2)(10) |
2,267,892 | 15.1 | % | % | ||||||||||||
| Dr. Edward H. Frank(11) |
91,930 | * | * | |||||||||||||
| Ronald S. Jankov(12) |
96,524 | * | * | |||||||||||||
| Michael R. Kourey(13) |
91,930 | * | * | |||||||||||||
| Tara Long |
— | — | % | |||||||||||||
| All current executive officers and directors as a group (11 persons)(14) |
4,023,050 | 24.2 | % | % | ||||||||||||
| Selling Stockholders |
||||||||||||||||
| * | Represents beneficial ownership of less than one percent |
| (1) | Includes 20,179 shares of common stock issuable pursuant to warrants exercisable within 60 days of March 31, 2015. Vinod Khosla (Khosla) is the manager of VK Services, LLC (VK Services), the manager of Khosla Ventures Associates I, LLC (KVA I). KVA I is the general partner of Khosla Ventures I, L.P. (KV I). Each of Khosla, VK Services and KVA I may be deemed to have voting and dispositive power over the shares held by KV I and each of Khosla, VK Services and KVA I may be deemed to have indirect beneficial ownership of the shares held by KV I. |
| (2) | Consists of (a) 1,731,564 shares held by Crescendo IV, LP (CIV), (b) 248,409 shares held by Crescendo IV Coinvestment Fund, LLC (Coinvestment), (c) 85,187 shares held by Crescendo IV AG & Co. Beteiligungs KG (Beteiligungs), (d) 26,104 shares held by Crescendo IV Entrepreneur Fund, LP (CIV Entrepreneur), (e) 10,676 shares held by Crescendo IV Entrepreneur Fund A, LP (CIV Entrepreneur A and, together with |
133
Table of Contents
| CIV, Coinvestment, Beteiligungs, CIV Entrepreneur, the Crescendo Entities), (f) 36,440 shares held by Crescendo Ventures 401k Profit Sharing Plan fbo David Spreng, (g) 58,304 shares held by Crescendo Ventures 401k Profit Sharing Plan fbo John Borchers, (h) 47,371 shares held by Crescendo Ventures 401k Profit Sharing Plan fbo Wayne Cantwell, and (i) an aggregate of 12,906 shares of common stock issuable pursuant to warrants exercisable within 60 days of March 31, 2015. Crescendo Ventures IV, LLP (CVIV) is the general partner of CIV, CIV Entrepreneur, CIV Entrepreneur A and Coinvestment and may be deemed to have sole voting and dispositive power over the shares held by CIV, CIV Entrepreneur, CIV Entrepreneur A and Coinvestment. Crescendo German Investments IV, LLC is the managing partner of Beteiligungs and may be deemed to have sole voting and dispositive power over the shares held by Beteiligungs. Wayne Cantwell, one of our directors, John Borchers and David Spreng are the general partners of CVIV and may be deemed to share voting and dispositive power over the shares held by the Crescendo Entities. |
| (3) | The directors of Seagate Singapore International Headquarters Pte. Ltd. (Seagate), Lai Chun Cheong and Patrick J. O’Malley, III may be deemed to have voting and dispositive power over the shares held by Seagate. |
| (4) | Consists of (a) 1,150,701 shares and 7,611 warrants exercisable within 60 days of March 31, 2015 held by Kleiner Perkins Caufield & Byers XI-A, L.P., or KPCB XI-A, (b) 22,486 shares and 149 warrants held by Kleiner Perkins Caufield & Byers XI-B, L.P., or KPCB XI-B, and (c) 134,131 shares and 887 warrants exercisable within 60 days of March 31, 2015 held by individuals and entities associated with Kleiner Perkins Caufield & Byers. All shares are held for convenience in the name of “KPCB Holdings, Inc. as nominee,” for the accounts of such individuals and entities who each exercise their own voting and dispositive power over such shares. The general partner of KPCB XI-A and KPCB XI-B is KPCB XI Associates, LLC. Brook H. Byers, L. John Doerr, Raymond J. Lane and Theodore E. Schlein, the managers of KPCB XI Associates, exercise shared voting and dispositive power over the shares directly held by KPCB XI-A and KPCB XI-B. |
| (5) | Includes 3,226 shares of common stock issuable pursuant to a warrant exercisable within 60 days of March 31, 2015. Erez Shachar, Boaz Dinte, Motti Hoss, Ofer Ne’eman, Ronit Bendori, Amichai Hammer and Adi Gan are members of the investment committee of Evergreen IV, LP., and may be deemed to share voting and dispositive power of the shares held by Evergreen IV, LP. |
| (6) | Consists of (a) 108,387 shares held by Advanced Equities eAsic Investments I, LLC, (b) 408,333 shares held Advanced Equities eAsic Investments II, LLC, (c) 21,077 shares held by AEI 2007 Venture Access Fund I, LLC, (d) 51,838 shares held by AEI 2007 Venture Investments I, LLC, (e) 185,829 shares held by AEI 2007 Venture Investments II, LLC, (f) 36,997 shares held by AEI 2007 Venture Access Fund II, LLC, (g) 11,262 shares held by AEI eASIC Investments III, LLC, (h) 58,909 shares held by AEI eASIC Investments IV, LLC; (i) 743 shares held by AEI 2007 Venture Access Fund I-2, LLC and (j) an aggregate of 8,997 shares of common stock issuable pursuant to warrants exercisable within 60 days of March 31, 2015. On September 16, 2014, Spruce Direct Investment Fund I, L.P. (SDI), an affiliate of Spruce Investment Advisors LLC, acquired assets and interests from Benman Holdings, LLC (BM Holdings), an affiliate of Southport Lane Financial, Inc. SDI is currently the managing member or general partner of the funds that BM Holdings acquired from Advanced Equities. Scott Ogur, the managing member of Spruce Management LLC, the general partner of SDI has sole voting and dispositive power with respect to these shares. |
| (7) | Includes 2,666 shares held by the Vasishta Family Trust 2007 for which Mr. Vasishta is a trustee and 696,002 shares of common stock issuable pursuant to stock options exercisable within 60 days of March 31, 2015, of which 43,118 shares are unvested, but are early exercisable within 60 days of March 31, 2015. |
| (8) | Reflects 386,103 shares of common stock issuable pursuant to stock options exercisable within 60 days of March 31, 2015, of which 25,936 shares are unvested, but are early exercisable within 60 days of March 31, 2015. |
| (9) | Represents shares of common stock issuable pursuant to stock options exercisable within 60 days of March 31, 2015, all of which are unvested, but are early exercisable within 60 days of March 31, 2015. |
| (10) | Includes 47,371 shares held by the Crescendo Ventures 401k Profit Sharing Plan fbo Wayne Cantwell. Mr. Cantwell is a general partner of CVIV and may be deemed to share voting and dispositive power over |
134
Table of Contents
| the shares held by the Crescendo Entities. Mr. Cantwell disclaims beneficial ownership of the shares held by the Crescendo Entities except to the extent of his pecuniary interest therein. |
| (11) | Includes 55,542 shares subject to repurchase by the Company within 60 days of March 31, 2015. |
| (12) | Includes 74,404 shares subject to repurchase by the Company within 60 days of March 31, 2015. |
| (13) | Includes 91,930 shares of common stock issuable pursuant to stock options exercisable within 60 days of March 31, 2015. |
| (14) | Includes (a) 12,906 shares of common stock issuable pursuant to warrants exercisable within 60 days of March 31, 2015, and (b) 1,557,372 shares of common stock issuable pursuant to stock options exercisable within 60 days of March 31, 2015, of which 345,103 shares are unvested and (c) 129,946 shares subject to repurchase by us as of 60 days of March 31, 2015. |
135
Table of Contents
The following is a summary of the rights of our common and preferred stock and some of the provisions of our amended and restated certificate of incorporation and amended and restated bylaws, which will become effective immediately prior to the completion of this offering, and of the Delaware General Corporation Law. This summary is not complete. For more detailed information, please see our amended and restated certificate of incorporation and amended and restated bylaws, which are filed as exhibits to the registration statement of which this prospectus is a part, as well as the relevant provisions of the Delaware General Corporation Law.
General
Immediately prior to the completion of this offering and upon the filing of our amended and restated certificate of incorporation, our authorized capital stock will consist of 100,000,000 shares of common stock, par value $0.001 per share and 10,000,000 shares of preferred stock, par value $0.001 per share. All of our authorized preferred stock upon the completion of this offering will be undesignated.
Common Stock
Outstanding Shares
On March 31, 2015, there were 15,055,418 shares of common stock outstanding, held of record by 210 stockholders. Based on such number of shares of common stock outstanding as of March 31, 2015, and (i) assuming the conversion of all outstanding shares of our Series A-2 stock into 5,145,683 shares of common stock immediately prior to the completion of this offering and (ii) the termination and cancellation of 533,301 outstanding shares of our Series A-1 stock upon the completion of this offering.
As of March 31, 2015, there were 3,413,188 shares of common stock subject to outstanding options under our equity incentive plans.
Voting
Our common stock is entitled to one vote for each share held of record on all matters submitted to a vote of the stockholders, including the election of directors, and does not have cumulative voting rights. Accordingly, the holders of a majority of the shares of our common stock entitled to vote in any election of directors can elect all of the directors standing for election.
Dividends
Subject to preferences that may be applicable to any then outstanding preferred stock, the holders of common stock are entitled to receive dividends, if any, as may be declared from time to time by our board of directors out of legally available funds.
Liquidation
In the event of our liquidation, dissolution or winding up, holders of our common stock will be entitled to share ratably in the net assets legally available for distribution to stockholders after the payment of all of our debts and other liabilities, subject to the satisfaction of any liquidation preference granted to the holders of any outstanding shares of preferred stock.
Rights and Preferences
Holders of our common stock have no preemptive, conversion or subscription rights, and there are no redemption or sinking fund provisions applicable to our common stock. The rights, preferences and privileges of the holders of our common stock are subject to, and may be adversely affected by, the rights of the holders of shares of any series of our preferred stock that we may designate and issue in the future.
136
Table of Contents
Fully Paid and Nonassessable
All of our outstanding shares of common stock are, and the shares of common stock to be issued in this offering will be, fully paid and nonassessable.
Preferred Stock
As of March 31, 2015, we had outstanding an aggregate of 4,532,662 shares of convertible preferred stock and 533,301 shares of non-convertible preferred stock held of record by 68 stockholders
Immediately prior to the completion of this offering, all outstanding shares of Series A-2 stock at March 31, 2015, will convert into 5,145,683 shares of our common stock and upon the completion of this offering, 533,301 outstanding shares of Series A-1 non-convertible preferred stock will terminate and be cancelled.
Immediately prior to completion of this offering, our certificate of incorporation will be amended and restated to delete all references to such shares of convertible preferred stock. Under the amended and restated certificate of incorporation, our board of directors will have the authority, without further action by the stockholders, to issue up to 10,000,000 shares of preferred stock in one or more series, to establish from time to time the number of shares to be included in each such series, to fix the rights, preferences and privileges of the shares of each wholly unissued series and any qualifications, limitations or restrictions thereon and to increase or decrease the number of shares of any such series, but not below the number of shares of such series then outstanding.
Our board of directors may authorize the issuance of preferred stock with voting or conversion rights that could adversely affect the voting power or other rights of the holders of the common stock. The issuance of preferred stock, while providing flexibility in connection with possible acquisitions and other corporate purposes, could, among other things, have the effect of delaying, deferring or preventing a change in our control that may otherwise benefit holders of our common stock and may adversely affect the market price of the common stock and the voting and other rights of the holders of common stock. We have no current plans to issue any shares of preferred stock.
Stock Options
As of March 31, 2015, 3,413,188 shares of common stock were issuable upon the exercise of outstanding stock options, at a weighted-average exercise price of $1.39 per share.
Warrants
As of March 31, 2015, 108,020 shares of common stock were issuable upon exercise of outstanding warrants to purchase common stock at a weighted-average exercise price of $16.11 per share. These warrants provide for the adjustment of the number of shares issuable upon the exercise of the warrants in the event of stock splits, recapitalizations, reclassifications and consolidations. Of these warrants, warrants exercisable for 75,752 shares of common stock issuable upon the exercise of such common stock warrants outstanding as of March 31, 2015, at a weighted-average exercise price of approximately $16.37 per share, shall terminate unless exercised immediately prior to the completion of this offering.
As of March 31, 2015, warrants to purchase 98,221 shares of Series A-2 stock at an exercise price of approximately $5.19 per share were outstanding. These warrants will automatically convert to warrants to purchase an aggregate of 111,505 shares of our common stock immediately prior to the completion of this offering.
137
Table of Contents
Registration Rights
Following the completion of this offering, certain holders of our common stock, common stock issuable upon conversion of outstanding preferred stock and shares of preferred stock subject to outstanding warrants, or their transferees, will be entitled to the registration rights set forth below with respect to registration of the resale of such shares under the Securities Act pursuant to the investors’ rights agreement by and among us and certain of our stockholders. We will pay the registration expenses, other than the underwriting discounts and commissions, of the shares registered pursuant to the demand, piggyback, and Form S-3 registrations described below, including the legal fees payable to the selling holders’ counsel in connection with such registrations not to exceed $50,000.
Generally, in an underwritten offering, the managing underwriter, if any, has the right, subject to specified conditions, to limit the number of shares such holders may include. The demand, piggyback, and Form S-3 registration rights described below will expire when all holders can sell all of their shares in a 90-day period under Rule 144 of the Exchange Act, provided, however, that the registration rights of any holder holding more than 40,000 Series A-2 preferred shares, so long as such holder holds at least one percent of our outstanding capital stock, shall not terminate until seven years after the closing of this offering.
Demand Registration Rights
The holders of an aggregate of 14,509,447 shares of our common stock, common stock issuable upon conversion of outstanding preferred stock and stock subject to outstanding warrants as of March 31, 2015, will be entitled to certain demand registration rights. At any time beginning on the earlier of December 13, 2015 or 180 days following the effectiveness of this registration statement, the holders of at least 30% of these shares may, on not more than three occasions, request that we register all or a portion of their shares, subject to certain specified exceptions. Such request for registration must cover at least 20% of the registrable securities then outstanding for an aggregate offering price equal or greater than $5.0 million.
Piggyback Registration Rights
In connection with this offering, the holders of an aggregate of 14,633,859 shares of our common stock, common stock issuable upon conversion of outstanding preferred stock and stock subject to outstanding warrants as of March 31, 2015, were entitled to, and the necessary percentage of holders waived, their rights to notice of this offering and to include their shares of registrable securities in this offering. In the event that we propose to register any of our securities under the Securities Act in another offering, either for our own account or for the account of other security holders, the holders of these shares will be entitled to certain “piggyback” registration rights allowing them to include their shares in such registration, subject to certain marketing and other limitations. As a result, whenever we propose to file a registration statement under the Securities Act, including a registration statement on Form S-3 as discussed below, other than with respect to a demand registration or a registration statement relating solely to employee benefit plans, related to the offer and sale of debt securities, a registration relating to a corporate reorganization or transaction covered by Rule 145 under the Securities Act, or any registration that does not permit secondary sales, the holders of these shares are entitled to notice of the registration and have the right, subject to limitations that the underwriters may impose on the number of shares included in the registration, to include their shares in the registration.
S-3 Registration Rights
The holders of an aggregate of 14,633,859 shares of our common stock, stock issuable upon conversion of outstanding preferred stock and stock subject to outstanding warrants as of March 31, 2015, will be entitled to certain Form S-3 registration rights. Holders of these shares can make a request that we register their shares on Form S-3 if we are qualified to file a registration statement on Form S-3, subject to specified exceptions. Such request for registration on Form S-3 must cover securities with an aggregate offering price which equals or exceeds $2.0 million. We will not be required to effect more than two registrations on Form S-3 within any 12-month period.
138
Table of Contents
Anti-Takeover Effects of Provisions of Certificate of Incorporation, Our Bylaws and Delaware Law
Delaware Anti-Takeover Law
We are subject to Section 203 of the Delaware General Corporation Law, or Section 203. Section 203 generally prohibits a public Delaware corporation from engaging in a “business combination” with an “interested stockholder” for a period of three years after the date of the transaction in which the person became an interested stockholder, unless:
| • | prior to the date of the transaction, the board of directors of the corporation approved either the business combination or the transaction which resulted in the stockholder becoming an interested stockholder; |
| • | the interested stockholder owned at least 85% of the voting stock of the corporation outstanding upon consummation of the transaction, excluding for purposes of determining the number of shares outstanding (a) shares owned by persons who are directors and also officers and (b) shares owned by employee stock plans in which employee participants do not have the right to determine confidentially whether shares held subject to the plan will be tendered in a tender or exchange offer; or |
| • | on or subsequent to the consummation of the transaction, the business combination is approved by the board and authorized at an annual or special meeting of stockholders, and not by written consent, by the affirmative vote of at least 66 2/3% of the outstanding voting stock which is not owned by the interested stockholder. |
Section 203 defines a business combination to include:
| • | any merger or consolidation involving the corporation and the interested stockholder; |
| • | any sale, transfer, pledge or other disposition involving the interested stockholder of 10% or more of the assets of the corporation; |
| • | subject to exceptions, any transaction involving the corporation that has the effect of increasing the proportionate share of the stock of any class or series of the corporation beneficially owned by the interested stockholder; |
| • | subject to exceptions, any transaction that results in the issuance or transfer by the corporation of any stock of the corporation to the interested stockholder; and |
| • | the receipt by the interested stockholder of the benefit of any loans, advances, guarantees, pledges or other financial benefits provided by or through the corporation. |
In general, Section 203 defines an interested stockholder as any entity or person beneficially owning 15% or more of the outstanding voting stock of the corporation and any entity or person affiliated with or controlling or controlled by the entity or person.
Amended and Restated Certificate of Incorporation and Amended and Restated Bylaws
Because our stockholders do not have cumulative voting rights, our stockholders holding a majority of the voting power of our shares of common stock outstanding will be able to elect all of our directors. Our amended and restated certificate of incorporation and amended and restated bylaws to be effective upon the completion of this offering will provide that all stockholder actions must be effected at a duly called meeting of stockholders and not by written consent. A special meeting of stockholders may be called by the majority of our whole board of directors, chair of the board of directors or our chief executive officer.
As described above in “Management—Board Composition,” in accordance with our amended and restated certificate of incorporation effective upon the completion of this offering, our board of directors will be divided into three classes with staggered three-year terms.
139
Table of Contents
In addition, our amended and restated certificate of incorporation and amended and restated bylaws will provide that the number of directors constituting our board of directors will be permitted to be set only by a resolution adopted by a majority vote of our entire board of directors, and that our directors may be removed only for cause. Our amended and restated certificate of incorporation and amended and restated bylaws will also provide that vacancies occurring on our board of directors and newly created directorships resulting from an increase in the authorized number of directors may be filled only by vote of a majority of the remaining members of our board of directors, even though less than a quorum. Our amended and restated certificate of incorporation and amended and restated bylaws will provide that our board of directors is expressly authorized to adopt, amend or repeal our bylaws, and require a supermajority stockholder vote to amend our bylaws and certain provisions of our certificate of incorporation.
Our amended and restated bylaws will provide advance notice procedures for stockholders seeking to bring business before our annual meeting of stockholders or to nominate candidates for election as directors at our annual meeting of stockholders. Our amended and restated bylaws will also specify certain requirements regarding the form and content of a stockholder’s notice. These provisions might preclude our stockholders from bringing matters before our annual meeting of stockholders or from making nominations for directors at our annual meeting of stockholders if the proper procedures are not followed. We expect that these provisions may also discourage or deter a potential acquirer from conducting a solicitation of proxies to elect the acquirer’s own slate of directors or otherwise attempting to obtain control of our company.
The foregoing provisions will make it more difficult for our existing stockholders to replace our board of directors as well as for another party to obtain control of us by replacing our board of directors. Since our board of directors has the power to retain and discharge our officers, these provisions could also make it more difficult for existing stockholders or another party to effect a change in management. In addition, the authorization of undesignated preferred stock makes it possible for our board of directors to issue preferred stock with voting or other rights or preferences that could impede the success of any attempt to change our control.
These provisions are intended to enhance the likelihood of continued stability in the composition of our board of directors and its policies and to discourage certain types of transactions that may involve an actual or threatened acquisition of us. These provisions are also designed to reduce our vulnerability to an unsolicited acquisition proposal and to discourage certain tactics that may be used in proxy fights. However, such provisions could have the effect of discouraging others from making tender offers for our shares and may have the effect of deterring hostile takeovers or delaying changes in our control or management. As a consequence, these provisions also may inhibit fluctuations in the market price of our stock that could result from actual or rumored takeover attempts.
Choice of Forum
Our amended and restated certificate of incorporation will provide that the Court of Chancery of the State of Delaware will be the exclusive forum for any derivative action or proceeding brought on our behalf; any action asserting a breach of fiduciary duty; any action asserting a claim against us arising pursuant to the Delaware General Corporation Law, our amended and restated certificate of incorporation or our bylaws; or any action asserting a claim against us that is governed by the internal affairs doctrine. The enforceability of similar choice of forum provisions in other companies’ certificates of incorporation has been challenged in legal proceedings, and it is possible that a court could find these types of provisions to be inapplicable or unenforceable.
Listing
We have applied to have our common stock listed on the NASDAQ Global Market under the symbol “EASI.”
Transfer Agent and Registrar
The transfer agent and registrar for our common stock is Computershare Trust Company, N.A. The transfer agent and registrar’s address is 250 Royall Street, Canton, Massachusetts 02021.
140
Table of Contents
SHARES ELIGIBLE FOR FUTURE SALE
Immediately prior to this offering, there has been no public market for our common stock. Future sales of substantial amounts of common stock in the public market could adversely affect prevailing market prices. Furthermore, since only a limited number of shares will be available for sale shortly after this offering because of contractual and legal restrictions on resale described below, sales of substantial amounts of common stock in the public market after the restrictions lapse could adversely affect the prevailing market price for our common stock as well as our ability to raise equity capital in the future.
Based on the number of shares of common stock outstanding as of March 31, 2015, upon the completion of this offering, shares of common stock will be outstanding, assuming (1) no exercise of the underwriters’ option to purchase additional shares to cover any over-allotments, if any, and (2) no exercise of outstanding options or warrants. All of the shares sold by us and the selling stockholders in this offering will be freely tradable unless purchased by our “affiliates” as that term is defined in Rule 144 under the Securities Act or purchased by existing stockholders and their affiliated entities who are subject to lock-up agreements. The remaining shares of common stock outstanding after this offering will be restricted as a result of securities laws or lock-up agreements. These remaining shares will generally become available for sale in the public market as follows:
| • | No restricted shares will be eligible for immediate sale upon the completion of this offering; and |
| • | Up to restricted shares will be eligible for sale under Rule 144 or Rule 701, subject to the volume limitations, manner of sale and notice provisions described below under “Rule 144,” upon expiration of lock-up agreements at least 180 days after the date of this offering. |
Rule 144
In general, under Rule 144 as currently in effect, beginning 90 days after the effective date of the registration statement of which this prospectus is a part, any person who is not an affiliate of ours and has held their shares for at least six months, including the holding period of any prior owner other than one of our affiliates, may sell shares without restriction, provided current public information about us is available. In addition, under Rule 144, any person who is not an affiliate of ours and has held their shares for at least one year, including the holding period of any prior owner other than one of our affiliates, would be entitled to sell an unlimited number of shares immediately upon the completion of this offering without regard to whether current public information about us is available.
Beginning 90 days after the effective date of the registration statement of which this prospectus is a part, a person who is an affiliate of ours and who has beneficially owned restricted securities for at least six months, including the holding period of any prior owner other than one of our affiliates, is entitled to sell a number of restricted shares within any three-month period that does not exceed the greater of:
| • | 1% of the number of shares of our common stock then outstanding, which will equal approximately shares immediately after this offering; or |
| • | the average weekly trading volume of our common stock on during the four calendar weeks preceding the filing of a notice on Form 144 with respect to the sale. |
Sales of restricted shares under Rule 144 held by our affiliates are also subject to requirements regarding the manner of sale, notice and the availability of current public information about us. Rule 144 also provides that affiliates relying on Rule 144 to sell shares of our common stock that are not restricted shares must nonetheless comply with the same restrictions applicable to restricted shares, other than the holding period requirement.
Notwithstanding the availability of Rule 144, the holders of substantially all of our restricted shares have entered into lock-up agreements as described below and their restricted shares will become eligible for sale at the expiration of the restrictions set forth in those agreements.
141
Table of Contents
Rule 701
Under Rule 701, shares of our common stock acquired upon the exercise of currently outstanding options or pursuant to other rights granted under our stock plans may be resold by:
| • | persons other than affiliates, beginning 90 days after the effective date of the registration statement of which this prospectus is a part, subject only to the manner-of-sale provisions of Rule 144; and |
| • | our affiliates, beginning 90 days after the effective date of the registration statement of which this prospectus is a part, subject to the manner-of-sale and volume limitations, current public information and filing requirements of Rule 144, in each case, without compliance with the six-month holding period requirement of Rule 144. |
As of March 31, 2015, options to purchase a total of 3,413,188 shares of common stock were outstanding, of which 2,150,093 were vested. Of the total number of shares of our common stock issuable under these options, substantially all are subject to contractual lock-up agreements with us or the underwriters described below under “Underwriting” and will become eligible for sale in accordance with Rule 701 at the expiration of those agreements.
Lock-Up Agreements
We, along with our directors, executive officers and substantially all of our other stockholders, optionholders, convertible noteholders and warrantholders, including the selling stockholders, have agreed with the underwriters that for a period of 180 days (the restricted period), after the date of this prospectus, subject to specified exceptions, we or they will not offer, pledge, sell, contract to sell, sell any option or contract to purchase, purchase any option or contract to sell, grant any option, right or warrant to purchase, lend or otherwise transfer or dispose of, directly or indirectly, any shares of common stock or any securities convertible into or exercisable or exchangeable for shares of common stock, or enter into any swap or other arrangement that transfers to another, in whole or in part, any of the economic consequences of ownership of the common stock. Upon expiration of the “restricted” period, certain of our stockholders and warrantholders will have the right to require us to register their shares under the Securities Act. See “—Registration Rights” below and “Description of Capital Stock—Registration Rights.”
After this offering, certain of our employees, including our executive officers and/or directors, may enter into written trading plans that are intended to comply with Rule 10b5-1 under the Exchange Act. Sales under these trading plans would not be permitted until the expiration of the lock-up agreements relating to the offering described above.
Registration Rights
Upon the completion of this offering, the holders of an aggregate of 14,633,859 shares of our common stock as of March 31, 2015, including shares of our common stock issuable upon exercise of outstanding warrants, will be entitled to rights with respect to the registration of their shares under the Securities Act, subject to the lock-up agreements described under “—Lock-Up Agreements” above. Registration of these shares under the Securities Act would result in the shares becoming freely tradable without restriction under the Securities Act, except for shares purchased by affiliates, immediately upon the effectiveness of the registration statement of which this prospectus is a part. Any sales of securities by these stockholders could have a material adverse effect on the trading price of our common stock. See “Description of Capital Stock—Registration Rights.”
Equity Incentive Plans
We intend to file with the SEC a registration statement on Form S-8 under the Securities Act covering the shares of common stock reserved for issuance under the 2015 plan and the 2015 ESPP. The registration statement is expected to be filed and become effective as soon as practicable after the completion of this offering. Accordingly, shares registered under the registration statement will be available for sale in the open market following its effective date, subject to Rule 144 volume limitations and the lock-up agreements described above, if applicable.
142
Table of Contents
MATERIAL U.S. FEDERAL INCOME AND ESTATE TAX CONSEQUENCES
TO NON-U.S. HOLDERS OF OUR COMMON STOCK
The following is a summary of certain material U.S. federal income tax considerations relating to the acquisition, ownership, and disposition of common stock pursuant to this offering. This summary deals only with common stock held as a capital asset (within the meaning of Section 1221 of the Code) by a holder and does not discuss the U.S. federal income tax considerations applicable to a holder that is subject to special treatment under U.S. federal income tax laws, including, but not limited to: a dealer in securities or currencies; a financial institution; a regulated investment company; a real estate investment trust; a tax-exempt organization; an insurance company; a person holding common stock as part of a hedging, integrated, conversion, or straddle transaction or a person deemed to sell common stock under the constructive sale provisions of the Code; a trader in securities that has elected the mark-to-market method of accounting; a person liable for alternative minimum tax or the Medicare contribution tax; an entity that is treated as a partnership for U.S. federal income tax purposes; a person that received such common stock in connection with services provided; a U.S. person whose “functional currency” is not the U.S. dollar; a “controlled foreign corporation;” a “passive foreign investment company;” or a U.S. expatriate.
This summary is based upon provisions of the Code, applicable U.S. Treasury regulations promulgated thereunder, published rulings, and judicial decisions, all as in effect as of the date hereof. We have not sought, and will not seek, any ruling from the Internal Revenue Service, or IRS, with respect to the tax consequences discussed herein, and there can be no assurance that the IRS will not take a position contrary to the tax consequences discussed below or that any position taken by the IRS would not be sustained. Those authorities may be changed, perhaps retroactively, or may be subject to differing interpretations, which could result in U.S. federal income tax consequences different from those discussed below. This summary does not address all aspects of U.S. federal income tax, does not deal with all tax considerations that may be relevant to stockholders in light of their personal circumstances, and does not address the Medicare tax imposed on certain investment income or any state, local, foreign, gift, estate (except to the limited extent set forth herein), or alternative minimum tax considerations.
For purposes of this discussion, a “U.S. holder” is a beneficial holder of common stock that is: an individual citizen or resident of the United States; a corporation (or any other entity treated as a corporation for U.S. federal income tax purposes) created or organized in or under the laws of the United States, any state thereof or the District of Columbia; an estate the income of which is subject to U.S. federal income taxation regardless of its source; or a trust if it (i) is subject to the primary supervision of a court within the United States and one or more U.S. persons have the authority to control all substantial decisions of the trust or (ii) has a valid election in effect under applicable U.S. Treasury regulations to be treated as a U.S. person.
For purposes of this discussion a “non-U.S. holder” is a beneficial holder of common stock that is neither a U.S. holder nor a partnership (or any other entity or arrangement that is treated as a partnership) for U.S. federal income tax purposes. If a partnership (or an entity or arrangement that is treated as a partnership for U.S. federal income tax purposes) holds common stock, the tax treatment of a partner will generally depend upon the status of the partner and the activities of the partnership. A partner of a partnership holding common stock is urged to consult its own tax advisors.
PROSPECTIVE INVESTORS ARE URGED TO CONSULT THEIR OWN TAX ADVISORS CONCERNING THEIR PARTICULAR U.S. FEDERAL INCOME TAX CONSEQUENCES IN LIGHT OF THEIR SPECIFIC SITUATIONS, AS WELL AS THE TAX CONSEQUENCES ARISING UNDER ANY STATE, LOCAL, OR NON-U.S. TAX LAWS AND ANY OTHER U.S. FEDERAL TAX LAWS (INCLUDING THE U.S. FEDERAL ESTATE AND GIFT TAX LAWS).
143
Table of Contents
Distributions on our Common Stock
Distributions with respect to common stock, if any, generally will constitute dividends for U.S. federal income tax purposes to the extent paid out of current or accumulated earnings and profits, as determined for U.S. federal income tax purposes. Any portion of a distribution in excess of current or accumulated earnings and profits will be treated as a return of capital and will first be applied to reduce the holder’s tax basis in its common stock, but not below zero. Any remaining amount will then be treated as gain from the sale or exchange of the common stock and will be treated as described under the section entitled “—Disposition of our Common Stock” below.
Distributions treated as dividends that are paid to a non-U.S. holder, if any, with respect to shares of our common stock will be subject to U.S. federal withholding tax at a rate of 30% (or lower applicable income tax treaty rate) of the gross amount of the dividends unless the dividends are effectively connected with the non-U.S. holder’s conduct of a trade or business in the United States. If a non-U.S. holder is engaged in a trade or business in the United States and dividends with respect to the common stock are effectively connected with the conduct of that trade or business and, if required by an applicable income tax treaty, are attributable to a U.S. permanent establishment, then although the non-U.S. holder will generally be exempt from the 30% U.S. federal withholding tax, provided certain certification requirements are satisfied, the non-U.S. holder will be subject to U.S. federal income tax on those dividends on a net income basis at regular graduated U.S. federal income tax rates in the same manner as if such holder were a resident of the United States. Any such effectively connected income received by a foreign corporation may, under certain circumstances, be subject to an additional branch profits tax equal to 30% (or lower applicable income tax treaty rate) of its effectively connected earnings and profits for the taxable year, as adjusted under the Code. To claim the exemption from withholding with respect to any such effectively connected income, the non-U.S. holder must generally furnish to us or our paying agent a properly executed IRS Form W-8ECI (or applicable successor form).
A non-U.S. holder of shares of common stock who wishes to claim the benefit of a reduced rate of withholding tax under an applicable treaty must furnish to us or our paying agent a valid IRS Form W-8BEN or IRS Form W-8BEN-E (or applicable successor form) certifying such holder’s qualification for the exemption or reduced rate. If a non-U.S. holder is eligible for a reduced rate of U.S. withholding tax pursuant to an income tax treaty, it may obtain a refund of any excess amounts withheld by timely filing an appropriate claim for refund with the IRS. Non-U.S. holders are urged to consult their tax advisors regarding their entitlement to benefits under a relevant income tax treaty.
Disposition of our Common Stock
Non-U.S. holders may recognize gain upon the sale, exchange, redemption, or other taxable disposition of common stock. Subject to the discussion below regarding backup withholding and foreign accounts, such gain generally will not be subject to U.S. federal income tax unless: (i) that gain is effectively connected with the non-U.S. holder’s conduct of a trade or business in the United States (and, if required by an applicable income tax treaty, is attributable to a U.S. permanent establishment maintained by the non-U.S. holder); (ii) the non-U.S. holder is a nonresident alien individual who is present in the United States for 183 days or more in the taxable year of that disposition, and certain other conditions are met; or (iii) we are or have been a “U.S. real property holding corporation” for U.S. federal income tax purposes at any time during the shorter of the five-year period preceding the date of disposition or the holder’s holding period for our common stock, and certain other requirements are met. We believe that we are not and we do not anticipate becoming a “U.S. real property holding corporation” for U.S. federal income tax purposes.
If a non-U.S. holder is an individual described in clause (i) of the preceding paragraph, the non-U.S. holder will generally be subject to tax on a net income basis at the regular graduated U.S. federal individual income tax rates in the same manner as if such holder were a resident of the United States, unless an applicable income tax treaty provides otherwise. In addition, the non-U.S. holder may be subject to the branch profits tax at a rate equal to 30% (or lower applicable income tax treaty rate) of its effectively connected earnings and profits. If the non-U.S. holder is an individual described in clause (ii) of the preceding paragraph, the non-U.S. holder will generally
144
Table of Contents
be subject to a flat 30% tax on the gain, which may be offset by U.S. source capital losses even though the non-U.S. holder is not considered a resident of the United States, provided that the non-U.S. holder has timely filed U.S. federal income tax returns with respect to such losses.
U.S. Federal Estate Tax
The estate of a nonresident alien individual is generally subject to U.S. federal estate tax on property having a U.S. situs. Because we are a U.S. corporation, our common stock will be U.S. situs property and therefore will be included in the taxable estate of a nonresident alien decedent, unless an applicable estate tax treaty between the United States and the decedent’s country of residence provides otherwise.
Information Reporting and Backup Withholding Tax
We report to our non-U.S. holders and the IRS the amount of dividends paid during each fiscal year and the amount of any tax withheld. All distributions to holders of common stock are subject to any applicable withholding. Information reporting requirements apply even if no withholding was required because the distributions were effectively connected with the non-U.S. holder’s conduct of a U.S. trade or business or withholding was reduced by an applicable income tax treaty. This information also may be made available under a specific treaty or agreement with the tax authorities in the country in which the non-U.S. holder resides or is established. Under U.S. federal income tax law, interest, dividends, and other reportable payments may, under certain circumstances, be subject to “backup withholding” at the then applicable rate (currently, 28%). Backup withholding, however, generally will not apply to distributions on our common stock to a non-U.S. holder, provided the non-U.S. holder furnishes to us or our paying agent the required certification as to its non- U.S. status, such as by providing a valid IRS Form W-8BEN, IRS Form W-8BEN-E or IRS Form W-8ECI, or certain other requirements are met. Notwithstanding the foregoing, backup withholding may apply if either we or our paying agent has actual knowledge, or reason to know, that the holder is a U.S. person that is not an exempt recipient. Backup withholding is not an additional tax but merely an advance payment, which may be refunded to the extent it results in an overpayment of tax and the appropriate information is timely supplied to the IRS.
Foreign Accounts
New rules in the Code may impose withholding taxes on certain types of payments made to “foreign financial institutions” (as specially defined under these rules) and certain other non-U.S. entities if certification, information reporting and other specified requirements are not met. The legislation potentially imposes a 30% withholding tax on “withholdable payments” if they are paid to a foreign financial institution or to a foreign nonfinancial entity, unless (i) the foreign financial institution undertakes certain diligence and reporting obligations and other specified requirements are satisfied or (ii) the foreign non-financial entity either certifies it does not have any substantial U.S. owners or furnishes identifying information regarding each substantial U.S. owner and other specified requirements are satisfied. “Withholdable payment” generally means (i) any payment of interest, dividends, rents, and certain other types of generally passive income if such payment is from sources within the United States, and (ii) any gross proceeds from the sale or other disposition of any property of a type that can produce interest or dividends from sources within the United States (including, for example, stock and debt of U.S. corporations). If the payee is a foreign financial institution, it must enter into an agreement with the U.S. Treasury requiring, among other things, that it undertake to identify accounts held by certain U.S. persons or U.S.-owned foreign entities, annually report certain information about such accounts and withhold 30% on payments to account holders whose actions prevent it from complying with these reporting and other requirements. An applicable intergovernmental agreement between the United States and a foreign jurisdiction may modify the foregoing rules. If an investor does not provide us with the information necessary to comply with the legislation, it is possible that distributions to such investor that are attributable to withholdable payments, such as dividends, will be subject to the 30% withholding tax. Withholding on certain passive income, such as dividends and interest, began on July 1, 2014. The IRS has issued guidance indicating that withholding with respect to all other withholdable payments will be required after December 31, 2016. Prospective investors should consult their own tax advisers regarding this legislation.
145
Table of Contents
Under the terms and subject to the conditions in an underwriting agreement dated the date of this prospectus, the underwriters named below, for whom Morgan Stanley & Co. LLC and Deutsche Bank Securities Inc. are acting as representatives, have severally agreed to purchase from us and the selling stockholders, and we and the selling stockholders have agreed to sell to them, severally, the number of shares indicated below:
| Name |
Number of | |
| Morgan Stanley & Co. LLC |
||
| Deutsche Bank Securities Inc. |
||
| Raymond James & Associates, Inc. |
||
| Robert W. Baird & Co. Incorporated |
||
| William Blair & Company, L.L.C. |
||
| Roth Capital Partners, LLC |
||
| Northland Securities, Inc. |
||
|
| ||
| Total: |
||
|
|
The underwriters and the representatives are collectively referred to as the “underwriters” and the “representatives,” respectively. The underwriters are offering the shares of common stock subject to their acceptance of the shares from us and the selling stockholders and subject to prior sale. The underwriting agreement provides that the obligations of the several underwriters to pay for and accept delivery of the shares of common stock offered by this prospectus are subject to the approval of certain legal matters by their counsel and to certain other conditions. The underwriters are obligated to take and pay for all of the shares of common stock offered by this prospectus if any such shares are taken. However, the underwriters are not required to take or pay for the shares covered by the underwriters’ over-allotment option described below.
The underwriters initially propose to offer part of the shares of common stock directly to the public at the offering price listed on the cover page of this prospectus and part to certain dealers, at such offering price less a selling concession not in excess of $ per share. After the initial offering of the shares of common stock, the offering price, and other selling terms may from time to time be varied by the representatives. The offering of the shares by the underwriters is subject to receipt and acceptance and subject to the underwriters’ right to reject any order in whole or in part.
The underwriters have an option, exercisable for 30 days from the date of this prospectus, to purchase up to additional shares of common stock from us at the public offering price listed on the cover page of this prospectus, less underwriting discounts and commissions. The underwriters may exercise this option solely for the purpose of covering over-allotments, if any, made in connection with the offering of the shares of common stock offered by this prospectus. To the extent the option is exercised, each underwriter will become obligated, subject to certain conditions, to purchase about the same percentage of the additional shares of common stock as the number listed next to the underwriter’s name in the preceding table bears to the total number of shares of common stock listed next to the names of all underwriters in the preceding table.
146
Table of Contents
The following table shows the per share and total public offering price, underwriting discounts and commissions, and proceeds before expenses to us and the selling stockholders. These amounts are shown assuming both no exercise and full exercise of the underwriters’ option to purchase up to an additional shares of common stock.
| Total | ||||||||||||
| Per Share | No Exercise | Full Exercise | ||||||||||
| Public offering price |
$ | $ | $ | |||||||||
| Underwriting discounts and commissions to be paid by us |
||||||||||||
| Underwriting discounts and commissions to be paid by the selling stockholders |
||||||||||||
| Proceeds, before expenses, to us |
||||||||||||
| Proceeds, before expenses, to the selling stockholders |
||||||||||||
The estimated offering expenses payable by us, exclusive of the underwriting discounts and commissions, are approximately $ , which includes legal, accounting and printing costs, and various other fees associated with the registration and listing of our common stock. We have agreed to reimburse the underwriters for certain FINRA related expenses incurred by them in connection with the offering, up to $30,000 as set forth in the underwriting agreement.
The underwriters have informed us that they do not intend sales to discretionary accounts to exceed 5% of the total number of shares of common stock offered by them.
We have applied to have our common stock listed on the NASDAQ Global Market under the trading symbol “EASI.”
We, all of our directors and officers, and the holders of substantially all of our common stock and securities exercisable for or convertible into our common stock outstanding immediately prior to this offering, including the selling stockholders, have agreed that, without the prior written consent of each of Morgan Stanley & Co. LLC and Deutsche Bank Securities Inc. on behalf of the underwriters, we and they will not, during the period ending 180 days after the date of this prospectus (restricted period):
| • | offer, pledge, sell, contract to sell, sell any option or contract to purchase, purchase any option or contract to sell, grant any option, right or warrant to purchase, lend or otherwise transfer or dispose of, directly or indirectly, any shares of common stock or any securities convertible into or exercisable or exchangeable for shares of common stock; |
| • | file any registration statement with the Securities and Exchange Commission relating to the offering of any shares of common stock or any securities convertible into or exercisable or exchangeable for common stock; or |
| • | enter into any swap or other arrangement that transfers to another, in whole or in part, any of the economic consequences of ownership of the common stock. |
Whether any such transaction described above is to be settled by delivery of common stock or such other securities, in cash or otherwise. In addition, we and each such person agrees that, without the prior written consent of Morgan Stanley & Co. LLC and Deutsche Bank Securities Inc. on behalf of the underwriters, we or such other person will not, during the restricted period, make any demand for, or exercise any right with respect to, the registration of any shares of common stock or any security convertible into or exercisable or exchangeable for common stock.
The restrictions described in the immediately preceding paragraph do not apply to:
| • | the sale of shares to the underwriters; |
147
Table of Contents
| • | the issuance by the Company of shares of common stock upon the exercise of an option or a warrant or the conversion of a security outstanding on the date of this prospectus of which the underwriters have been advised in writing; |
| • | transactions by any person other than us relating to shares of common stock or other securities acquired in open market transactions after the completion of the offering of the shares; provided that no filing under Section 16(a) of the Securities Exchange Act of 1934, as amended (the “Exchange Act”), is required or voluntarily made in connection with subsequent sales of the common stock or other securities acquired in such open market transactions; or |
| • | the establishment of a trading plan pursuant to Rule 10b5-1 under the Exchange Act for the transfer of shares of common stock, provided that (i) such plan does not provide for the transfer of common stock during the restricted period and (ii) to the extent a public announcement or filing under the Exchange Act, if any, is required or voluntarily made regarding the establishment of such plan, such announcement or filing shall include a statement to the effect that no transfer of common stock may be made under such plan during the restricted period. |
Morgan Stanley & Co. LLC and Deutsche Bank Securities Inc., in their sole discretion, may release the common stock and other securities subject to the lock-up agreements described above in whole or in part at any time with or without notice, provided that notice shall be provided as required by applicable law, rule or regulation.
In order to facilitate the offering of the common stock, the underwriters may engage in transactions that stabilize, maintain or otherwise affect the price of the common stock. Specifically, the underwriters may sell more shares than they are obligated to purchase under the underwriting agreement, creating a short position. A short sale is covered if the short position is no greater than the number of shares available for purchase by the underwriters under the over-allotment option. The underwriters can close out a covered short sale by exercising the over-allotment option or purchasing shares in the open market. In determining the source of shares to close out a covered short sale, the underwriters will consider, among other things, the open market price of shares compared to the price available under the over-allotment option. The underwriters may also sell shares in excess of the over-allotment option, creating a naked short position. The underwriters must close out any naked short position by purchasing shares in the open market. A naked short position is more likely to be created if the underwriters are concerned that there may be downward pressure on the price of the common stock in the open market after pricing that could adversely affect investors who purchase in this offering. As an additional means of facilitating this offering, the underwriters may bid for, and purchase, shares of common stock in the open market to stabilize the price of the common stock. The underwriters may also impose a penalty bid. This occurs when a particular underwriter repays to the underwriters a portion of the underwriting discount received by it because the representatives have repurchased shares sold by or for the account of such underwriter in stabilizing or short covering transactions.
These activities may raise or maintain the market price of the common stock above independent market levels or prevent or retard a decline in the market price of the common stock. The underwriters are not required to engage in these activities and may end any of these activities at any time.
We, the selling stockholders and the several underwriters have agreed to indemnify each other against certain liabilities, including liabilities under the Securities Act.
A prospectus in electronic format may be made available on websites maintained by one or more underwriters participating in this offering. The representatives may agree to allocate a number of shares of common stock to underwriters for sale to their online brokerage account holders. Internet distributions will be allocated by the representatives to underwriters that may make Internet distributions on the same basis as other allocations.
148
Table of Contents
The underwriters and their respective affiliates are full service financial institutions engaged in various activities, which may include securities trading, commercial and investment banking, financial advisory, investment management, investment research, principal investment, hedging. financing and brokerage activities. Certain of the underwriters and their respective affiliates may in the future perform various financial advisory and investment banking services for us, for which they will receive customary fees and expenses.
In addition, in the ordinary course of their various business activities, the underwriters and their respective affiliates may make or hold a broad array of investments and actively trade debt and equity securities (or related derivative securities) and financial instruments (including bank loans) for their own account and for the accounts of their customers and may at any time hold long and short positions in such securities and instruments. Such investment and securities activities may involve our securities and instruments. The underwriters and their respective affiliates may also make investment recommendations or publish or express independent research views in respect of such securities or instruments and may at any time hold, or recommend to clients that they acquire, long or short positions in such securities and instruments.
Pricing of the Offering
Prior to this offering, there has been no public market for our common stock. The initial public offering price was determined by negotiations between us and the representatives. Among the factors considered in determining the initial public offering price were our future prospects and those of our industry in general, our sales, earnings and certain other financial and operating information in recent periods, and the price-earnings ratios, price-sales ratios, market prices of securities, and certain financial and operating information of companies engaged in activities similar to ours.
Selling Restrictions
European Economic Area
In relation to each Member State of the European Economic Area which has implemented the Prospectus Directive (each, a Relevant Member State) an offer to the public of any shares of our common stock may not be made in that Relevant Member State, except that an offer to the public in that Relevant Member State of any shares of our common stock may be made at any time under the following exemptions under the Prospectus Directive, if they have been implemented in that Relevant Member State:
| (a) | to any legal entity which is a qualified investor as defined in the Prospectus Directive; |
| (b) | to fewer than 100 or, if the Relevant Member State has implemented the relevant provision of the 2010 PD Amending Directive, 150, natural or legal persons (other than qualified investors as defined in the Prospectus Directive), as permitted under the Prospectus Directive, subject to obtaining the prior consent of the representatives for any such offer; or |
| (c) | in any other circumstances falling within Article 3(2) of the Prospectus Directive, provided that no such offer of shares of our common stock shall result in a requirement for the publication by us or any underwriter of a prospectus pursuant to Article 3 of the Prospectus Directive. |
For the purposes of this provision, the expression an “offer to the public” in relation to any shares of our common stock in any Relevant Member State means the communication in any form and by any means of sufficient information on the terms of the offer and any shares of our common stock to be offered so as to enable an investor to decide to purchase any shares of our common stock, as the same may be varied in that Member State by any measure implementing the Prospectus Directive in that Member State, the expression “Prospectus Directive” means Directive 2003/71/EC (and amendments thereto, including the 2010 PD Amending Directive, to the extent implemented in the Relevant Member State), and includes any relevant implementing measure in the Relevant Member State, and the expression “2010 PD Amending Directive” means Directive 2010/73/EU.
149
Table of Contents
United Kingdom
Each underwriter has represented and agreed that:
| (a) | it has only communicated or caused to be communicated and will only communicate or cause to be communicated an invitation or inducement to engage in investment activity (within the meaning of Section 21 of the Financial Services and Markets Act 2000 (FSMA) received by it in connection with the issue or sale of the shares of our common stock in circumstances in which Section 21(1) of the FSMA does not apply to us; and |
| (b) | it has complied and will comply with all applicable provisions of the FSMA with respect to anything done by it in relation to the shares of our common stock in, from or otherwise involving the United Kingdom. |
Hong Kong
The shares may not be offered or sold by means of any document other than (i) in circumstances which do not constitute an offer to the public within the meaning of the Companies Ordinance (Cap.32, Laws of Hong Kong), (ii) to “professional investors” within the meaning of the Securities and Futures Ordinance (Cap.571, Laws of Hong Kong) and any rules made thereunder, or (iii) in other circumstances which do not result in the document being a “prospectus” within the meaning of the Companies Ordinance (Cap.32, Laws of Hong Kong), and no advertisement, invitation, or document relating to the shares may be issued or may be in the possession of any person for the purpose of issue (in each case whether in Hong Kong or elsewhere), which is directed at, or the contents of which are likely to be accessed or read by, the public in Hong Kong (except if permitted to do so under the laws of Hong Kong) other than with respect to shares which are or are intended to be disposed of only to persons outside Hong Kong or only to “professional investors” within the meaning of the Securities and Futures Ordinance (Cap. 571, Laws of Hong Kong) and any rules made thereunder.
Singapore
This prospectus has not been registered as a prospectus with the Monetary Authority of Singapore. Accordingly, this prospectus and any other document or material in connection with the offer or sale, or invitation for subscription or purchase, of the shares may not be circulated or distributed, nor may the shares be offered or sold, or be made the subject of an invitation for subscription or purchase, whether directly or indirectly, to persons in Singapore other than (i) to an institutional investor under Section 274 of the Securities and Futures Act, Chapter 289 of Singapore (SFA), (ii) to a relevant person, or any person pursuant to Section 275(1A), and in accordance with the conditions, specified in Section 275 of the SFA, or (iii) otherwise pursuant to, and in accordance with the conditions of, any other applicable provision of the SFA.
Where the shares are subscribed or purchased under Section 275 by a relevant person which is: (a) a corporation (which is not an accredited investor) the sole business of which is to hold investments and the entire share capital of which is owned by one or more individuals, each of whom is an accredited investor; or (b) a trust (where the trustee is not an accredited investor) whose sole purpose is to hold investments and each beneficiary is an accredited investor, shares, debentures and units of shares, and debentures of that corporation, or the beneficiaries’ rights and interest in that trust shall not be transferable for six months after that corporation or that trust has acquired the shares under Section 275 except: (1) to an institutional investor under Section 274 of the SFA or to a relevant person, or any person pursuant to Section 275(1A), and in accordance with the conditions, specified in Section 275 of the SFA; (2) where no consideration is given for the transfer; or (3) by operation of law.
Japan
The securities have not been and will not be registered under the Financial Instruments and Exchange Law of Japan (the Financial Instruments and Exchange Law) and each underwriter has agreed that it will not offer or
150
Table of Contents
sell any securities, directly or indirectly, in Japan or to, or for the benefit of, any resident of Japan (which term as used herein means any person resident in Japan, including any corporation or other entity organized under the laws of Japan), or to others for re-offering or resale, directly or indirectly, in Japan or to a resident of Japan, except pursuant to an exemption from the registration requirements of, and otherwise in compliance with, the Financial Instruments and Exchange Law and any other applicable laws, regulations and ministerial guidelines of Japan.
Notice to Prospective Investors in Switzerland
The shares may not be publicly offered in Switzerland and will not be listed on the SIX Swiss Exchange (SIX) or on any other stock exchange or regulated trading facility in Switzerland. This document has been prepared without regard to the disclosure standards for issuance prospectuses under art. 652a or art. 1156 of the Swiss Code of Obligations or the disclosure standards for listing prospectuses under art. 27 ff. of the SIX Listing Rules or the listing rules of any other stock exchange or regulated trading facility in Switzerland. Neither this document nor any other offering or marketing material relating to the shares or the offering may be publicly distributed or otherwise made publicly available in Switzerland.
Neither this document nor any other offering or marketing material relating to the offering, the Company, the shares have been or will be filed with or approved by any Swiss regulatory authority. In particular, this document will not be filed with, and the offer of shares will not be supervised by, the Swiss Financial Market Supervisory Authority FINMA (FINMA), and the offer of shares has not been and will not be authorized under the Swiss Federal Act on Collective Investment Schemes (CISA). The investor protection afforded to acquirers of interests in collective investment schemes under the CISA does not extend to acquirers of shares.
Notice to Prospective Investors in the Dubai International Financial Centre
This prospectus relates to an Exempt Offer in accordance with the Offered Securities Rules of the Dubai Financial Services Authority (DFSA). This prospectus is intended for distribution only to persons of a type specified in the Offered Securities Rules of the DFSA. It must not be delivered to, or relied on by, any other person. The DFSA has no responsibility for reviewing or verifying any documents in connection with Exempt Offers. The DFSA has not approved this prospectus nor taken steps to verify the information set forth herein and has no responsibility for the prospectus. The shares to which this prospectus relates may be illiquid and/or subject to restrictions on their resale. Prospective purchasers of the shares offered should conduct their own due diligence on the shares. If you do not understand the contents of this prospectus you should consult an authorized financial advisor.
Notice to Prospective Investors in Australia
No placement document, prospectus, product disclosure statement or other disclosure document has been lodged with the Australian Securities and Investments Commission (ASIC), in relation to the offering. This prospectus does not constitute a prospectus, product disclosure statement or other disclosure document under the Corporations Act 2001 (Corporations Act), and does not purport to include the information required for a prospectus, product disclosure statement or other disclosure document under the Corporations Act.
Any offer in Australia of the shares may only be made to persons (Exempt Investors) who are “sophisticated investors” (within the meaning of section 708(8) of the Corporations Act), “professional investors” (within the meaning of section 708(11) of the Corporations Act) or otherwise pursuant to one or more exemptions contained in section 708 of the Corporations Act so that it is lawful to offer the shares without disclosure to investors under Chapter 6D of the Corporations Act.
The shares applied for by Exempt Investors in Australia must not be offered for sale in Australia in the period of 12 months after the date of allotment under the offering, except in circumstances where disclosure to
151
Table of Contents
investors under Chapter 6D of the Corporations Act would not be required pursuant to an exemption under section 708 of the Corporations Act or otherwise or where the offer is pursuant to a disclosure document which complies with Chapter 6D of the Corporations Act. Any person acquiring shares must observe such Australian on-sale restrictions.
This prospectus contains general information only and does not take account of the investment objectives, financial situation or particular needs of any particular person. It does not contain any securities recommendations or financial product advice. Before making an investment decision, investors need to consider whether the information in this prospectus is appropriate to their needs, objectives and circumstances, and, if necessary, seek expert advice on those matters.
152
Table of Contents
The validity of the shares of common stock being offered by this prospectus will be passed upon for us by Cooley LLP, Palo Alto, California. Pillsbury Winthrop Shaw Pittman LLP, Palo Alto, California, is acting as counsel to the underwriters in connection with certain legal matters relating to the shares of common stock offered by the prospectus.
The consolidated financial statements as of December 31, 2013 and 2014, and for each of the three years in the period ended December 31, 2014, included in this prospectus, have been audited by Deloitte & Touche LLP, an independent registered public accounting firm, as stated in their report appearing herein. Such consolidated financial statements have been so included in reliance upon the report of such firm given upon their authority as experts in accounting and auditing.
WHERE YOU CAN FIND ADDITIONAL INFORMATION
We have filed with the SEC a registration statement on Form S-1, including exhibits and schedules, under the Securities Act, with respect to the shares of common stock being offered by this prospectus. This prospectus, which constitutes part of the registration statement, does not contain all of the information in the registration statement and its exhibits. For further information with respect to us and the common stock offered by this prospectus, we refer you to the registration statement and its exhibits. Statements contained in this prospectus as to the contents of any contract or any other document referred to are not necessarily complete, and in each instance, we refer you to the copy of the contract or other document filed as an exhibit to the registration statement. Each of these statements is qualified in all respects by this reference.
You can read our SEC filings, including the registration statement, over the Internet at the SEC’s website at www.sec.gov. You may also read and copy any document we file with the SEC at its public reference facilities at 100 F Street, NE, Washington, D.C. 20549. You may also obtain copies of these documents at prescribed rates by writing to the Public Reference Section of the SEC at 100 F Street, NE, Washington, D.C. 20549. Please call the SEC at 1-800-SEC-0330 for further information on the operation of the public reference facilities. You may also request a copy of these filings, at no cost, by writing us at 2585 Augustine Drive, Suite 100, Santa Clara, California 95054.
Upon the completion of this offering, we will be subject to the information reporting requirements of the Securities Exchange Act of 1934 and we will file reports, proxy statements and other information with the SEC. These reports, proxy statements and other information will be available for inspection and copying at the public reference room and web site of the SEC referred to above. We also maintain a website at www.easic.com, at which, following the completion of this offering, you may access these materials free of charge as soon as reasonably practicable after they are electronically filed with, or furnished to, the SEC. Information contained on or accessible through our website is not a part of this prospectus, and the inclusion of our website address in this prospectus is an inactive textual reference only.
153
Table of Contents
eASIC CORPORATION
INDEX TO CONSOLIDATED FINANCIAL STATEMENTS
| Page | ||||
| F-2 | ||||
| F-3 | ||||
| F-4 | ||||
| Consolidated Statements of Preferred Stock and Stockholders’ Deficit |
F-5 | |||
| F-7 | ||||
| F-8 | ||||
F-1
Table of Contents
REPORT OF INDEPENDENT REGISTERED PUBLIC ACCOUNTING FIRM
The Board of Directors and Stockholders:
eASIC Corporation
Santa Clara, California
We have audited the accompanying consolidated balance sheets of eASIC Corporation and its subsidiaries (the “Company”) as of December 31, 2013 and 2014, and the related consolidated statements of operations, preferred stock and stockholders’ deficit and cash flows for each of the three years in the period ended December 31, 2014. These consolidated financial statements are the responsibility of the Company’s management. Our responsibility is to express an opinion on these financial statements based on our audits.
We conducted our audits in accordance with the standards of the Public Company Accounting Oversight Board (United States). Those standards require that we plan and perform the audit to obtain reasonable assurance about whether the financial statements are free of material misstatement. The Company is not required to have, nor were we engaged to perform an audit of its internal control over financial reporting. Our audits included consideration of internal control over financial reporting as a basis for designing audit procedures that are appropriate in the circumstances, but not for the purpose of expressing an opinion on the effectiveness of the Company’s internal control over financial reporting. Accordingly, we express no such opinion. An audit also includes examining, on a test basis, evidence supporting the amounts and disclosures in the financial statements, assessing the accounting principles used and significant estimates made by management, and evaluating the overall financial statement presentation. We believe that our audits provide a reasonable basis for our opinion.
In our opinion, such consolidated financial statements referred to above present fairly, in all material respects, the consolidated financial position of eASIC Corporation and subsidiaries as of December 31, 2013 and 2014, and the consolidated results of their operations and their cash flows for each of the three years in the period ended December 31, 2014, in conformity with accounting principles generally accepted in the United States of America.
/s/ DELOITTE & TOUCHE LLP
San Jose, California
February 19, 2015
F-2
Table of Contents
CONSOLIDATED BALANCE SHEETS
(In thousands, except share and per share data)
| As of December 31, | March 31, 2015 |
Pro Forma as of March 31, 2015 |
||||||||||||||
| 2013 | 2014 | |||||||||||||||
| (Unaudited) | ||||||||||||||||
| Assets |
||||||||||||||||
| Current assets: |
||||||||||||||||
| Cash and cash equivalents |
$ | 7,423 | $ | 8,790 | $ | 9,222 | ||||||||||
| Accounts receivable, net of allowance for doubtful accounts |
6,762 | 13,871 | 13,322 | |||||||||||||
| Inventories, net |
6,795 | 11,267 | 7,279 | |||||||||||||
| Prepaid expenses and other current assets |
1,033 | 827 | 1,064 | |||||||||||||
|
|
|
|
|
|
|
|||||||||||
| Total current assets |
22,013 | 34,755 | 30,887 | |||||||||||||
| Property and equipment, net |
2,356 | 6,600 | 6,397 | |||||||||||||
| Other assets |
543 | 1,763 | 3,895 | |||||||||||||
|
|
|
|
|
|
|
|||||||||||
| Total assets |
$ | 24,912 | $ | 43,118 | $ | 41,179 | ||||||||||
|
|
|
|
|
|
|
|||||||||||
| Liabilities, preferred stock and stockholders’ deficit |
||||||||||||||||
| Current liabilities: |
||||||||||||||||
| Accounts payable |
$ | 3,683 | $ | 9,808 | $ | 6,585 | ||||||||||
| Term loans, current portion |
— | 818 | 1,792 | |||||||||||||
| Accrued expenses and other current liabilities |
1,835 | 4,178 | 4,426 | |||||||||||||
| Deferred revenues |
1,152 | 321 | 374 | |||||||||||||
|
|
|
|
|
|
|
|||||||||||
| Total current liabilities |
6,670 | 15,125 | 13,177 | |||||||||||||
| Convertible preferred stock warrant liabilities |
271 | 1,203 | 1,042 | $ | — | |||||||||||
| Revolving line of credit |
4,950 | 7,950 | 7,950 | |||||||||||||
| Term loans, non-current portion |
5,798 | 7,999 | 7,074 | |||||||||||||
| Vendor financing arrangement |
1,381 | 1,280 | 1,302 | |||||||||||||
| Income taxes payable |
— | 3,081 | 3,079 | |||||||||||||
| Other non-current liabilities |
64 | 289 | 243 | |||||||||||||
|
|
|
|
|
|
|
|
|
|||||||||
| Total liabilities |
19,134 | 36,927 | 33,867 | 32,825 | ||||||||||||
|
|
|
|
|
|
|
|
|
|||||||||
| Commitments and contingencies (Note 5) |
||||||||||||||||
| Preferred stock: |
||||||||||||||||
| Convertible and non-convertible preferred stock, par value of $0.001 per share; 490,000,000 shares authorized as of December 31, 2013 and 2014 and March 31, 2015 (unaudited); 5,065,963 shares issued and outstanding with liquidation preference of $63,533 as of December 31, 2013 and 2014 and March 31, 2015 (unaudited), actual; no shares issued and outstanding, pro forma |
41,286 | 41,286 | 41,286 | — | ||||||||||||
|
|
|
|
|
|
|
|||||||||||
| Total preferred stock |
41,286 | 41,286 | 41,286 | — | ||||||||||||
|
|
|
|
|
|
|
|||||||||||
| Stockholders’ equity (deficit): |
||||||||||||||||
| Common stock, par value of $0.001 per share; 1,575,000,000 shares authorized as of December 31, 2013 and 2014 and March 31, 2015 (unaudited); 9,454,962 and 9,868,802 and 9,909,735 shares issued and outstanding as of December 31, 2013 and 2014 and March 31, 2015 (unaudited) actual; and 15,055,418 shares issued and outstanding, pro forma (unaudited) |
9,765 | 11,325 | 11,740 | 54,068 | ||||||||||||
| Accumulated deficit |
(45,273 | ) | (46,420 | ) | (45,714 | ) | (45,714 | ) | ||||||||
|
|
|
|
|
|
|
|
|
|||||||||
| Total stockholders’ equity (deficit) |
(35,508 | ) | (35,095 | ) | (33,974 | ) | $ | 8,354 | ||||||||
|
|
|
|
|
|
|
|
|
|||||||||
| Total liabilities, preferred stock and stockholders’ equity (deficit) |
$ | 24,912 | $ | 43,118 | $ | 41,179 | ||||||||||
|
|
|
|
|
|
|
|||||||||||
See notes to consolidated financial statements.
F-3
Table of Contents
CONSOLIDATED STATEMENTS OF OPERATIONS
(In thousands, except share and per share data)
| Year Ended December 31, | Three Months Ended March 31, | |||||||||||||||||||
| 2012 | 2013 | 2014 | 2014 | 2015 | ||||||||||||||||
| (Unaudited) | ||||||||||||||||||||
| Revenues: |
||||||||||||||||||||
| Product |
$ | 11,843 | $ | 26,111 | $ | 65,086 | $ | 12,265 | $ | 19,658 | ||||||||||
| Service |
1,840 | 3,666 | 2,294 | 1,312 | 417 | |||||||||||||||
|
|
|
|
|
|
|
|
|
|
|
|||||||||||
| Total revenues |
13,683 | 29,777 | 67,380 | 13,577 | 20,075 | |||||||||||||||
|
|
|
|
|
|
|
|
|
|
|
|||||||||||
| Cost of revenues: |
||||||||||||||||||||
| Product |
8,707 | 14,968 | 37,366 | 7,040 | 11,178 | |||||||||||||||
| Service |
373 | 748 | 636 | 420 | 190 | |||||||||||||||
|
|
|
|
|
|
|
|
|
|
|
|||||||||||
| Total cost of revenues |
9,080 | 15,716 | 38,002 | 7,460 | 11,368 | |||||||||||||||
|
|
|
|
|
|
|
|
|
|
|
|||||||||||
| Gross profit |
4,603 | 14,061 | 29,378 | 6,117 | 8,707 | |||||||||||||||
|
|
|
|
|
|
|
|
|
|
|
|||||||||||
| Operating expenses: |
||||||||||||||||||||
| Research and development |
11,898 | 13,026 | 13,870 | 3,038 | 3,701 | |||||||||||||||
| Sales and marketing |
4,494 | 4,834 | 5,711 | 1,183 | 1,331 | |||||||||||||||
| General and administrative |
2,543 | 3,076 | 5,449 | 746 | 2,491 | |||||||||||||||
|
|
|
|
|
|
|
|
|
|
|
|||||||||||
| Total operating expenses |
18,935 | 20,936 | 25,030 | 4,967 | 7,523 | |||||||||||||||
|
|
|
|
|
|
|
|
|
|
|
|||||||||||
| Income (loss) from operations |
(14,332 | ) | (6,875 | ) | 4,348 | 1,150 | 1,184 | |||||||||||||
| Interest expense |
(1,042 | ) | (935 | ) | (1,443 | ) | (301 | ) | (445 | ) | ||||||||||
| Other income (expense), net |
72 | 12 | (836 | ) | (88 | ) | (38 | ) | ||||||||||||
|
|
|
|
|
|
|
|
|
|
|
|||||||||||
| Income (loss) before income taxes |
(15,302 | ) | (7,798 | ) | 2,069 | 761 | 701 | |||||||||||||
| Benefit from (provision for) income taxes |
(57 | ) | (44 | ) | (3,216 | ) | (360 | ) | 5 | |||||||||||
|
|
|
|
|
|
|
|
|
|
|
|||||||||||
| Net income (loss) |
(15,359 | ) | (7,842 | ) | (1,147 | ) | $ | 401 | $ | 706 | ||||||||||
| Add/(Less): Capital contribution from/(deemed dividend to) common stockholders |
83,386 | (338 | ) | — | — | — | ||||||||||||||
| Less: Undistributed earnings allocated to preferred stockholders |
— | — | — | (401 | ) | (706 | ) | |||||||||||||
|
|
|
|
|
|
|
|
|
|
|
|||||||||||
| Net income (loss) attributable to common stockholders |
$ | 68,027 | $ | (8,180 | ) | $ | (1,147 | ) | $ | — | $ | — | ||||||||
|
|
|
|
|
|
|
|
|
|
|
|||||||||||
| Net income (loss) per share attributable to common stockholders: |
||||||||||||||||||||
| Basic |
$ | 213.75 | $ | (0.90 | ) | $ | (0.12 | ) | $ | 0.00 | $ | 0.00 | ||||||||
|
|
|
|
|
|
|
|
|
|
|
|||||||||||
| Diluted |
$ | (4.06 | ) | $ | (0.90 | ) | $ | (0.12 | ) | $ | 0.00 | $ | 0.00 | |||||||
|
|
|
|
|
|
|
|
|
|
|
|||||||||||
| Weighted-average common shares used in computing net income (loss) per share attributable to common stockholders: |
||||||||||||||||||||
| Basic |
318,249 | 9,066,797 | 9,518,377 | 9,436,046 | 9,682,424 | |||||||||||||||
|
|
|
|
|
|
|
|
|
|
|
|||||||||||
| Diluted |
3,786,303 | 9,066,797 | 9,518,377 | 9,436,046 | 9,682,424 | |||||||||||||||
|
|
|
|
|
|
|
|
|
|
|
|||||||||||
| Pro forma net income (loss) attributable to common stockholders (unaudited) |
$ | (364 | ) | $ | 545 | |||||||||||||||
|
|
|
|
|
|||||||||||||||||
| Pro forma net income (loss) per share attributable to common stockholders (unaudited): |
||||||||||||||||||||
| Basic |
$ | (0.02 | ) | $ | 0.04 | |||||||||||||||
|
|
|
|
|
|||||||||||||||||
| Diluted |
$ | (0.02 | ) | $ | 0.03 | |||||||||||||||
|
|
|
|
|
|||||||||||||||||
| Pro forma weighted-average common shares used in computing net income (loss) per share attributable to common stockholders (unaudited): |
||||||||||||||||||||
| Basic |
14,664,060 | 14,828,107 | ||||||||||||||||||
|
|
|
|
|
|||||||||||||||||
| Diluted |
14,664,060 | 17,828,111 | ||||||||||||||||||
|
|
|
|
|
|||||||||||||||||
See notes to consolidated financial statements.
F-4
Table of Contents
CONSOLIDATED STATEMENTS OF PREFERRED STOCK AND STOCKHOLDERS’ DEFICIT
(In thousands, except share data)
| Convertible and non-convertible preferred stock | Stockholders’ deficit | |||||||||||||||||||||||||||||||||||||||||||||||
| Convertible preferred stock (Series A - H) |
Non-convertible preferred stock (Series A-1) |
Convertible preferred stock (Series A-2) |
Convertible preferred stock (Series A - H) |
Common stock | Accumulated deficit |
Total | ||||||||||||||||||||||||||||||||||||||||||
| Shares | Amount | Shares | Amount | Shares | Amount | Shares | Amount | Shares | Amount | Amount | Amount | |||||||||||||||||||||||||||||||||||||
| Balances, January 1, 2012 |
3,076,113 | $ | 109,953 | — | $ | — | — | $ | — | — | $ | — | 129,136 | $ | 1,933 | $ | (107,685 | ) | $ | (105,752 | ) | |||||||||||||||||||||||||||
| Extinguishment and reclassification of convertible preferred stock into equity upon elimination of the liquidation preference for Series A, B, C, D, E, F, F-1, G and H convertible preferred stock |
(3,076,113 | ) | (109,953 | ) | — | — | — | — | 3,076,113 | 26,567 | — | — | 83,386 | 109,953 | ||||||||||||||||||||||||||||||||||
| Issuance of Series A-1 and A-2 preferred stock and common stock for cash of $2.3 million and notes of $4 million, and conversion of Series C, D, E, F, F-1, G and H preferred stock to common stock, net of issuance costs of $0.2 million |
— | — | 337,177 | 15,036 | 1,217,597 | 4,024 | (429,997 | ) | (15,569 | ) | 4,173,696 | 2,768 | — | (12,801 | ) | |||||||||||||||||||||||||||||||||
| Series A preferred stock surrendered |
— | — | — | — | — | — | (1,481 | ) | (11 | ) | — | 11 | — | — | ||||||||||||||||||||||||||||||||||
| Options exercised |
— | — | — | — | — | — | — | — | 10,635 | 24 | — | 24 | ||||||||||||||||||||||||||||||||||||
| Stock-based compensation |
— | — | — | — | — | — | — | — | — | 141 | — | 141 | ||||||||||||||||||||||||||||||||||||
| Net loss |
— | — | — | — | — | — | — | — | — | — | (15,359 | ) | (15,359 | ) | ||||||||||||||||||||||||||||||||||
|
|
|
|
|
|
|
|
|
|
|
|
|
|
|
|
|
|
|
|
|
|
|
|
|
|||||||||||||||||||||||||
| Balances, December 31, 2012 |
— | — | 337,177 | 15,036 | 1,217,597 | 4,024 | 2,644,635 | 10,987 | 4,313,467 | 4,877 | (39,658 | ) | (23,794 | ) | ||||||||||||||||||||||||||||||||||
| Issuance of Series A-1 and A-2 preferred stock and common stock, net of issuance costs of $0.1 million, and conversion of Series C, D, E, F, F-1, G and H preferred stock to common stock |
— | — | 196,124 | 8,779 | 708,315 | 2,349 | (287,990 | ) | (5,800 | ) | 2,443,794 | (937 | ) | — | (6,737 | ) | ||||||||||||||||||||||||||||||||
| Expiration of exchange purchase options and conversion of Series C, D, E, F, F-1, G and H preferred stock to common stock |
— | — | — | — | — | — | (2,356,645 | ) | (5,187 | ) | 2,652,620 | 5,187 | — | — | ||||||||||||||||||||||||||||||||||
F-5
Table of Contents
| Convertible and non-convertible preferred stock | Stockholders’ deficit | |||||||||||||||||||||||||||||||||||||||||||||||
| Convertible preferred stock (Series A - H) |
Non-convertible preferred stock (Series A-1) |
Convertible preferred stock (Series A-2) |
Convertible preferred stock (Series A - H) |
Common stock | Accumulated deficit |
Total | ||||||||||||||||||||||||||||||||||||||||||
| Shares | Amount | Shares | Amount | Shares | Amount | Shares | Amount | Shares | Amount | Amount | Amount | |||||||||||||||||||||||||||||||||||||
| Reclassification in connection with conversion of warrants for preferred stock into warrants for common stock |
— | — | — | — | — | — | — | — | — | 4 | — | 4 | ||||||||||||||||||||||||||||||||||||
| Issuance of Series A-2 preferred stock, net of issuance costs of $0.1 million |
— | — | — | — | 390,344 | 1,202 | — | — | — | — | 727 | 727 | ||||||||||||||||||||||||||||||||||||
| Modification of rights of outstanding Series A-1 and A-2 preferred stock |
— | — | — | (6,032 | ) | — | 5,281 | — | — | — | — | 751 | 751 | |||||||||||||||||||||||||||||||||||
| Issuance of Series A-2 preferred stock, net of issuance costs of $0.04 million |
— | — | — | — | 1,925,947 | 9,246 | — | — | — | — | 642 | 642 | ||||||||||||||||||||||||||||||||||||
| Issuance of Series A-2 preferred stock on conversion of convertible notes plus accrued interest |
— | — | — | — | 290,459 | 1,401 | — | — | — | — | 107 | 107 | ||||||||||||||||||||||||||||||||||||
| Options exercised |
— | — | — | — | — | — | — | — | 45,081 | 77 | — | 77 | ||||||||||||||||||||||||||||||||||||
| Stock-based compensation |
— | — | — | — | — | — | — | — | — | 557 | — | 557 | ||||||||||||||||||||||||||||||||||||
| Net loss |
— | — | — | — | — | — | — | — | — | — | (7,842 | ) | (7,842 | ) | ||||||||||||||||||||||||||||||||||
|
|
|
|
|
|
|
|
|
|
|
|
|
|
|
|
|
|
|
|
|
|
|
|
|
|||||||||||||||||||||||||
| Balances, December 31, 2013 |
— | — | 533,301 | 17,783 | 4,532,662 | 23,503 | — | — | 9,454,962 | 9,765 | (45,273 | ) | (35,508 | ) | ||||||||||||||||||||||||||||||||||
| Options exercised |
— | — | — | — | — | — | — | — | 451,779 | 193 | — | 193 | ||||||||||||||||||||||||||||||||||||
| Cancellation of founder shares in connection with non payment of notes |
— | — | — | — | — | — | — | — | (37,939 | ) | — | — | — | |||||||||||||||||||||||||||||||||||
| Vesting of early exercised stock options |
— | — | — | — | — | — | — | — | — | 33 | — | 33 | ||||||||||||||||||||||||||||||||||||
| Stock-based compensation |
— | — | — | — | — | — | — | — | — | 1,334 | — | 1,334 | ||||||||||||||||||||||||||||||||||||
| Net loss |
— | — | — | — | — | — | — | — | — | — | (1,147 | ) | (1,147 | ) | ||||||||||||||||||||||||||||||||||
|
|
|
|
|
|
|
|
|
|
|
|
|
|
|
|
|
|
|
|
|
|
|
|
|
|||||||||||||||||||||||||
| Balances,December 31, 2014 |
— | $ | — | 533,301 | $ | 17,783 | 4,532,662 | $ | 23,503 | — | $ | — | 9,868,802 | $ | 11,325 | $ | (46,420 | ) | $ | (35,095 | ) | |||||||||||||||||||||||||||
| Options exercised and shares issued (unaudited) |
— | — | — | — | — | — | — | — | 40,933 | 38 | — | 38 | ||||||||||||||||||||||||||||||||||||
| Vesting of early exercised stock options (unaudited) |
— | — | — | — | 29 | — | 29 | |||||||||||||||||||||||||||||||||||||||||
| Stock-based compensation (unaudited) |
— | — | — | — | — | — | — | — | — | 348 | — | 348 | ||||||||||||||||||||||||||||||||||||
| Net income (unaudited) |
— | — | — | — | — | — | — | — | — | — | 706 | 706 | ||||||||||||||||||||||||||||||||||||
|
|
|
|
|
|
|
|
|
|
|
|
|
|
|
|
|
|
|
|
|
|
|
|
|
|||||||||||||||||||||||||
| Balances, March 31, 2015 (unaudited) |
— | $ | — | 533,301 | $ | 17,783 | 4,532,662 | $ | 23,503 | — | $ | — | 9,909,735 | $ | 11,740 | $ | (45,714 | ) | $ | (33,974 | ) | |||||||||||||||||||||||||||
|
|
|
|
|
|
|
|
|
|
|
|
|
|
|
|
|
|
|
|
|
|
|
|
|
|||||||||||||||||||||||||
See notes to consolidated financial statements.
F-6
Table of Contents
CONSOLIDATED STATEMENTS OF CASH FLOWS
(In thousands)
| Year Ended December 31, | Three Months Ended March 31, |
|||||||||||||||||||
| 2012 | 2013 | 2014 | 2014 | 2015 | ||||||||||||||||
| Cash flows from operating activities: |
(Unaudited) | |||||||||||||||||||
| Net income (loss) |
$ | (15,359 | ) | $ | (7,842 | ) | $ | (1,147 | ) | $ | 401 | $ | 706 | |||||||
| Adjustments to reconcile net income (loss) to net cash provided by (used in) operating activities: |
||||||||||||||||||||
| Stock-based compensation |
243 | 1,319 | 1,334 | 86 | 348 | |||||||||||||||
| Depreciation and amortization |
480 | 546 | 907 | 149 | 427 | |||||||||||||||
| Amortization of debt discount |
235 | 273 | 309 | 66 | 86 | |||||||||||||||
| Change in fair value of preferred stock warrant liability |
(127 | ) | (34 | ) | 783 | 41 | (161 | ) | ||||||||||||
| Loss on disposal of property and equipment |
126 | 224 | 522 | 31 | 98 | |||||||||||||||
| Other non-cash operating activity |
— | 303 | — | — | — | |||||||||||||||
| Changes in operating assets and liabilities: |
||||||||||||||||||||
| Accounts receivable, net |
(112 | ) | (3,450 | ) | (7,109 | ) | (1,369 | ) | 549 | |||||||||||
| Inventories, net |
1,450 | (5,450 | ) | (4,472 | ) | 320 | 3,988 | |||||||||||||
| Prepaid expenses and other current assets |
(21 | ) | 309 | 165 | 282 | (245 | ) | |||||||||||||
| Other assets |
17 | (43 | ) | 10 | 9 | 601 | ||||||||||||||
| Accounts payable |
1,336 | 997 | 5,391 | 708 | (4,355 | ) | ||||||||||||||
| Accrued expenses and other current liabilities |
296 | (88 | ) | 1,683 | 139 | (629 | ) | |||||||||||||
| Deferred revenues |
1,032 | (529 | ) | (831 | ) | (930 | ) | 53 | ||||||||||||
| Non-current income taxes payable |
— | — | 3,081 | — | (3 | ) | ||||||||||||||
| Other non-current liabilities |
(38 | ) | (13 | ) | (84 | ) | (7 | ) | (2 | ) | ||||||||||
|
|
|
|
|
|
|
|
|
|
|
|||||||||||
| Net cash provided by (used in) operating activities |
(10,442 | ) | (13,478 | ) | 542 |
|
(74 |
) |
|
1,461 |
| |||||||||
|
|
|
|
|
|
|
|
|
|
|
|||||||||||
| Cash flows from investing activities: |
||||||||||||||||||||
| Purchases of property and equipment |
(524 | ) | (2,129 | ) | (5,316 | ) |
|
(1,778 |
) |
|
(361 |
) | ||||||||
| Purchases of other assets |
— | — | (101 | ) | — | — | ||||||||||||||
|
|
|
|
|
|
|
|
|
|
|
|||||||||||
| Net cash used in investing activities |
(524 | ) | (2,129 | ) | (5,417 | ) | (1,778 | ) | (361 | ) | ||||||||||
|
|
|
|
|
|
|
|
|
|
|
|||||||||||
| Cash flows from financing activities: |
||||||||||||||||||||
| Payments on capital lease obligations |
— | — | (41 | ) |
|
— |
|
|
(41 |
) | ||||||||||
| Payments on vendor financing arrangement |
(106 | ) | (446 | ) | (191 | ) | (76 | ) | — | |||||||||||
| Proceeds from term loans and revolving line of credit |
5,025 | 21,728 | 5,975 |
|
— |
|
|
— |
| |||||||||||
| Repayments of term loans and revolving line of credit |
(7,892 | ) | (18,140 | ) | — | — | — | |||||||||||||
| Proceeds from issuance of bridge notes |
4,069 | 1,500 | — | — | — | |||||||||||||||
| Net proceeds from issuance of stock |
2,108 | 15,508 | — | — | — | |||||||||||||||
| Proceeds from exercise of stock options |
24 | 77 | 547 | 5 | 38 | |||||||||||||||
| Payment of initial public offering costs |
— | — | (48 | ) | — | (665 | ) | |||||||||||||
|
|
|
|
|
|
|
|
|
|
|
|||||||||||
| Net cash provided by (used in) financing activities |
3,228 | 20,227 | 6,242 | (71 | ) | (668 | ) | |||||||||||||
|
|
|
|
|
|
|
|
|
|
|
|||||||||||
| Net increase (decrease) in cash and cash equivalents |
(7,738 | ) | 4,620 | 1,367 | (1,923 | ) | 432 | |||||||||||||
| Cash and cash equivalents, beginning of period |
10,541 | 2,803 | 7,423 | 7,423 | 8,790 | |||||||||||||||
|
|
|
|
|
|
|
|
|
|
|
|||||||||||
| Cash and cash equivalents, end of period |
$ | 2,803 | $ | 7,423 | $ | 8,790 | $ | 5,500 | $ | 9,222 | ||||||||||
|
|
|
|
|
|
|
|
|
|
|
|||||||||||
| Supplemental disclosures of cash flow information: |
||||||||||||||||||||
| Cash paid during the period for interest |
$ | 643 | $ | 547 | $ | 1,103 | $ | 233 | $ | 360 | ||||||||||
| Cash paid during the period for income taxes |
$ | 56 | $ | 49 | $ | 71 |
$ |
14 |
|
$ |
100 |
| ||||||||
| Supplemental disclosures of cash flows from investing and financing activities: |
||||||||||||||||||||
| Property and equipment acquired included in accounts payable and accrued liabilities |
$ | 74 | $ | 165 | $ | 108 | $ | 82 | $ | 61 | ||||||||||
| Property and equipment acquired included in capital lease obligations |
$ | — | $ | — | $ | 404 |
$ |
— |
|
$ |
— |
| ||||||||
| Extinguishment and reclassification of convertible preferred stock into equity upon elimination of the liquidation preference for Series A, B, C, D, E, F, F-1, G and H convertible preferred stock |
$ | 83,386 | $ | — | $ | — | $ | — | $ | — | ||||||||||
| Conversion of Series C, D, E, F, F-1, G and H convertible preferred stock to common stock |
$ | 348 | $ | 213 | $ | — |
$ |
— |
|
$ |
— |
| ||||||||
| Series A preferred stock surrendered for no consideration |
$ | 11 | $ | — | $ | — | $ | — | $ | — | ||||||||||
| Exchange of stockholders’ notes payable, including accrued interest, as investment in connection with Series A-2 financing |
$ | 4,050 | $ | 1,500 | $ | — | $ | — | $ | — | ||||||||||
| Expiration of exchange purchase options and conversion of Series C, D, E, F, F-1, G and H convertible preferred stock to common stock |
$ | — | $ | 5,187 | $ | — | $ | — | $ | — | ||||||||||
| Reclassification in connection with conversion of warrants for preferred stock into warrants for common stock |
$ | — | $ | 4 | $ | — | $ | — | $ | — | ||||||||||
| Capital contribution representing the excess of fair value of shares purchased over cash and stockholders’ notes payable exchanged in the Series A-2 financings |
$ | — | $ | 1,476 | $ | — | $ | — | $ | — | ||||||||||
| Modification of rights of outstanding Series A-1 and A-2 preferred stock |
$ | — | $ | 751 | $ | — | $ | — | $ | — | ||||||||||
| Deferred initial public offering costs in accounts payable and accrued liabilities |
$ | — | $ | — | $ | 1,076 | $ | — | $ | 2,080 | ||||||||||
| Issuance of warrants for preferred stock |
$ | — | $ | 235 | $ | 149 | $ | — | $ | — | ||||||||||
See notes to consolidated financial statements.
F-7
Table of Contents
NOTES TO CONSOLIDATED FINANCIAL STATEMENTS
1. Description of business and summary of significant accounting principles
Description of business
eASIC Corporation was incorporated in the state of Delaware on October 28, 1999. The Company has pioneered a differentiated solution that enables the Company to rapidly and cost-effectively deliver custom integrated circuits (ICs), creating value for its customers’ hardware and software systems. The Company’s eASIC solution consists of eASIC platform which incorporates a versatile, pre-defined and re-usable base array and customizable single-mask layer, the easicopy ASICs, standard ASICs and proprietary design tools. The Company is headquartered in California and has offices in Malaysia, Romania, Japan and Bermuda.
Unaudited pro forma consolidated balance sheet
Upon the consummation of an initial public offering of at least $30.0 million in gross proceeds, all of the outstanding shares of convertible preferred stock will automatically convert into shares of common stock. The March 31, 2015 unaudited pro forma consolidated balance sheet data has been prepared assuming the conversion of the convertible preferred stock outstanding into 5,145,683 shares of common stock, the related conversion of 111,505 shares of preferred stock underlying outstanding warrants, which results in the reclassification of the warrant liability to additional paid-in capital, and the termination and cancellation of all 533,301 outstanding shares of the Company’s Series A-1 non-convertible preferred stock.
Reverse stock split
On August 6, 2014 (effective date), the Company effected a 75-to-1 reverse stock split of its common stock and preferred stock (collectively referred to as capital stock). On the effective date of the reverse stock split, (i) each 75 shares of outstanding capital stock was reduced to 1 share of capital stock; (ii) the number of shares of capital stock into which each outstanding warrant or option to purchase capital stock is exercisable was proportionately reduced on a 75-to-1 basis; and (iii) the exercise price of each outstanding warrant or option to purchase capital stock was proportionately increased on a 75-to-1 basis. All of the share and per share amounts have been adjusted, on a retroactive basis, to reflect this 75-to-1 reverse stock split.
Certain significant risks and uncertainties
The Company is an “emerging growth company” as defined in the Jumpstart our Business Startups Act (JOBS Act), has a limited history of profitability, and positive cash flows and is dependent on its existing cash and cash equivalents and debt facilities for liquidity. The Company is also subject to common risks and uncertainties in technology driven markets and those specific to the semiconductor industry.
Basis of presentation and principles of consolidation
Consolidation. The consolidated financial statements include the accounts of eASIC Corporation and its wholly owned subsidiaries. All intercompany balances and transactions have been eliminated in consolidation. In preparing the consolidated financial statements as of December 31, 2014 and for the year then ended, subsequent events were evaluated from the balance sheet date of December 31, 2014 through the audited consolidated financial statements original issuance date of February 19, 2015. For the three months ended March 31, 2015, subsequent events were evaluated through April 21, 2015, the date these interim consolidated financial statements were issued.
Adoption of new or revised accounting standards. The Company is an emerging growth company and can take advantage of an extended transition period for complying with new or revised accounting standards.
F-8
Table of Contents
However, the Company has irrevocably elected not to avail the extended transition period and, as a result, the Company will comply with new or revised accounting standards as other public companies that are not emerging growth companies.
Unaudited interim financial information
The accompanying interim consolidated balance sheet as of March 31, 2015, including pro forma thereof, the related interim consolidated statements of operations and cash flows for the three month periods ended March 31, 2014 and 2015, the statement of preferred stock and stockholders’ deficit for the three month period ended March 31, 2015, and the related footnote disclosures are unaudited. These unaudited interim consolidated financial statements have been prepared in accordance with accounting principles generally accepted in the United States of America (U.S. GAAP) applicable to interim financial statements. The interim financial statements are presented in accordance with the rules and regulations of the Securities and Exchange Commission and do not include all disclosures normally required in annual consolidated financial statements prepared in accordance with U.S. GAAP. In management’s opinion, the unaudited interim consolidated financial statements have been prepared on the same basis as the annual financial statements and include all adjustments, which include only normal recurring adjustments, necessary for the fair presentation of the Company’s financial position as of March 31, 2015 and the Company’s consolidated results of operations and cash flows for the three months ended March 31, 2014 and 2015. The results for the three months ended March 31, 2015 are not necessarily indicative of the results expected for the year ending December 31, 2015.
Use of estimates
The preparation of the accompanying consolidated financial statements in conformity with U.S. GAAP requires management to make estimates and assumptions about future events. These estimates and the underlying assumptions affect the amounts of assets and liabilities reported, disclosures about contingent assets and liabilities, and reported amounts of revenues and expenses. Such estimates include the valuation of deferred tax assets, uncertain tax positions, useful lives of long-lived assets including manufacturing tooling, revenue recognition and stock-based compensation expense. These estimates and assumptions are based on management’s best estimates and judgment. Management evaluates its estimates and assumptions on an ongoing basis using historical experience and other factors and adjusts such estimates and assumptions when facts and circumstances dictate. As future events and their effects cannot be determined with precision, actual results could differ significantly from these estimates.
Concentration of credit and other risks
Financial instruments consist of cash and cash equivalents, accounts receivable, accounts payable, revolving line of credit, term loans and vendor financing arrangement. The fair values of cash and cash equivalents, accounts receivable and accounts payable approximates their carrying value due to the nature of these instruments and short-term maturities. The Company estimates the fair value of the revolving line of credit, term loans and vendor financing arrangement by considering the current rates available to the Company for debt of the same remaining maturities and with similar characteristics, structure and terms.
Financial instruments that subject the Company to concentrations of credit risk consist primarily of cash and cash equivalents and accounts receivable. The Company maintains a substantial portion of its cash and cash equivalents in checking and savings accounts with banks. Management believes that the banks that hold the Company’s cash are financially sound and, accordingly, are subject to minimal credit risk. Deposits held with banks may exceed the amount of insurance provided on such deposits. The Company generally does not require collateral or other security in support of accounts receivable. The Company periodically reviews the need for an allowance by considering factors such as historical experience, credit quality, the age of the accounts receivable balances and current economic conditions that may affect a customer’s ability to pay. As a result of the Company’s favorable collection experience and customer concentration, allowance for doubtful accounts was immaterial at December 31, 2013 and 2014 and March 31, 2015.
F-9
Table of Contents
The customer concentrations for the Company as a percentage of total revenues were as follows:
| Year Ended December 31, | Three Months Ended March 31, | |||||||||||||||||||
| 2012 | 2013 | 2014 | 2014 | 2015 | ||||||||||||||||
| (Unaudited) | ||||||||||||||||||||
| Customer A(1) |
62 | % | 54 | % | 62 | % | 57 | % | 79 | % | ||||||||||
| Customer B(1) |
12 | % | 32 | % | 31 | % | 30 | % | 16 | % | ||||||||||
| Customer C |
10 | % | * | * | * | * | ||||||||||||||
The customer concentrations for the Company as a percentage of gross accounts receivable, based on the billing address of the customer, were as follows:
| As of December 31, |
As of March 31, |
|||||||||||
| 2013 | 2014 | 2015 | ||||||||||
| (Unaudited) | ||||||||||||
| Customer A |
66 | % | * | * | ||||||||
| Customer D(2) |
28 | % | 12 | % | * | |||||||
| Customer E(2) |
* | 75 | % | 84 | % | |||||||
| * | less than 10%. |
| (1) | Sales include sales to contract manufacturers or ODMs at the direction of such end customer. |
| (2) | Receivable from contract manufacturers or ODMs to whom sales are made at the direction of end customer. |
Foreign currency translation and transactions
The Company’s foreign subsidiaries’ functional currency is the U.S. dollar. Assets and liabilities denominated in currencies other than U.S. dollars are remeasured into U.S. dollars at current exchange rates for monetary assets and liabilities and at historical exchange rates for nonmonetary assets and liabilities. Revenues, cost of revenues and expenses are remeasured at average exchange rates in effect during each reporting period. The Company includes gains and losses from the remeasurement process as well as from foreign currency transactions in the consolidated statements of operations. For the years ended December 31, 2012, 2013 and 2014 and the three months ended March 31, 2014 and 2015, foreign currency gain (loss) of $(0.1) million, $(0.02) million, $(0.04) million, $(0.05) million and $0.03 million, respectively, was included in other income (expense), net.
Cash and cash equivalents
The Company considers all highly liquid investments with an original maturity of three months or less to be cash equivalents. As of December 31, 2013 and 2014 and March 31, 2015, cash and cash equivalents consist of cash deposited with banks and money market funds for which their cost approximates their fair value.
Comprehensive income (loss)
Comprehensive income (loss) includes all changes in equity (net assets) during a period from non-owner sources. For the years ended December 31, 2012, 2013 and 2014 and the three months ended March 31, 2014 and 2015, there were no differences between net loss and other comprehensive income (loss).
Inventories
Inventories are stated at lower of standard cost or market. Standard cost approximates actual cost determined on a first-in, first-out (FIFO) basis. The Company records inventory write-downs for potentially excess inventory based on forecasted demand, economic trends, technological obsolescence of its products and
F-10
Table of Contents
transition of inventory related to new product releases. At the point of loss recognition, a new, lower-cost basis for that inventory is established, and subsequent changes in facts and circumstances do not result in the restoration or increase in that newly established cost basis.
Property and equipment
Property and equipment are stated at cost and are depreciated using the straight-line method over their estimated useful lives. Leasehold improvements are amortized over the shorter of their useful life or the remaining lease term. Upon retirement or sale, the cost of assets disposed of and the related accumulated depreciation are removed and any resulting gain or loss is recorded as a component of operating expenses. Repairs and maintenance costs are expensed as incurred. The estimated useful lives of property and equipment are as follows:
| Estimated Useful Lives |
||||
| Equipment and software |
3 years | |||
| Furniture and fixtures |
3 years | |||
| Leasehold improvements |
3-5 years | |||
| Manufacturing tooling |
3-8 years | |||
The Company incurs costs for the purchase of masks to manufacture the Company’s products. The Company’s eASIC platform incorporates a versatile base array and a customizable single-mask layer. If the Company determines the product technological feasibility has been achieved and estimated market demand for products using the tested array exists when costs are incurred, the costs will be capitalized as manufacturing tooling under property and equipment. If product technological feasibility has not been achieved or the mask is not expected to be utilized in production, the related mask costs are expensed as incurred to research and development (R&D). The amount capitalized is amortized to cost of sales on a straight-line basis over the estimated useful life of 8 years for the base array and 3 years for the customizable single mask layer. Amortization commences with the start of commercial production. The Company periodically reassesses the estimated useful lives of capitalized mask sets and assesses them for impairment. Impairment charges are recorded in the period that determination of the impairment occurs. Total mask costs capitalized were $1.9 million, $6.1 million and $6.3 million as of December 31, 2013 and 2014 and March 31, 2015, respectively.
Impairment of long-lived assets
The Company evaluates events and changes in circumstances that could indicate carrying amounts of long-lived assets, including property and equipment, may not be recoverable. When such events or changes in circumstances occur, an assessment is made of the recoverability of long-lived assets by determining whether or not the carrying value of such assets will be recovered through undiscounted expected future cash flows. If the total of the future undiscounted cash flows is less than the carrying amount of an asset, the Company records an impairment charge for the amount by which the carrying amount of the assets exceeds the fair value of the asset. For the year ended December 31, 2014 and the three months ended March 31, 2014 and 2015, the Company had written down tooling and mask sets of $0.5 million, $0.03 million and $0.1 million, respectively, as a result of impairment. There were no impairment charges in prior periods.
Deferred initial public offering costs
Deferred initial public offering costs, consisting of direct and incremental legal, accounting and other fees and costs attributable to our registration statement, are capitalized. The deferred offering costs will be offset against the proceeds received upon the closing of the offering. In the event the offering does not occur in a timely manner, all of the deferred offering costs will be expensed within operations. The balance of other assets in the accompanying consolidated balance sheets as of December 31, 2014 and March 31, 2015 included $1.1 million and $3.3 million of such costs, respectively. There were no deferred offering costs capitalized at December 31, 2013 and March 31, 2014.
F-11
Table of Contents
Product warranty
The Company’s products are sold, with a limited warranty for a period ranging from two to five years, warranting that the product conforms to specifications and is free from material defects in design, materials and workmanship. To date, the Company has had negligible returns of any defective production parts. As such, there is no accrual for warranty provision for the periods presented.
Preferred stock warrant liability
The preferred stock warrant liability is measured and recognized in the financial statements at its fair value as the warrants contain anti-dilution provisions which requires the exercise price of the warrants to be reduced upon any future down-round financing. The fair value of the warrants is estimated using an option-pricing model at each reporting date. The change in fair value of the warrants is recognized in the consolidated statements of operations as a component of other income (expense) net. Upon the earlier of the exercise of the warrants or the completion of a liquidation event, the preferred stock warrant liability will be remeasured to fair value and any remaining liability will be reclassified to stockholders’ deficit. A liquidation event includes the completion of an initial public offering in which the shares underlying the warrants convert from preferred stock into shares of common stock.
Revenue recognition
The Company earns revenues from the sale of custom ICs, design and development of ICs for customers, and related engineering services and prototypes. When the Company enters into an arrangement that includes a design and development phase and a production phase, the production revenues are recognized when production ICs are shipped.
The Company recognizes revenues when there is persuasive evidence of an arrangement, delivery has occurred, the price is fixed or determinable and collectability is reasonably assured. The delivery criterion for each type of product and service is discussed below.
Product Revenues. Product revenues are generated from sales of ICs. The Company recognizes product revenues at the time of delivery to its customers. A substantial majority of the Company’s sales are made on a VMI basis in which the Company maintains inventory of its product at a customer specific location (the hub). Title to that inventory transfers to its customer, and revenues are recognized, when the Company’s products are “pulled” from the Company’s hub locations or delivered to its customers, as needed to meet their manufacturing requirements. The Company invoices its customer when this pull transaction occurs. In addition, the Company sells to non-stocking distributors that sell directly to end-users for which the Company does not grant return privileges, except for defective products during the warranty period, nor does the Company grant pricing credits. Accordingly, the Company recognizes revenues upon transfer of title and risk of loss or damage, generally upon delivery.
Service Revenues. The Company performs design and development services for ICs to a customer’s specifications and applies the proportional performance method based on the achievement of contractual milestones. The Company has identified the acceptance of the design and prototype delivery as separate elements in the design and development arrangement. The revenues are allocated between such elements based on relative selling price. The selling price for a deliverable is based on its vendor specific evidence of fair value (VSOE) if available, third-party-evidence (TPE), if VSOE is not available, or estimated selling prices (ESP), if neither VSOE nor TPE is available. Revenues and the related costs for each of these elements are recognized up on completion of the substantive milestones. If achievement of milestones is subject to customer acceptance, such milestones are not considered achieved until customer acceptance is received. When the Company has not been able to establish VSOE or TPE for its services, the Company generally utilizes best ESP for the purposes of allocating revenues to each unit of accounting. The Company limits the amount of revenue recognition for delivered elements to the amount that is not contingent on the future delivery of products or services or future performance obligations and not subject to customer-specific return or refund privileges.
F-12
Table of Contents
Deferred revenues consist of amounts that have been invoiced relating to service revenues but that have not been recognized as revenues in accordance with the Company’s revenue recognition policy.
At the inception of the customer arrangement, and at each reporting date thereafter, the Company estimates the total cost to complete under its arrangements. If at any point of time during the arrangement, the Company estimates the total cost to complete is higher than the arrangement price, a provision for the entire loss is recorded in the period that the estimate of a loss occurs.
The Company also derives revenues from sale of third party IP solutions. At the request of the Company’s customers, the Company procures third party IP solutions in order for them to port such third party IP solutions on the design of the ICs, the costs of which are then passed through to its customers. The determination of whether revenues should be reported on a gross or net basis is based on an assessment of whether the Company is acting as the principal or an agent in the transaction. In determining whether the Company is the principal or an agent, the Company follows the accounting guidance for principal-agent considerations. When the Company determines that it is not the primary obligor and (i) is not responsible for any development work on such third party IP, (ii) does not have any discretion to select the third party IP provider, and (iii) does not have latitude in price setting, then the Company concludes that it is the agent in these arrangements, and therefore reports revenues and cost of revenues on a net basis.
Shipping costs
Shipping costs are included in sales and marketing expense. Shipping costs were $0.1 million, $0.1 million, $0.2 million, $0.1 million and $0.01 million for the years ended December 31, 2012, 2013 and 2014 and the three months ended March 31, 2014 and 2015, respectively.
Advertising costs
Advertising costs are expensed as incurred. Advertising costs were immaterial for all periods presented.
Research and development costs
Research and development costs are charged to expense as incurred.
The Company enters into agreements with customers for shared development, under which research and development costs are eligible for reimbursement. Amounts reimbursed under these arrangements are offset against research and development expenses.
Income taxes
Deferred tax liabilities and assets are recognized for the expected future tax consequences of temporary differences between financial statement carrying amounts and the tax basis of assets and liabilities and net operating loss and tax credit carryforwards. Valuation allowances are established when necessary to reduce deferred tax assets to the amount expected to be realized.
The Company uses a recognition threshold and measurement attribute for the financial statement recognition and measurement of a tax position taken or expected to be taken in a tax return. A tax position is recognized when it is more likely than not that the tax position will be sustained upon examination, including resolution of any related appeals or litigation processes. A tax position that meets the more-likely-than-not recognition threshold is measured at the largest amount of benefit that is greater than 50% likely of being realized upon ultimate settlement with a taxing authority. The standard also provides guidance on derecognition of tax benefits, classification on the balance sheet, interest and penalties, accounting in interim periods, disclosure and transition.
F-13
Table of Contents
Accounting for stock-based compensation
Compensation expense related to stock-based transactions is measured and recognized in the financial statements based on fair value. The fair value of each option award is estimated on the grant date using the Black-Scholes option-pricing model and a single option award approach. This model requires that at the date of grant the Company determines the fair value of the underlying common stock, the expected term of the award, the expected volatility of the price of the Company’s common stock, risk-free interest rates, and expected dividend yield of the Company’s common stock. The stock-based compensation expense, net of forfeitures, is recognized using a straight-line basis over the requisite service periods of the awards, which is generally four years. The Company estimates a forfeiture rate to calculate the stock-based compensation for the Company’s awards. The forfeiture rate is based on an analysis of the Company’s actual historical forfeitures.
The Company accounts for stock options issued to nonemployees based on the fair value of the awards determined using the Black-Scholes option-pricing model. The fair value of stock options granted to nonemployees is remeasured as the stock options vest, and the resulting change in value, if any, is recognized in the statement of operations during the period the related services are rendered. The stock-based compensation expense is recognized using a straight-line basis over the requisite service periods of the awards.
Net income (loss) per share
Basic net income (loss) per share attributable to common stockholders is calculated by dividing the net income (loss) attributable to common stockholders by the weighted average number of common shares outstanding during the period, without consideration for potentially dilutive securities. Net income (loss) attributable to common stockholders is determined by allocating undistributed earnings between holders of common and convertible preferred stock, based on the contractual dividend rights of the holders of convertible preferred stock including those dividends payable on convertible preferred stock prior and in preference to the holders of common stock. Diluted net income (loss) per share attributable to common stockholders is computed by dividing the net income (loss) attributable to common stockholders for purposes of calculating diluted net income (loss) per share by the weighted average number of common shares and potentially dilutive common stock equivalents outstanding for the period determined using the treasury-stock and if-converted methods. For purposes of the diluted net income (loss) per share calculation, convertible preferred stock, common stock options, and warrants are considered to be potentially dilutive securities.
Unaudited pro forma net income (loss) per share of common stock
The unaudited pro forma basic and diluted net loss per share of common stock assumes the conversion of all outstanding shares of Series A-2 convertible preferred stock as if the conversion had occurred at the beginning of the period.
Recently issued accounting standards
In April 2015, the Financial Accounting Standards Board (FASB) issued Accounting Standards Update (ASU) 2015-03 — Simplifying the Presentation of Debt Issuance Costs, which requires that debt issuance costs related to a recognized debt liability be presented in the balance sheet as a direct deduction from the carrying amount of that debt liability, consistent with debt discounts. This ASU requires retrospective adoption and will be effective for the Company in the first quarter of 2016. Early adoption is permitted. The Company does not expect this adoption to have a material impact on the consolidated financial statements.
In August 2014, the FASB issued ASU 2014-15 — Disclosure of Uncertainties about an Entity’s Ability to Continue as a Going Concern. ASU 2014-15 requires management to evaluate whether there is substantial doubt about an entity’s ability to continue as a going concern and to provide related footnote disclosures. In doing so, companies will have reduced diversity in the timing and content of footnote disclosures as compared to today’s
F-14
Table of Contents
guidance. ASU 2014-15 is effective for the Company’s 2016 annual financial statements with early adoption permitted. The Company does not believe the impact of adopting ASU 2014-15 on its consolidated financial statements will be material.
In May 2014, the FASB issued ASU No. 2014-09 regarding ASC Topic 606—Revenue from Contracts with Customers. The standard provides principles for recognizing revenues for the transfer of promised goods or services to customers with the consideration to which the entity expects to be entitled in exchange for those goods or services. The guidance is effective for the Company in the first quarter of fiscal 2017 using either of two methods: (i) retrospective to each prior reporting period presented with the option to elect certain practical expedients as defined within the guidance; or (ii) retrospective with the cumulative effect of initially applying the guidance recognized at the date of initial application and providing certain additional disclosures as defined per the guidance. Early adoption is not permitted. The Company is currently evaluating the accounting, transition and disclosure requirements of the standard and cannot currently estimate the financial statement impact of adoption.
In July 2013, the FASB issued ASU 2013-11—Presentation of an Unrecognized Tax Benefit When a Net Operating Loss Carryforward, a Similar Tax Loss, or a Tax Credit Carryforward Exists (ASU 2013-11). This standard requires an entity to present an unrecognized tax benefit, or a portion of an unrecognized tax benefit, in the financial statements as a reduction to a deferred tax asset for a net operating loss carryforward, a similar tax loss, or a tax credit carryforward. To the extent a net operating loss carryforward, a similar tax loss, or a tax credit carryforward is not available at the reporting date under the tax law of the applicable jurisdiction to settle any additional income taxes that would result from the disallowance of a tax position or the tax law of the applicable jurisdiction does not require the entity to use, and the entity does not intend to use, the deferred tax asset for such purpose, the unrecognized tax benefit should be presented in the financial statements as a liability and should not be combined with deferred tax assets. This guidance is effective for fiscal years, and interim periods within those years, beginning after December 15, 2013. Early adoption is permitted. The adoption of ASU 2013-11 did not have a material impact on the consolidated financial statements.
2. Fair value measurements
The Company defines fair value as the price that would be received from selling an asset or paid to transfer a liability in an orderly transaction between market participants at the measurement date. When determining the fair value measurements for assets and liabilities which are required to be recorded at fair value, the Company considers the principal or most advantageous market in which to transact and the market-based risk. The Company applies fair value accounting for all financial assets and liabilities that are recognized or disclosed at fair value in the financial statements on a recurring basis. The carrying amounts reported in the consolidated financial statements approximate the fair value for cash and cash equivalents, accounts receivable, accounts payable and accrued liabilities, due to their short-term nature. The carrying amount of the Company’s preferred stock warrant liability represents their fair value, and the carrying value of the revolving line of credit and term loans approximate fair value as the stated interest rates approximate market rates currently available to the Company.
The Company categorizes assets and liabilities recorded at fair value on the Company’s consolidated balance sheets based upon the level of judgment associated with inputs used to measure their fair value. The categories are as follows:
| • | Level 1—Inputs are unadjusted quoted prices in active markets for identical assets or liabilities. |
| • | Level 2—Inputs are quoted prices for similar assets and liabilities in active markets or inputs other than quoted prices that are observable for the assets or liabilities, either directly or indirectly through market corroboration, for substantially the full term of the financial instruments. |
| • | Level 3—Inputs are unobservable inputs based on the Company’s own assumptions used to measure assets and liabilities at fair value. The inputs require significant management judgment or estimation. |
F-15
Table of Contents
This hierarchy requires the Company to use observable market data, when available, and to minimize the use of unobservable inputs when determining fair value.
The following describes the Company’s fair value hierarchy for its financial assets and liabilities measured at fair value on a recurring basis as of December 31, 2013 and 2014 and March 31, 2015 (in thousands):
| Description |
Balance as of December 31, 2013 |
Quoted prices in active markets for identical assets (Level 1) |
Significant other observable inputs (Level 2) |
Significant unobservable inputs (Level 3) |
||||||||||||
| Liabilities |
||||||||||||||||
| Preferred stock warrant liability |
$ | 271 | $ | — | $ | — | $ | 271 | ||||||||
|
|
|
|
|
|
|
|
|
|||||||||
| Total liabilities measured at fair value |
$ | 271 | $ | — | $ | — | $ | 271 | ||||||||
|
|
|
|
|
|
|
|
|
|||||||||
| Description |
Balance as of December 31, 2014 |
Quoted prices in active markets for identical assets (Level 1) |
Significant other observable inputs (Level 2) |
Significant unobservable inputs (Level 3) |
||||||||||||
| Liabilities |
||||||||||||||||
| Preferred stock warrant liability |
$ | 1,203 | $ | — | $ | — | $ | 1,203 | ||||||||
|
|
|
|
|
|
|
|
|
|||||||||
| Total liabilities measured at fair value |
$ | 1,203 | $ | — | $ | — | $ | 1,203 | ||||||||
|
|
|
|
|
|
|
|
|
|||||||||
| Description |
Balance as of March 31, 2015 (Unaudited) |
Quoted prices in active markets for identical assets/liabilities (Level 1) |
Significant other observable inputs (Level 2) |
Significant unobservable inputs (Level 3) |
||||||||||||
| Liabilities |
||||||||||||||||
| Preferred stock warrant liability |
$ | 1,042 | $ | — | $ | — | $ | 1,042 | ||||||||
|
|
|
|
|
|
|
|
|
|||||||||
| Total liabilities measured at fair value |
$ | 1,042 | $ | — | $ | — | $ | 1,042 | ||||||||
|
|
|
|
|
|
|
|
|
|||||||||
Level 3 instruments consist solely of the Company’s preferred stock warrant liability in which the fair value was measured using an option-pricing model. As discussed further in Note 6, the preferred stock warrant liability was estimated using assumptions related to the remaining contractual term of the warrants, the risk-free interest rate and volatility of the Company’s comparable public companies over the remaining term and the fair value of underlying shares. The significant unobservable inputs used in the fair value measurement of the preferred stock warrant liability are the fair value of the underlying stock at the valuation date and the estimated term of the warrants. Generally, increases (decreases) in the fair value of the underlying stock and estimated term would result in a directionally similar impact to the fair value measurement.
F-16
Table of Contents
The following table presents the fair value activity for the preferred stock warrant liability (in thousands):
| Level 3 | ||||
| Balance at January 1, 2012 |
$ | 131 | ||
| Changes in fair value of preferred stock warrants |
(127 | ) | ||
|
|
|
|||
| Balance at December 31, 2012 |
$ | 4 | ||
| Issuance of preferred stock warrants |
235 | |||
| Reclassification to additional paid-in capital |
(4 | ) | ||
| Changes in fair value of preferred stock warrants |
36 | |||
|
|
|
|||
| Balance at December 31, 2013 |
$ | 271 | ||
| Issuance of preferred stock warrants |
149 | |||
| Changes in fair value of preferred stock warrants |
783 | |||
|
|
|
|||
| Balance at December 31, 2014 |
1,203 | |||
| Changes in fair value of preferred stock warrants (Unaudited) |
(161 | ) | ||
|
|
|
|||
| Balance at March 31, 2015 (Unaudited) |
$ | 1,042 | ||
|
|
|
|||
The convertible preferred stock warrants are subject to re-measurement at each balance sheet date, and any change in fair value is recognized as a component of other income (expense), net in the consolidated statements of operations.
3. Consolidated balance sheet components
Inventories, net
Inventories, net consisted of the following (in thousands):
| December 31, | March, 2015 |
|||||||||||
| 2013 | 2014 | |||||||||||
| (Unaudited) | ||||||||||||
| Raw materials |
$ | 359 | $ | 745 | $ | 82 | ||||||
| Work-in-process |
2,621 | 4,710 | 2,899 | |||||||||
| Finished goods |
3,815 | 5,812 | 4,298 | |||||||||
|
|
|
|
|
|
|
|||||||
| $ | 6,795 | $ | 11,267 | $ | 7,279 | |||||||
|
|
|
|
|
|
|
|||||||
Property and equipment, net
Property and equipment, net consisted of the following (in thousands):
| December 31, | March, 2015 |
|||||||||||
| 2013 | 2014 | |||||||||||
| (Unaudited) | ||||||||||||
| Furniture and fixtures |
$ | 137 | $ | 136 | $ | 135 | ||||||
| Equipment and software |
2,978 | 3,323 | 3,381 | |||||||||
| Manufacturing tooling |
1,864 | 6,151 | 6,307 | |||||||||
| Leasehold improvements |
194 | 214 | 214 | |||||||||
|
|
|
|
|
|
|
|||||||
| 5,173 | 9,824 | 10,037 | ||||||||||
| Less: accumulated depreciation and amortization |
(2,817 | ) | (3,224 | ) | (3,640 | ) | ||||||
|
|
|
|
|
|
|
|||||||
| $ | 2,356 | $ | 6,600 | $ | 6,397 | |||||||
|
|
|
|
|
|
|
|||||||
F-17
Table of Contents
Depreciation and amortization expense of property and equipment was $0.5 million, $0.5 million, $0.9 million, $0.1 million and $0.4 million for the years ended December 31, 2012, 2013 and 2014 and the three months ended March 31, 2014 and 2015, respectively.
Accrued expenses and other current liabilities
Accrued expenses and other current liabilities consisted of the following (in thousands):
| December 31, | March 31, | |||||||||||
| 2013 | 2014 | 2015 | ||||||||||
| (Unaudited) | ||||||||||||
| Accrued payroll and related expenses |
$ | 741 | $ | 1,617 | $ | 1,263 | ||||||
| Accrued professional fees |
14 | 533 | 1,476 | |||||||||
| Other accrued liabilities |
1,080 | 2,028 | 1,687 | |||||||||
|
|
|
|
|
|
|
|||||||
| $ | 1,835 | $ | 4,178 | $ | 4,426 | |||||||
|
|
|
|
|
|
|
|||||||
4. Borrowings
In September 2010, the Company entered into a loan and security agreement, as amended at various dates from 2010 to 2014 (collectively, the Amended SVB Agreement) with Silicon Valley Bank (SVB) for a total growth capital loan of $5.0 million and advances under a revolving line of credit up to $8.0 million. The Amended SVB Agreement contains restrictive covenants, including covenants requiring the Company to meet quarterly gross revenues targets, and limiting its ability to sell property, enter into merger and acquisitions, raise new debt, and other restrictions typical of such debt. The Amended SVB Agreement contains usual and customary events of default, such as payment defaults, covenant defaults, investor abandonment, cross-default to material indebtedness and contracts, and insolvency defaults. The Company’s borrowings under the Amended SVB Agreement are secured by a lien granted with respect to substantially all of the Company’s assets, excluding intellectual property. The amendment in December 2014 provides for a change in the covenant relating to the maximum amounts that can be held in foreign deposit accounts from $0.25 million to $0.8 million and also for the extension of the maturity date for the revolving line of credit from September 30, 2015 to September 25, 2016.
Revolving line of credit
Under the terms of the Amended SVB Loan Agreement, the Company is able to borrow up to $8.0 million under the revolving line of credit. The line of credit carries a floating interest rate equal to prime plus 1.5% and matures on September 25, 2016. Borrowings under the line of credit were collateralized by all the Company’s assets, excluding intellectual property, and the availability of borrowings under the line of credit is subject to certain borrowing base limitations. Subject to reduction based upon a revenue test, the maximum amount available for borrowing under the revolving line of credit is not to exceed the lesser of $8.0 million, or 85% of eligible accounts receivable. Under the terms of the line of credit, if cash balances with SVB are less than $5 million, customer payments are applied to reduce the amounts outstanding under the revolving line of credit. At December 31, 2013 and 2014 and March 31, 2015, such cash balances exceeded the above threshold, and, accordingly, the revolving line of credit was classified as long-term liability.
Term loans
The $5.0 million growth capital loans were made under two tranches. The first $3.0 million tranche was available immediately upon execution of the Amended SVB Loan Agreement. The second $2.0 million tranche was contingent upon the Company achieving a certain milestone. Under the terms of the Amended SVB Loan Agreement, the Company borrowed $3.0 million under the growth capital facility in September 2010 and $2.0 million in January 2011. The Company paid off all the outstanding balance under the growth capital facility during September 2013.
F-18
Table of Contents
In April 2011, the Company entered into a loan and security agreement (GHC Loan Agreement) with Gold Hill Capital 2008 L.P. (GHC) for a total growth capital facility of $3.0 million. Under the terms of the GHC Loan Agreement, the Company borrowed $3.0 million under the growth capital facility during the year ended December 31, 2011. The Company paid off all the outstanding balance under the growth capital facility during September 2013.
In September 2013, the Company entered into a venture loan and security agreement with Horizon Technology Finance Corporation and DBD Credit Funding LLC (Original Horizon Venture Loan Agreement) and immediately borrowed the entire $6.0 million in term loans available under that facility. The Company’s borrowings under the Original Horizon Venture Loan Agreement are secured by a lien granted with respect to substantially all of the Company’s assets, excluding intellectual property. The Original Horizon Venture Loan Agreement contained usual and customary events of default, such as payment defaults, covenant defaults, material adverse change, investor abandonment, cross-default to material indebtedness, and insolvency defaults. The notes carry a fixed interest rate of 11%, with interest—only payments through and including October 1, 2015 and then equal principal and interest payments for an additional 24 months. In connection with the issuance of the notes, the Company agreed to make a final payment of $0.15 million upon maturity of the notes, which is being recorded as additional interest expense using the effective interest method over the life of the notes. There are prepayment penalties with respect to the notes. In September 2013, the Company repaid the outstanding balance of the debts owed to SVB and GHC as discussed above, using the proceeds received from the Original Horizon Venture Loan Agreement.
In September 2014, the Original Horizon Venture Loan Agreement was amended and restated (the Amended Horizon Venture Loan Agreement) mainly to make two new term loans available to the Company, and the Company immediately borrowed the entire $3.0 million in additional term loans available under the facility. The Company’s borrowings under the Amended Horizon Venture Loan Agreement are secured by a lien granted with respect to substantially all of its assets, excluding intellectual property. The Amended Horizon Venture Loan Agreement prohibits the payment of dividends and contains restrictive covenants, including covenants limiting its ability to sell property, enter into merger and acquisitions, raise new debt, and other restrictions typical of such debt. The Amended Horizon Venture Loan Agreement contains usual and customary events of default, such as payment defaults, covenant defaults, material adverse change, investor abandonment, cross-default to material indebtedness, and insolvency defaults. The notes related to the new term loans carry a fixed interest rate of 10.75%, with interest-only payments through and including October 1, 2015 and then equal principal and interest payments for an additional 30 months. In connection with the issuance of the new term loan notes, the Company agreed to make a final payment of $0.1 million with respect to such term loans, which is being recorded as additional interest expense using the effective interest method over the life of the notes. There are prepayment penalties for the new term notes. In December 2014, the Horizon Venture Loan Agreement was amended to provide for a change in the covenant relating to the maximum amounts that can be held in foreign deposit accounts from $0.25 million to $0.8 million.
Term loans consisted of the following (in thousands):
| December 31, | March 31, 2015 |
|||||||||||
| 2013 | 2014 | |||||||||||
| (Unaudited) | ||||||||||||
| Horizon Venture term loans, current portion |
$ | — | $ | 818 | $ | 1,792 | ||||||
| Horizon Venture term loans, non-current portion |
5,798 | 7,999 | 7,074 | |||||||||
|
|
|
|
|
|
|
|||||||
| Horizon Venture term loans, total |
$ | 5,798 | $ | 8,817 | $ | 8,866 | ||||||
|
|
|
|
|
|
|
|||||||
F-19
Table of Contents
Contractual future repayments on outstanding debt obligations (amounts exclude unamortized discount of $0.2 million at December 31, 2014), not including outstanding balances under the revolving line of credit, as of December 31, 2014 are as follows (in thousands):
| Years ending December 31, | Principal | |||
| 2015 |
$ | 855 | ||
| 2016 |
4,040 | |||
| 2017 |
3,657 | |||
| 2018 |
448 | |||
|
|
|
|||
| Total |
$ | 9,000 | ||
|
|
|
|||
Term loan warrants
| • | In connection with the Amended SVB Loan Agreement as discussed above, in September 2010, the Company issued a warrant to purchase 12,907 shares of Series G convertible preferred stock at an exercise price of $15.495 per share. The warrants are exercisable any time at the option of the holder and expire on the earlier of the tenth anniversary of the date of issuance or upon the closing of an acquisition of the Company in which the consideration payable for such acquisition is cash, or upon the closing of an acquisition of the Company in which the consideration payable for such acquisition is publicly traded stock with a per share value of at least $46.485 per share. The warrants were initially valued at $0.1 million and recorded as a discount on the related term loans. As part of the Series A-2 Financing, which closed in January 2013, the Series G convertible preferred stock warrants converted into common stock warrants. |
| • | In connection with the GHC Loan Agreement as discussed above, in April 2011, the Company issued a warrant to purchase 19,361 shares of Series G convertible preferred stock at an exercise price of $15.495 per share. The warrant is exercisable any time at the option of the holder and expires in April 2021. The warrant was valued at $0.2 million and recorded as a discount on the related term loans. As part of the Series A-2 Financing, which closed in January 2013, the Series G convertible preferred stock warrants converted into common stock warrants. |
| • | In connection with the Original Horizon Venture Loan Agreement as discussed above, in September 2013, the Company issued warrants to purchase either (i) 75,111 shares of Series A-2 convertible preferred stock at an exercise price of $5.19225 per share or (ii) shares issued in the Company’s next round of preferred stock financing that results in at least $10.0 million in cash proceeds to the Company, with an exercise price equal to the per share price in the financing. The number of shares issuable after a new financing would be determined by dividing $0.4 million by the applicable exercise price. The warrants were immediately exercisable and expire at the later of ten years after issuance or five years from closing an initial public offering. The warrants were initially valued at $0.2 million and recorded as a discount on the related term loans. |
| • | In connection with the Amended Horizon Venture Loan Agreement as discussed above, in September 2014, the Company issued warrants to purchase either (i) 23,110 shares of Series A-2 convertible preferred stock at an exercise price of $5.19225 per share or (ii) shares issued in the Company’s next round of preferred stock financing that results in at least $10.0 million in cash proceeds to the Company, with an exercise price equal to the per share price in the financing. The number of shares issuable after a new financing would be determined by dividing $0.1 million, by the applicable exercise price. The warrants were immediately exercisable and expire at the later of ten years after issuance or five years from closing an initial public offering. The warrants were initially valued at $0.1 million and recorded as a discount on the related term loans. |
At December 31, 2014 and March 31, 2015, the Company was in compliance with all of the covenants under the Amended SVB Agreement and Amended Horizon Venture Agreement.
F-20
Table of Contents
Vendor financing arrangement
The Company has an existing arrangement, as amended, with DNP America LLC (DNP) which provides for the purchase of mask sets to be paid in over a period of time based on the actual purchase of additional mask sets over the remaining term of the agreement. The terms of the agreement initially provided for repayment of any unpaid amounts by December 2012. The terms of the agreement were modified in December 2012 as follows:
| (a) | The extension to December 2016 for the repayment of any unpaid amounts payable to DNP towards purchases of mask sets by the Company; and |
| (b) | An increase in the amounts due to DNP by a total of $0.2 million repayable by the Company at a pre-determined amount at the time of purchases of subsequent mask sets and any unpaid amounts remaining due of the $0.2 million to be paid prior in January 2015. |
The modification of the aggregate principal balance due to DNP with a net carrying amount of $1.4 million prior to the December 2012 modification resulted in a troubled debt restructuring accounting treatment under ASC Topic 470-60 where no gain or loss was recognized due to fact that the carrying amount of the debt balance was less than total future cash payments specified by the terms of the debt remaining unsettled after the modification. The net carrying amount due to DNP was $1.4 million and $1.3 million at December 31, 2013 and 2014, respectively.
In February 2015, the terms of the agreement have been modified as follows:
| • | The extension to January 2016 of the repayment of the $0.2 million discussed in (b) above repayable by the Company at a pre-determined amount at the time of purchase of subsequent mask sets to the extent any amounts remaining due of the $0.2 million. |
| • | The extension to January 2017 for the repayment of any unpaid amounts payable to DNP towards purchase of mask sets by the Company. |
The net carrying amount due to DNP was $1.3 million as of March 31, 2015.
5. Commitments and contingencies
License agreements
The Company has entered into time-based software license arrangements requiring quarterly payments through 2017. The future minimum payments under these arrangements as of December 31, 2014 were as follows (in thousands):
| Time-based licenses |
||||
| Year: |
||||
| 2015 |
$ | 2,521 | ||
| 2016 |
1,383 | |||
| 2017 |
580 | |||
|
|
|
|||
| Total payments |
$ | 4,484 | ||
|
|
|
|||
Leases
The Company leases office equipment and facilities under non-cancellable operating leases with terms through year 2016. Rent expense is recognized using the straight-line method over the term of the lease.
F-21
Table of Contents
The aggregate future non-cancelable minimum rental payments on the Company’s operating leases, as of December 31, 2014, are as follows (in thousands):
| 2015 |
$ | 433 | ||
| 2016 |
387 | |||
| 2017 |
68 | |||
|
|
|
|||
| Total payments |
$ | 888 | ||
|
|
|
Rent expense for all operating leases was $0.5 million, $0.7 million, $0.8 million, $0.2 million and $0.2 million for the years ended December 31, 2012, 2013 and 2014 and the three months ended March 31, 2014 and 2015, respectively.
In July 2014, the Company leased certain data storage equipment under a capital lease that is included in property and equipment. The total cost of this equipment, net of accumulated amortization, was $0.4 million as of December 31, 2014 and March 31, 2015.
The aggregate future non-cancelable minimum rental payments on the Company’s capital leases, as of December 31, 2014, are as follows (in thousands):
| 2015 |
$ | 138 | ||
| 2016 |
152 | |||
| 2017 |
114 | |||
|
|
|
|||
| 404 | ||||
| Less: Interest component |
28 | |||
|
|
|
|||
| Present value of minimum lease payments |
376 | |||
| Less: Current portion of capital lease obligation (included in accrued expenses and other current liabilities) |
121 | |||
|
|
|
|||
| Long-term portion of capital lease obligation (included in other non-current liabilities) |
$ | 255 | ||
|
|
|
Litigation and indemnification
Litigation
The Company accrues for contingencies when it believes that a loss is probable and that it can reasonably estimate the amount of any such loss and the Company has made an assessment of the probability of incurring any such losses and whether or not those losses are estimable.
Although the Company is not currently subject to any litigation, and no litigation is currently threatened against the Company, the Company may be subject to legal proceedings, claims and litigation, including intellectual property litigation, arising in the ordinary course of business. Such matters are subject to many uncertainties and outcomes and are not predictable with assurance. The Company accrues amounts that it believes are adequate to address any liabilities related to legal proceedings and other loss contingencies that it believes will result in a probable loss that is reasonably estimable.
To the extent there is a reasonable possibility that a loss exceeding amounts already recognized may be incurred and the amount of such additional loss would be material, the Company will either disclose the estimated additional loss or state that such an estimate cannot be made. The Company does not currently believe that it is reasonably possible that additional losses in connection with litigation arising in the ordinary course of business would be material.
F-22
Table of Contents
Indemnification
Under the indemnification provisions of the Company’s standard sales related contracts, the Company agrees to defend its customers against third-party claims asserting infringement of certain intellectual property rights, which may include patents, copyrights, trademarks, or trade secrets and to pay judgments entered on such claims. The Company’s exposure under these indemnification provisions is generally limited to the total amount paid by its customer under the agreement. However, certain agreements include indemnification provisions that could potentially expose the Company to losses in excess of the amount received under the agreement. In addition, the Company indemnifies its officers, directors and certain key employees while they are serving in good faith in such capacities. As of December 31, 2014 and March 31, 2015, the Company has accrued a charge of $0.2 million for claims under indemnification provisions.
6. Preferred stock and stockholders’ deficit
Preferred stock
As of December 31, 2013 and 2014 and March 31, 2015, the Company’s outstanding preferred stock, both convertible and non-convertible, consisted of the following (in thousands, except share data):
| Shares Authorized |
Shares Issued and Outstanding |
Aggregate Liquidation Value |
Carrying Value |
|||||||||||||
| Series A |
— | — | $ | — | $ | — | ||||||||||
| Series B |
— | — | — | — | ||||||||||||
| Series C |
— | — | — | — | ||||||||||||
| Series D |
— | — | — | — | ||||||||||||
| Series E |
— | — | — | — | ||||||||||||
| Series F |
— | — | — | — | ||||||||||||
| Series F-1 |
— | — | — | — | ||||||||||||
| Series G |
— | — | — | — | ||||||||||||
| Series H |
— | — | — | — | ||||||||||||
| Series A-1* |
40,000,000 | 533,301 | 40,000 | 17,783 | ||||||||||||
| Series A-2 |
450,000,000 | 4,532,662 | 23,533 | 23,503 | ||||||||||||
|
|
|
|
|
|
|
|
|
|||||||||
| 490,000,000 | 5,065,963 | $ | 63,533 | $ | 41,286 | |||||||||||
|
|
|
|
|
|
|
|
|
|||||||||
| * | All classes of preferred stock are convertible except Series A-1 preferred stock which is non-convertible. |
Convertible and non-convertible preferred stock
The rights, preferences and privileges of the Series A-1 non-convertible preferred stock and Series A-2 convertible preferred stock of the Company are as follows:
Dividends. Holders of the preferred stock are entitled to receive, pari passu but in preference to the common stockholders, when and as declared by the Board of Directors, but only out of funds that are legally available therefor, non-cumulative cash dividends at the annual rate of eight percent (8%) of the original issue price as follows:
| • | $0.41538 per share on each outstanding share of Series A-2 convertible preferred stock. |
| • | $6.00 per share on each outstanding share of Series A-1 non-convertible preferred stock. |
No dividends have been declared to date. In the event dividends are paid on common stock, then the Company shall pay an additional dividend on all outstanding preferred stock in an amount per share (on an as-if-converted to common stock basis for the Series A-2 preferred stock) equal to the amount paid or set aside for each share of common stock.
F-23
Table of Contents
Liquidation
In the event of liquidation, dissolution or winding-up of the Company, either voluntary or involuntary, the holders of the Series A-2 preferred stock, shall be entitled to receive, prior and in preference to any distribution to the other preferred or common holders, an amount of $5.19225 per share for each share of Series A-2 preferred stock held by them, plus all declared but unpaid dividends. If the distribution is insufficient to permit the payment to such holders of the full Series A-2 preference amount, then the entire assets and funds of the Company legally available for distribution shall be distributed ratably among the holders of the Series A-2 preferred stock, in proportion to the number of shares of Series A-2 preferred stock held by each. After payment in full to the holders of the Series A-2 preferred stock, the holders of Series A-1 non-convertible preferred stock shall be entitled to receive, prior and in preference to any distribution to the common holders, an amount of $75.00 per share for each share of Series A-1 non-convertible preferred stock, plus all declared but unpaid dividends. If the distribution is insufficient to permit the payment to such holders of the full Series A-1 amount, then it will be distributed ratably among the Series A-1 holders in proportion to the number of shares held by each. After payment in full to the holders of Series A-2 preferred stock and Series A-1 non-convertible preferred stock, the remaining assets shall be distributed among the holders of Series A-2 preferred stock and common stock, pro rata, assuming conversion of all Series A-2 preferred stock into common stock, until, with respect to the holders of Series A-2 preferred stock, such holders shall have received an amount equal to $15.57675 on such shares of Series A-2 preferred stock. Thereafter, the holders of the common stock shall receive all remaining proceeds.
Redemption
The convertible preferred stock is not redeemable.
Conversion
Holders of Series A-2 preferred stock have the option to convert each share of preferred stock into common stock (subject to adjustment for events of dilution) on a 1.13525 to one basis. The Series A-2 preferred stock shall automatically be converted into common stock upon the earlier of (i) the date specified by the vote or written consent or agreement of holders of at least two-thirds of the then outstanding shares of Series A-2 preferred stock, voting or acting together as a single class, or (ii) an underwritten public offering pursuant to an effective registration statement with an aggregate offering price of not less than $30.0 million. The Series A-1 preferred stock has no conversion rights. Upon the closing of a firm commitment underwritten public offering pursuant to an effective registration statement in which all shares of the preferred stock convert into common stock, the Series A-1 non-convertible preferred stock shall terminate and cease to have any rights, preferences or privileges without any further action.
Voting
Each share of Series A-2 Preferred Stock has voting rights equivalent to the number of shares of common stock into which such preferred shares could be converted. The Series A-1 non-convertible preferred stock has no voting rights. For the election of members of the Board of Directors, the voting is as follows:
| • | The holders of the Series A-2 preferred stock, voting as a single class, shall be entitled to elect four directors. |
| • | The holders of common stock, voting as a single class, shall be entitled to elect one director. |
| • | The holders of common stock and preferred stock, voting together as a single class on an as-if converted basis, shall be entitled to elect all remaining directors. |
Series A-2 preferred stock financings and recapitalization
In December 2012, under a new Certificate of Incorporation and pursuant to the Series A-2 Stock Purchase Agreement, the holders of the Company’s existing preferred stock (Series A through Series H) were offered the
F-24
Table of Contents
right to participate in the $10.0 million financing, on a pro-rata basis, for a 45-day offering period that ended in January 2013. For each dollar invested in the Series A-2 financing, each holder was also entitled to exchange shares of their existing preferred stock with $4 of liquidation preference for:
| • | 0.0533 shares of Series A-1 non-convertible preferred stock (0.5 million shares in total). |
| • | 0.04 shares of “bonus” common stock per share of Series A-2 preferred stock purchased. |
| • | the number of shares of common stock into which their exchanged preferred stock was convertible. |
All of the remaining preferred shares not exchanged by participating holders, and all of the preferred stockholders who elected not to participate, would be automatically converted to common stock in January 2013. In December 2012, Series A through H preferred stock lost the right to receive their original liquidation preferences upon a liquidation event, and, as a result, were considered extinguished for accounting purposes. The extinguishment resulted in a contribution of capital to the common stock of $83.4 million, which was recorded within the stockholders’ accumulated deficit. This represented the excess of the carrying amount of the Series A through H preferred stock immediately prior to the extinguishment over the sum of (1) the fair value of the common stock into which the preferred shares were convertible and (2) the fair value of the purchase options given to the preferred holders. The fair value of the purchase options was determined based on the fair value of all the shares that would be received in the exchange, minus the cash and stockholder notes payable exchanged. The contribution of capital on the extinguishment was included in the adjustment to the Company’s net loss in arriving at the net income attributable to common stockholders for the year ended December 31, 2012.
The first closing of the Series A-2 preferred financing occurred in December 2012, with the issuance of 1.2 million shares of Series A-2 convertible preferred stock, as well as 0.3 million shares of Series A-1 non-convertible preferred stock and 4.2 million shares of common stock, upon investment of $2.3 million in cash and $4.0 million in stockholder notes payable, along with the exchange of 0.4 million shares of Series C, D, E, F, F-1, G and H preferred stock.
In January 2013, the Company completed the initial round of the Series A-2 financing and issued an additional 0.7 million shares of Series A-2 preferred, 0.2 million shares of Series A-1 preferred, and 2.4 million shares of common stock, in exchange for additional cash invested of $3.7 million and 0.3 million shares of Series A, B, C, D, E, F, F-1, G and H preferred stock. This exchange included the exercise of participation rights that had been reallocated from non-participating preferred holders, and this resulted in the recognition of $0.8 million in compensation expense for holders who received reallocated rights and were employees or service providers, and a deemed dividend to the preferred stock of $2.6 million related to holders who received reallocated rights and were not employees or service providers. The deemed dividend was charged to common stock and was included in the adjustment to the Company’s net loss in arriving at the net loss attributable to common stockholders for the year ended December 31, 2013.
Also in January 2013, the unexercised purchase options expired, and all remaining shares of Series A, B, C, D, E, F, F-1, G and H preferred stock that had not been exchanged in the financing were converted to 2.7 million shares of common stock.
Subsequent Issuances of Series A-2 Preferred Stock—From January 28, 2013 to June 2013, 0.4 million additional shares of Series A-2 preferred stock were issued to investors at $5.19225 per share, for total proceeds of $2.0 million. The Company recognized a contribution of capital from the common stock of $0.7 million in the stockholders’ accumulated deficit for these purchases, representing the excess of the cash paid by investors over the fair value of the shares purchased. The contribution of capital was included in the adjustment to the Company’s net loss in arriving at the net loss attributable to common stockholders for the year ended December 31, 2013.
In July 2013, the authorized shares of Series A-2 preferred stock were increased to 450 million, and certain rights of the Series A-2 and A-1 preferred stock were modified. The Series A-2 preferred stock was given
F-25
Table of Contents
preference over the A-1 preferred in a liquidation, where previously the A-2 and A-1 preferred stock had been entitled to receive their liquidation preferences on a pari passu basis. In addition, the conversion ratio for Series A-2 preferred increased to 1.13525 to one, from one to one. No investor group or individual investor experienced a significant net change in the value of their holdings, and the Company accounted for the change in the terms as a modification. The Company recognized a contribution of capital from the common stock of $0.8 million in the stockholders’ accumulated deficit in connection with the modification. The contribution of capital represented the net decrease in value of the outstanding preferred stock after the modification compared to the value immediately prior to the modification and was included in the adjustment to the Company’s net loss in arriving at the net loss attributable to common stockholders for the year ended December 31, 2013.
In July 2013, the Company issued 1.9 million shares of Series A-2 preferred stock and a 90-day contingent right to warrants to purchase Series A-2 preferred shares for total proceeds of $10.0 million from an investor that is also a customer. The Company recognized a contribution of capital from the common stock of $0.6 million in the stockholders’ accumulated deficit in connection with the purchase, representing the excess of the proceeds allocated to the shares purchase of the $9.9 million over the fair value of the shares. The warrants were contingent on the Company being unsuccessful in completing an equity or debt financing of at least $3.0 million within the 90-day period. Proceeds of $0.1 million were allocated to the warrant right, reflecting the high probability that the additional financing would be completed. The warrant right expired in September 2013 upon the completion of a venture loan agreement, and a gain of $0.1 million was recognized in the consolidated statement of operations.
Also in July 2013, the Company issued 0.3 million shares of Series A-2 preferred to investors in exchange for $1.5 million in principal and interest of stockholder notes payable issued in May 2013 that had matured in June 2013. As these investors already had significant holdings of the Company’s preferred stock, the Company accounted for the exchange as an equity transaction and recognized a contribution of capital from the common stock of $0.1 million in the stockholders’ accumulated deficit. The contribution of capital represented the excess of the carrying amount of the notes and interest exchanged over the fair value of the preferred shares received, and was included in the adjustment to the Company’s net loss in arriving at the net loss attributable to common stockholders for the year ended December 31, 2013.
Equity financing warrants
The following warrants to purchase preferred stock were outstanding at December 31, 2012 and became exercisable for common stock in connection with the Series A-2 financing and recapitalization in January 2013. At that time, their carrying amount and fair value of $0.004 million was reclassified to additional paid-in-capital.
| • | During October 2009 through April 2010, in connection with the Company’s convertible note financing, the Company issued warrants to purchase 56,091 shares of Series G convertible preferred stock with an exercise price of $15.495 per share. The warrants are exercisable any time at the option of the holder and expire at the earlier of June 2015, the Company’s initial public offering, or an acquisition of the Company. The warrants were initially valued at $0.5 million and recorded as a discount on the related term loans. As part of the Series A-2 Financing, which closed in January 2013, the Series G convertible preferred stock warrants converted into common stock warrants. |
| • | In connection with the Company’s Series G preferred stock financing, in June 2010, the Company issued warrants to purchase 8,601 shares of the Company’s Series G convertible preferred stock at an exercise price of $15.495 per share. The warrants were immediately exercisable and expire at the earlier of June 2015, the Company’s initial public offering, or an acquisition of the Company. The warrants were valued at $0.1 million and recorded as preferred stock issuance costs, reducing the carrying amount of the Series G preferred stock. As part of the Series A-2 Financing, which closed in January 2013, the Series G convertible preferred stock warrants converted into common stock warrants. |
| • | In connection with the Company’s Series H preferred stock financing in 2011, the Company issued warrants to purchase 11,060 shares of the Company’s Series H convertible preferred stock at an |
F-26
Table of Contents
| exercise price of $21.495 per share. The warrants were immediately exercisable and expire on the earlier of July 2018, the Company’s initial public offering, or an acquisition of the Company. The warrants were initially valued at $0.1 million and recorded as preferred stock issuance costs, reducing the carrying amount of the Series H preferred stock. As part of the Series A-2 Financing, which closed in January 2013, the Series H convertible preferred stock warrants converted into common stock warrants. |
As of the dates below, outstanding convertible preferred stock warrants and associated fair values are as follows (in thousands, except share and per share amounts):
| Class of Shares |
Issuance Date(s) |
Expiration Date(s) |
No. of Shares |
Exercise Price per Share |
As of December 31, 2013 |
|||||||||||
| Series A-2 |
2013 | 2023 | 75,111 | $ | 5.19 | $ | 271 | |||||||||
|
|
|
|||||||||||||||
| Class of Shares |
Issuance Date(s) |
Expiration Date(s) |
No. of Shares |
Exercise Price per Share |
As of December 31, 2014 |
|||||||||||
| Series A-2 |
2013-2014 | 2023-2024 | 98,221 | $ | 5.19 | $ | 1,203 | |||||||||
|
|
|
|||||||||||||||
| Class of Shares |
Issuance Date(s) |
Expiration Date(s) |
No. of Shares |
Exercise Price per Share |
As of March 31, 2015 |
|||||||||||
| (Unaudited) | ||||||||||||||||
| Series A-2 |
2013-2014 | 2023-2024 | 98,221 | $ | 5.19 | $ | 1,042 | |||||||||
|
|
|
|||||||||||||||
The fair value of the preferred stock warrants was recorded as a warrant liability. The warrant is recorded at its estimated fair value utilizing an option-pricing valuation model with changes in the fair value of the warrant liability reflected in other income (expense), net. Upon the earlier of the exercise of the warrants or the completion of a liquidation event, including the completion of an initial public offering in which the shares underlying the warrants would convert from the related shares of preferred stock into shares of common stock, the preferred stock warrant liability will be remeasured to fair value and any remaining liability will be reclassified to additional paid-in capital.
During the years ended December 31, 2012, 2013 and 2014 and the three months ended March 31, 2014 and 2015, the Company recognized income (expense) in the amount of $0.1 million, $(0.04) million, $(0.8) million, $(0.04) million and $0.2 million, respectively, from the remeasurement of the fair value of the warrants, which was recorded through other income (expense), net in the consolidated statements of operations.
At each reporting date, the Company remeasures the convertible preferred stock warrant liabilities to fair value using an option-pricing model with the following assumptions:
| December 31, | March 31, 2015 |
|||||||||||
| 2013 | 2014 | |||||||||||
| (Unaudited) | ||||||||||||
| Series A-2 warrants (issued in September 2013): |
||||||||||||
| Expected term (in years) |
9.75 | 8.75 | 8.51 | |||||||||
| Risk-free interest rate |
3.04 | % | 2.17 | % | 2.10 | % | ||||||
| Expected volatility |
44 | % | 45 | % | 45 | % | ||||||
| Series A-2 warrants (issued in September 2014): |
||||||||||||
| Expected term (in years) |
— | 9.70 | 9.46 | |||||||||
| Risk-free interest rate |
— | 2.17 | % | 2.10 | % | |||||||
| Expected volatility |
— | 45 | % | 45 | % | |||||||
F-27
Table of Contents
Remaining contractual term—The remaining contractual term represents the time from the date of the valuation to the expiration of the warrant.
Risk-free interest rate—The risk-free interest rate is based on the U.S. Treasury yield in effect as of December 31, 2013 and 2014 and March 31, 2015 for zero coupon U.S. Treasury notes with maturities approximately equal to the term of the warrant.
Volatility—The volatility is derived from historical volatilities of several unrelated publicly listed peer companies over a period approximately equal to the term of the warrant because the Company has limited information on the volatility of the preferred stock since there is currently no trading history. When making the selections of industry peer companies to be used in the volatility calculation, the Company considered the size, operational and economic similarities to the Company’s principal business operations.
Common stock
Repurchase of common stock
During the year ended December 31, 2014, the Company canceled a total of 37,939 shares (including 16,000 fully paid shares) held by a former founder who had pledged such shares as collateral in connection with the purchase of 21,939 restricted shares with non-recourse notes amounting to $0.16 million. The notes were due for repayment in May 2014. All the 37,939 pledged shares were canceled up on non-repayment of the notes in May 2014. There were no such repurchases in the three months ended March 31, 2015.
Common stock reserved for issuance
The Company was authorized to issue 1,575,000,000 shares of common stock with a par value of $0.001 per share as of December 31, 2013 and 2014 and March 31, 2015. Each share of common stock is entitled to one vote. The holders of common stock are also entitled to receive dividends whenever funds are legally available and when declared by the Board of Directors, subject to the prior rights of holders of all classes of convertible preferred stock outstanding.
As of December 31, 2014 and March 31, 2015, the Company reserved shares of common stock for issuance as follows:
| December 31, | March 31, | |||||||
| 2014 | 2015 | |||||||
| (Unaudited) | ||||||||
| Options outstanding under stock option plan |
3,400,250 | 3,413,188 | ||||||
| Options available for future grant under stock option plan |
163,359 | 215,129 | ||||||
| Conversion of preferred stock |
5,145,683 | 5,145,683 | ||||||
| Warrants to purchase convertible preferred stock |
111,505 | 111,505 | ||||||
| Warrants to purchase common stock |
108,020 | 108,020 | ||||||
|
|
|
|
|
|||||
| Total |
8,928,817 | 8,993,525 | ||||||
|
|
|
|
|
|||||
Equity incentive plans
The Company recognizes stock-based compensation expense for all stock-based awards made to employees, nonemployees and directors, based on estimated fair values, net of an estimated forfeiture rate. The Company recognizes compensation cost for only those shares expected to vest on a straight-line basis over the requisite service period of the award.
In April 2010, the Company adopted the 2010 Equity Incentive Plan (2010 Plan), which was intended to be the successor to and continuation of the 2001 Stock Option Plan (2001 Plan) and provides for the issuance of incentive
F-28
Table of Contents
stock options, nonqualified stock options, restricted stock awards, restricted stock units and stock appreciation rights, which may be granted to employees, non-employee directors and consultants of the Company.
Under the 2001 Plan and the 2010 Plan, incentive stock options may be granted to employees, non-employee directors and consultants at exercise prices not lower than the fair value of the stock at the date of grant as determined by the Board of Directors. For incentive stock options granted to a person who, at the time of the grant, owns stock representing more than 10% of the total combined voting power of all classes of stock of the Company, the per share exercise price must be no less than 110% of the fair value on the date of the grant as determined by the Board of Directors.
Options vest at a rate determined by the Board of Directors and will expire no later than 10 years from the date of grant. Options granted to newly hired employees typically vest over 48 months with 25% vesting after 12 months and 75% vesting ratably over the following 36 months. Grants to existing employees typically vest in equal amounts monthly over a term of 48 months.
The 2001 Plan and the 2010 Plan allow for the issuance of restricted common stock upon early exercise of nonvested stock options subject to the repurchase right of the Company. The repurchase right lapses in accordance with the vesting schedule of the original option. To date, the Company has not issued any restricted stock, restricted stock units or stock appreciation rights under the 2010 Plan.
2015 Equity Incentive Plan
In February 2015, the Company’s board of directors adopted, subject to stockholders’ approval, the 2015 Equity Incentive Plan (2015 Plan). The 2015 Plan will become effective upon the execution and delivery of the underwriting agreement related to this offering. Once the 2015 Plan is effective, no further grants will be made under the 2010 Plan. The 2015 Plan provides for the grant of incentive stock options, or ISOs, nonstatutory stock options, or NSOs, stock appreciation rights, restricted stock awards, restricted stock unit awards, performance- based stock awards, and other forms of equity compensation, or collectively, stock awards, all of which may be granted to employees, including officers, non-employee directors and consultants of us and our affiliates. Additionally, the 2015 Plan provides for the grant of performance cash awards. ISOs may be granted only to employees. All other awards may be granted to employees, including officers, and to non-employee directors and consultants.
The Company has initially reserved 2,650,000 shares of the Company’s common stock for the issuance of awards under the 2015 Plan, plus the shares of the Company’s common stock remaining available for issuance under the Company’s 2010 Plan and any shares subject to outstanding stock options or other stock awards that were granted under the 2010 Plan that are forfeited, terminate, expire or are otherwise not issued. The 2015 Plan provides that the number of shares reserved and available for issuance under the plan will automatically increase on January 1, of each year beginning on January 1, 2016 and continuing and through and including January 1, 2025, by 5% of the outstanding number of shares of the Company’s capital stock on the immediately preceding December 31 or such lesser number of shares as determined by the Company’s board of directors. The maximum number of shares of common stock that may be issued upon the exercise of ISOs under the 2015 Plan is 31,000,000 shares.
2015 Employee Stock Purchase Plan
In February 2015, the Company’s board of directors adopted, subject to stockholders’ approval, the 2015 Employee Stock Purchase Plan (2015 ESPP). The 2015 ESPP will become effective immediately upon the execution and delivery of the underwriting agreement related to this offering. The 2015 ESPP initially reserves and authorizes the issuance of up to a total of 530,000 shares of common stock to participating employees. The 2015 ESPP provides that the number of shares reserved and available for issuance will automatically increase on January 1, beginning on January 1, 2016 through January 1, 2025, by the least of (1) 2% of the total number of
F-29
Table of Contents
shares of our capital stock outstanding on December 31 of the preceding calendar year, (2) 600,000 shares, or (3) a number determined by our board of directors that is less than (1) and (2).
Each employee who is a participant in the 2015 ESPP may purchase shares by authorizing payroll deductions of up to 15% of his or her base compensation during an offering period. Unless the participating employee has previously withdrawn from the offering, his or her accumulated payroll deductions will be used to purchase shares on the last business day of the offering period at a price equal to 85% of the fair market value of the shares on the first business day or the last business day of the offering period, whichever is lower. Under applicable tax rules, an employee may purchase no more than $25,000 worth of shares of common stock, valued at the start of the purchase period, under the 2015 ESPP in any calendar year.
Early exercise of stock options
The Company typically allows employees to exercise options granted under the 2010 Plan prior to vesting. The unvested shares are subject to the Company’s repurchase right at the original purchase price. The proceeds initially are recorded as an accrued liability from the early exercise of stock options, and reclassified to common stock as the Company’s repurchase right lapses. There were no early exercises of stock options during the years ended December 31, 2012 and 2013. The Company has issued common stock of 231,224 shares during the year ended December 31, 2014 for stock options exercised prior to vesting. At December 31, 2014, 199,945 shares held by employees and directors were subject to repurchase at an aggregate price of $0.3 million. At March 31, 2015, 178,059 shares held by employees and directors were subject to repurchase at an aggregate price of $0.3 million.
A summary of the activity under the Company’s stock plans and changes during the reporting periods and a summary of information related to options exercisable, vested and expected to vest are presented below (in thousands, except share, per share and contractual life data):
| Shares available for future grant |
Options outstanding |
Weighted average exercise price |
Weighted- Average Contractual Life (years) |
Aggregate Intrinsic Value |
||||||||||||||||
| Balance, January 1, 2014 |
718,961 | 2,922,812 | $ | 0.75 | 9.02 | $ | 1,096 | |||||||||||||
| Authorized |
373,615 | — | — | |||||||||||||||||
| Options cancelled |
161,867 | (161,867 | ) | 1.16 | ||||||||||||||||
| Options granted |
(1,091,084 | ) | 1,091,084 | 2.12 | ||||||||||||||||
| Options exercised |
— | (451,779 | ) | 1.21 | ||||||||||||||||
|
|
|
|
|
|||||||||||||||||
| Balance, December 31, 2014 |
163,359 | 3,400,250 | $ | 1.11 | 8.50 | $ | 36,320 | |||||||||||||
| Authorized |
105,641 | — | — | |||||||||||||||||
| Options cancelled |
34,629 | (34,629 | ) | 0.75 | ||||||||||||||||
| Options granted |
(88,500 | ) | 88,500 | 11.79 | ||||||||||||||||
| Options exercised |
— | (40,933 | ) | 0.93 | ||||||||||||||||
|
|
|
|
|
|||||||||||||||||
| Balance, March 31, 2015 (unaudited) |
215,129 | 3,413,188 | $ | 1.39 | 8.19 | $ | 36,074 | |||||||||||||
|
|
|
|
|
|||||||||||||||||
| Vested and expected to vest (unaudited) |
3,086,468 | $ | 1.29 | 8.09 | $ | 32,936 | ||||||||||||||
|
|
|
|||||||||||||||||||
| Options vested (unaudited) |
2,150,093 | $ | 0.79 | 7.61 | $ | 24,020 | ||||||||||||||
|
|
|
|||||||||||||||||||
The weighted-average grant date fair value per share of employee options granted during the years ended December 31, 2012, 2013 and 2014 and the three months ended March 31, 2014 and 2015 was $0.19, $0.34, $1.96, $0.80 and $5.07, respectively. The intrinsic value of the vested employee options exercised was immaterial during the years ended December 31, 2012 and 2013, $1.7 million for the year ended December 31, 2014, and $0.01 million and $0.5 million for the three months ended March 31, 2014 and 2015, respectively.
F-30
Table of Contents
Stock-based compensation
The Company records stock-based compensation awards based on fair value as of the grant date using the Black-Scholes option-pricing model. The Company recognizes such costs as compensation expense on a straight-line basis over the employee’s requisite service period, which is generally four years. The Company determined valuation assumptions as follows:
Fair value of common stock
Given the absence of a public trading market, the Company’s Board of Directors considered numerous objective and subjective factors to determine the fair value of the Company’s common stock at each meeting at which awards were approved. These factors included, but were not limited to (i) independent contemporaneous valuations of common stock; (ii) the rights and preferences of convertible preferred stock relative to common stock; (iii) the lack of marketability of common stock; (iv) developments in the business; and (v) the likelihood of achieving a liquidity event, such as an initial public offering or sale of the Company, given prevailing market conditions.
Risk-free interest rate
The Company bases the risk-free interest rate used in the Black-Scholes option-pricing model on the implied yield available on U.S. Treasury zero-coupon issues with an equivalent expected term of the options for each option group.
Expected term
The expected term represents the period that the Company’s stock-based awards are expected to be outstanding. The expected term assumption is based on the simplified method as described in SEC Staff Accounting Bulletin No. 110, Share-Based Payment. The Company expects to continue using the simplified method until sufficient information about the Company’s historical behavior is available.
Volatility
The Company determines the price volatility factor based on the historical volatilities of the Company’s peer group as the Company did not have trading history for its common stock.
Dividend yield
The Company has never declared or paid any cash dividend and does not currently plan to pay a cash dividend in the foreseeable future. Consequently, the Company used an expected dividend yield of zero.
The following table summarizes the assumptions used in the Black-Scholes option-pricing model to determine fair value of the Company’s stock options:
| Year Ended December 31, | Three Months Ended March 31, | |||||||||
| 2012 | 2013 | 2014 | 2014 | 2015 | ||||||
| (Unaudited) | ||||||||||
| Fair value per share of common |
$0.75 | $0.75 | $1.28 – $8.83 | $1.28 | $11.81 | |||||
| Expected volatility |
54% | 46% | 46% – 49% | 49% | 43% | |||||
| Expected life in years |
6.08 | 5.77 – 6.08 | 6.08 | 6.08 | 6.08 | |||||
| Risk-free interest rate |
1.01% – 1.17% | 1.08% – 1.35% | 1.78% – 1.93% | 1.78% | 1.38% | |||||
| Dividend yield |
— | — | — | — | — | |||||
F-31
Table of Contents
As of December 31, 2014 and March 31, 2015, total compensation cost related to unvested stock-based awards granted to employees under the Company’s stock plans but not yet recognized was $1.3 million and $1.7 million, net of estimated forfeitures, respectively. This cost is expected to be amortized on a straight-line basis over a weighted-average period of 2.57 years and 2.63 years as of December 31, 2014 and March 31, 2015, respectively. Future grants will increase the amount of compensation expense to be recorded in future periods. As of December 31, 2014 and March 31, 2015, total compensation cost related to unvested stock-based awards granted to non-employees under the Company’s stock plans was $0.8 million and $0.6 million.
Stock-based compensation expense included in the accompanying consolidated statements of operations as follows (in thousands):
| Year Ended December 31, | Three Months Ended March 31, | |||||||||||||||||||
| 2012 | 2013 | 2014 | 2014 | 2015 | ||||||||||||||||
| (Unaudited) | ||||||||||||||||||||
| Cost of product revenues |
$ | 1 | $ | 5 | $ | 5 | $ | 1 | $ | 1 | ||||||||||
| Research and development |
75 | 256 | 485 | 33 | 141 | |||||||||||||||
| Sales and marketing |
17 | 485 | 286 | 12 | 70 | |||||||||||||||
| General and administrative |
150 | 573 | 558 | 40 | 136 | |||||||||||||||
|
|
|
|
|
|
|
|
|
|
|
|||||||||||
| Total stock-based compensation |
$ | 243 | $ | 1,319 | $ | 1,334 | $ | 86 | $ | 348 | ||||||||||
|
|
|
|
|
|
|
|
|
|
|
|||||||||||
Repricing of Options
During the year ended December 31, 2013, the Company repriced a total of 581,285 outstanding options by way of canceling existing outstanding option grants at an exercise price of $2.25 in exchange for new option grants at an exercise price of $0.75. Except for the change in exercise price, the new options had the same terms and conditions as the original options, including the contractual term, vesting schedule and the vesting start date. As a result of such modification, the Company expensed incremental stock compensation on the date of modification of $0.1 million relating to options that were already vested, and another $0.04 million relating to the options that were unvested was expensed over the remaining vesting term of the new options.
7. Income taxes
Provision for (benefit from) income taxes was approximately $0.4 million and $(0.01) million for the three months ended March 31, 2014 and 2015, respectively. The change in provision for income taxes and effective tax rate was primarily due to a higher proportion of the Company’s fiscal year 2015 earnings being generated from lower tax rate countries.
The Company’s book income (loss) before income taxes for the years ended December 31, 2012, 2013 and 2014 were as follows (in thousands):
| Year Ended December 31, | ||||||||||||
| 2012 | 2013 | 2014 | ||||||||||
| Domestic |
$ | (9,115 | ) | $ | (3,668 | ) | $ | 456 | ||||
| Foreign |
(6,187 | ) | (4,130 | ) | 1,613 | |||||||
|
|
|
|
|
|
|
|||||||
| Total |
$ | (15,302 | ) | $ | (7,798 | ) | $ | 2,069 | ||||
|
|
|
|
|
|
|
|||||||
F-32
Table of Contents
The Company’s provision for income taxes were as follows (in thousands):
| Year Ended December 31, | ||||||||||||
| 2012 | 2013 | 2014 | ||||||||||
| Current: |
||||||||||||
| Federal |
$ | — | $ | — | $ | 3,159 | ||||||
| State |
1 | — | — | |||||||||
| Foreign |
82 | 67 | 65 | |||||||||
|
|
|
|
|
|
|
|||||||
| Total current |
83 | 67 | 3,224 | |||||||||
|
|
|
|
|
|
|
|||||||
| Deferred: |
||||||||||||
| Federal |
— | — | — | |||||||||
| State |
— | — | — | |||||||||
| Foreign |
(26 | ) | (23 | ) | (8 | ) | ||||||
|
|
|
|
|
|
|
|||||||
| Total current |
(26 | ) | (23 | ) | (8 | ) | ||||||
|
|
|
|
|
|
|
|||||||
| Provision for income taxes |
$ | 57 | $ | 44 | $ | 3,216 | ||||||
|
|
|
|
|
|
|
|||||||
Deferred tax assets and liabilities reflect the net tax effects of temporary differences between the carrying amounts of assets and liabilities for financial reporting purposes and the amounts used for income tax purposes. Significant components of the Company’s deferred tax assets are as follows (in thousands):
| As of December 31, | ||||||||
| 2013 | 2014 | |||||||
| Deferred tax assets: |
||||||||
| Net operating loss carryforwards |
$ | 5,151 | $ | 3,939 | ||||
| Other accruals |
880 | |
929 |
| ||||
| Research and development credits |
726 | 721 | ||||||
| Stock-based compensation expense |
230 | 291 | ||||||
|
|
|
|
|
|||||
| Total deferred tax assets |
6,987 | 5,880 | ||||||
| Valuation allowance |
(6,900 | ) | (5,674 | ) | ||||
|
|
|
|
|
|||||
| Net deferred tax assets |
87 | 206 | ||||||
|
|
|
|
|
|||||
| Deferred tax liabilities: |
||||||||
| Accruals and reserves |
(87 | ) | (177 | ) | ||||
|
|
|
|
|
|||||
| Total deferred tax liabilities |
(87 | ) | (177 | ) | ||||
|
|
|
|
|
|||||
| Total net deferred tax assets |
$ | — | 29 | |||||
|
|
|
|
|
|||||
F-33
Table of Contents
Reconciliation of the statutory federal income tax to the Company’s effective tax is as follows (in thousands):
| As of December 31, | ||||||||||||
| 2012 | 2013 | 2014 | ||||||||||
| Tax at statutory federal rate |
$ | (5,203 | ) | $ | (2,651 | ) | $ | 704 | ||||
| State tax, net of federal benefit |
(722 | ) | (76 | ) | (29 | ) | ||||||
| Stock compensation expense |
72 | 376 | 279 | |||||||||
| Imputed interest |
334 | 517 | 515 | |||||||||
| Permanent differences |
(3 | ) | (9 | ) | 282 | |||||||
| Foreign tax rate differential |
2,161 | 1,448 | (492 | ) | ||||||||
| Change in valuation allowance |
3,437 | 604 | (1,225 | ) | ||||||||
| Tax credit not benefitted |
— | (223 | ) | (94 | ) | |||||||
| Uncertain tax position |
— | — | 3,275 | |||||||||
| Other |
(19 | ) | 58 | 1 | ||||||||
|
|
|
|
|
|
|
|||||||
| Provision for income taxes |
$ | 57 | $ | 44 | $ | 3,216 | ||||||
|
|
|
|
|
|
|
|||||||
Realization of deferred tax assets is dependent upon future earnings, if any, the timing and amount of which are uncertain. Accordingly, the net deferred tax assets have been fully offset by a valuation allowance. The valuation allowance decreased in 2014 by $1.2 million.
As of December 31, 2014, the Company had, before consideration of the Section 382 limitation discussed below, net operating loss carryforwards for federal income tax purposes of $66.6 million, which expire beginning in the year 2024 and federal research and development tax credits of $1.4 million, which expire beginning in the year 2026.
As of December 31, 2014, the Company had, before consideration of the Section 382 limitation discussed below, net operating loss carryforwards for state income tax purposes of $76.9 million which expire beginning in the year 2015 and state research and development tax credits of $1.6 million which do not expire.
Section 382 of the U.S. Internal Revenue Code generally imposes an annual limitation on the amount of net operating loss carryforwards that might be used to offset taxable income when a corporation has undergone significant changes in stock ownership. The Company performed a Section 382 analysis and believed ownership changes occurred on July 25, 2011 and December 13, 2012. The annual limitations under Section 382 are $0.1 million and $1.1 million, respectively. The Company believes that $57.7 million of the $66.6 million federal losses and $59.7 million of the $76.9 million state losses will expire unused due to Section 382 limitations. The Company will not be able to use a significant portion of the NOLs in the near term to offset tax liabilities due to the application of the annual limitation. In addition to the NOL limitation, the Company believes that $0.9 million of the $1.4 million of the federal research and development tax credit carryover will also expire unused due to the 382 limitation.
| NOLs through July 25, 2011 |
NOLs through December 13, 2012 |
|||||||
| (In thousands) | ||||||||
| Total pre-change NOLs subject to change |
$ | 58,710 | $ | 68,808 | ||||
| Total pre-change NOLs that can be used |
(1,013 | ) | (11,111 | ) | ||||
|
|
|
|
|
|||||
| Expiring NOLs |
$ | 57,697 | $ | 57,697 | ||||
|
|
|
|
|
|||||
Undistributed earnings of the Company’s foreign subsidiaries amounted to approximately $1.2 million at December 31, 2014. These earnings are considered to be permanently reinvested and accordingly, no deferred US income taxes have been provided thereon.
F-34
Table of Contents
As of December 31, 2014, the Company has unrecognized tax benefits of $4.3 million, of which $3.2 million will affect the annual effective tax rate if recognized and $1.1 million is subject to a valuation allowance and will not affect the annual effective tax rate when it is recognized.
It is the Company’s policy to recognize interest and penalties related to income tax matters in income tax expense. As of December 31, 2014, the Company had no accrued interest and penalties related to uncertain tax positions.
The Company files U.S., state and foreign income tax returns with varying statutes of limitations. The tax years from 2001 to 2014 remain open to examination due to the carryover of unused net operating losses and tax credits.
The Company does not expect any material changes to the estimated amount of liability associated with its uncertain tax positions within the next 12 months.
The following table summarizes the activity related to unrecognized tax benefits (in thousands):
| Year Ended December 31, | ||||||||||||
| 2012 | 2013 | 2014 | ||||||||||
| Unrecognized benefit - beginning of period |
$ | — | $ | 495 | $ | 913 | ||||||
| Gross increases - prior period tax positions |
432 | 32 | — | |||||||||
| Gross increases - current period tax positions |
63 | 386 | 3,432 | |||||||||
|
|
|
|
|
|
|
|||||||
| Unrecognized benefit - end of period |
$ | 495 | $ | 913 | $ | 4,345 | ||||||
|
|
|
|
|
|
|
|||||||
F-35
Table of Contents
8. Net income (loss) per share
The Company’s basic net income (loss) per share attributable to common stockholders is calculated by dividing the net income (loss) attributable to common stockholders by the weighted-average common shares outstanding for the period, without consideration for potentially dilutive securities. The diluted net income (loss) per share attributable to common stockholders is computed by dividing the net income (loss) attributable to common stockholders for purposes of calculating diluted net income (loss) per share by weighted average number of common shares and potentially dilutive common stock equivalents outstanding for the period determined using the treasury-stock and if-converted methods. The following is a summary of the numerator and denominator of the basic and diluted net income (loss) per share attributable to common stockholders under the two-class method (in thousands, except share and per share data):
| Year Ended December 31, | Three Months Ended March 31, |
|||||||||||||||||||
| 2012 | 2013 | 2014 | 2014 | 2015 | ||||||||||||||||
| (Unaudited) | ||||||||||||||||||||
| Numerator: |
||||||||||||||||||||
| Basic: |
||||||||||||||||||||
| Net income (loss) |
$ | (15,359 | ) | $ | (7,842 | ) | $ | (1,147 | ) | $ | 401 | $ | 706 | |||||||
| Add/(Less): Capital contribution from/(deemed dividend to) common stockholders |
83,386 | (338 | ) | — | — | — | ||||||||||||||
| Less: Undistributed earnings allocated to preferred stockholders |
— | — | — | (401 | ) | (706 | ) | |||||||||||||
|
|
|
|
|
|
|
|
|
|
|
|||||||||||
| Net income (loss) attributable to common stockholders, basic |
$ | 68,027 | $ | (8,180 | ) | $ | (1,147 | ) | $ | — | $ | — | ||||||||
|
|
|
|
|
|
|
|
|
|
|
|||||||||||
| Diluted: |
||||||||||||||||||||
| Net income (loss) attributable to common stockholders |
$ | 68,027 | $ | (8,180 | ) | $ | (1,147 | ) | $ | — | $ | — | ||||||||
| Dilutive impact of capital contributions related to preferred stock transactions |
(83,386 | ) | — | — | — | — | ||||||||||||||
|
|
|
|
|
|
|
|
|
|
|
|||||||||||
| Net loss attributable to common stockholders, diluted |
$ | (15,359 | ) | $ | (8,180 | ) | $ | (1,147 | ) | $ | — | $ | — | |||||||
|
|
|
|
|
|
|
|
|
|
|
|||||||||||
| Denominator: |
||||||||||||||||||||
| Basic shares: |
||||||||||||||||||||
| Weighted average shares used in computing net income (loss) per share attributable common stockholders, basic |
318,249 | 9,066,797 | 9,518,377 | 9,436,046 | 9,682,424 | |||||||||||||||
|
|
|
|
|
|
|
|
|
|
|
|||||||||||
| Diluted shares: |
||||||||||||||||||||
| Weighted average shares used in computing basic net loss per share |
318,249 | 9,066,797 | 9,518,377 | 9,436,046 | 9,682,424 | |||||||||||||||
| Effect of potentially dilutive securities convertible preferred stock (Series A-H) |
3,468,054 | — | — | — | — | |||||||||||||||
|
|
|
|
|
|
|
|
|
|
|
|||||||||||
| Weighted average shares used in computing diluted net loss per share |
3,786,303 | 9,066,797 | 9,518,377 | 9,436,046 | 9,682,424 | |||||||||||||||
|
|
|
|
|
|
|
|
|
|
|
|||||||||||
| Net income (loss) per share attributable to common stockholders: |
||||||||||||||||||||
| Basic |
$ | 213.75 | $ | (0.90 | ) | $ | (0.12 | ) | $ | — | $ | — | ||||||||
| Diluted |
$ | (4.06 | ) | $ | (0.90 | ) | $ | (0.12 | ) | $ | — | $ | — | |||||||
F-36
Table of Contents
The following outstanding potentially dilutive securities were excluded from the computation of diluted net income per share available to common stockholders for the periods presented because including them would have been anti-dilutive:
| Year Ended December 31, | Three Months Ended March 31, |
|||||||||||||||||||
| 2012 | 2013 | 2014 | 2014 | 2015 | ||||||||||||||||
| (Unaudited) | ||||||||||||||||||||
| Stock options to purchase common stock |
684,400 | 2,922,812 | 3,400,250 | 3,012,967 | 3,413,188 | |||||||||||||||
| Convertible preferred stock |
1,217,597 | 4,532,662 | 4,532,662 | 4,532,662 | 4,532,662 | |||||||||||||||
| Convertible preferred stock warrants |
108,020 | 75,111 | 98,221 | 75,111 | 98,221 | |||||||||||||||
| Common stock warrants |
— | 108,020 | 108,020 | 108,020 | 108,020 | |||||||||||||||
|
|
|
|
|
|
|
|
|
|
|
|||||||||||
| Total |
2,010,017 | 7,638,605 | 8,139,153 | 7,728,760 | 8,152,091 | |||||||||||||||
|
|
|
|
|
|
|
|
|
|
|
|||||||||||
Unaudited pro forma net income (loss) per share
Pro forma basic and diluted net income (loss) per share have been computed to give effect, even if antidilutive, to the conversion of the Company’s preferred stock into common stock as of the beginning of the period presented or the original issuance date, if later.
The following table shows the Company’s calculation of the unaudited pro forma basic and diluted net income (loss) per share (in thousands, except per share data):
| Year Ended December 31, 2014 |
Three Months Ended March 31, 2015 |
|||||||
| (Unaudited) | (Unaudited) | |||||||
| Numerator: |
||||||||
| Net income (loss) |
$ | (1,147 | ) | $ | 706 | |||
| Change in fair value of convertible preferred stock warrants |
783 | (161 | ) | |||||
|
|
|
|
|
|||||
| Net income (loss) used in computing pro forma net income (loss) per share attributable to common stockholders, basic and diluted |
$ | (364 | ) | $ | 545 | |||
|
|
|
|
|
|||||
| Denominator, basic: |
||||||||
| Weighted average shares used in computing net income (loss) per share attributable to common stockholders, basic |
9,518,377 | 9,682,424 | ||||||
| Pro forma adjustment to reflect automatic conversion of convertible preferred stock |
5,145,683 | 5,145,683 | ||||||
|
|
|
|
|
|||||
| Weighted average shares used in computing pro forma net income (loss) per share attributable to common stockholders, basic |
14,664,060 | 14,828,107 | ||||||
|
|
|
|
|
|||||
| Denominator, diluted |
||||||||
| Weighted average shares used in computing net income (loss) per share attributable to common stockholders, diluted |
9,518,377 | 9,682,424 | ||||||
| Pro forma adjustments to reflect automatic conversion of convertible preferred stock |
5,145,683 | 5,145,683 | ||||||
| Weighted average dilutive effect of options to purchase common stock |
— | 2,931,439 | ||||||
| Weighted average dilutive effect of convertible preferred stock warrants |
— | 68,565 | ||||||
|
|
|
|
|
|||||
| Weighted average shares used in computing pro forma net income (loss) per share attributable to common stockholders, diluted |
14,664,060 | 17,828,111 | ||||||
|
|
|
|
|
|||||
| Pro forma net income (loss) per share attributable to common stockholders: |
||||||||
| Basic |
$ | (0.02 | ) | $ | 0.04 | |||
| Diluted |
$ | (0.02 | ) | $ | 0.03 | |||
F-37
Table of Contents
9. Segment information
The Company reports information about the segments of its business based on how the information is used by the chief operating decision maker (CODM) in deciding how to allocate resources and in assessing performance. The Company has determined that it operates in a single reportable segment. The single reportable segment is based upon the Company’s internal organizational structure, the manner in which the operations are managed, the criteria used by the CODM to evaluate segment performance, and the availability of separate financial information. The following table represents the Company’s revenues based on the billing address of the customer (in thousands):
| Year Ended December 31, | Three Months Ended March 31, | |||||||||||||||||||
| 2012 | 2013 | 2014 | 2014 | 2015 | ||||||||||||||||
| (Unaudited) | ||||||||||||||||||||
| United States |
$ | 1,199 | $ | 788 | $ | 1,302 | $ | 524 | $ | 50 | ||||||||||
| Rest of Americas |
821 | 336 | 166 | 100 | — | |||||||||||||||
| Sweden |
3,218 | 3,849 | 27,613 | 1,920 | 15,535 | |||||||||||||||
| Estonia |
1,790 | 7,578 | 6,531 | 2,488 | * | |||||||||||||||
| Rest of Europe |
1,258 | 1,838 | 33 | 33 | 369 | |||||||||||||||
| China |
1,614 | 6,680 | 26,519 | 7,509 | 2,614 | |||||||||||||||
| Thailand |
1,604 | 5,653 | * | * | — | |||||||||||||||
| Japan |
1,397 | * | * | * | * | |||||||||||||||
| Rest of Asia Pacific |
782 | 3,055 | 5,216 | 1,003 | 1,507 | |||||||||||||||
|
|
|
|
|
|
|
|
|
|
|
|||||||||||
| Total revenues |
$ | 13,683 | $ | 29,777 | $ | 67,380 | $ | 13,577 | $ | 20,075 | ||||||||||
|
|
|
|
|
|
|
|
|
|
|
|||||||||||
| * | less than 10% |
Substantially all of the Company’s long-lived assets were attributable to operations in the United States as of December 31, 2012, 2013 and 2014 and March 31, 2014 and 2015.
10. Employee benefit plan
The Company has established a 401(k) tax-deferred savings plan (the 401(k) Plan), which permits participants to make contributions by salary deduction pursuant to Section 401(k) of the Internal Revenue Code of 1986, as amended. The Company is responsible for administrative costs of the 401(k) Plan and has made no contributions to the 401(k) Plan since inception.
11. Other related party transactions and balances
As of December 31, 2013 and 2014 and March 31, 2015, the Company had one customer that was also an investor, owning 1,925,947 shares of Series A-2 convertible preferred stock. Sales to this customer, including sales to contract manufacturers or ODMs at the direction of such customer, accounted for $1.6 million, $9.8 million and $21.0 million of revenues during the years ended December 31, 2012, 2013 and 2014, respectively, and $4.1 million and $3.2 million for the three months ended March 31, 2014 and 2015. Amounts due from this customer related to the above sales were $0.2 million as of December 31, 2012, were not significant as of December 31, 2013 and 2014 and March 31, 2014, and were $0.1 million as of March 31, 2015.
In connection with our transactions with the above customer, the Company offset against research and development expenses an amount of $0.5 million, $1.3 million and $1.5 million for the years ended December 31, 2012, 2013 and 2014, respectively, and $0 and $0.2 million for the three months ended March 31, 2014 and 2015, respectively.
The Company has also entered into consulting agreements with certain members of its Board of Directors.
F-38
Table of Contents
PART II
INFORMATION NOT REQUIRED IN PROSPECTUS
Item 13. Other Expenses of Issuance and Distribution.
The following table sets forth all costs and expenses, other than underwriting discounts and commissions, payable by eASIC Corporation. (the “Registrant”) in connection with the sale of the common stock being registered. All amounts shown are estimates except for the Securities and Exchange Commission (“SEC”) registration fee, the Financial Industry Regulatory Authority, Inc. (“FINRA”) filing fee and the NASDAQ Global Market listing fee.
| AMOUNT TO BE PAID | ||||
| SEC registration fee |
$ | 8,715 | ||
| FINRA filing fee |
11,750 | |||
| NASDAQ Global Market listing fee |
125,000 | |||
| Printing and engraving expenses |
* | |||
| Legal fees and expenses |
* | |||
| Accounting fees and expenses |
* | |||
| Transfer agent and registrar fees and expenses |
* | |||
| Miscellaneous expenses |
* | |||
|
|
|
|||
| Total |
* | |||
|
|
|
|||
| * | To be provided by amendment. |
Item 14. Indemnification of Directors and Officers.
The Registrant is incorporated under the laws of the State of Delaware. Section 145 of the Delaware General Corporation Law provides that a Delaware corporation may indemnify any persons who were, are, or are threatened to be made, parties to any threatened, pending or completed action, suit or proceeding, whether civil, criminal, administrative or investigative (other than an action by or in the right of such corporation), by reason of the fact that such person is or was an officer, director, employee or agent of such corporation, or is or was serving at the request of such corporation as an officer, director, employee or agent of another corporation or enterprise. The indemnity may include expenses (including attorneys’ fees), judgments, fines and amounts paid in settlement actually and reasonably incurred by such person in connection with such action, suit or proceeding, provided that such person acted in good faith and in a manner he or she reasonably believed to be in or not opposed to the corporation’s best interests and, with respect to any criminal action or proceeding, had no reasonable cause to believe that his or her conduct was illegal. A Delaware corporation may indemnify any persons who were, are, or are threatened to be made, a party to any threatened, pending or completed action or suit by or in the right of the corporation by reason of the fact that such person is or was a director, officer, employee or agent of such corporation, or is or was serving at the request of such corporation as a director, officer, employee or agent of another corporation or enterprise. The indemnity may include expenses (including attorneys’ fees) actually and reasonably incurred by such person in connection with the defense or settlement of such action or suit provided such person acted in good faith and in a manner he or she reasonably believed to be in or not opposed to the corporation’s best interests except that no indemnification is permitted without judicial approval if the officer or director is adjudged to be liable to the corporation. Where an officer or director is successful on the merits or otherwise in the defense of any action referred to above, the corporation must indemnify him or her against the expenses (including attorneys’ fees) actually and reasonably incurred.
The Registrant’s amended and restated certificate of incorporation provides for the indemnification of its directors to the fullest extent permitted under the Delaware General Corporation Law. The Registrant’s amended and restated bylaws provide for the indemnification of its directors and officers to the fullest extent permitted under the Delaware General Corporation Law. Each of the Registrant’s amended and restated certificate of incorporation and amended and restated bylaws will become effective upon the closing of this offering.
II-1
Table of Contents
Section 102(b)(7) of the Delaware General Corporation Law permits a corporation to provide in its certificate of incorporation that a director of the corporation shall not be personally liable to the corporation or its stockholders for monetary damages for breach of fiduciary duties as a director, except for liability for any:
| • | transaction from which the director derives an improper personal benefit; |
| • | act or omission not in good faith or that involves intentional misconduct or a knowing violation of law; |
| • | unlawful payment of dividends or redemption of shares; or |
| • | breach of a director’s duty of loyalty to the corporation or its stockholders. |
The Registrant’s amended and restated certificate of incorporation includes such a provision. Under the Registrant’s amended and restated bylaws, expenses incurred by any director or officers in defending any such action, suit or proceeding in advance of its final disposition shall be paid by the Registrant upon delivery to it of an undertaking, by or on behalf of such director or officer, to repay all amounts so advanced if it shall ultimately be determined that such director or officer is not entitled to be indemnified by the Registrant, as long as such undertaking remains required by the Delaware General Corporation Law.
Section 174 of the Delaware General Corporation Law provides, among other things, that a director who willfully or negligently approves of an unlawful payment of dividends or an unlawful stock purchase or redemption, may be held liable for such actions. A director who was either absent when the unlawful actions were approved or dissented at the time may avoid liability by causing his or her dissent to such actions to be entered in the books containing minutes of the meetings of the board of directors at the time such action occurred or immediately after such absent director receives notice of the unlawful acts.
As permitted by the Delaware General Corporation Law, the Registrant has entered into indemnity agreements with each of its directors and officers that require the Registrant to indemnify such persons against any and all costs and expenses (including attorneys’, witness or other professional fees) actually and reasonably incurred by such persons in connection with any action, suit or proceeding (including derivative actions), whether actual or threatened, to which any such person may be made a party by reason of the fact that such person is or was a director or officer or is or was acting or serving as an officer, director, employee or agent of the Registrant or any of its affiliated enterprises. Under these agreements, the Registrant is not required to provide indemnification for certain matters, including:
| • | indemnification beyond that permitted by the Delaware General Corporation Law; |
| • | indemnification for any proceeding with respect to the unlawful payment of remuneration to the director or officer; |
| • | indemnification for certain proceedings involving a final judgment that the director or officer is required to disgorge profits from the purchase or sale of the Registrant’s stock; |
| • | indemnification for proceedings involving a final judgment that the director’s or officer’s conduct was in bad faith, knowingly fraudulent or deliberately dishonest or constituted willful misconduct (but only to the extent of such specific determination) or a breach of his or her duty of loyalty or resulting in any personal profit or advantage to which the director or officer is not legally entitled; |
| • | indemnification for proceedings or claims brought by an officer or director against the Registrant or any of the Registrant’s directors, officers, employees or agents, except for (i) claims to establish or enforce a right of indemnification, (ii) claims approved by the Registrant’s board of directors, or (iii) claims required by law; |
| • | indemnification for settlements the director or officer enters into without the Registrant’s consent; or |
| • | indemnification in violation of any undertaking required by the Securities Act of 1933, as amended (the “Securities Act”) or in any registration statement filed by the Registrant. |
The indemnification agreements also set forth certain procedures that will apply in the event of a claim for indemnification thereunder.
II-2
Table of Contents
There is at present no pending litigation or proceeding involving any of the Registrant’s directors or executive officers as to which indemnification is required or permitted, and the Registrant is not aware of any threatened litigation or proceeding that may result in a claim for indemnification.
The Registrant has an insurance policy in place that covers its officers and directors with respect to certain liabilities, including liabilities arising under the Securities Act or otherwise.
The Registrant plans to enter into an underwriting agreement which provides that the underwriters are obligated, under some circumstances, to indemnify the Registrant’s directors, officers and controlling persons against specified liabilities, including liabilities under the Securities Act.
Item 15. Recent Sales of Unregistered Securities.
The following sets forth information regarding all unregistered securities sold by the Registrant since January 1, 2012:
| (1) | From January 1, 2012 to April 30, 2015, we granted stock options to purchase an aggregate of 4,148,151 shares of common stock at exercise prices ranging from $0.75 to $11.79 per share to a total of 151 employees, consultants and directors under our 2010 Plan. Of these options, options to purchase 537,793 shares have been exercised for cash consideration in the aggregate amount of $662,570.67, options to purchase 226,121 shares have been cancelled without being exercised and options to purchase 3,384,237 shares remain outstanding. The above numbers do not reflect the stock options to purchase an aggregate of 48,500 shares of common stock that our Compensation Committee has approved to be granted to two employees in connection with the pricing of our initial public offering with an exercise price equal to the initial public offering price. |
| (2) | From December 2012 through July 2013, we issued 4,532,662 shares of Series A-2 preferred stock to accredited investors at a price per share of approximately $5.20 for an aggregate purchase price of $23,534,898. |
| (3) | From December 2012 through January 2013, in connection with the issuance and sale of Series A-2 preferred stock, we issued 533,301 shares of Series A-1 preferred stock and 9,121,442 shares of common stock to accredited investors in exchange for then outstanding preferred stock. |
| (4) | On May 30, 2013, we issued and sold convertible promissory notes in the aggregate principal amount of $1,500,000 to accredited investors, for an aggregate purchase price of $1,500,000. |
| (5) | From June 2012 to October 2012, we issued and sold convertible promissory notes in an aggregate principal amount of $4,068,646 to accredited investors for an aggregate purchase price of $4,068,646. |
The offers, sales and issuances of the securities described in paragraphs (1) through (5) above were deemed to be exempt from registration under the Securities Act in reliance on Section 4(2) of the Securities Act and Rule 506 promulgated under Regulation D promulgated thereunder as transactions by an issuer not involving a public offering. The recipients of securities in each of these transactions acquired the securities for investment only and not with a view to or for sale in connection with any distribution thereof and appropriate legends were affixed to the securities issued in these transactions. Each of the recipients of securities in these transactions was an accredited investor within the meaning of Rule 501 of Regulation D under the Securities Act and had adequate access, through employment, business or other relationships, to information about the Registrant. No underwriters were involved in these transactions.
The offers, sales and issuances of the securities described in paragraph (1) above were deemed to be exempt from registration under the Securities Act in reliance on Rule 701 in that the transactions were under compensatory benefit plans and contracts relating to compensation as provided under Rule 701. The recipients of such securities were employees, directors or bona fide consultants of the Registrant and received the securities
II-3
Table of Contents
under the Registrant’s EIP. Appropriate legends were affixed to the securities issued in these transactions. Each of the recipients of securities in these transactions had adequate access, through employment, business or other relationships, to information about the Registrant.
Item 16. Exhibits and Financial Statement Schedules.
(a) Exhibits.
The list of exhibits is set forth under “Exhibit Index” at the end of this registration statement and is incorporated herein by reference.
(b) Financial Statement Schedules.
No financial statement schedules are provided because the information called for is not required or is shown either in the financial statements or the notes thereto.
Item 17. Undertakings.
The undersigned Registrant hereby undertakes to provide to the underwriters at the closing specified in the underwriting agreement certificates in such denominations and registered in such names as required by the underwriters to permit prompt delivery to each purchaser.
Insofar as indemnification for liabilities arising under the Securities Act may be permitted to directors, officers and controlling persons of the Registrant pursuant to the foregoing provisions, or otherwise, the Registrant has been advised that in the opinion of the SEC such indemnification is against public policy as expressed in the Securities Act and is, therefore, unenforceable. In the event that a claim for indemnification against such liabilities (other than the payment by the Registrant of expenses incurred or paid by a director, officer, or controlling person of the Registrant in the successful defense of any action, suit or proceeding) is asserted by such director, officer or controlling person in connection with the securities being registered, the Registrant will, unless in the opinion of its counsel the matter has been settled by controlling precedent, submit to a court of appropriate jurisdiction the question of whether such indemnification by it is against public policy as expressed in the Securities Act and will be governed by the final adjudication of such issue.
The undersigned Registrant hereby undertakes that:
| (a) | For purposes of determining any liability under the Securities Act, the information omitted from the form of prospectus filed as part of this registration statement in reliance upon Rule 430A and contained in a form of prospectus filed by the Registrant pursuant to Rule 424(b)(1) or (4) or 497(h) under the Securities Act shall be deemed to be part of this registration statement as of the time it was declared effective. |
| (b) | For the purpose of determining any liability under the Securities Act, each post-effective amendment that contains a form of prospectus shall be deemed to be a new registration statement relating to the securities offered therein, and the offering of such securities at that time shall be deemed to be the initial bona fide offering thereof. |
II-4
Table of Contents
SIGNATURES
Pursuant to the requirements of the Securities Act of 1933, as amended, the registrant has duly caused this Amendment No. 5 to Registration Statement to be signed on its behalf by the undersigned, thereunto duly authorized, in the City of Santa Clara, State of California, on May 6, 2015.
| eASIC CORPORATION |
| By: /s/ Ronnie Vasishta |
| Ronnie Vasishta President and Chief Executive Officer |
Pursuant to the requirements of the Securities Act of 1933, as amended, this Amendment No. 5 to Registration Statement on Form S-1 has been signed by the following persons in the capacities and on the dates indicated.
| SIGNATURE |
TITLE |
DATE | ||
| /s/ Ronnie Vasishta Ronnie Vasishta |
President, Chief Executive Officer and Member of the Board of Directors (Principal Executive Officer) |
May 6, 2015 | ||
| /s/ Richard J. Deranleau Richard J. Deranleau |
Senior Vice President, Finance and Chief Financial Officer (Principal Financial and Accounting Officer) |
May 6, 2015 | ||
| * Wayne Cantwell |
Member of the Board of Directors | May 6, 2015 | ||
| * Edward H. Frank, Ph.D. |
Member of the Board of Directors | May 6, 2015 | ||
| * Ronald S. Jankov |
Member of the Board of Directors | May 6, 2015 | ||
| * Michael R. Kourey |
Member of the Board of Directors | May 6, 2015 | ||
| * Tara Long |
Member of the Board of Directors | May 6, 2015 | ||
| *By | /s/ Ronnie Vasishta | |
| Ronnie Vasishta Attorney-in-Fact | ||
II-5
Table of Contents
EXHIBIT INDEX
| Exhibit |
Description | |
| 1.1† | Form of Underwriting Agreement. | |
| 3.1 | Eleventh Amended and Restated Certificate of Incorporation, as amended and as currently in effect. | |
| 3.2# | Form of Twelfth Amended and Restated Certificate of Incorporation to become effective upon closing of this offering. | |
| 3.3# | Amended and Restated Bylaws, as currently in effect. | |
| 3.4# | Form of Amended and Restated Bylaws to become effective upon closing of this offering. | |
| 4.1# | Form of Common Stock Certificate of the Registrant. | |
| 4.2# | Amended and Restated Investors’ Rights Agreement, by and among the Registrant and certain of its stockholders, dated December 13, 2012. | |
| 5.1† | Opinion of Cooley LLP. | |
| 10.1# | Warrants to Purchase Common Stock issued to Investors between October 15, 2009 and January 23, 2012. | |
| 10.2# | Warrant to Purchase Series A-2 Preferred Stock issued to Investors between September 30, 2013 and September 12, 2014. | |
| 10.3#+ | Form of Indemnity Agreement by and between the Registrant and its directors and officers. | |
| 10.4#+ | 2001 Stock Option Plan, as amended, and forms of stock option agreement, grant notice and notice of exercise. | |
| 10.5#+ | 2010 Equity Incentive Plan, as amended, and forms of stock option agreement, grant notice and notice of exercise. | |
| 10.6#+ | 2015 Equity Incentive Plan and forms of grant notice, stock option agreement and notice of exercise. | |
| 10.7#+ | 2015 Employee Stock Purchase Plan. | |
| 10.8†+ | Non-Employee Director Compensation Policy. | |
| 10.9#+ | Amended and Restated Employment Agreement by and between the Registrant and Ronnie Vasishta, dated October 15, 2010. | |
| 10.10#+ | Employment Agreement by and between the Registrant and Richard J. Deranleau, dated April 28, 2014. | |
| 10.11#+ | Employment Agreement by and between the Registrant and Ranko Scepanovic, Ph.D., dated April 25, 2008. | |
| 10.12#+ | Employment Agreement by and between the Registrant and Michael Stacy Fender, dated May 1, 2014. | |
| 10.13#+ | Employment Agreement by and between the Registrant and Jasbinder Bhoot, dated September 23, 2005. | |
| 10.14#+ | Letter Agreement by and between the Registrant and Edward H. Frank, Ph.D., dated October 24, 2013. | |
| 10.15# | Lease Agreement by and between Registrant and 2525 Augustine Drive LLC dated October 31, 2011. | |
| 10.16#* | Product Supply Agreement by and between the Registrant and Seagate Technology LLC, dated June 28, 2010 and as amended on May 23, 2014, including a letter agreement between the Registrant and Seagate Technology LLC. | |
Table of Contents
| Exhibit |
Description | |
| 10.17#* | General Purchase Agreement by and between the Registrant and Ericsson AB, dated June 18, 2009. | |
| 10.18# | Amended and Restated Venture Loan and Security Agreement by and between the Registrant and Horizon Technology Finance Corporation, Horizon Funding Trust 2013-1, DBD Credit Funding LLC and Fortress Credit Opportunities I, LP, dated September 12, 2014, as amended. | |
| 10.19# | Loan and Security Agreement by and between the Registrant and Silicon Valley Bank, dated September 29, 2010, as amended. | |
| 10.20#+ | Employment Agreement by and between the Registrant and Matthew Ng, dated December 11, 2014. | |
| 10.21# | Consulting Agreement by and between the Registrant and Michael R. Kourey, dated January 3, 2013 and as subsequently amended on September 30, 2013, including a letter agreement between the Registrant and Michael R. Kourey, dated January 2, 2014. | |
| 21.1# | Subsidiaries of the Registrant. | |
| 23.1 | Consent of Deloitte & Touche LLP, an Independent Registered Public Accounting Firm. | |
| 23.2† | Consent of Cooley LLP. Reference is made to Exhibit 5.1. | |
| 24.1# | Power of Attorney. Reference is made to the signature page hereto. | |
| # | Previously filed. |
| † | To be subsequently filed. |
| + | Indicates management contract or compensatory plan. |
| * | Confidential treatment has been requested with respect to certain portions of this exhibit. Omitted portions have been filed separately with the SEC. |