Attached files
| file | filename |
|---|---|
| 8-K - CURRENT REPORT - Wendy's Co | d920177d8k.htm |
 ©
2013 Oldemark LLC
First-Quarter 2015
Conference Call
May 6, 2015
Exhibit 99.1
©
2013 Oldemark LLC |
 ©
2013 Oldemark LLC
DAVID POPLAR
Vice President
Investor Relations
2
©
2013 Oldemark LLC |
 Today’s Agenda
CEO Overview
Emil Brolick
Financial Update
Todd Penegor
Q&A
3 |
 4
Forward-Looking Statements and Non-GAAP Financial Measures
This presentation, and certain information that management may discuss in connection with
this presentation, contains certain statements that are not historical facts,
including information concerning possible or assumed future results of our
operations. Those statements constitute “forward-looking statements” within the meaning
of the Private Securities Litigation Reform Act of 1995 (The “Reform Act”). For
all forward-looking statements, we claim the protection of the safe harbor for
forward-looking statements contained in the Reform Act. Many important factors could affect our future results and could cause those
results to differ materially from those expressed in or implied by our
forward-looking statements. Such factors, all of which are difficult or
impossible to predict accurately, and many of which are beyond our control, include but
are not limited to those identified under the caption “Forward-Looking
Statements” in our news release issued on May 6, 2015 and in the
“Special Note Regarding Forward-Looking Statements and Projections” and “Risk Factors” sections
of our most recent Form 10-K / Form 10-Qs.
In addition, this presentation and certain information management may discuss in
connection with this presentation reference non-GAAP financial measures, such
as adjusted earnings before interest, taxes, depreciation and amortization (or
adjusted EBITDA), adjusted EBITDA margin and adjusted earnings per share. Adjusted
EBITDA, adjusted EBITDA margin and adjusted earnings per share exclude certain expenses,
net of certain benefits. Reconciliations of non-GAAP financial measures to the most
directly comparable GAAP financial measures are provided in the Appendix to this
presentation, and are included in our news release issued on May 6, 2015 and
posted on www.aboutwendys.com. |
 ©
2013 Oldemark LLC
EMIL BROLICK
President & CEO
5
©
2013 Oldemark LLC |
 HOW WE
GROW BRAND RELEVANCE + ECONOMIC RELEVANCE = GROWTH
Shareholder
Value-Enhancing
Initiatives
Core Organic
Growth
Strategies
6
System Optimization
Financial Management
Global Growth
Restaurant Utilization &
Brand Access
New Restaurant Growth
Image / Experience Activation
North America Same-Restaurant Sales Growth |
 HIGH
LOW
FUNCTIONAL
EMOTIONAL
Wendy’s: New QSR Quality, QSR Price
7
Traditional
QSR
B
A
C
New
QSR
EXPERIENCE |
 PEOPLE
5-Star Talent
PRICE
New QSR Quality / QSR Price
PRODUCT
Playing a Different Game
PROMOTION
Tactically Brilliant / Strategically Directed
PLACE
Total Brand Experience
PERFORMANCE
Keeping Brand Promise
Recipe to Win
8 |
 ©
2013 Oldemark LLC
NORTH AMERICA COMPANY-OPERATED
RESTAURANT MARGIN INCREASES 160 BPS
IMPROVEMENT OF 360 BPS IN ADJUSTED
EBITDA MARGIN*
9
ADJ. EBITDA & ADJ. EPS GROWTH IN LINE
WITH EXPECTATIONS
RECAP ON SCHEDULE; COMPANY TO
PROVIDE UPDATED GUIDANCE ON JUNE 3
NORTH AMERICA SYSTEMWIDE SRS
INCREASE OF 3.2 PERCENT
*See Reconciliation of Adjusted EBITDA, Adjusted EBITDA Margin and Adjusted EPS in
the Appendix ©
2013 Oldemark LLC |
 2015
Balanced Across Core, LTO & Price/Value LTO
Price/Value
Core
10 |
 Menu
Vision: Limited Time Offerings + Core 11
CORE
CORE
LTO |
 Jalapeno
Fresco Chicken & Ghost Pepper Fries 12 |
 Brand
Access: Image Activation 13 |
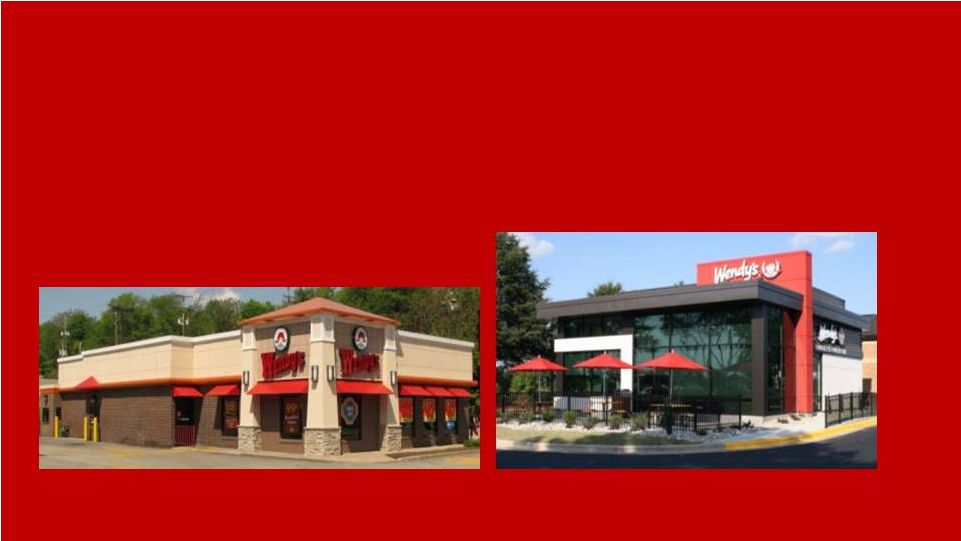 Image
Activation New Build AUV ~$300K Higher than Previous Design 14
$1.6M
2010
$1.9M
2014
Brand Access: New Restaurant Growth |
 Brand
Access: Consumer-Facing Technology 15
Mobile Order
Mobile Pay
Customer Self
Order Kiosk |
 Financial
Management Strategies On Track DEBT REFINANCING
•
On schedule for June 1
completion
•
Targeting leverage ratio
of 5-6x net debt to
2014 Adj. EBITDA
SHARE REPURCHASE
•
Intend to return
refinancing net
proceeds to
shareholders via share
repurchase program
16 |
 System
Optimization Phase III Update 17
Process on track with dispositions commencing in Q3 2015;
Expect ~280 to be sold in 2015 with the remaining ~260 in 2016
Process to identify markets to be sold has been completed;
Engaged The Cypress Group to assist with divestitures
~ 540
~ 5% of System
U.S. Company Restaurants to Sell
Ongoing Transition to Own |
 Sale of
Bakery Operations Expect Transaction to Close in Q2 of 2015
Allows for Greater Sourcing Flexibility
Focus on Core Restaurant Operations
Eliminate Future Bakery Capital Expenditures
18 |
 Reasons
to Believe 19
Transforming the System by Facilitating
Growth through Image Activation
& New Restaurant Development
Strengthening the
Franchise System through
Concentrated Ownership
Improving the
Company & Franchisees
Economic Models
Growth Pyramid
Continue to Execute Against our Strategic Growth Priorities
“A Cut Above”
Brand Positioning
Recipe to Win
Enhancing Our Quality of Earnings &
Adjusted EBITDA Margins
Adjusting our Capital Structure &
Accelerating Long-Term Adj. EPS Growth
Creating Flexibility
for Sustainable, Predictable
Long-Term Income & Growth |
 ©
2013 Oldemark LLC
TODD PENEGOR
Chief Financial Officer
20
©
2013 Oldemark LLC |
 $Mils
First Quarter Financial Highlights
N.A. Systemwide SRS
3.2%
0.7%
2-Year 3.9%
N.A. Company SRS
2.6%
1.3%
2-Year 3.9%
N.A. Co. Rest. Margin
14.7%
13.1%
+160 bps
G&A
$60.3
$70.4
$10.1
Adjusted EBITDA*
$84.0
$75.3
11.6%
Adjusted EBITDA Margin*
18.0%
14.4%
+360 bps
Adjusted EPS*
$0.06
$0.05
20.0%
2015
2014**
B/(W)
*See Reconciliation of Adjusted EBITDA, Adjusted EBITDA Margin and Adjusted EPS in
the Appendix. ** The Company has provided reclassified quarterly 2014
statements of operations on its website to conform to its current-year presentation.
21 |
 Q1 2015
vs. Q1 2014: Adjusted EBITDA 22
* See reconciliation in appendix.
(Unaudited)
$ in millions
$87.3
$75.3
$84.0
($8.4)
($12.0)
$10.1
$4.8
$3.9
$2.2
$1.2
($5.1)
2014 Q1 Reported
Adj. EBITDA *
LY Gains on
Rest. Sales &
Surplus Property
2014 Q1 Revised
Adj. EBITDA *
G&A
Savings
Royalties & Net
Rental Income
Core Restaurant
EBITDA
IA Impact
Other
Franchise
Fees
Disposed Rest.
EBITDA
(SO I & II)
2015 Q1
Adj. EBITDA * |
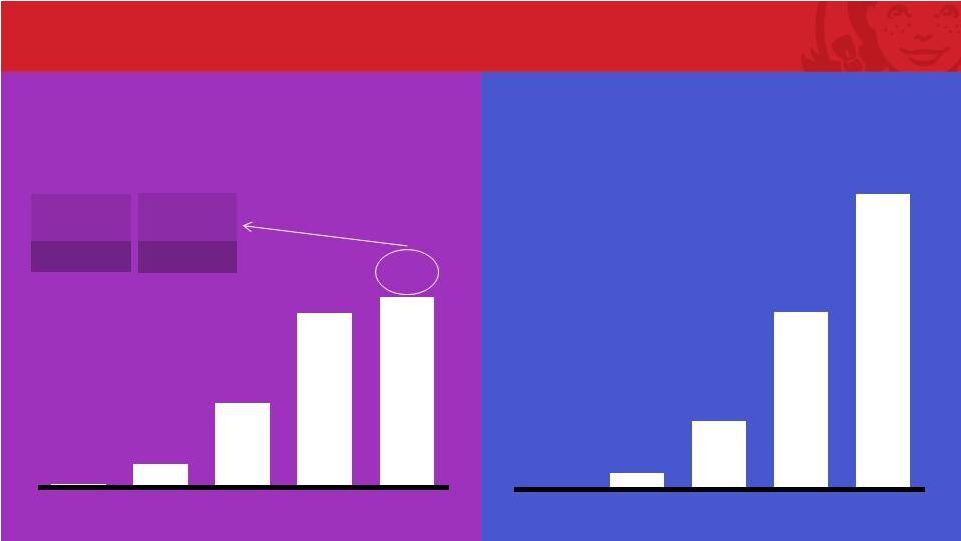 Image
Activation Accelerating Total System Annual
Reimages & New Builds
Total System Cumulative
Reimages & New Builds
450
Reimages
80
New
23
10
64
234
486
530
2011A
2012A
2013A
2014A
2015E
10
74
308
794
1,324
2011A
2012A
2013A
2014A
2015E |
 Facilitating Franchisee Commitments for Reimages and New Builds
24
60% Image Activation Requirement by 2020
Canadian Build-to-Suit program
Multi-Year Incentives
Turnkey Services
Construction Support
Multi-Year Investment Plan
Market & Joint Capital Planning |
 System
Optimization Update Canada System
Optimization
•
Plan to sell all 131 restaurants
•
Expect to sell remaining restaurants by the
end of Q2
•
Expect to be EBITDA-dilutive in near term,
but EBITDA-accretive longer-term with
build-to-suit restaurant development
U.S. System
Optimization
•
Plan to sell an additional ~540 restaurants:
~280 in 2015 and ~260 in 2016
•
Strong initial interest
System Optimization II
System Optimization III
25 |
 Company
Reaffirms 2015 Adj. EBITDA & Adj. EPS
Outlook
To provide updated guidance June 3 after completion of debt refinancing
26
•
Reaffirming G&A expense of approximately $250 million
•
Revising:
•
Company-operated SRS growth of 2.5 to 3.0 percent
•
Capital Expenditures of $250 to $260 million, including approximately $165
million for Company-operated Image Activation restaurants
•
Company-operated restaurant margin outlook of 16.5 to 17.0 percent
•
Reported effective tax rate of 41 to 42%
Adjusted EBITDA of $390 to $400 million
Adjusted EPS of $0.33 to $0.35
26 |
 Debt
Refinancing on Schedule to Close June 1 Recapitalization to Target Five to Six
Times Net Debt to 2014 Adjusted EBITDA
Intend to use the Net Proceeds to Return Cash to
Shareholders Via a Share Repurchase Program
Company to Update Guidance on June 3 to Reflect
Expected Completion of Refinancing, Anticipated Share
Repurchase Program, and Planned Sale of Bakery
27 |
 Transformation of Company Economic Model
28
System Optimization Provides a Stronger Platform to Return Cash to Shareholders
Supports Long-Term Income and Growth Commitment
Leveraging Our Balance Sheet
Less Capital Intensive
Enhances Quality of Earnings
Generates Higher Adj. EBITDA Margins
More Predictable and Sustainable Earnings Growth
More Predictable and Sustainable Earnings Growth |
 ©
2013 Oldemark LLC
DAVID POPLAR
Vice President
Investor Relations
29
©
2013 Oldemark LLC |
 30
2015 Investor Relations Calendar: Key Dates
June 1
Annual Meeting
June 3
Company to Issue Updated Outlook
June 22
Stifel Conference (Baltusrol, NJ)
June 23
New York Road Show
August 5
2Q Earnings Release
September 10
CL King (NYC) Conference
November 4
3Q Earnings Release |
  Q&A
31 |
  Appendix
32 |
 Reconciliation of Adjusted EBITDA to Net Income
33
2015
2014
1
Adjusted EBITDA
84,027
$
75,283
$
Plus (less):
Reversal of pension withdrawal liability in cost of sales
12,486
-
Depreciation and amortization
(36,880)
(42,021)
System optimization losses (gains), net
(813)
72,992
Reorganization and realignment costs
(4,613)
(14,711)
Impairment of long-lived assets
(1,937)
(2,529)
Operating profit
52,270
89,014
Interest expense
(12,757)
(12,994)
Other income, net
239
523
Income before income taxes
39,752
76,543
Provision for income taxes
(12,245)
(30,240)
Net income
27,507
$
46,303
$
Adjusted EBITDA margin
18.0%
14.4%
Previously reported Adjusted EBITDA
1
87,334
$
Change
1
(12,051)
1
2014 Adjusted EBITDA updated to exclude net gain on disposal of assets to conform
to the current year presentation. Three Months |
 34
Reconciliation of Adjusted Income and Adjusted Earnings Per
Share to Net Income and Earnings Per Share
Per share
Per share
Adjusted income and adjusted earnings per share
23,912
$
0.06
$
18,814
$
0.05
$
Plus (less):
Reversal of pension withdrawal liability in cost of sales
7,816
0.02
-
-
Depreciation of assets that will be replaced as part of the Image Activation
initiative 109
0.00
(5,897)
(0.02)
Reorganization and realignment costs
(2,846)
(0.01)
(8,738)
(0.02)
Impairment of long-lived assets
(1,195)
(0.00)
(1,510)
(0.00)
System optimization losses (gains), net
(289)
(0.00)
43,634
0.11
Total adjustments
3,595
0.01
27,489
0.07
Net income
27,507
$
0.07
$
46,303
$
0.12
$
Previously
reported
adjusted
income
and
adjusted
earnings
per
share
1
26,249
$
0.07
$
Change
1
(7,435)
(0.02)
1
2014
Adjusted
income
and
adjusted
earnings
per
share
updated
to
exclude
net
gain
on
disposal
of
assets
to
conform
to
the
current
year
presentation.
2015
2014
1
Three Months |
 35
Notice Regarding Debt Recapitalization
The information in this presentation regarding a debt
recapitalization does not constitute an offer to sell or the
solicitation of an offer to buy any notes or other securities that
could be issued in such transaction. |
 36 |