Attached files
| file | filename |
|---|---|
| 8-K - FORM 8-K - Tesla, Inc. | d920831d8k.htm |
Exhibit 99.1

|
Tesla Motors – First Quarter 2015 Shareholder Letter
• Produced 11,160 vehicles, exceeding plan while improving efficiency • Record quarterly deliveries of 10,045 vehicles • Achieved gross margin target, despite strong dollar • Launched All-Wheel Drive Model S 85D and 70D • Introduced Tesla Energy products • Model X on track for start of deliveries in late Q3 |
May 6, 2015
Dear Fellow Shareholders:
In 2015, we have already expanded our product portfolio with exciting new products and features while continuing to execute on our long-term plans. We ramped the manufacturing and availability of All-Wheel Drive Model S 85D, introduced 70D, and are building release candidate prototypes of Model X. Last week, we also launched our new Tesla Energy business, introducing a suite of energy storage products with a vision that we believe will help to eventually transform the global energy paradigm. Both our vehicle and Tesla Energy businesses will benefit from our Gigafactory project, which should start producing initial quantities of battery packs in 2016.
We also significantly improved manufacturing efficiency and reduced per unit vehicle costs while achieving a higher average weekly production rate during Q1. These efforts, combined with a favorable product mix, helped us reach our Q1 non-GAAP automotive gross margin target, despite the significant negative impact of a strong dollar. We were also able to accelerate year-over-year revenue growth in Q1, while improving operational efficiency as reflected in lower than expected growth of operating expenses. Overall, these achievements represent a strong start to a very big year at Tesla.
Expanding the Market for Model S
We continue to see growing Model S demand. In Q1, both North American and European orders were much higher than Q1 last year, despite limited availability of 85D and before the announcement of 70D. While we still have work to do in China, we saw encouraging signs of a return to growth in orders there as well.
Recently, order rates have accelerated even further with greater availability of 85D and the launch of 70D. This is especially encouraging as potential customers in many markets have yet to experience these products first hand. 70D has only been shown in North America, and our all-wheel drive cars will not be available in right hand drive markets until Q3. We remain confident in our ability to deliver approximately 55,000 Model S and Model X vehicles combined in 2015, as increased availability of all our Model S variants continue to drive demand. To sustainably scale for increased deliveries, our inventory of in-transit customer-configured cars must increase, and in Q1 we added 1,100 such vehicles to the pipeline.
| Our ability to continually innovate and reduce costs enabled us to recently launch the new Model S 70D. As a very compelling value in the premium sedan segment, the All-Wheel Drive 70D expands the market for Model S. 70D has 240 miles of EPA-rated range, superior all-weather performance, and a 0-60 mph time of 5.2 seconds. It also includes a comprehensive list of standard features such as Autopilot safety technology, access to our Supercharger network, and turn-by-turn navigation for $75,000, before tax credits and fuel cost savings. So far we are pleased with the increased demand that has been created by the 70D and the little effect it has had on the demand for our other Model S variants.
Model S customers benefit from our free data connectivity and unique over-the-air software updates, which allow us to improve customer cars over time. In March, we introduced our second significant software update of Q1, enabling new active safety capabilities, adding intelligent range and charge management features, and boosting performance by increasing acceleration and top speed. Additional software updates are scheduled in Q2 that will include more Autopilot safety and convenience features for appropriately equipped cars. |
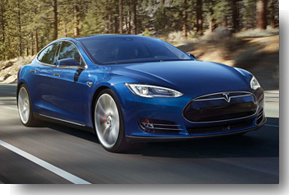
All-Wheel Drive Model S 85D | |
The expansion of our customer support network continues at a rapid pace. With 425 Supercharger locations and 100 service locations globally, driving a Model S is becoming more compelling every day. So far, our customers have Supercharged 111 million miles globally.
Improving Production Capabilities
In Q1, we manufactured 11,160 vehicles, 10% better than guidance, as we averaged more than 1,000 cars per production week. We successfully increased production on our new small drive unit line, which was critical to meeting the demand for our all-wheel drive cars. Our production launches of 85D and 70D proceeded more smoothly than our prior launches, highlighting the flexibility and increasing maturity of our manufacturing capabilities. With a more stable production cadence in Q1, we implemented efficiency improvements and reduced labor hours by more than 20% per car by the end of the quarter.
During the quarter, we also made significant progress on the installation of a new body shop, paint shop and stamping presses that will establish extra capacity for both Model X and Model S. We are now building and testing release candidate Model X prototypes with increasing design maturity, and are pleased with the progress of this program.
These developments, along with our maturing production capabilities, boost our confidence in the launch and production ramp of Model X, which is on track for start of deliveries in late Q3.
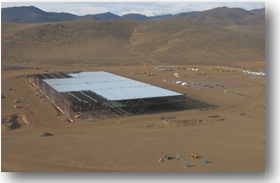
In addition, steady construction progress continues at the Gigafactory, and together with Panasonic, we now expect to start complete battery manufacturing, from cells to modules to battery packs, in 2016.
| Tesla Energy
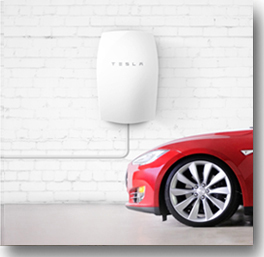
In Q1, we made substantial progress on our 2nd generation Tesla Energy grid battery products. This led to our April 30th launch of the $250/kWh industrial Powerpack and the $350/kWh residential Powerwall, and these attractive prices include controls, cooling and DC/DC power electronics. The customer response to these products and the Tesla Energy vision broadly has been extremely positive.
We are now preparing our supply chain and production teams to start volume builds on these new products in Q3. Production will begin at the Tesla Factory in Fremont, and in Q1 2016 will expand into the Gigafactory and accelerate significantly.
The total addressable market size for Tesla Energy products is enormous and much easier to scale globally than vehicle sales. We are pursuing product certification in multiple markets simultaneously and plan to ramp deliveries in the US, EU and Australia in Q4. When combined with low cost renewable energy, Tesla Energy batteries provide an achievable pathway to a 100% zero carbon energy system. |
Tesla Powerwall | |
Q1 Results
Starting this quarter, our income statement reflects the new classifications of revenues and costs of revenues to segregate our new vehicle business from our other business activities. “Automotive” revenue and related costs now reflect activities related to the sale or lease of new vehicles including regulatory credits, data connectivity and Supercharging. “Services and other” revenues and related costs include activities such as powertrain sales, service revenue, Tesla Energy and pre-owned Tesla vehicle sales. As usual, we have presented both GAAP and non-GAAP financial information in this letter. A full explanation of our non-GAAP information and reconciliation to GAAP are included in the tables and accompanying footnotes.
Total non-GAAP revenue was $1.10 billion for the quarter, up 55% from a year ago, while GAAP revenue was $940 million. We achieved a Q1 total company gross margin of 28.2% on a non-GAAP basis and 27.7% on a GAAP basis.
Automotive revenue was $1.06 billion on a non-GAAP basis, and is comprised of GAAP Automotive revenue of $893.3 million plus a net increase of $163.7 million in deferred revenue and other long-term liabilities as a result of lease accounting. 10,045 Model S vehicles were delivered in Q1, in line with our April announcement of approximately 10,030 deliveries. The average selling price of Model S increased slightly during the quarter, reflecting a full quarter of sales of P85D and the introduction of 85D. This mix improvement was partially offset by the effect of the strong dollar, which negatively impacted both our average selling price and thus revenue by slightly more than 3% from the prior quarter. As in previous quarters, we offered small discounts when selling vehicles used for either marketing or as service loaners. These discounts were consistent with last quarter. Q1 Automotive revenue included $66 million of total regulatory credit revenue, of which $51 million came from the sale of ZEV credits. In Q1, Tesla directly leased 592 cars to customers, which was worth $63 million of aggregate retail value.
Q1 Automotive gross margin excluding ZEV credits was on plan at 26.0% on a non-GAAP basis, and 25.0% on a GAAP basis. The 330 basis points of sequential improvement in non-GAAP gross margin was driven by lower manufacturing costs and richer mix, offset partially by the strong dollar, expedited shipping costs related to port delays and an increase in warranty reserves of about $200 per car.
Q1 Services and other revenue was $46.6 million, up 47% from a year ago. This includes $22 million of powertrain sales to Daimler and $20 million of service revenue. Q1 Services and other gross margin was negative 3.2%, as compared to 12.1% last quarter. This sequential reduction in gross margin was primarily driven by a planned price reduction for powertrain sales to Daimler.
We improved our operational efficiency in Q1, achieving record deliveries and developing new products while managing to grow operating expenses at a slower rate than expected. Our operating expenses in Q1 were $324 million on a non-GAAP basis, up 9.1% from Q4, and $363 million on a GAAP basis.
Our Q1 non-GAAP net loss was $45 million, or a loss of $0.36 per basic share based on 125.9 million basic shares, while our Q1 GAAP net loss was $154 million or a loss of $1.22 per basic share. Both figures include a $22 million loss, or $0.17 per basic share, related to mostly unrealized losses from revaluation of our foreign currency holdings due to the strong dollar.
|
Gigafactory Construction Progress |
Cash and cash equivalents were $1.51 billion at the end of the quarter, down $396 million sequentially, as capital expenditures were $426 million in the quarter. Capital expenditures were primarily for the capacity expansion and tooling associated with Model X and all-wheel drive vehicles, as well as the Gigafactory.
Our Q1 GAAP net cash outflow from operations was $132 million primarily due to the $78 million in cash inflows from vehicle sales to our bank leasing partners which we are required to classify as a financing activity, and a $63 million increase in inventory from customer-configured cars that were in transit for deliveries in Q2.
During the quarter, we closed on a $100 million warehouse line in connection with our direct leasing program, and drew down $78 million of the line by quarter end. We anticipate closing on additional financing lines in the coming months. |
Outlook
In Q2, we expect to produce about 12,500 vehicles, representing a 12% sequential increase. We plan to deliver 10,000 to 11,000 vehicles in Q2, and we are still on track to deliver approximately 55,000 Model S and X cars in 2015. As part of our strategy to optimize operational efficiency while scaling for higher deliveries, we are shipping cars using less expensive rail, rather than by truck, to more regions in the United States and Canada. Also, we are now producing cars based on a uniform regional production mix throughout the quarter. This enables a more stable cadence of deliveries and in turn improves customer satisfaction while reducing cost. Both of these actions should lead to an increase of in-transit customer-configured finished goods inventory.
In Q2, we expect to directly lease about the same percentage of cars that we did in Q1. As always, we will use lease accounting for these cars leased directly through Tesla even in our non-GAAP financial results, as such treatment is consistent with the cash collected on these transactions. We expect to sell about $15 million of our regulatory credits in Q2, including about $5 million of ZEV credit sales.
We expect the Model S average transaction price to decline in Q2 as the dollar has strengthened by about 4% against the euro from the time we last adjusted Model S pricing. This will impact our Q2 gross margin by slightly more than 100 basis points. As a result, we expect non-GAAP automotive gross margin, excluding ZEV credits, to be just under 25% for the quarter at current exchange rates. We also expect some average price pressure from a less rich product mix, but our continuing efforts to improve efficiency and reduce manufacturing costs should offset this impact on gross margin.
In response to the continued strength of the dollar, we have just announced a price increase of about 5% in most European markets. Since this price increase applies to new orders to be delivered in Q3 and beyond, it will not impact our Q2 results.
We expect Services and other gross margin to be slightly better than breakeven in Q2, and continue to improve to about 5% by Q4. The improvement will come from cost reductions on Daimler powertrains as well as increased sales of Tesla Energy and pre-owned Model S vehicles.
Our operating leverage is expected to improve this year, with revenue and gross profit both growing more quickly than operating expenses. Operating expenses should grow roughly 10% sequentially in Q2, and 45-50% for the full year as we invest in product development, including the Model 3, and expand our sales capability.
We still plan to invest about $1.5 billion in capital expenditures this year as we expand production capacity, purchase Model X tooling, continue to build the Gigafactory, and expand our stores, service centers and the Supercharger network.
2015 is off to a strong start, and we are excited about the many opportunities ahead. We expect to continue to develop many more innovative and exciting products in the coming years.
|
|
| |
| Elon Musk, Chairman & CEO | Deepak Ahuja, Chief Financial Officer | |


Webcast Information
Tesla will provide a live webcast of its first quarter 2015 financial results conference call beginning at 2:30 p.m. PT on May 6, 2015, at ir.teslamotors.com. This webcast will also be available for replay for approximately one year thereafter.
Forward-Looking Statements
Certain statements in this shareholder letter, including statements in “Outlook” section; statements regarding gross margin and profitability, statements relating to the progress Tesla is making with respect to product development, including future Autopilot features and Model X development and launch plans; statements regarding growth in the number of Tesla store, service center and Supercharger locations; statements relating to the production and delivery of Tesla Energy products, as well as future products; growth in demand and orders for Tesla vehicles and the catalysts for that growth; the ability to achieve vehicle demand, volume, production, delivery, revenue, leasing, gross margin, spending, capital expenditure and profitability targets; productivity improvements and capacity expansion plans; Tesla Gigafactory timing, partnerships, plans and output expectations, including those related to cell and battery pack production; and our ability to secure additional financing lines for our leasing programs are “forward-looking statements” that are subject to risks and uncertainties. These forward-looking statements are based on management’s current expectations, and as a result of certain risks and uncertainties, actual results may differ materially from those projected. The following important factors, without limitation, could cause actual results to differ materially from those in the forward-looking statements: Tesla’s future success depends on its ability to design and achieve market acceptance of Model S and its variants, as well as new vehicle models, specifically Model X and Model 3; the risk of delays in the manufacture, production and delivery of Model S and Model X vehicles, and production and delivery of Model 3 vehicles; adverse foreign exchange movements; the ability of suppliers to meet quality and part delivery expectations at increasing volumes; any failures by Tesla vehicles to perform as expected or if product recalls occur; Tesla’s ability to continue to reduce or control manufacturing and other costs; consumers’ willingness to adopt electric vehicles; competition in the automotive market generally and the alternative fuel vehicle market in particular; Tesla’s ability to establish, maintain and strengthen the Tesla brand; Tesla’s ability to manage future growth effectively as we rapidly grow, especially internationally; the unavailability, reduction or elimination of government and economic incentives for electric vehicles; Tesla’s ability to establish, maintain and strengthen its relationships with strategic partners such as Panasonic; potential difficulties in finalizing, performing and realizing potential benefits under definitive agreements for the Tesla Gigafactory site, obtaining permits and incentives, negotiating terms with technology, materials and other partners for Gigafactory, and maintaining Gigafactory implementation schedules, output and costs estimates; and Tesla’s ability to execute on its retail strategy and for new store, service center and Tesla Supercharger openings. More information on potential factors that could affect our financial results is included from time to time in our Securities and Exchange Commission filings and reports, including the risks identified under the section captioned “Risk Factors” in our quarterly report on Form 10-K filed with the SEC on February 26, 2015. Tesla disclaims any obligation to update information contained in these forward-looking statements whether as a result of new information, future events, or otherwise.
| Investor Relations Contact: | Press Contact: | |||
| Jeff Evanson | Khobi Brooklyn | |||
| Investor Relations – Tesla | Communications – Tesla | |||
| ir@teslamotors.com | press@teslamotors.com |
Tesla Motors, Inc.
Condensed Consolidated Statements of Operations
(Unaudited)
(In thousands, except per share data)
| Three Months Ended | ||||||||||||
| Mar 31, 2015 |
Dec 31, 2014 |
Mar 31, 2014 |
||||||||||
| Revenues |
|
|||||||||||
| Automotive (1A) |
$ | 893,320 | $ | 890,396 | $ | 588,871 | ||||||
| Services and other |
46,560 | 66,265 | 31,671 | |||||||||
|
|
|
|
|
|
|
|||||||
| Total revenues |
939,880 | 956,661 | 620,542 | |||||||||
|
|
|
|
|
|
|
|||||||
| Cost of revenues |
||||||||||||
| Automotive (1B) |
631,745 | 636,698 | 436,254 | |||||||||
| Services and other |
48,062 | 58,266 | 29,160 | |||||||||
|
|
|
|
|
|
|
|||||||
| Total cost of revenues (2) |
679,807 | 694,964 | 465,414 | |||||||||
|
|
|
|
|
|
|
|||||||
| Gross profit |
260,073 | 261,697 | 155,128 | |||||||||
| Operating expenses |
||||||||||||
| Research and development (2) |
167,154 | 139,565 | 81,544 | |||||||||
| Selling, general and administrative (2) |
195,365 | 196,970 | 117,551 | |||||||||
|
|
|
|
|
|
|
|||||||
| Total operating expenses |
362,519 | 336,535 | 199,095 | |||||||||
|
|
|
|
|
|
|
|||||||
| Loss from operations |
(102,446 | ) | (74,838 | ) | (43,967 | ) | ||||||
| Interest income |
184 | 219 | 141 | |||||||||
| Interest expense |
(26,574 | ) | (28,703 | ) | (11,883 | ) | ||||||
| Other income (expense), net |
(22,305 | ) | (588 | ) | 6,718 | |||||||
|
|
|
|
|
|
|
|||||||
| Loss before income taxes |
(151,141 | ) | (103,910 | ) | (48,991 | ) | ||||||
| Provision for income taxes |
3,040 | 3,719 | 809 | |||||||||
|
|
|
|
|
|
|
|||||||
| Net loss |
$ | (154,181 | ) | $ | (107,629 | ) | $ | (49,800 | ) | |||
|
|
|
|
|
|
|
|||||||
| Net loss per common share, basic and diluted |
$ | (1.22 | ) | $ | (0.86 | ) | $ | (0.40 | ) | |||
|
|
|
|
|
|
|
|||||||
| Shares used in per share calculation, basic and diluted |
125,947 | 125,497 | 123,473 | |||||||||
|
|
|
|
|
|
|
|||||||
Notes:
| (1) | Due to the application of lease accounting for Model S vehicles with the resale value guarantee or similar buy-back terms, the following is supplemental information for the periods presented: |
| (A) Net increase in deferred revenue and other long-term liabilities as a result of lease accounting and therefore not recognized in automotive sales |
$ | 163,676 | $ | 138,973 | $ | 92,506 | ||||||
|
|
|
|
|
|
|
|||||||
| (B) Net increase in operating lease vehicles as a result of lease accounting and therefore not recognized in automotive cost of sales |
$ | 113,823 | $ | 110,234 | $ | 69,743 | ||||||
|
|
|
|
|
|
|
Under lease accounting, warranty costs are expensed as incurred instead of accrued at the time of sale.
| (2) | Includes stock-based compensation expense of the following for the periods presented: |
| Cost of revenues |
$ | 4,601 | $ | 5,053 | $ | 3,106 | ||||||
| Research and development |
19,792 | 17,595 | 13,545 | |||||||||
| Selling, general and administrative |
18,633 | 21,869 | 20,387 | |||||||||
|
|
|
|
|
|
|
|||||||
| Total stock-based compensation expense |
$ | 43,026 | $ | 44,517 | $ | 37,038 | ||||||
|
|
|
|
|
|
|
|||||||
Tesla Motors, Inc.
Condensed Consolidated Balance Sheets
(Unaudited)
(In thousands)
| Mar 31, | Dec 31, | |||||||
| 2015 | 2014 | |||||||
| Assets |
||||||||
| Cash and cash equivalents |
$ | 1,510,076 | $ | 1,905,713 | ||||
| Restricted cash and marketable securities - current |
20,693 | 17,947 | ||||||
| Accounts receivable |
200,052 | 226,604 | ||||||
| Inventory |
1,054,840 | 953,675 | ||||||
| Prepaid expenses and other current assets |
135,756 | 94,718 | ||||||
| Operating lease vehicles, net (1) |
912,061 | 766,744 | ||||||
| Property and equipment, net |
2,224,191 | 1,829,267 | ||||||
| Restricted cash - noncurrent |
13,846 | 11,374 | ||||||
| Other assets |
48,515 | 43,209 | ||||||
|
|
|
|
|
|||||
| Total assets |
$ | 6,120,030 | $ | 5,849,251 | ||||
|
|
|
|
|
|||||
| Liabilities and Stockholders’ Equity |
||||||||
| Accounts payable and accrued liabilities |
$ | 1,086,099 | $ | 1,046,830 | ||||
| Deferred revenue (2) |
539,324 | 483,922 | ||||||
| Customer deposits |
249,476 | 257,587 | ||||||
| Capital lease obligations |
20,886 | 21,799 | ||||||
| Long-term debt |
2,509,383 | 2,408,084 | ||||||
| Other long-term liabilities (3) |
834,588 | 661,123 | ||||||
|
|
|
|
|
|||||
| Total liabilities |
5,239,756 | 4,879,345 | ||||||
| Mezzanine equity (4) |
54,277 | 58,196 | ||||||
| Stockholders’ equity |
825,997 | 911,710 | ||||||
|
|
|
|
|
|||||
| Total liabilities and stockholders’ equity |
$ | 6,120,030 | $ | 5,849,251 | ||||
|
|
|
|
|
|||||
Notes:
| (1) | Includes the following increase in operating lease vehicles related to deliveries of Model S and subject to lease accounting, net of depreciation recognized in automotive cost of sales, for the following periods: |
| Resale value guarantee program (and other vehicles with similar buy-back terms) |
||||||||
| Beginning balance |
$ | 689,689 | $ | 376,979 | ||||
| First quarter |
103,022 | 69,743 | ||||||
| Second quarter |
68,752 | |||||||
| Third quarter |
63,981 | |||||||
| Fourth quarter |
110,234 | |||||||
|
|
|
|
|
|||||
| Ending balance |
$ | 792,711 | $ | 689,689 | ||||
|
|
|
|
|
|||||
| Model S leasing program |
||||||||
| Beginning balance |
$ | 81,636 | $ | — | ||||
| First quarter |
35,687 | — | ||||||
| Second quarter |
11,214 | |||||||
| Third quarter |
23,824 | |||||||
| Fourth quarter |
46,598 | |||||||
|
|
|
|
|
|||||
| Ending balance |
$ | 117,323 | $ | 81,636 | ||||
|
|
|
|
|
|||||
| (2) | Includes the following increase in deferred revenue related to deliveries of Model S with the resale value guarantee or similar buy-back terms and subject to lease accounting, net of revenue amortized to automotive sales, for the following periods: |
| Beginning balance |
$ | 376,471 | $ | 227,868 | ||||
| First quarter |
45,334 | 38,188 | ||||||
| Second quarter |
33,586 | |||||||
| Third quarter |
27,993 | |||||||
| Fourth quarter |
48,836 | |||||||
|
|
|
|
|
|||||
| Ending balance |
$ | 421,805 | $ | 376,471 | ||||
|
|
|
|
|
|||||
| (3) Includes the following increase in other long-term liabilities related to deliveries of Model S with the resale value guarantee or similar buy-back terms and subject to lease accounting for the following periods: |
||||||||
| Beginning balance |
$ | 487,879 | $ | 236,298 | ||||
| First quarter |
118,341 | 54,318 | ||||||
| Second quarter |
54,575 | |||||||
| Third quarter |
52,551 | |||||||
| Fourth quarter |
90,137 | |||||||
|
|
|
|
|
|||||
| Ending balance |
$ | 606,220 | $ | 487,879 | ||||
|
|
|
|
|
|||||
| (4) | Our common stock price exceeded the conversion threshold price of our convertible senior notes due 2018 (2018 Notes) issued in May 2013; therefore, the 2018 Notes are convertible at the holder’s option during the second quarter of 2015. As such, the carrying value of the 2018 Notes was classified as a current liability as of March 31, 2015 and the difference between the principal amount and the carrying value of the 2018 Notes was reflected as convertible debt in mezzanine equity on our condensed consolidated balance sheet as of March 31, 2015. |
Tesla Motors, Inc.
Supplemental Consolidated Financial Information
(Unaudited)
(In thousands)
| Three Months Ended | ||||||||||||
| Mar 31, 2015 |
Dec 31, 2014 |
Mar 31, 2014 |
||||||||||
| Selected Cash Flow Information |
||||||||||||
| Cash flows provided by (used in) operating activities (1) |
$ | (131,794 | ) | $ | (86,402 | ) | $ | 58,723 | ||||
| Cash flows used in investing activities |
(432,344 | ) | (372,231 | ) | (329,180 | ) | ||||||
| Cash flows provided by financing activities |
186,156 | 11,325 | 1,816,559 | |||||||||
| Other Selected Financial Information |
||||||||||||
| Cash flows provided by (used in) operating activities (1) |
$ | (131,794 | ) | $ | (86,402 | ) | $ | 58,723 | ||||
| Capital expenditures |
(426,060 | ) | (368,661 | ) | (141,364 | ) | ||||||
|
|
|
|
|
|
|
|||||||
| Free cash flow (cash flow from operations plus capital expenditures) (1) |
$ | (557,854 | ) | $ | (455,063 | ) | $ | (82,641 | ) | |||
|
|
|
|
|
|
|
|||||||
| Depreciation and amortization |
$ | 77,112 | $ | 67,976 | $ | 44,268 | ||||||
| Mar 31, 2015 |
Dec 31, 2014 |
Mar 31, 2014 |
||||||||||
| Cash and Investments |
||||||||||||
| Cash and cash equivalents |
$ | 1,510,076 | $ | 1,905,713 | $ | 2,393,908 | ||||||
| Short-term marketable securities |
$ | — | $ | — | $ | 189,111 | ||||||
| Restricted cash and marketable securities - current |
20,693 | 17,947 | 1,049 | |||||||||
| Restricted cash - noncurrent |
13,846 | 11,374 | 7,102 | |||||||||
| (1) | During the three months ended June 30, 2014, we began separately presenting the effect of exchange rate changes on our cash and cash equivalents in our condensed consolidated statement of cash flows due to our growing operations in foreign currency environments. Prior period amounts have been reclassified to conform to the current period presentation. |
Supplemental Model S Direct Leasing Program Information
(in thousands, except for vehicle deliveries)
| Three Months Ended | ||||||||
| Mar 31, 2015 |
Dec 31, 2014 |
|||||||
| Vehicles delivered |
592 | 647 | ||||||
| Average per unit price of vehicles delivered |
$ | 107 | $ | 101 | ||||
|
|
|
|
|
|||||
| Aggregate value of vehicles delivered (1) |
$ | 63,359 | $ | 65,246 | ||||
|
|
|
|
|
|||||
| Direct leasing revenue recognized |
$ | 6,469 | $ | 2,993 | ||||
| (1) | Aggregate value is the product of multiplying vehicles delivered by the average per unit price of vehicles delivered |
Non-GAAP Financial Information
This letter includes non-GAAP financial information because we plan and manage our business using such information. Our non-GAAP measures align the recognition of revenues and costs related to a vehicle sale with the time when the customer take delivery of the car and cash is received or owed to us. This contrasts with the approach of other automotive manufacturers who under GAAP accounting recognize revenue when the vehicle is sold into dealership inventory rather than to end customers, even though in the case of a captive finance lease they may not collect cash for several years on a consolidated basis.
Our non-GAAP revenue and gross profit is determined by adding back the deferred revenue and related costs for cars sold with residual value guarantee and where we have collected, or will collect from a bank intermediary in a matter of days, the purchase price of the car in cash. For cars leased directly by Tesla, we recognize lease revenue and related costs over the lease term and the same way for both GAAP and non-GAAP purposes. Our non-GAAP expense and per share information also exclude non-cash interest expense and stock-based compensation.
Tesla Motors, Inc.
Reconciliation of GAAP to Non-GAAP Financial Information
(Unaudited)
(In thousands, except per share data)
| Three Months Ended | ||||||||||||
| Mar 31, 2015 |
Dec 31, 2014 |
Mar 31, 2014 |
||||||||||
| Net loss (GAAP) |
$ | (154,181 | ) | $ | (107,629 | ) | $ | (49,800 | ) | |||
| Stock-based compensation expense |
43,026 | 44,517 | 37,038 | |||||||||
| Non-cash interest expense related to convertible notes and other borrowing |
19,510 | 20,826 | 8,393 | |||||||||
|
|
|
|
|
|
|
|||||||
| Net loss (Non-GAAP) including lease accounting |
(91,645 | ) | (42,286 | ) | (4,369 | ) | ||||||
|
|
|
|
|
|
|
|||||||
| Model S gross profit deferred due to lease accounting (1)(2) |
46,396 | 26,072 | 21,384 | |||||||||
|
|
|
|
|
|
|
|||||||
| Net income (loss) (Non-GAAP) |
$ | (45,249 | ) | $ | (16,214 | ) | $ | 17,015 | ||||
|
|
|
|
|
|
|
|||||||
| Net loss per share, basic (GAAP) |
$ | (1.22 | ) | $ | (0.86 | ) | $ | (0.40 | ) | |||
| Stock-based compensation expense |
0.34 | 0.35 | 0.30 | |||||||||
| Non-cash interest expense related to convertible notes and other borrowing |
0.15 | 0.17 | 0.07 | |||||||||
| Model S gross profit deferred due to lease accounting (1)(2) |
0.37 | 0.21 | 0.17 | |||||||||
|
|
|
|
|
|
|
|||||||
| Net income (loss) per share, basic (Non-GAAP) |
$ | (0.36 | ) | $ | (0.13 | ) | $ | 0.14 | ||||
|
|
|
|
|
|
|
|||||||
| Shares used in per share calculation, basic (GAAP and Non-GAAP) |
125,947 | 125,497 | 123,473 | |||||||||
|
|
|
|
|
|
|
|||||||
| Net loss per share, diluted (GAAP) |
$ | (1.22 | ) | $ | (0.86 | ) | $ | (0.36 | ) | |||
| Stock-based compensation expense |
0.34 | 0.35 | 0.26 | |||||||||
| Non-cash interest expense related to convertible notes and other borrowing |
0.15 | 0.17 | 0.07 | |||||||||
|
|
|
|
|
|
|
|||||||
| Net loss (Non-GAAP) including lease accounting |
(0.73 | ) | (0.34 | ) | (0.03 | ) | ||||||
|
|
|
|
|
|
|
|||||||
| Model S gross profit deferred due to lease accounting (1)(2) |
0.37 | 0.21 | 0.15 | |||||||||
|
|
|
|
|
|
|
|||||||
| Net income (loss) per share, diluted (Non-GAAP) |
$ | (0.36 | ) | $ | (0.13 | ) | $ | 0.12 | ||||
|
|
|
|
|
|
|
|||||||
| Shares used in per share calculation, diluted (Non-GAAP) |
125,947 | 125,497 | 140,221 | |||||||||
|
|
|
|
|
|
|
|||||||
| (1) | Includes deliveries of Model S with the resale value guarantee or similar buy-back terms and not deliveries under the Model S leasing program. |
| (2) | Under GAAP, warranty costs are expensed as incurred for Model S vehicle deliveries with the resale value guarantee or similar buy-back terms and subject to lease accounting. For Non-GAAP purposes, an estimated incremental warranty reserve of $6.8 million, $5.5 million and $2.1 million is included for the three months ended March 31, 2015, December 31, 2014 and March 31, 2014, respectively. Additionally, stock-based compensation of $1.7 million, $1.0 million and $0.7 million is excluded for non-GAAP purposes for the three months ended March 31, 2015, December 31, 2014 and March 31, 2014, respectively. |
Tesla Motors, Inc.
Reconciliation of GAAP to Non-GAAP Financial Information
(Unaudited)
(In thousands, except per share data)
| Three Months Ended | ||||||||||||
| Mar 31, 2015 |
Dec 31, 2014 |
Mar 31, 2014 |
||||||||||
| Revenues (GAAP) |
$ | 939,880 | $ | 956,661 | $ | 620,542 | ||||||
| Model S revenue deferred due to lease accounting (1) |
163,676 | 138,973 | 92,506 | |||||||||
|
|
|
|
|
|
|
|||||||
| Revenues (Non-GAAP) |
$ | 1,103,556 | $ | 1,095,634 | $ | 713,048 | ||||||
|
|
|
|
|
|
|
|||||||
| Gross profit (GAAP) |
$ | 260,073 | $ | 261,697 | $ | 155,128 | ||||||
| Model S gross profit deferred due to lease accounting (1)(2) |
46,396 | 26,072 | 21,384 | |||||||||
| Stock-based compensation expense |
4,601 | 5,053 | 3,106 | |||||||||
|
|
|
|
|
|
|
|||||||
| Gross profit (Non-GAAP) |
$ | 311,070 | $ | 292,822 | $ | 179,617 | ||||||
|
|
|
|
|
|
|
|||||||
| Research and development expenses (GAAP) |
$ | 167,154 | $ | 139,565 | $ | 81,544 | ||||||
| Stock-based compensation expense |
(19,792 | ) | (17,595 | ) | (13,545 | ) | ||||||
|
|
|
|
|
|
|
|||||||
| Research and development expenses (Non-GAAP) |
$ | 147,362 | $ | 121,970 | $ | 67,999 | ||||||
|
|
|
|
|
|
|
|||||||
| Selling, general and administrative expenses (GAAP) |
$ | 195,365 | $ | 196,970 | $ | 117,551 | ||||||
| Stock-based compensation expense |
(18,633 | ) | (21,869 | ) | (20,387 | ) | ||||||
|
|
|
|
|
|
|
|||||||
| Selling, general and administrative expenses (Non-GAAP) |
$ | 176,732 | $ | 175,101 | $ | 97,164 | ||||||
|
|
|
|
|
|
|
|||||||
| (1) | Includes deliveries of Model S with the resale value guarantee or similar buy-back terms and not deliveries under the Model S leasing program. |
| (2) | Under GAAP, warranty costs are expensed as incurred for Model S vehicle deliveries with the resale value guarantee or similar buy-back terms and subject to lease accounting. For Non-GAAP purposes, an estimated incremental warranty reserve of $6.8 million, $5.5 million and $2.1 million is included for the three months ended March 31, 2015, December 31, 2014 and March 31, 2014, respectively. Additionally, stock-based compensation of $1.7 million, $1.0 million and $0.7 million is excluded for non-GAAP purposes for the three months ended March 31, 2015, December 31, 2014 and March 31, 2014, respectively. |