Attached files
| file | filename |
|---|---|
| 8-K - 8-K - SOLERA HOLDINGS, INC | slh20150331form8-k.htm |
| EX-99.1 - EXHIBIT 99.1 - SOLERA HOLDINGS, INC | a991slh20150331earningsrel.htm |

SLH 3Q FY15 SUPPLEMENTAL CHARTS
Solera blends digital technologies to manage risk & assets for auto & home to give a smoother ride through life. 2
Safe Harbor Statement Statements in this presentation that are not reported financial results or other historical information are “forward-looking statements” within the meaning of the Private Securities Litigation Reform Act of 1995. These statements relate to analyses and other information that are based on forecasts of future results and estimates of amounts not yet determinable and historical results or performance that may suggest trends for our business. These forward-looking statements include statements about: our assumed full-fiscal year 2015 revenue and Adjusted EBITDA performance; our assumed five-year revenue and adjusted EBITDA, CAGR through the end of fiscal year 2015; prospects for revenue and profitability growth, including our mission to achieve $2 billion in revenue and $840 million in Adjusted EBITDA by fiscal year 2020 (“Mission 2020”); Solera products and services under development, including the Digital Garage and risk and asset management platform; our growing total addressable market or TAM; our pending acquisition (the “Acquisition”) of DMEautomotive, LLC (“DMEa”) and the benefits of the acquisition; our fiscal year 2015 guidance; as well as historical results that may suggest trends for our business, including revenue, Adjusted EBTIDA margin, RpC, RpHH, revenue growth, TAM expansion, and revenue mix by type of business, type of market and reporting segment. These forward-looking statements are based on current plans, estimates and expectations, and are not guarantees of future performance. They are based on management’s expectations that involve a number of business risks and uncertainties, any of which could cause actual results to differ materially from those expressed in or implied by the forward-looking statements. Factors that could cause actual results to differ materially from the forward-looking statements include, but are not limited to: our reliance on a limited number of customers for a substantial portion of our revenues; unpredictability and volatility of our operating results, which include the volatility associated with foreign currency exchange risks, our sales cycle, seasonality, global economic conditions, acquisitions and other factors; the Acquisition may not be completed; the failure to realize the expected benefits of the Acquisition; risks associated with and possible negative consequences of acquisitions, joint ventures, divestitures and similar transactions, including regulatory matters and our ability to successfully integrate our acquired businesses; risks associated with a diversified business; successful integration of acquired businesses that operate in industries outside of our core market; we may not complete any subsequent acquisitions of additional equity interests of SRS; the failure to realize the expected benefits from our joint venture with Welsh, Carson, Anderson & Stowe or our investment in or subsequent acquisition of SRS; our inability to successfully integrate SRS's business, including SRS's existing employees, infrastructure and service offerings, with our existing businesses at reasonable cost, or at all; our inability to pay (or finance, as applicable) the call price or put prices at our expected cost, or at all, and the possible reduction in our cash balance or increase in outstanding debt after payment of the closing purchase price, call price or put prices; rapid technology changes in our industries, which could affect customer decisions regarding the purchase of our software and services; effects of competition on our software and service pricing and our business; time and expenses associated with customers switching from competitive software and services to our software and services; risks associated with operating in multiple countries; effects of changes in or violations by us or our customers of government regulations; our ability to obtain additional financing as necessary to support our operations, including Mission 2020; use of cash to service our debt and effects on our business of restrictive covenants in our bond indentures; our reliance on third-party information for our software and services; our dependence on a limited number of key personnel; costs and possible future losses or impairments relating to our acquisitions; the financial impact of future significant restructuring and severance charges; the impact of changes in our tax provision (benefit) or effective tax rate; our ability to pay dividends or repurchase shares in future periods; effects of system failures or security breaches on our business and reputation; and any material adverse impact of current or future litigation on our results or business, including litigation with Mitchell International. For a discussion of these and other factors that could impact our operations or financial results and cause our results to differ materially from those in the forward-looking statements, please refer to our filings with the Securities and Exchange Commission, particularly our Quarterly Report on Form 10-Q for the Quarter Ended December 31, 2014. Solera is under no obligation to (and specifically disclaims any such obligation to) update or alter our forward-looking statements whether as a result of new information, future events or otherwise. 3
Safe Harbor Statement (continued) We provide guidance regarding our estimated financial results for future periods once a quarter. We most recently provided this guidance on May 6, 2015 and we have included elements of this May 6, 2015 guidance in this presentation to enable you to review it along with our historical results. Its inclusion is not an update or confirmation of our fiscal year 2015 guidance. This presentation includes a calculation of Adjusted EBITDA, a non-GAAP financial measure that is different from financial measures calculated in accordance with GAAP and may be different from calculations of Adjusted EBITDA made by other companies. A quantitative reconciliation of Adjusted EBITDA to Net Income and Adjusted Net Income to GAAP Net earnings, the most directly comparable GAAP financial measures, has been included in this presentation. During the third quarter of fiscal year 2015, we completed two acquisitions – Service Dynamics, Inc. and CIMA Systems, Inc. – and we signed an agreement to acquire DMEa. The Acquisition is subject to certain closing conditions, including Hart-Scott-Rodino anti-trust clearance, and is expected to close in the fourth quarter of fiscal year 2015. Certain figures disclosed in this presentation, including customer transactions and TAM, assume the Acquisition has been completed. Our fiscal year 2015 guidance does not assume the Acquisition has been completed. 4

Solera is a leading provider of risk & asset management software and services to the global automotive and property marketplace, including the global P&C insurance industry Customers Insurers, OEM’s, Fleets & More Owners $1.13B Revenue1 $457M Adj. EBITDA1 12.4% Five-Year Revenue CAGR2 Solera’s Risk & Asset Management for the Household 5 1 Assumes Revenue and Adjusted EBITDA performance equal to the midpoint of our Revenue and Adjusted EBITDA guidance range. 2 Assumes fiscal year 2015 revenue performance equal to the midpoint of fiscal year 2015 guidance. Finance Insure Service, Maintenance & Repair (SMR) End of Life Total Loss / SalvageBuy/Sell
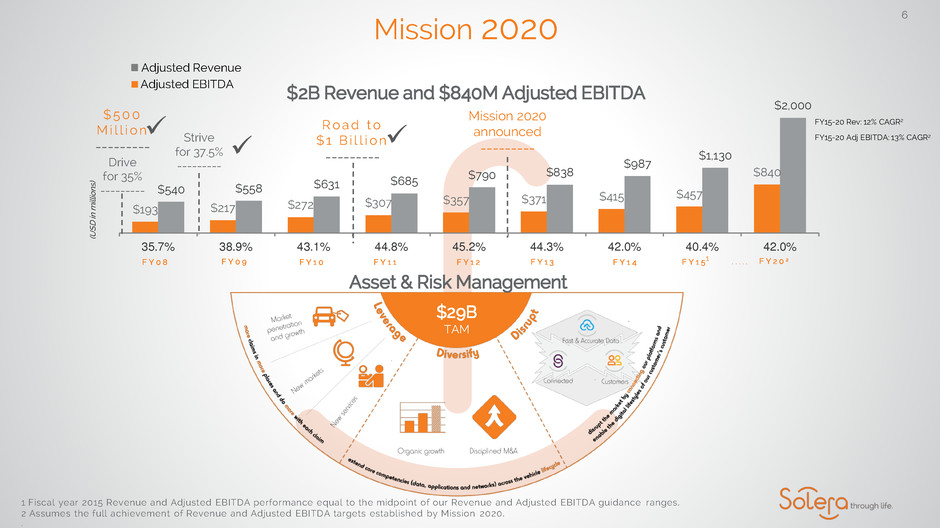
$193 $217 $272 $307 $357 $371 $415 $457 $840 $540 $558 $631 $685 $790 $838 $987 $1,130 $2,000 35.7% 38.9% 43.1% 44.8% 45.2% 44.3% 42.0% 40.4% 42.0% Adjusted EBITDA 6 Mission 2020 $2B Revenue and $840M Adjusted EBITDA R o a d t o $ 1 B i l l i o n --------- Mission 2020 announced --------- $ 5 0 0 M i l l i o n --------- Drive for 35% --------- Strive for 37.5% --------- F Y 0 8 F Y 0 9 F Y 1 0 F Y 1 1 F Y 1 2 F Y 1 3 F Y 1 4 F Y 1 5 F Y 2 0 2. . . . .1 1 Fiscal year 2015 Revenue and Adjusted EBITDA performance equal to the midpoint of our Revenue and Adjusted EBITDA guidance ranges. 2 Assumes the full achievement of Revenue and Adjusted EBITDA targets established by Mission 2020. . Asset & Risk Management $29B TAM (U SD in m ill io ns ) Adjusted Revenue FY15-20 Rev: 12% CAGR2 FY15-20 Adj EBITDA: 13% CAGR2
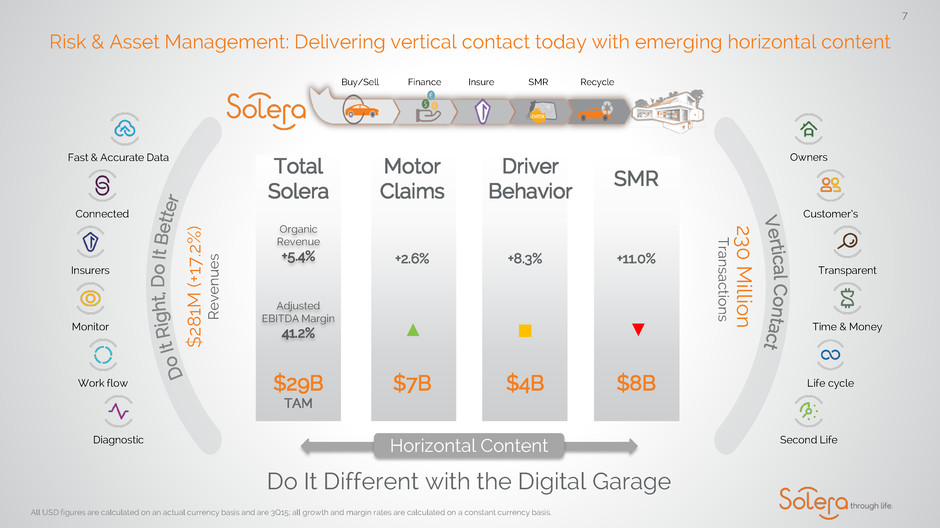
Risk & Asset Management: Delivering vertical contact today with emerging horizontal content $ 281 M (+17 .2 % ) R even u es 230 Mil lion T rans action s Do It Different with the Digital Garage Insurers Fast & Accurate Data Diagnostic Monitor Connected Work flow Owners Customer’s Time & Money Transparent Life cycle Second Life All USD figures are calculated on an actual currency basis and are 3Q15; all growth and margin rates are calculated on a constant currency basis. Finance Insure SMR RecycleBuy/Sell Organic Revenue +5.4% Total Solera $29B TAM Adjusted EBITDA Margin 41.2% Motor Claims $7B +2.6% ▲ +11.0% SMR $8B ▼ +8.3% Driver Behavior $4B ▪ Horizontal Content 7

12 Month View of Claim Trends Shows New Services Continue to Outpace Claim Volume Declines 1. All growth rates are calculated on a constant currency basis. Motor Claims RpC Trend figures calculated on constant currency basis. RpC ▲ 6.3% YoY 3Q Motor Claims ▼ 2.6% YoY 3Q 3.2 3.2 3.1 3.2 3.2 3.0 3.0 3.1 3.1 2.50 2.70 2.90 3.10 3.30 $22.00 $24.00 $26.00 $28.00 3QFY13 4QFY13 1QFY14 2QFY14 3QFY14 4QFY14 1QFY15 2QFY15 3QFY15 RpC Motor Claims (m) M o tor C lai m s (in m illions) R ev en ue p er C lai m Motor Claims (Advanced Markets) 70% 30% FY13 +3.8% 1 Total YoY +3.6%1 YoY +3.8%1 YoY 63% 37% FY14 +4.4%1 Total YoY +4.8%1 YoY +4.3%1 YoY Non-Claims Rev. Mix Motor Claims Rev. 8 85.0% 84.0% 13.0% 15.0% 2.0% 1.0% Advanced Evolving Emerging YoY Growth % +2.7 +10.1 +56.7 YoY Growth % +2.2 +10.9 +36.3 Market Type Revenue Mix FY13 FY14
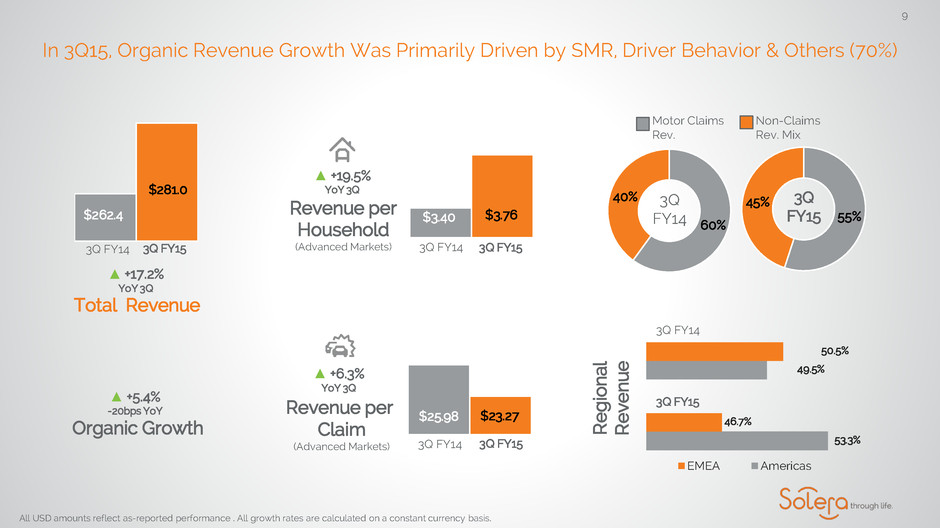
In 3Q15, Organic Revenue Growth Was Primarily Driven by SMR, Driver Behavior & Others (70%) All USD amounts reflect as-reported performance . All growth rates are calculated on a constant currency basis. Non-Claims Rev. Mix Motor Claims Rev. 60% 40% 3Q FY14 9 Regi on al Re ve nu e Organic Growth ▲ +5.4% -20bps YoY Revenue per Claim (Advanced Markets) 3Q FY14 3Q FY15 $25.98 $23.27 ▲ +6.3% YoY 3Q 3Q FY14 3Q FY15 $262.4 $281.0 55% 45% 3Q FY15Revenue per Household (Advanced Markets) ▲ +19.5% YoY 3Q 3Q FY14 3Q FY15 $3.40 $3.76 53.3% 49.5% 46.7% 50.5% EMEA Americas 3Q FY14 3Q FY15 Total Revenue ▲ +17.2% YoY 3Q

Solera’s Risk & Asset Management Platform 10 55% 45%4% 96% $29B TAM LEVERAGE Integrate horizontal data and services from vertical businesses across platforms DIVERSIFY Extend core competencies (data, applications and networks) across the ownership lifecycle DISRUPT Disrupt the market by connecting our platforms and enabling the digital lifestyles of our customer’s customer. 6X TAM Expansion since ’07 Opens the Household Driver Collision & Salvage Glass SMR Parts Valuation Property $4B $5B $2B $8B $4B $2B $4B
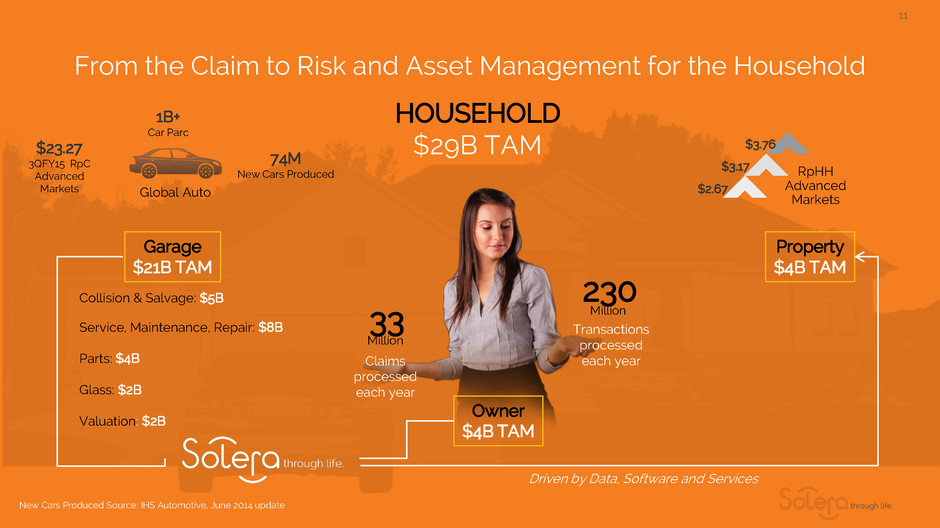
From the Claim to Risk and Asset Management for the Household New Cars Produced Source: IHS Automotive, June 2014 update 11 HOUSEHOLD $29B TAM Collision & Salvage: $5B Service, Maintenance, Repair: $8B Parts: $4B Glass: $2B Valuation: $2B Garage $21B TAM Owner $4B TAM Property $4B TAM RpHH Advanced Markets $2.67 $3.17 $3.76 1B+ Car Parc 74M New Cars Produced $23.27 3QFY15 RpC Advanced Markets Global Auto 33 Million Claims processed each year 230 Million Transactions processed each year Driven by Data, Software and Services
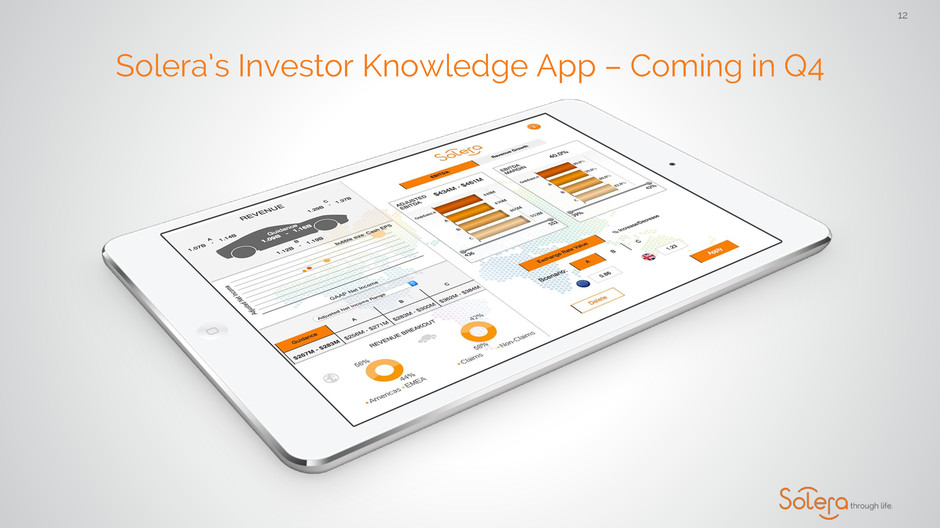
Solera’s Investor Knowledge App – Coming in Q4 12
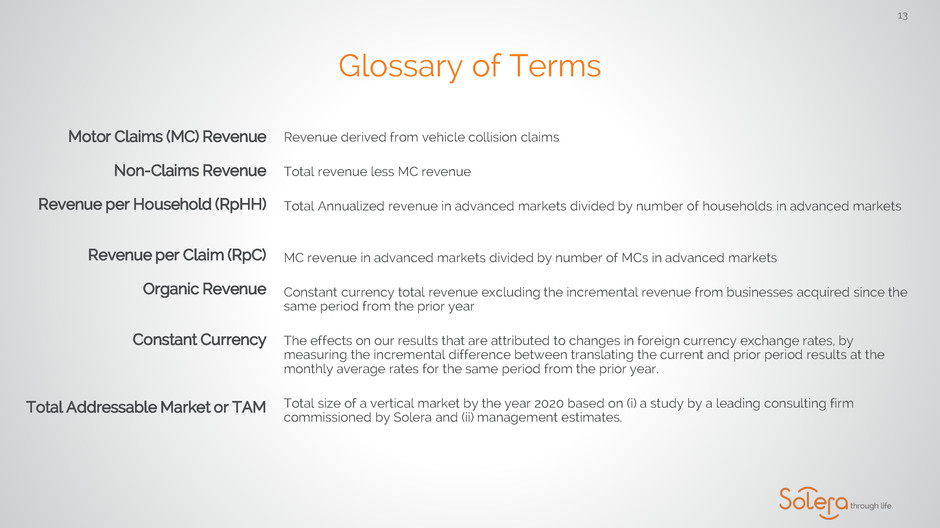
Glossary of Terms Revenue derived from vehicle collision claims Total revenue less MC revenue Total Annualized revenue in advanced markets divided by number of households in advanced markets MC revenue in advanced markets divided by number of MCs in advanced markets Constant currency total revenue excluding the incremental revenue from businesses acquired since the same period from the prior year The effects on our results that are attributed to changes in foreign currency exchange rates, by measuring the incremental difference between translating the current and prior period results at the monthly average rates for the same period from the prior year. Total size of a vertical market by the year 2020 based on (i) a study by a leading consulting firm commissioned by Solera and (ii) management estimates. Motor Claims (MC) Revenue Non-Claims Revenue Revenue per Household (RpHH) Revenue per Claim (RpC) Organic Revenue Constant Currency Total Addressable Market or TAM 13
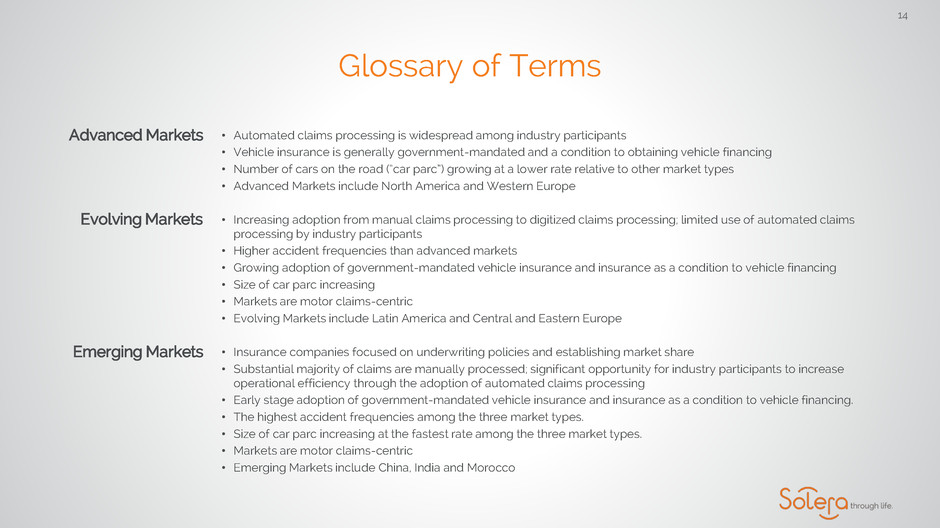
Glossary of Terms • Automated claims processing is widespread among industry participants • Vehicle insurance is generally government-mandated and a condition to obtaining vehicle financing • Number of cars on the road (“car parc”) growing at a lower rate relative to other market types • Advanced Markets include North America and Western Europe • Increasing adoption from manual claims processing to digitized claims processing; limited use of automated claims processing by industry participants • Higher accident frequencies than advanced markets • Growing adoption of government-mandated vehicle insurance and insurance as a condition to vehicle financing • Size of car parc increasing • Markets are motor claims-centric • Evolving Markets include Latin America and Central and Eastern Europe • Insurance companies focused on underwriting policies and establishing market share • Substantial majority of claims are manually processed; significant opportunity for industry participants to increase operational efficiency through the adoption of automated claims processing • Early stage adoption of government-mandated vehicle insurance and insurance as a condition to vehicle financing. • The highest accident frequencies among the three market types. • Size of car parc increasing at the fastest rate among the three market types. • Markets are motor claims-centric • Emerging Markets include China, India and Morocco Advanced Markets Evolving Markets Emerging Markets 14
