Attached files
| file | filename |
|---|---|
| 8-K - 8-K - Noranda Aluminum Holding CORP | a2015q1earningsrelease8k.htm |
| EX-99.3 - EXHIBIT 99.3 - Noranda Aluminum Holding CORP | a2015q1exhibit993.htm |
| EX-99.1 - EXHIBIT 99.1 - Noranda Aluminum Holding CORP | a2015q1earningsreleaseexhi.htm |

1st Quarter 2015 Earnings Conference Call Noranda Aluminum Holding Corp May 6, 2015 10:00 AM Eastern Exhibit 99.2

The presentation and comments made by Noranda’s management on the quarterly conference call contain “forward-looking statements” within the meaning of the Private Securities Litigation Reform Act of 1995. Forward-looking statements are statements about future, not past, events and involve certain important risks and uncertainties, any of which could cause the Company’s actual results to differ materially from those expressed in forward-looking statements, including, without limitation: the cyclical nature of the aluminum industry and fluctuating commodity prices, which cause variability in earnings and cash flows; a downturn in general economic conditions, including changes in interest rates, as well as a downturn in the end-use markets for certain of the Company’s products; fluctuations in the relative cost of certain raw materials and energy compared to the price of primary aluminum and aluminum rolled products; the effects of competition in Noranda’s business lines; Noranda’s ability to retain customers, a substantial number of which do not have long-term contractual arrangements with the Company; failure to maintain a competitive and sustainable power rate at the smelter in Missouri, with consequent risk of smelter closure; the ability to fulfill the business’ substantial capital investment needs; labor relations (i.e. disruptions, strikes or work stoppages) and labor costs; unexpected issues arising in connection with Noranda’s operations outside of the United States; the ability to retain key management personnel; and Noranda’s expectations with respect to its acquisition activity, or difficulties encountered in connection with acquisitions, dispositions or similar transactions. Forward-looking statements contain words such as “believes,” “expects,” “may,” “should,” “seeks,” “approximately,” “intends,” “plans,” “estimates,” “anticipates” or similar expressions that relate to Noranda’s strategy, plans or intentions. All statements Noranda makes relating to its estimated and projected earnings, margins, costs, expenditures, cash flows, growth rates and financial results or to the Company’s expectations regarding future industry trends are forward-looking statements. Noranda undertakes no obligation to publicly update or revise any forward-looking statement as a result of new information, future events or otherwise, except as otherwise required by law. Readers are cautioned not to place undue reliance on forward-looking statements, which speak only as of the date on which they are made and which reflect management's current estimates, projections, expectations or beliefs. For a discussion of additional risks and uncertainties that may affect the future results of Noranda, please see the Company’s filings with the Securities and Exchange Commission, including its Annual Report on Form 10-K and Quarterly Reports on Form 10-Q. Forward-Looking Statements & Non-GAAP Measures This presentation contains non-GAAP financial measures as defined by SEC rules. We believe these measures are helpful to investors in measuring our financial performance and comparing our performance to our peers. However, our non-GAAP financial measures may not be comparable to similarly titled non-GAAP financial measures used by other companies. These non-GAAP financial measures have limitations as an analytical tool and should not be considered in isolation or as a substitute for U.S. GAAP financial measures. To the extent we disclose any non-GAAP financial measures, a reconciliation of each measure to the most directly comparable U.S. GAAP measure is available in the Press Release included as an exhibit to the Current Report on Form 8-K to which this presentation is also an exhibit. As such, this presentation should be read in conjunction with our Press Release. 2

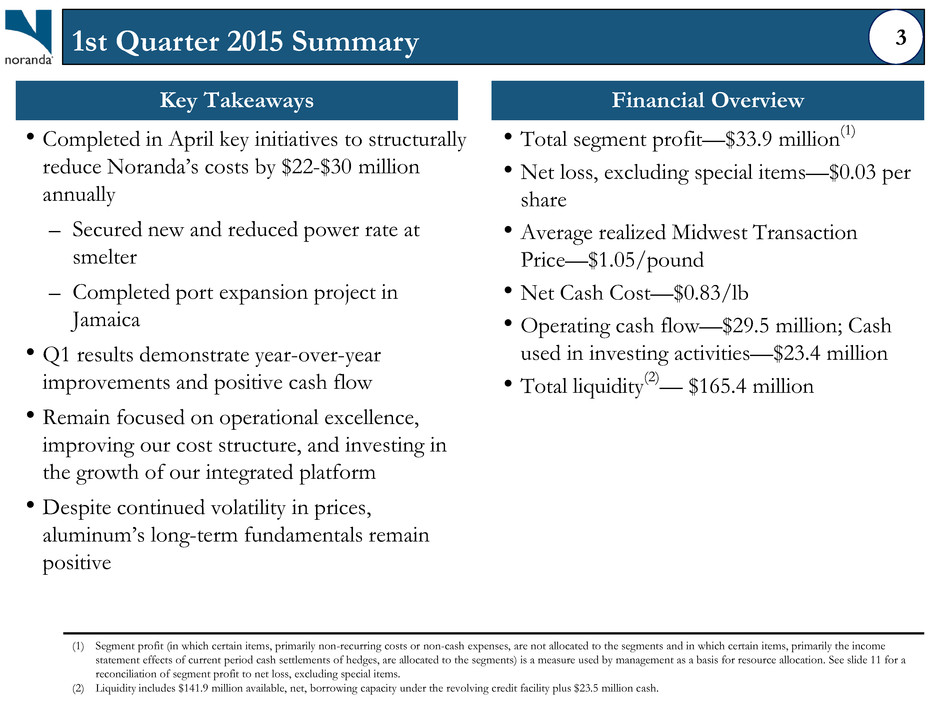
Key Takeaways • Completed in April key initiatives to structurally reduce Noranda’s costs by $22-$30 million annually – Secured new and reduced power rate at smelter – Completed port expansion project in Jamaica • Q1 results demonstrate year-over-year improvements and positive cash flow • Remain focused on operational excellence, improving our cost structure, and investing in the growth of our integrated platform • Despite continued volatility in prices, aluminum’s long-term fundamentals remain positive Financial Overview • Total segment profit—$33.9 million(1) • Net loss, excluding special items—$0.03 per share • Average realized Midwest Transaction Price—$1.05/pound • Net Cash Cost—$0.83/lb • Operating cash flow—$29.5 million; Cash used in investing activities—$23.4 million • Total liquidity(2)— $165.4 million 1st Quarter 2015 Summary (1) Segment profit (in which certain items, primarily non-recurring costs or non-cash expenses, are not allocated to the segments and in which certain items, primarily the income statement effects of current period cash settlements of hedges, are allocated to the segments) is a measure used by management as a basis for resource allocation. See slide 11 for a reconciliation of segment profit to net loss, excluding special items. (2) Liquidity includes $141.9 million available, net, borrowing capacity under the revolving credit facility plus $23.5 million cash. 3

Overview of New Rate Structure New Madrid Rate Decomposition Expected annual savings range from $17 to $25 million 4 • On April 29, 2015 the Missouri Public Service Commission (the “PSC”) established a new and reduced electricity rate structure for Noranda’s aluminum smelter in New Madrid – Establishes new rate class, Industrial Aluminum Smelter, which includes only Noranda • The new rate structure is expected to result in $17 to $25 million2 in annual savings – Initial base rate set at $36 per MWh – Increases from fuel adjustment charges (“FAC”) are capped at $2 per MWh • Additionally, avoids a ~ 5% rate increase from recent general rate case • New structure contains provisions for escalations and ongoing commitments – Capital spending and employment commitments are consistent with historical levels 1 FAC prior to new rate was $3.96. FAC is re-based with new rate case, and for Noranda is capped at $2. At a $0 FAC, total savings would be $25 million per year. 2 Compared to actual rates, and assuming smelter at full production. New Previous Savings Amounts in millions except $ per MWh Base Rate ($ per MWh) $36.00 $37.94 $ 1.94 + FAC1 ($ per MWH) Up to 2.00 3.96 1.96 to 3.96 = Total Rate ($ per MWH) $38.00 $41.90 $ 3.90 to 5.90 x Annual MWh Usage2 4.24 = Total Annual Savings $ 17 to 25

Bauxite Port Expansion 5 Port Expansion project provides cost savings for Bauxite and Alumina businesses, as well as opportunity to increase volume based on demand at a sufficient price and approval by Government of Jamaica Noranda’s Bauxite Business • Bauxite mining agreement with Government of Jamaica through 2030 • Agreement permits export of 5.4 DMT through 2017; reverts to 4.5 million DMT after 2017 unless extended by GOJ • 2.5 million DMT of bauxite is generally used for alumina production at the Gramercy refinery • Remaining bauxite is sold to third parties Project Specifics • Expect to save $5 million per year in shipping costs costs (lower freight and demurrage) by increasing ship utilization and reducing dock occupancy at St. Ann • Increases certified depth of docking berth and shipping channel from 40 feet to 45 feet • Project allows Noranda to load an incremental 10-15% on existing vessels Shipping Channel Berth Area Before After Before After

Progress on Transformation Path 6 These transformational productivity projects target $85 million incremental segment profit over 2013, independent of aluminum price and other commodity price impact. Initiative Power Port Labor Annual Savings $17 to $25 million $5 million $15 million Date of First Impact June 2015 April 2015 January 2014 Completed $37 to $45 million of structural initiatives to improve cost profile Steps In-Progress In-Progress Capital Projects-- $15 million Debottlenecking, Other-- ~$8 to $12 million Alternative Sourcing, Improved Usage-- ~$20 to $25 million

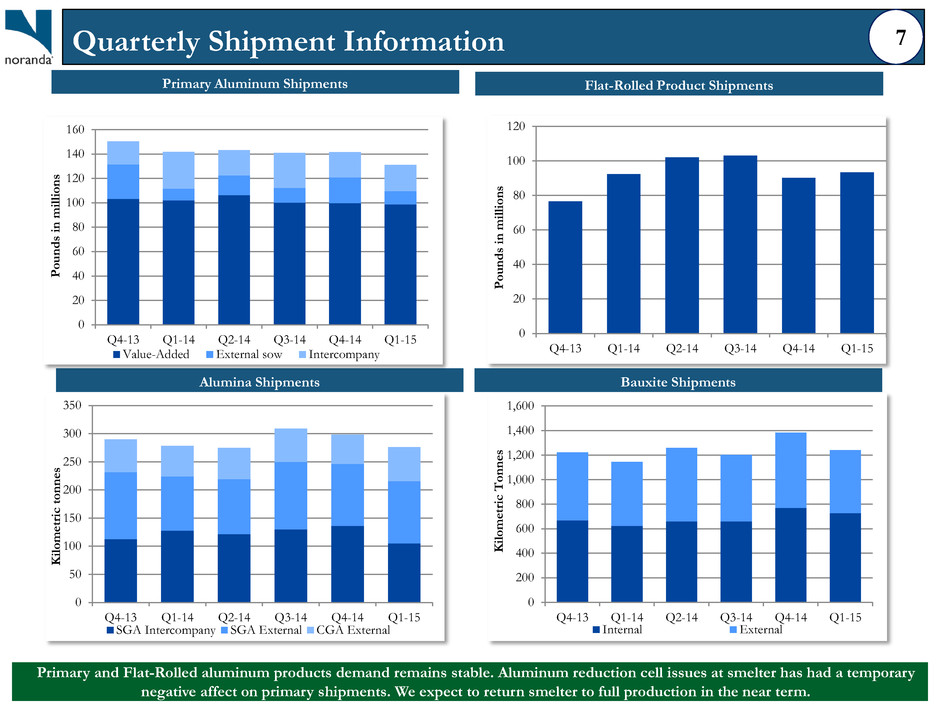
Primary Aluminum Shipments Bauxite Shipments Quarterly Shipment Information Flat-Rolled Product Shipments Alumina Shipments 7 Primary and Flat-Rolled aluminum products demand remains stable. Aluminum reduction cell issues at smelter has had a temporary negative affect on primary shipments. We expect to return smelter to full production in the near term. 0 20 40 60 80 100 120 140 160 Q4-13 Q1-14 Q2-14 Q3-14 Q4-14 Q1-15 P o u n d s in m il li on s Value-Added External sow Intercompany 0 20 40 60 80 100 120 Q4-13 Q1-14 Q2-14 Q3-14 Q4-14 Q1-15 P o u n d s in m il li on s 0 50 100 150 200 250 300 350 Q4-13 Q1-14 Q2-14 Q3-14 Q4-14 Q1-15 K il o m et ri c tonne s SGA Intercompany SGA External CGA External 0 200 400 600 800 1,000 1,200 1,400 1,600 Q4-13 Q1-14 Q2-14 Q3-14 Q4-14 Q1-15 K il o m et ri c T o n n e s Internal External

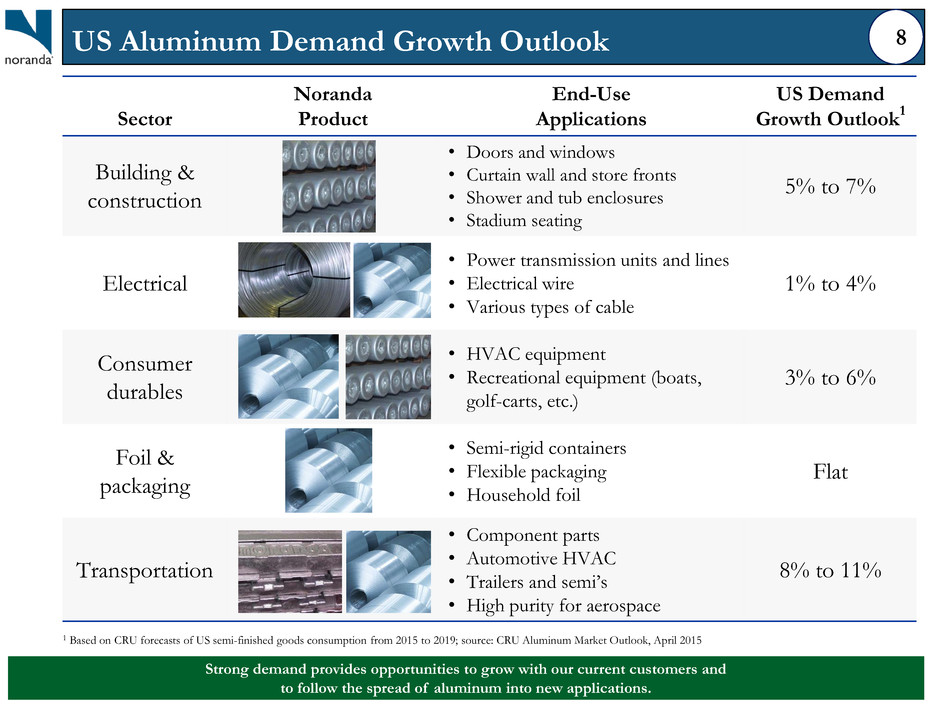
US Aluminum Demand Growth Outlook Sector Noranda Product End-Use Applications US Demand Growth Outlook 1 Building & construction • Doors and windows • Curtain wall and store fronts • Shower and tub enclosures • Stadium seating 5% to 7% Electrical • Power transmission units and lines • Electrical wire • Various types of cable 1% to 4% Consumer durables • HVAC equipment • Recreational equipment (boats, golf-carts, etc.) 3% to 6% Foil & packaging • Semi-rigid containers • Flexible packaging • Household foil Flat Transportation • Component parts • Automotive HVAC • Trailers and semi’s • High purity for aerospace 8% to 11% 1 Based on CRU forecasts of US semi-finished goods consumption from 2015 to 2019; source: CRU Aluminum Market Outlook, April 2015 8 Strong demand provides opportunities to grow with our current customers and to follow the spread of aluminum into new applications.

Restarted; 14% Expect to restart before 2017; 24% Possible restart after 2016; 22% Likely to be permanent; 39% Majority of 5.8 MMT Closures Since 2013 Unlikely to Restart in Near-Term Aluminum’s demand fundamentals continue to be strong • Global aluminum consumption growth expected to outpace most other metals • Outlook for aluminum demand remains attractive, despite slowing growth in China – Global economy continues to become more aluminum- intensive – Emerging economies remain poised to enter a rapid period of industrialization, population growth and urbanization Majority of recent capacity closures unlikely to restart near- term • 5.8 MMT of smelting capacity curtailed since beginning of 2013 • Capacity restarts not expected to be a significant factor – ~85% of capacity curtailed since 2013 remains closed – Only 28% of remainder expected to restart before 2017 • Further smelter closures are expected in China as their marginal smelters still dominate the top half of the global cost curve • Lack of greenfield projects outside China indicates production growth will be modest over the next ten years • Certain global producers have announced reviews of existing capacity with potential for closures Near-term price volatility does not change positive underlying industry fundamentals Aluminum Fundamentals 9 Aluminum’s demand fundamentals continue to be strong, and recent capacity closures unlikely to restart in near-term. Near-term price volatility does not change positive underlying industry fundamentals. Source: CRU Aluminum Market Outlook, April 2015 Sources: Company; CRU Long-Term Market Outlook, December 2014; CRU Aluminum Market Outlook, April 2015 3.3 2.1 2.7 3.5 4.2 1.5 2.5 3.5 4.5 1970 1980 1990 2000 2010 2020 2030 2040 (thou sand tons of a lu m in u m c onsu m pt ion p e r bi ll io n do ll ar o f g loba l WAP I) The Global Economy Continues to Become More Aluminum-Intensive Source: Harbor Aluminum, February 2015

Quarterly Results Last Four Quarters (amounts in millions except per pound data) Q1-14 Q4-14 Q1-15 Q1-14 Q1-15 Integrated Upstream Business: Primary shipments (lbs) 141.9 131.4 131.1 589.3 546.6 Integrated Upstream margin/lb: Midwest Transaction Price/lb $ 0.95 $ 1.12 $ 1.05 0.93 1.06 Integrated net cash cost /lb 0.90 0.80 0.83 0.85 0.84 0.05 0.32 0.22 0.08 0.22 Integrated Upstream segment profit $ 7.6 $ 42.3 $ 29.0 $ 50.6 $ 117.8 Flat-Rolled Products Business: Flat-Rolled shipments (lbs) 92.4 85.7 93.3 371.1 383.9 EBITDA margin/lb $ 0.12 $ 0.14 $ 0.14 $ 0.13 $ 0.15 Flat-Rolled Products segment profit $ 10.9 $ 12.3 $ 12.7 $ 47.1 $ 57.7 Corporate Cost $ (7.8) $ (5.0) $ (7.8) $ (30.2) $ (25.0) Total segment profit $ 10.7 $ 49.6 $ 33.9 $ 67.5 $ 150.5 Segment Profit Summary 10 Trend of improved results is due to (i) higher integrated upstream margin per pound, driven by higher aluminum prices, (ii) strong flat-rolled product volumes and margin, and (iii) lower corporate costs.

Sequential Net Cash Cost and Segment Profit Bridges 11 Sequential total segment profit decline due primarily to a sequential decrease in aluminum prices, which negatively impacted Alumina and Primary results. $0.83 $- $0.03 $0.02 $0.04 $0.80 4Q14 Net Cash Cost LME Price for 3rd Party Alumina Shipments Natural gas Maintenance and related impact on usage rates 1Q15 Net Cash Cost Net Cash Cost Per Pound $33.9 $10.3 $2.3 $3.1 $49.6 4Q14 Segment Profit LME & MWP Impact on Primary Aluminum Shipments, and LME Impact on 3rd Party Alumina Sales Impact of Net Cash Cost Items Above, Excluding LME Price from 3rd Party Alumina Shipments Corporate, Flat-Rolled, and Other 1Q 2015 Segment Profit Segment Profit (in millions)

Year-over-Year Net Cash Cost and Segment Profit Bridges 12 Year-over-year total segment profit increase largely due to improved pricing and lower costs related to weather-related disruptions in the integrated upstream business last year. $0.81 $0.83 $0.09 $0.03 $0.06 $0.01 $0.06 $0.06 $0.90 1Q-14 Net Cash Cost 1Q-14 Alumina/Primary Weather-Related Disruptions Q4 2014 Net Cash Cost (Ex. Weather- Related Disruptions) LME Price for 3rd Party Alumina Shipments Natural Gas Price Commodity-Based Input Prices Maintenance and related impact on usage rates Impact of operating smelter below capacity 1Q-15 Net Cash Cost Net Cash Cost Per Pound $22.0 $33.9 $6.4 $11.3 $16.5 $1.8 $10.7 1Q-14 Segment Profit 1Q-14 Alumina/Primary Weather- Related Disruptions 1Q-14 Segment Profit (Ex. Weather-Related Disruptions) LME & MWP Impact on Primary Aluminum Shipments, and LME Impact on 3rd Party Alumina Sales Impact of Net Cash Cost Items Above, Excluding LME Price from 3rd Party Alumina Shipments Improved Flat-Rolled Products Fabrication Premiums and Margins 1Q-15 Segment Profit Total Segment Profit (in millions)

(amounts in millions) Q1 2014 Q4 2014 Q1 2015 Segment profit $ 10.7 $ 49.6 $ 33.9 LIFO/LCM 0.2 (1.7) 4.8 Other recurring non-cash items (1.4) (1.3) (4.2) EBITDA, excluding special items 9.5 46.6 34.5 Depreciation & amortization (21.7) (23.8) (23.0) Interest expense, net (12.5) (12.7) (13.5) Pre-tax income (loss), excluding special items (24.7) 10.1 (2.0) Income tax (benefit), expense (7.8) 0.5 (0.1) Net income (loss), excluding special items $ (16.9) $ 9.6 $ (1.9) EPS, excluding special items $ (0.25) $ 0.14 $ (0.03) Bridge of Segment Profit to Net Income, Ex. Special Items 13 The $11.5 million sequential decrease in net income (ex. special items) reflects lower segment profit, offset by favorable change in LIFO impact. The $15.0 million year-over-year improvement reflects higher segment profit plus favorable LIFO impact.

Cash and Financial Management Overview $50.0 $23.5 $4.9 $8.0 $23.4 $3.1 $33.9 $3.0 $5.5 $20.5 Cash, December 2014 Segment profit Operating working capital Cash Interest payments Tax payments, net Prepaid expenses & other Beginning cash plus cashfrom operating activities Capital spending Financing activities, net Cash, March 2015 $ in m illi o n (1) Liquidity includes $141.9 million available borrowing capacity under the revolving credit facility plus $23.5 million cash. Net debt (debt minus cash) – $642.5 million Total liquidity – $165.4 million (1) 14 Achieving positive cash flow in first quarter 2015 while spending $24 million on sustaining and growth capital projects demonstrates our commitment to improving our cash flow and liquidity while making the necessary investments in the business.

Key Takeaways 15 • $17 to $25 million annual savings from reduced electricity rate at smelter • $5 million annual shipping cost savings from port expansion project in Jamaica • Savings are independent from fluctuations in aluminum prices Completed in April key initiatives to structurally reduce Noranda’s costs by $22-30 million annually • 1Q-15 operating cash flow was $30 million vs. $20 million use in 1Q-14 • 1Q-15 integrated primary margin/pound was $0.22 vs. $0.05 in 1Q-14 • Working capital investment held flat despite seasonal volume increases Q1 results demonstrate year- over-year improvements and positive cash flow • Focused on implementing specific capital, raw material sourcing and usage, and reliability projects to achieve remaining CORE targets • Invested $24 million in sustaining and growth capital in Q1 • Expect smelter to return to full production in mid Q3-15, following setbacks in late Q1-15 Remain focused on operational excellence, improving our cost structure, and investing in the growth of our integrated platform • Aluminum consumption fundamentals remain solid, and near-term price headwinds represent normal volatility • Strong flat-rolled product volumes and margin • Substantially all our value added and fabricated aluminum products volumes are sold under requirements-based supply agreements (vs. spot) Despite continued volatility in prices, aluminum’s long-term fundamentals remain positive “The achievement of these key initiatives is part of our ongoing CORE productivity program, which provides Noranda a solid foundation from which to operate sustainably and grow through the aluminum cycle. We remain focused on achieving operational excellence, making further improvements to our cost structure, and making prudent investments in our integrated platform.” 1 2 3 4
