Attached files
| file | filename |
|---|---|
| 8-K - AXALTA COATING SYSTEMS LTD. 8-K - Axalta Coating Systems Ltd. | a51096085.htm |
| EX-99.1 - EXHIBIT 99.1 - Axalta Coating Systems Ltd. | a51096085ex99_1.htm |
Exhibit 99.2
 Axalta Coating Systems Ltd.
Q1 2015 Conference Call May 6, 2015
Axalta Coating Systems Ltd.
Q1 2015 Conference Call May 6, 2015
 Notice Regarding Forward
Looking Statements, Non-GAAP Financial Measures and Defined Terms
Forward-Looking Statements This presentation and the oral remarks made
in connection herewith may contain “forward-looking statements” within
the meaning of the U.S. Private Securities Litigation Reform Act of
1995, including those relating to 2015 net sales, Adjusted EBITDA, tax
rate, capital expenditures, plant expansions and net working capital.
Any forward-looking statements involve risks, uncertainties and
assumptions. These statements often include words such as “believe,”
“expect,” “anticipate,” “intend,” “plan,” “estimate,” “target,”
“project,” “forecast,” “seek,” “will,” “may,” “should,” “could,”
“would,” or similar expressions. These statements are based on certain
assumptions that we have made in light of our experience in the industry
and our perceptions of historical trends, current conditions, expected
future developments and other factors we believe are appropriate under
the circumstances as of the date hereof. Although we believe that the
assumptions and analysis underlying these statements are reasonable as
of the date hereof, investors are cautioned not to place undue reliance
on these statements. We do not have any obligation to and do not intend
to update any forward-looking statements included herein, which speak
only as of the date hereof. You should understand that these statements
are not guarantees of future performance or results. Actual results
could differ materially from those described in any forward-looking
statements contained herein or the oral remarks made in connection
herewith as a result of a variety of factors, including known and
unknown risks and uncertainties, many of which are beyond our control.
Non-GAAP Financial Measures The historical financial information
included in this presentation includes financial information that is not
presented in accordance with generally accepted accounting principles in
the United States (“GAAP”), including EBITDA, Adjusted EBITDA and Net
Debt. Management uses these non-GAAP financial measures in the analysis
of our financial and operating performance because they assist in the
evaluation of underlying trends in our business. Our use of the terms
EBITDA, Adjusted EBITDA and Net Debt may differ from that of others in
our industry. EBITDA and Adjusted EBITDA should not be considered as
alternatives to net income (loss), operating income or any other
performance measures derived in accordance with GAAP as measures of
operating performance or operating cash flows or as measures of
liquidity. EBITDA, Adjusted EBITDA and Net Debt have important
limitations as analytical tools and should be considered in conjunction
with, and not as substitutes for, our results as reported under GAAP.
This presentation includes a reconciliation of certain non-GAAP
financial measures with the most directly comparable financial measures
calculated in accordance with GAAP. Defined Terms All capitalized terms
contained within this presentation have been previously defined in our
filings with the United States Securities and Exchange Commission.
Axalta Coating Systems Ltd. 2
Notice Regarding Forward
Looking Statements, Non-GAAP Financial Measures and Defined Terms
Forward-Looking Statements This presentation and the oral remarks made
in connection herewith may contain “forward-looking statements” within
the meaning of the U.S. Private Securities Litigation Reform Act of
1995, including those relating to 2015 net sales, Adjusted EBITDA, tax
rate, capital expenditures, plant expansions and net working capital.
Any forward-looking statements involve risks, uncertainties and
assumptions. These statements often include words such as “believe,”
“expect,” “anticipate,” “intend,” “plan,” “estimate,” “target,”
“project,” “forecast,” “seek,” “will,” “may,” “should,” “could,”
“would,” or similar expressions. These statements are based on certain
assumptions that we have made in light of our experience in the industry
and our perceptions of historical trends, current conditions, expected
future developments and other factors we believe are appropriate under
the circumstances as of the date hereof. Although we believe that the
assumptions and analysis underlying these statements are reasonable as
of the date hereof, investors are cautioned not to place undue reliance
on these statements. We do not have any obligation to and do not intend
to update any forward-looking statements included herein, which speak
only as of the date hereof. You should understand that these statements
are not guarantees of future performance or results. Actual results
could differ materially from those described in any forward-looking
statements contained herein or the oral remarks made in connection
herewith as a result of a variety of factors, including known and
unknown risks and uncertainties, many of which are beyond our control.
Non-GAAP Financial Measures The historical financial information
included in this presentation includes financial information that is not
presented in accordance with generally accepted accounting principles in
the United States (“GAAP”), including EBITDA, Adjusted EBITDA and Net
Debt. Management uses these non-GAAP financial measures in the analysis
of our financial and operating performance because they assist in the
evaluation of underlying trends in our business. Our use of the terms
EBITDA, Adjusted EBITDA and Net Debt may differ from that of others in
our industry. EBITDA and Adjusted EBITDA should not be considered as
alternatives to net income (loss), operating income or any other
performance measures derived in accordance with GAAP as measures of
operating performance or operating cash flows or as measures of
liquidity. EBITDA, Adjusted EBITDA and Net Debt have important
limitations as analytical tools and should be considered in conjunction
with, and not as substitutes for, our results as reported under GAAP.
This presentation includes a reconciliation of certain non-GAAP
financial measures with the most directly comparable financial measures
calculated in accordance with GAAP. Defined Terms All capitalized terms
contained within this presentation have been previously defined in our
filings with the United States Securities and Exchange Commission.
Axalta Coating Systems Ltd. 2
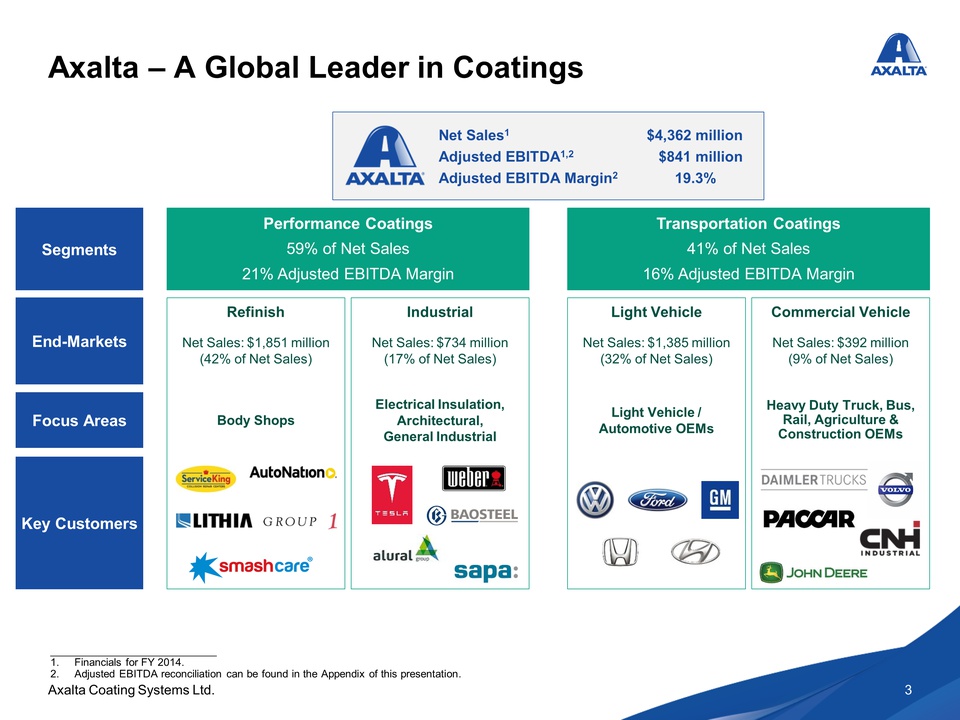 Axalta – A Global Leader in
Coatings Net Sales 1 $4,362 million Adjusted EBITDA 1,2 $841 million
Adjusted EBITDA Margin 2 19.3% Segments Performance Coatings 59% of Net
Sales 21% Adjusted EBITDA Margin Transportation Coatings 41% of Net
Sales 16% Adjusted EBITDA Margin End-Markets Focus Areas Key Customers
Body Shops Electrical Insulation, Architectural, General Industrial
Light Vehicle / Automotive OEMs Heavy Duty Truck, Bus, Rail, Agriculture
& Construction OEMs Net Sales: $1,851 million (42% of Net Sales) Net
Sales: $734 million (17% of Net Sales) Net Sales: $1,385 million (32% of
Net Sales) Net Sales: $392 million (9% of Net Sales) Refinish Industrial
Light Vehicle Commercial Vehicle 1. Financials for FY 2014. 2. Adjusted
EBITDA reconciliation can be found in the Appendix of this presentation.
Axalta Coating Systems Ltd. 3
Axalta – A Global Leader in
Coatings Net Sales 1 $4,362 million Adjusted EBITDA 1,2 $841 million
Adjusted EBITDA Margin 2 19.3% Segments Performance Coatings 59% of Net
Sales 21% Adjusted EBITDA Margin Transportation Coatings 41% of Net
Sales 16% Adjusted EBITDA Margin End-Markets Focus Areas Key Customers
Body Shops Electrical Insulation, Architectural, General Industrial
Light Vehicle / Automotive OEMs Heavy Duty Truck, Bus, Rail, Agriculture
& Construction OEMs Net Sales: $1,851 million (42% of Net Sales) Net
Sales: $734 million (17% of Net Sales) Net Sales: $1,385 million (32% of
Net Sales) Net Sales: $392 million (9% of Net Sales) Refinish Industrial
Light Vehicle Commercial Vehicle 1. Financials for FY 2014. 2. Adjusted
EBITDA reconciliation can be found in the Appendix of this presentation.
Axalta Coating Systems Ltd. 3
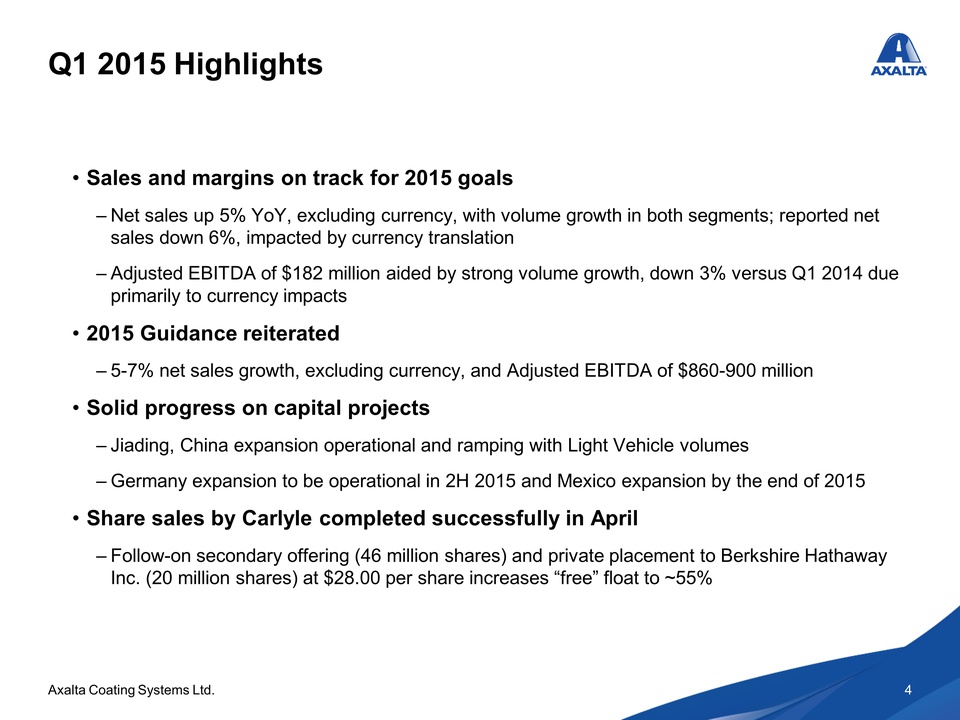 Q1 2015 Highlights Sales
and margins on track for 2015 goals – Net sales up 5% YoY, excluding
currency, with volume growth in both segments; reported net sales down
6%, impacted by currency translation – Adjusted EBITDA of $182 million
aided by strong volume growth, down 3% versus Q1 2014 due primarily to
currency impacts 2015 Guidance reiterated – 5-7% net sales growth,
excluding currency, and Adjusted EBITDA of $860-900 million Solid
progress on capital projects – Jiading, China expansion operational and
ramping with Light Vehicle volumes – Germany expansion to be operational
in 2H 2015 and Mexico expansion by the end of 2015 Share sales by
Carlyle completed successfully in April – Follow-on secondary offering
(46 million shares) and private placement to Berkshire Hathaway Inc. (20
million shares) at $28.00 per share increases “free” float to ~55%
Axalta Coating Systems Ltd. 4
Q1 2015 Highlights Sales
and margins on track for 2015 goals – Net sales up 5% YoY, excluding
currency, with volume growth in both segments; reported net sales down
6%, impacted by currency translation – Adjusted EBITDA of $182 million
aided by strong volume growth, down 3% versus Q1 2014 due primarily to
currency impacts 2015 Guidance reiterated – 5-7% net sales growth,
excluding currency, and Adjusted EBITDA of $860-900 million Solid
progress on capital projects – Jiading, China expansion operational and
ramping with Light Vehicle volumes – Germany expansion to be operational
in 2H 2015 and Mexico expansion by the end of 2015 Share sales by
Carlyle completed successfully in April – Follow-on secondary offering
(46 million shares) and private placement to Berkshire Hathaway Inc. (20
million shares) at $28.00 per share increases “free” float to ~55%
Axalta Coating Systems Ltd. 4
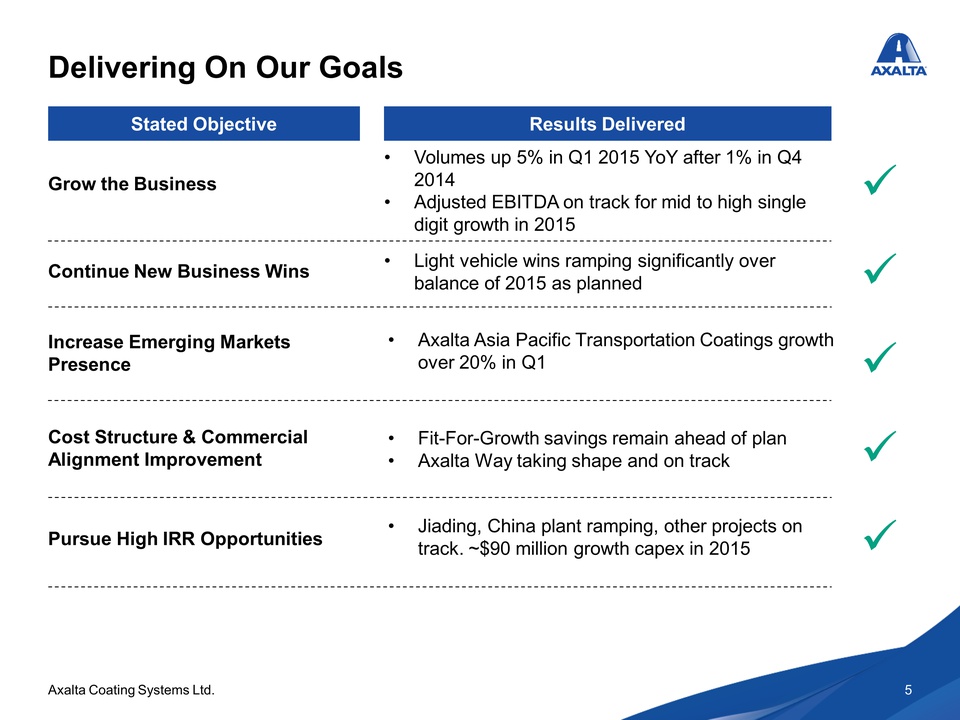 Delivering On Our Goals
Stated Objective Results Delivered Grow the Business Continue New
Business Wins Increase Emerging Markets Presence Cost Structure &
Commercial Alignment Improvement Pursue High IRR Opportunities Volumes
up 5% in Q1 2015 YoY after 1% in Q4 2014 Adjusted EBITDA on track for
mid to high single digit growth in 2015 Light vehicle wins ramping
significantly over balance of 2015 as planned Axalta Asia Pacific
Transportation Coatings growth over 20% in Q1 Fit-For-Growth savings
remain ahead of plan Axalta Way taking shape and on track Axalta Coating
Systems Ltd . 5 Jiading, China plant ramping, other projects on track.
~$90 million growth capex in 2015 Axalta Coating Systems Ltd. 5
Delivering On Our Goals
Stated Objective Results Delivered Grow the Business Continue New
Business Wins Increase Emerging Markets Presence Cost Structure &
Commercial Alignment Improvement Pursue High IRR Opportunities Volumes
up 5% in Q1 2015 YoY after 1% in Q4 2014 Adjusted EBITDA on track for
mid to high single digit growth in 2015 Light vehicle wins ramping
significantly over balance of 2015 as planned Axalta Asia Pacific
Transportation Coatings growth over 20% in Q1 Fit-For-Growth savings
remain ahead of plan Axalta Way taking shape and on track Axalta Coating
Systems Ltd . 5 Jiading, China plant ramping, other projects on track.
~$90 million growth capex in 2015 Axalta Coating Systems Ltd. 5
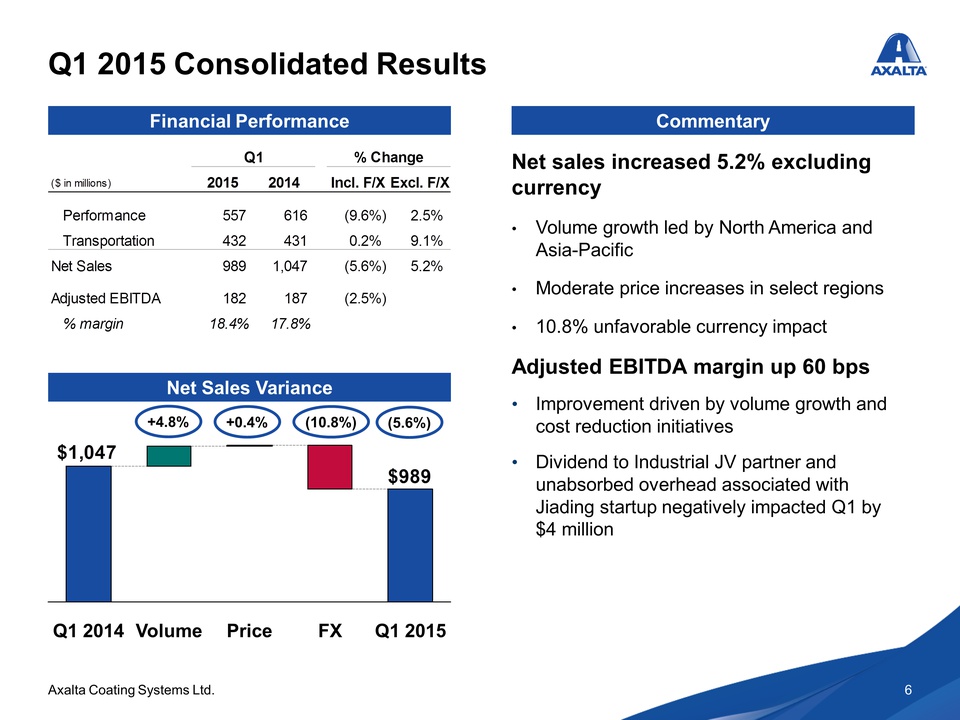 Q1 2015 Consolidated
Results Financial Performance Q1 % Change ($ in millions) 2015 2014
Incl. F/X Excl. F/X Performance 557 616 (9.6%) 2.5% Transportation 432
431 0.2% 9.1% Net Sales 989 1,047 (5.6%) 5.2% Adjusted EBITDA 182 187
(2.5%) % margin 18.4% 17.8% Commentary Net sales increased 5.2%
excluding currency Volume growth led by North America and Asia-Pacific
Moderate price increases in select regions 10.8% unfavorable currency
impact Adjusted EBITDA margin up 60 bps Improvement driven by volume
growth and cost reduction initiatives Dividend to Industrial JV partner
and unabsorbed overhead associated with Jiading startup negatively
impacted Q1 by $4 million Net Sales Variance $1,047 +4.8% +0.4% (10.8%)
(5.6%) $989 Q1 2014 Volume Price FX Q1 2015 Axalta Coating Systems Ltd. 6
Q1 2015 Consolidated
Results Financial Performance Q1 % Change ($ in millions) 2015 2014
Incl. F/X Excl. F/X Performance 557 616 (9.6%) 2.5% Transportation 432
431 0.2% 9.1% Net Sales 989 1,047 (5.6%) 5.2% Adjusted EBITDA 182 187
(2.5%) % margin 18.4% 17.8% Commentary Net sales increased 5.2%
excluding currency Volume growth led by North America and Asia-Pacific
Moderate price increases in select regions 10.8% unfavorable currency
impact Adjusted EBITDA margin up 60 bps Improvement driven by volume
growth and cost reduction initiatives Dividend to Industrial JV partner
and unabsorbed overhead associated with Jiading startup negatively
impacted Q1 by $4 million Net Sales Variance $1,047 +4.8% +0.4% (10.8%)
(5.6%) $989 Q1 2014 Volume Price FX Q1 2015 Axalta Coating Systems Ltd. 6
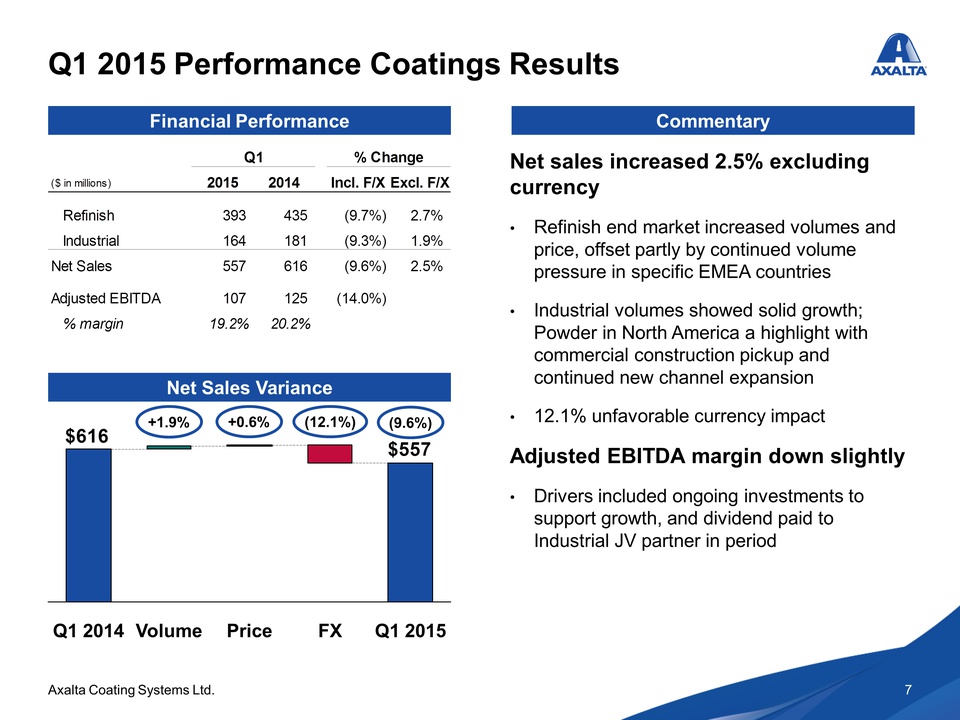 Q1 2015 Performance
Coatings Results Financial Performance Q1 % Change ($ in millions) 2015
2014 Incl. F/X Excl. F/X Refinish 393 435 (9.7%) 2.7% Industrial 164 181
(9.3%) 1.9% Net Sales 557 616 (9.6%) 2.5% Adjusted EBITDA 107 125
(14.0%) % margin 19.2% 20.2% Commentary Net sales increased 2.5%
excluding currency Refinish end market increased volumes and price,
offset partly by continued volume pressure in specific EMEA countries
Industrial volumes showed solid growth; Powder in North America a
highlight with commercial construction pickup and continued new channel
expansion 12.1% unfavorable currency impact Adjusted EBITDA margin down
slightly Drivers included ongoing investments to support growth, and
dividend paid to Industrial JV partner in period Net Sales Variance $616
+1.9% +0.6% (12.1%) (9.6%) $557 Q1 2014 Volume Price FX Q1 2015 Axalta
Coating Systems Ltd. 7
Q1 2015 Performance
Coatings Results Financial Performance Q1 % Change ($ in millions) 2015
2014 Incl. F/X Excl. F/X Refinish 393 435 (9.7%) 2.7% Industrial 164 181
(9.3%) 1.9% Net Sales 557 616 (9.6%) 2.5% Adjusted EBITDA 107 125
(14.0%) % margin 19.2% 20.2% Commentary Net sales increased 2.5%
excluding currency Refinish end market increased volumes and price,
offset partly by continued volume pressure in specific EMEA countries
Industrial volumes showed solid growth; Powder in North America a
highlight with commercial construction pickup and continued new channel
expansion 12.1% unfavorable currency impact Adjusted EBITDA margin down
slightly Drivers included ongoing investments to support growth, and
dividend paid to Industrial JV partner in period Net Sales Variance $616
+1.9% +0.6% (12.1%) (9.6%) $557 Q1 2014 Volume Price FX Q1 2015 Axalta
Coating Systems Ltd. 7
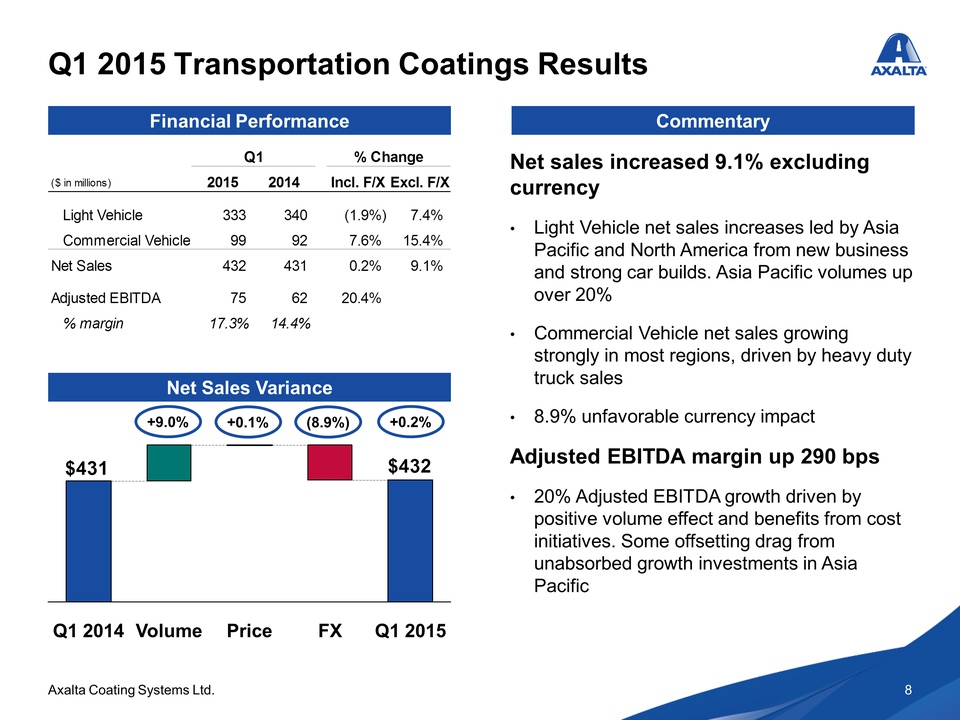
Q1 2015 Transportation Coatings Results Financial Performance Q1 % Change ($ in millions) 2015 2014 Incl. F/X Excl. F/X Light Vehicle 333 340 (1.9%) 7.4% Commercial Vehicle 99 92 7.6% 15.4% Net Sales 432 431 0.2% 9.1% Adjusted EBITDA 75 62 20.4% % margin 17.3% 14.4% Commentary Net sales increased 9.1% excluding currency Light Vehicle net sales increases led by Asia Pacific and North America from new business and strong car builds. Asia Pacific volumes up over 20% Commercial Vehicle net sales growing strongly in most regions, driven by heavy duty truck sales 8.9% unfavorable currency impact Adjusted EBITDA margin up 290 bps 20% Adjusted EBITDA growth driven by positive volume effect and benefits from cost initiatives. Some offsetting drag from unabsorbed growth investments in Asia Pacific Net Sales Variance $431 +9.0% +0.1% (8.9%) +0.2% $432 Q1 2014 Volume Price FX Q1 2015 Axalta Coating Systems Ltd. 8
Cost Optimization Initiatives Progressing Well Fit-For-Growth: $100 million savings plan is on budget – Methodically tracking progress towards remainder of program – Expect $60 million cumulative savings to be realized by the end of 2015 Axalta Way: $100 million savings targeted – Detailed planning and execution began in Q1 – Opportunities in procurement, operations, commercial practices, and SG&A One Time Costs: Minor with independent company transition costs now complete – Q1 saw $4 million for termination benefits, $3 million for consulting and advisory fees Axalta Coating Systems Ltd. 9
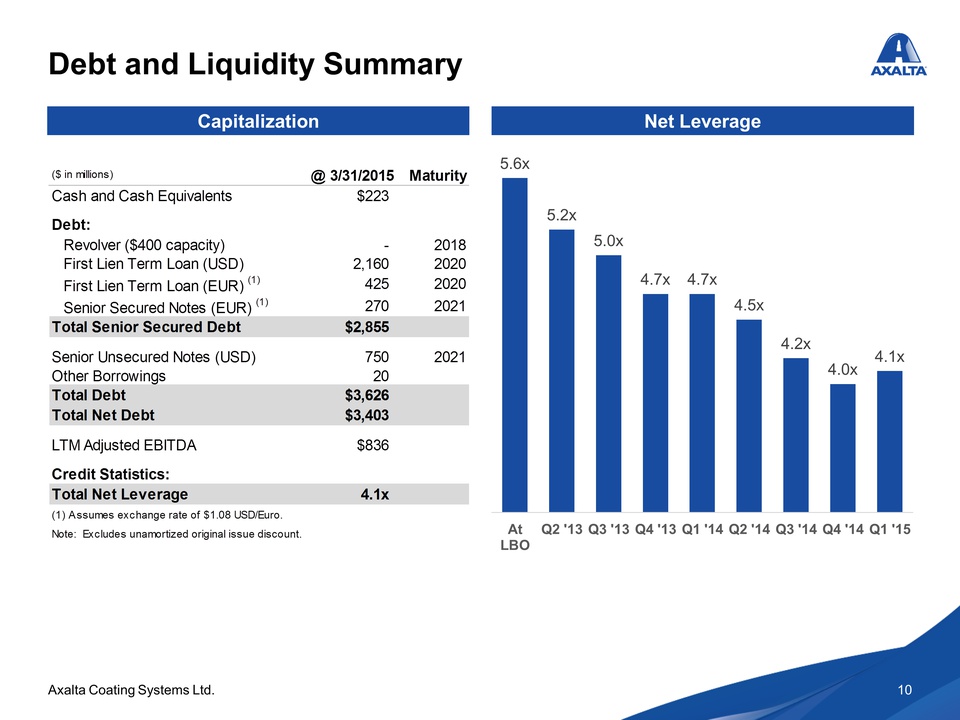
Debt and Liquidity Summary Net Leverage 5.6x 5.2x 5.0x 4.7x 4.7x 4.5x 4.2x 4.0x 4.1x At LBO Q2 '13 Q3 '13 Q4 '13 Q1 '14 Q2 '14 Q3 '14 Q4 '14 Q1 '15 Capitalization ($ in millions) @ 3/31/2015 Maturity Cash and Cash Equivalents $223 Debt: Revolver ($400 capacity) - 2018 First Lien Term Loan (USD) 2,160 2020 First Lien Term Loan (EUR) (1) 425 2020 Senior Secured Notes (EUR) (1) 270 2021 Total Senior Secured Debt $2,855 Senior Unsecured Notes (USD) 750 2021 Other Borrowings 20 Total Debt $3,626 Total Net Debt $3,403 LTM Adjusted EBITDA $836 Credit Statistics: Total Net Leverage 4.1x (1) Assumes exchange rate of $1.08 USD/Euro. Note: Excludes unamortized original issue discount. Axalta Coating Systems Ltd. 10
Full Year 2015 Guidance Reiterated Net Sales Growth: + 5-7% excluding F/X; flat to slightly down on an as-reported basis – Growth across all regions and end-markets, excluding F/X impact, which is a significant headwind, though primarily translational with production and sales fairly balanced by region – Performance Coatings Drivers: Increased volumes, selective price increases – Transportation Coatings Drivers: Light Vehicle ramp from recent “wins”; continued strong truck production Adjusted EBITDA: $860-900 million – Adjusted EBITDA margin of approximately 20% – Drivers: Ramping sales growth and savings from our optimization initiatives – 2H 2015 ramps with new capacity coming online to serve Light Vehicle plant wins Tax Rate: Normalized effective @ 27-29% CapEx: $150 million, ~60% for growth & productivity projects Net working capital: 13-15% of net sales, excluding previously expensed transition-related items Axalta Coating Systems Ltd. 11
Appendix
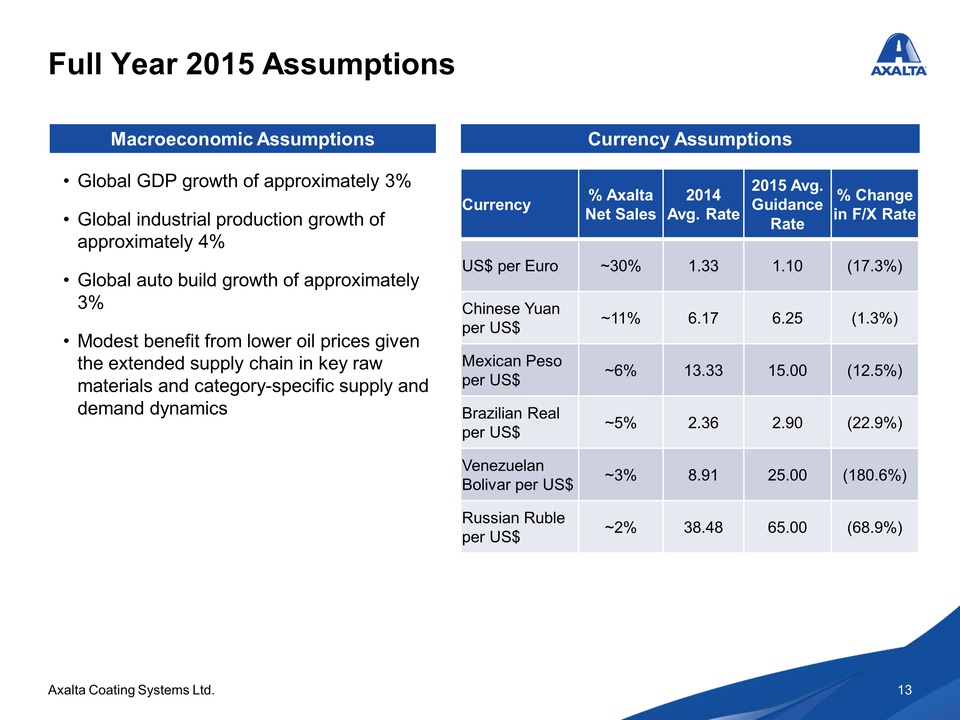
Full Year 2015 Assumptions Currency Assumptions Currency % Axalta Net Sales 2014 Avg. Rate 2015 Avg. Guidance Rate % Change in F/X Rate US$ per Euro ~30% 1.33 1.10 (17.3%) Chinese Yuan per US$ ~11% 6.17 6.25 (1.3%) Mexican Peso per US$ ~6% 13.33 15.00 (12.5%) Brazilian Real per US$ ~5% 2.36 2.90 (22.9%) Venezuelan Bolivar per US$ ~3% 8.91 25.00 (180.6%) Russian Ruble per US$ ~2% 38.48 65.00 (68.9%) Macroeconomic Assumptions Global GDP growth of approximately 3% Global industrial production growth of approximately 4% Global auto build growth of approximately 3% Modest benefit from lower oil prices given the extended supply chain in key raw materials and category-specific supply and demand dynamics Axalta Coating Systems Ltd. 13
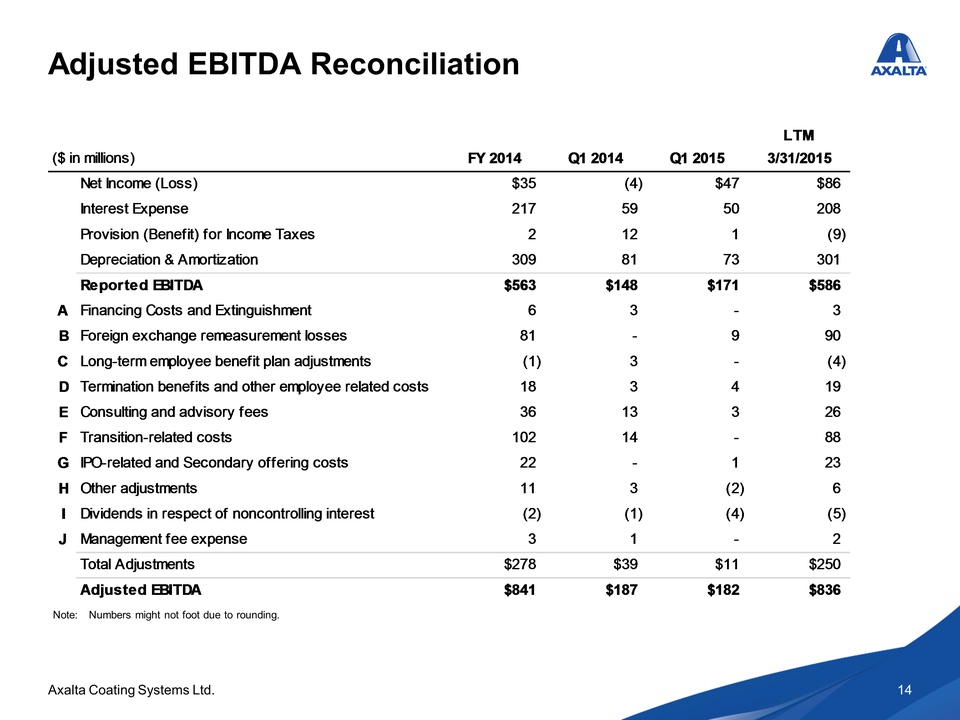
Adjusted EBITDA Reconciliation ($ in millions) FY 2014 Q1 2014 Q1 2015 LTM 3/31/2015 Net Income (Loss) $35 (4) $47 $86 Interest Expense 217 59 50 208 Provision (Benefit) for Income Taxes 2 12 1 (9) Depreciation & Amortization 309 81 73 301 Reported EBITDA $563 $148 $171 $586 A Financing Costs and Extinguishment 6 3 - 3 B Foreign exchange remeasurement losses 81 - 9 90 C Long-term employee benefit plan adjustments (1) 3 - (4) D Termination benefits and other employee related costs 18 3 4 19 E Consulting and advisory fees 36 13 3 26 F Transition-related costs 102 14 - 88 G IPO-related and Secondary offering costs 22 - 1 23 H Other adjustments 11 3 (2) 6 I Dividends in respect of noncontrolling interest (2) (1) (4) (5) J Management fee expense 3 1 - 2 Total Adjustments $278 $39 $11 $250 Adjusted EBITDA $841 $187 $182 $836 Note: Numbers might not foot due to rounding. Axalta Coating Systems Ltd. 14
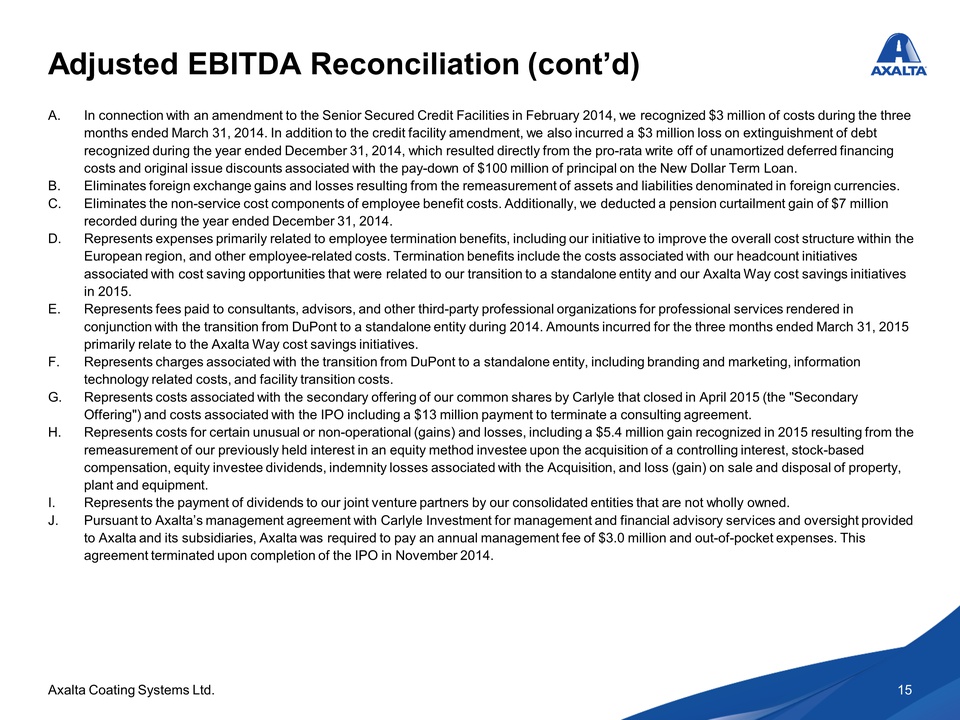
Adjusted EBITDA Reconciliation (cont’d) A. In connection with an amendment to the Senior Secured Credit Facilities in February 2014, we recognized $3 million of costs during the three months ended March 31, 2014. In addition to the credit facility amendment, we also incurred a $3 million loss on extinguishment of debt recognized during the year ended December 31, 2014, which resulted directly from the pro-rata write off of unamortized deferred financing costs and original issue discounts associated with the pay-down of $100 million of principal on the New Dollar Term Loan. B. Eliminates foreign exchange gains and losses resulting from the remeasurement of assets and liabilities denominated in foreign currencies. C. Eliminates the non-service cost components of employee benefit costs. Additionally, we deducted a pension curtailment gain of $7 million recorded during the year ended December 31, 2014. D. Represents expenses primarily related to employee termination benefits, including our initiative to improve the overall cost structure within the European region, and other employee-related costs. Termination benefits include the costs associated with our headcount initiatives associated with cost saving opportunities that were related to our transition to a standalone entity and our Axalta Way cost savings initiatives in 2015. E. Represents fees paid to consultants, advisors, and other third-party professional organizations for professional services rendered in conjunction with the transition from DuPont to a standalone entity during 2014. Amounts incurred for the three months ended March 31, 2015 primarily relate to the Axalta Way cost savings initiatives. F. Represents charges associated with the transition from DuPont to a standalone entity, including branding and marketing, information technology related costs, and facility transition costs. G. Represents costs associated with the secondary offering of our common shares by Carlyle that closed in April 2015 (the "Secondary Offering") and costs associated with the IPO including a $13 million payment to terminate a consulting agreement. H. Represents costs for certain unusual or non-operational (gains) and losses, including a $5.4 million gain recognized in 2015 resulting from the remeasurement of our previously held interest in an equity method investee upon the acquisition of a controlling interest, stock-based compensation, equity investee dividends, indemnity losses associated with the Acquisition, and loss (gain) on sale and disposal of property, plant and equipment. I. Represents the payment of dividends to our joint venture partners by our consolidated entities that are not wholly owned. J. Pursuant to Axalta’s management agreement with Carlyle Investment for management and financial advisory services and oversight provided to Axalta and its subsidiaries, Axalta was required to pay an annual management fee of $3.0 million and out-of-pocket expenses. This agreement terminated upon completion of the IPO in November 2014. Axalta Coating Systems Ltd. 15