Attached files
| file | filename |
|---|---|
| 8-K - FORM 8-K - IBERIABANK CORP | d920426d8k.htm |
Exhibit 99.1
SET: Exhibit 99.1 Annual Shareholders’ Meeting M a y 5 , 2 0 1 5
2 0 1 5 A n n u a l S h a r e h o l d e r s ’ M e e t i n g • Introduction • A Legacy of Growth • An Organic Growth Compound • Growing Bold Together • Strength In Numbers • Concluding Remarks
| 2 |
|
S a f e H a r b o r A n d L e g e n d To the extent that statements in this PowerPoint presentation relate to future plans, objectives, financial results or performance of IBERIABANK Corporation, these statements are deemed to be forward-looking statements within the meaning of the Private Securities Litigation Reform Act of 1995. Such statements, which are based on management’s current information, estimates and assumptions and the current economic environment, are generally identified by the use of the words “plan”, “believe”, “expect”, “intend”, “anticipate”, “estimate”, “project” or similar expressions. The Company’s actual strategies, results and financial condition in future periods may differ materially from those currently expected due to various risks and uncertainties. Forward-looking statements are subject to numerous assumptions, risks and uncertainties that change over time and could cause actual results or financial condition to differ materially from those expressed in or implied by such statements. Consequently, no forward-looking statement can be guaranteed. In connection with the proposed merger with Georgia Commerce Bancshares, Inc., IBERIABANK Corporation has filed a Registration Statement on Form S-4 that contains a proxy statement/prospectus. INVESTORS AND SECURITY HOLDERS ARE URGED TO CAREFULLY READ THE PROXY STATEMENT/ PROSPECTUS REGARDING THE PROPOSED TRANSACTION BECAUSE SUCH DOCUMENTS CONTAIN IMPORTANT INFORMATION. Investors and security holders may obtain a free copy of the proxy statement/prospectus and other documents containing information about the pending transaction with Georgia Commerce Bancshares, Inc., without charge, at the SEC’s website at www.sec.gov. Copies of the proxy statement /prospectus and the SEC filings that are incorporated by reference in the proxy statement/prospectus may also be obtained for free from the IBERIABANK Corporation website, www.iberiabank.com, under the heading “Investor Information”. This communication is not a solicitation of any vote or approval, is not an offer to purchase shares of common stock of Georgia Commerce Bancshares, Inc., nor is it an offer to sell shares of IBERIABANK Corporation common stock which may be issued in the proposed merger. The issuance of IBERIABANK Corporation common stock in any proposed merger would have to be registered under the Securities Act of 1933, as amended, and such IBERIABANK Corporation common stock would be offered only by means of a prospectus complying with that Act. 3
M i s s i o n S t a t e m e n t • Provide Exceptional Value-Based Client Service • Great Place To Work • Growth That Is Consistent With High Performance • Shareholder Focused • Strong Sense Of Community 4
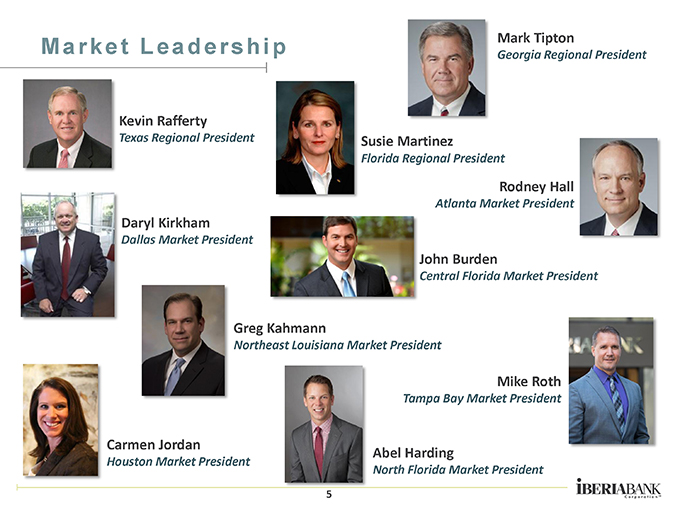
M a r k e t L e a d e r s h i p Mark Tipton Georgia Regional President Kevin Rafferty Texas Regional President Susie Martinez Florida Regional President Rodney Hall Atlanta Market President Daryl Kirkham Dallas Market President John Burden Central Florida Market President Greg Kahmann Northeast Louisiana Market President Mike Roth Tampa Bay Market President Carmen Jordan Abel Harding Houston Market President North Florida Market President 5
R e t i r e m e n t s i n 2 0 1 4 • George Becker • Rita Kleinpeter • Chuck Quick 6
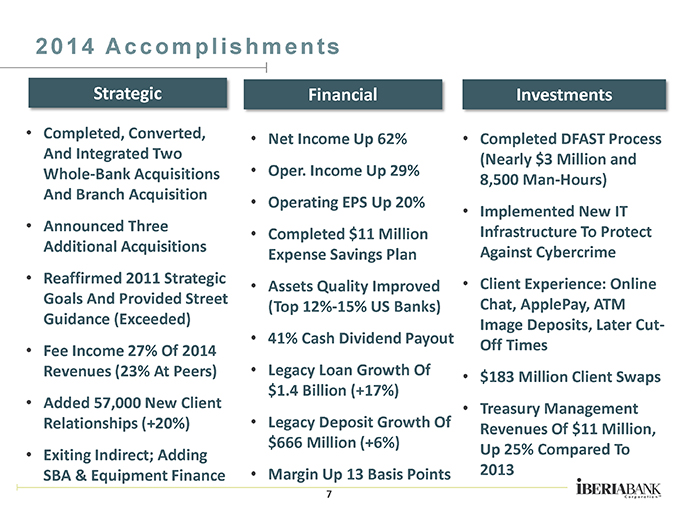
2 0 1 4 A c c o m p l i s h m e n t s • Completed, Converted, And Integrated Two Whole-Bank Acquisitions And Branch Acquisition • Announced Three Additional Acquisitions • Reaffirmed 2011 Strategic Goals And Provided Street Guidance (Exceeded) • Fee Income 27% Of 2014 Revenues (23% At Peers) • Added 57,000 New Client Relationships (+20%) • Exiting Indirect; Adding SBA & Equipment Finance • Net Income Up 62% • Oper. Income Up 29% • Operating EPS Up 20% • Completed $11 Million Expense Savings Plan • Assets Quality Improved (Top 12%-15% US Banks) • 41% Cash Dividend Payout • Legacy Loan Growth Of $1.4 Billion (+17%) • Legacy Deposit Growth Of $666 Million (+6%) • Margin Up 13 Basis Points • Completed DFAST Process (Nearly $3 Million and 8,500 Man-Hours) • Implemented New IT Infrastructure To Protect Against Cybercrime • Client Experience: Online Chat, ApplePay, ATM Image Deposits, Later Cut-Off Times • $183 Million Client Swaps • Treasury Management Revenues Of $11 Million, Up 25% Compared To 2013 7
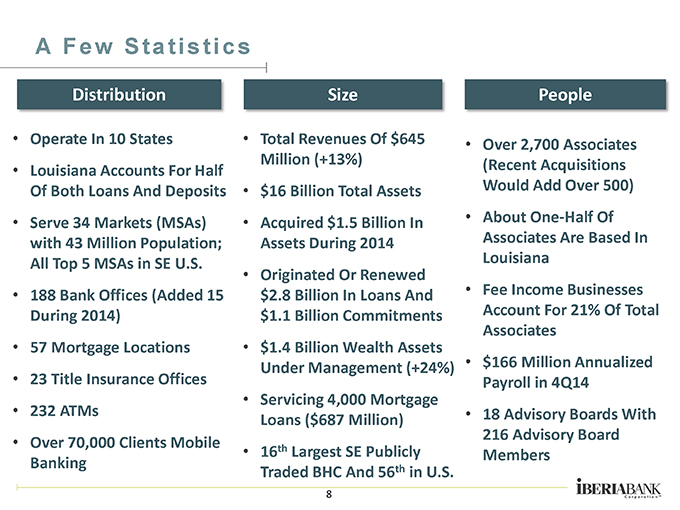
A F e w S t a t i s t i c s • Operate In 10 States • Louisiana Accounts For Half Of Both Loans And Deposits • Serve 34 Markets (MSAs) with 43 Million Population; All Top 5 MSAs in SE U.S. • 188 Bank Offices (Added 15 During 2014) • 57 Mortgage Locations • 23 Title Insurance Offices • 232 ATMs • Over 70,000 Clients Mobile Banking • Total Revenues Of $645 Million (+13%) • $16 Billion Total Assets • Acquired $1.5 Billion In Assets During 2014 • Originated Or Renewed $2.8 Billion In Loans And $1.1 Billion Commitments • $1.4 Billion Wealth Assets Under Management (+24%) • Servicing 4,000 Mortgage Loans ($687 Million) • 16th Largest SE Publicly Traded BHC And 56th in U.S. • Over 2,700 Associates (Recent Acquisitions Would Add Over 500) • About One-Half Of Associates Are Based In Louisiana • Fee Income Businesses Account For 21% Of Total Associates • $166 Million Annualized Payroll in 4Q14 • 18 Advisory Boards With 216 Advisory Board Members 8
2 0 1 5 F o c a l P o i n t s • Maintain Progress Toward Achieving Our Strategic Goals • Successful Completion, Conversion, And Integration Of The Three Acquisitions Announced in 4Q14 • Explore And Execute On Additional Acquisition Opportunities • Improve Our Operating Efficiency And Profitability • Further Develop Our Fee Income Businesses • Navigate The Economic Influences of Energy On Our Business • Continue Double-Digit Growth Rates In Legacy Franchise • Improve Shareholder Returns Via High-Quality EPS Growth 9

A Legacy of Growth Doing it the right way 10
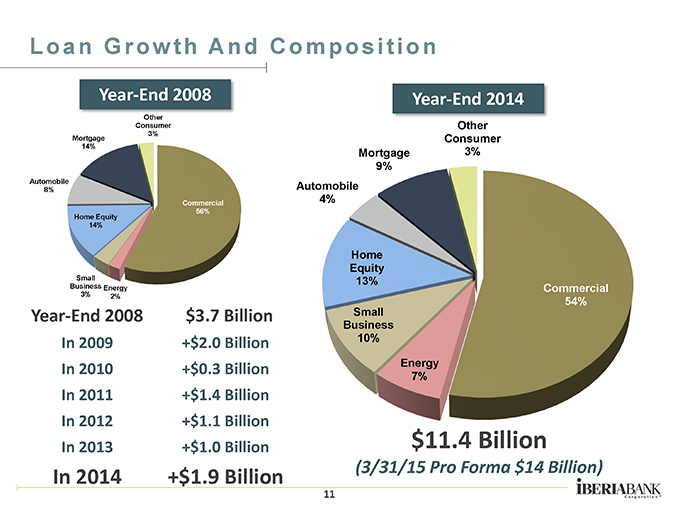
L o a n G r o w t h A n d C o m p o s i t i o n Year-End 2008 other Consumer 3% Mortgage 14% Automobile Home equity 14% commercial 56% small business 3% energy 2% Year-End 2008 $3.7 Billion In 2009 +$2.0 Billion In 2010 +$0.3 Billion In 2011 +$1.4 Billion In 2012 +$1.1 Billion In 2013 +$1.0 Billion In 2014 +$1.9 Billion Consumer Mortgage 3% 9% Automobile 4% Home Equity 13% Commercial 54% Small Business 10% Energy 7% $11.4 Billion (3/31/15 Pro Forma $14 Billion) 11
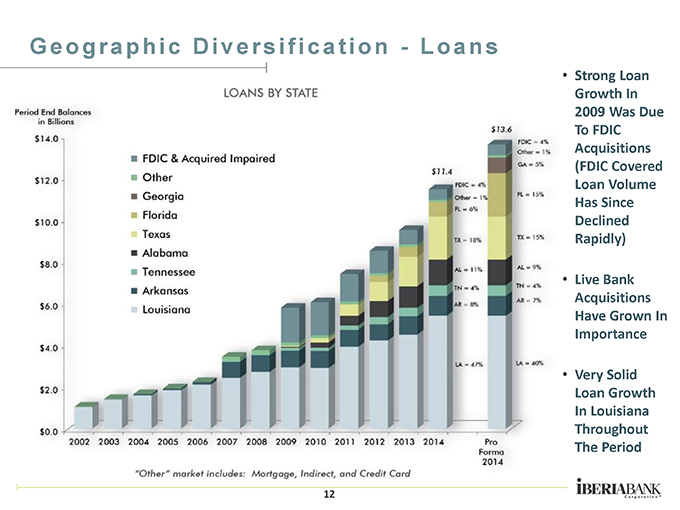
G e o g r a p h i c D i v e r s i f i c a t i o n—L o a n s • Strong Loan Growth In 2009 Was Due To FDIC Acquisitions (FDIC Covered Loan Volume Has Since Declined Rapidly) • Live Bank Acquisitions Have Grown In Importance • Very Solid Loan Growth In Louisiana Throughout The Period 12
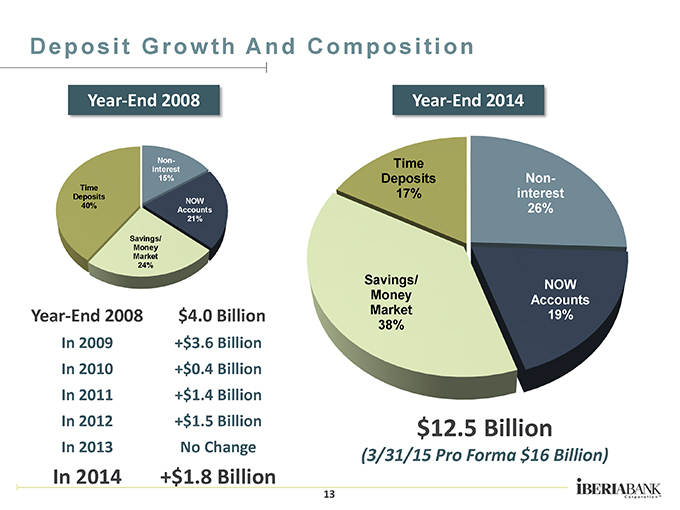
D e p o s i t G r o w t h A n d C o m p o s i t i o n Year-End 2008 Non-interest 15% Time Deposits NOW 40% Accounts 21% Savings/ Money Market 24% Year-End 2008 $4.0 Billion In 2009 +$3.6 Billion In 2010 +$0.4 Billion In 2011 +$1.4 Billion In 2012 +$1.5 Billion In 2013 No Change In 2014 +$1.8 Billion Year-End 2014 Time Deposits Non-17% interest 26% Savings/ NOW Money Accounts Market 19% 38% $12.5 Billion (3/31/15 Pro Forma $16 Billion) 13
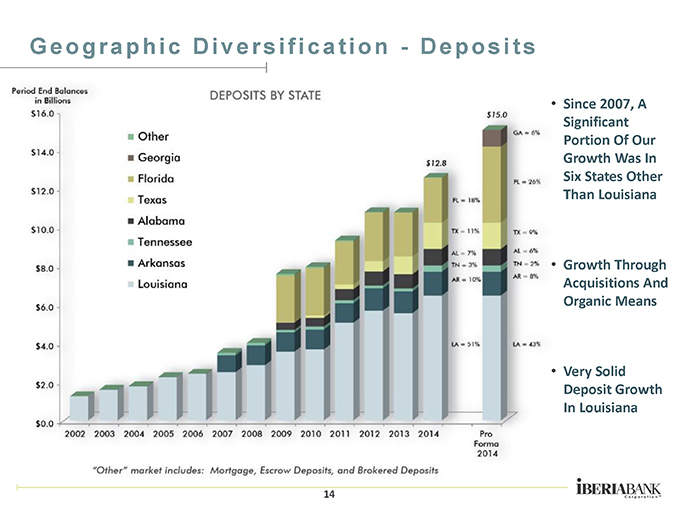
G e o g r a p h i c D i v e r s i f i c a t i o n—D e p o s i t s • Since 2007, A Significant Portion Of Our Growth Was In Six States Other Than Louisiana • Growth Through Acquisitions And Organic Means • Very Solid Deposit Growth In Louisiana 14

Growing bold together Acquiring the fight partners It is far better to buy a wonderful company at a fair price than a fair company at a wonderful price.15
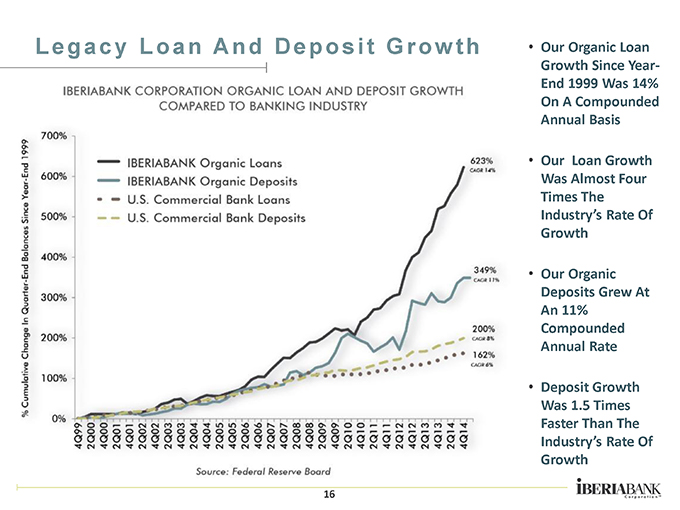
L e g a c y L o a n A n d D e p o s i t G r o w t h • Our Organic Loan Growth Since Year-End 1999 Was 14% On A Compounded Annual Basis • Our Loan Growth Was Almost Four Times The Industry’s Rate Of Growth • Our Organic Deposits Grew At An 11% Compounded Annual Rate • Deposit Growth Was 1.5 Times Faster Than The Industry’s Rate Of Growth 16
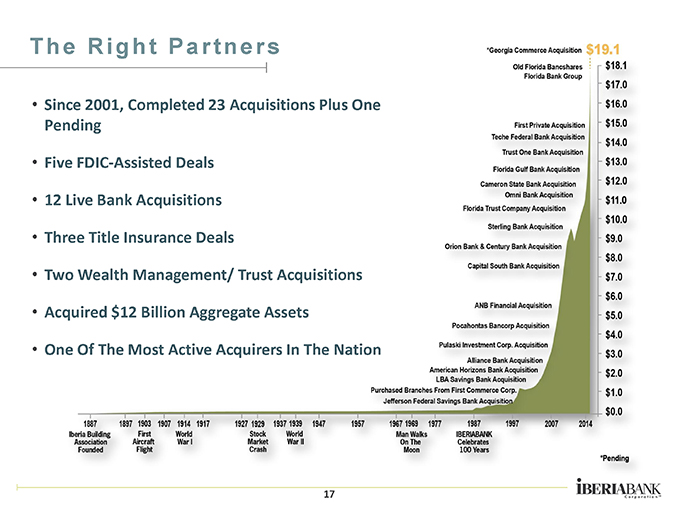
T h e R i g h t P a r t n e r s • Since 2001, Completed 23 Acquisitions Plus One Pending • Five FDIC-Assisted Deals • 12 Live Bank Acquisitions • Three Title Insurance Deals • Two Wealth Management/ Trust Acquisitions • Acquired $12 Billion Aggregate Assets • One Of The Most Active Acquirers In The Nation 17
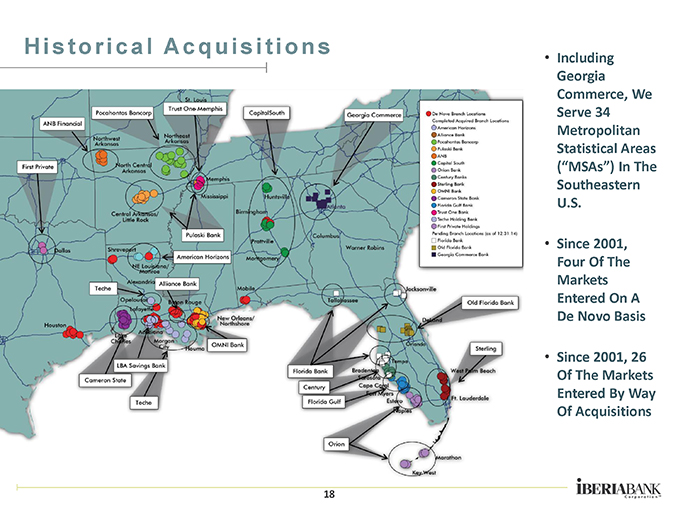
H i s t o r i c a l A c q u i s i t i o n s • Including Georgia Commerce, We Serve 34 Metropolitan Statistical Areas (“MSAs”) In The Southeastern U.S. • Since 2001, Four Of The Markets Entered On A De Novo Basis • Since 2001, 26 Of The Markets Entered By Way Of Acquisitions 18
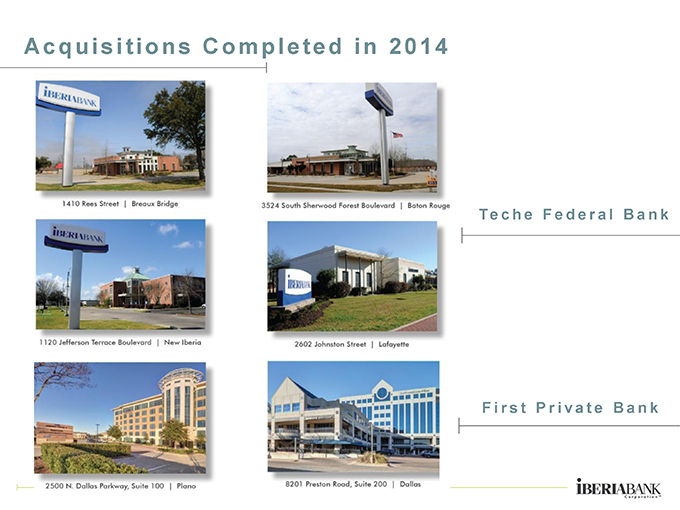
A c q u i s i t i o n s C o m p l e t e d i n 2 0 1 4 Te c h e F e d e r a l B a nk F i r s t P r i v a t e B a n k
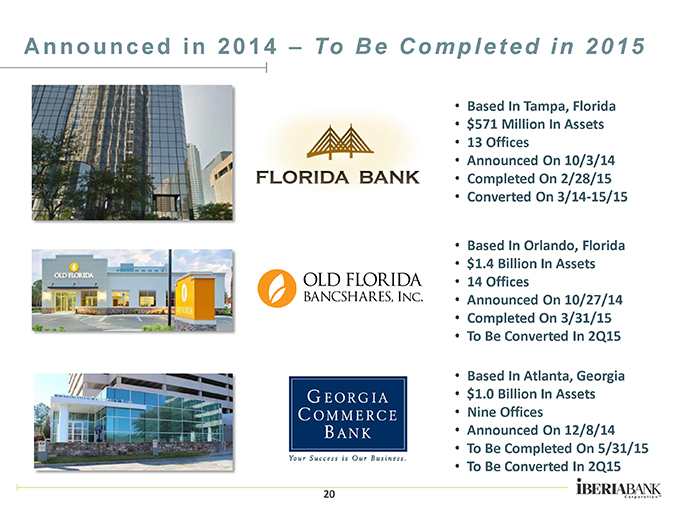
A n n o u n c e d i n 2 0 1 4 – To B e C o m p l e t e d i n 2 0 1 5 • Based In Tampa, Florida • $571 Million In Assets • 13 Offices • Announced On 10/3/14 • Completed On 2/28/15 • Converted On 3/14-15/15 • Based In Orlando, Florida • $1.4 Billion In Assets • 14 Offices • Announced On 10/27/14 • Completed On 3/31/15 • To Be Converted In 2Q15 • Based In Atlanta, Georgia • $1.0 Billion In Assets • Nine Offices • Announced On 12/8/14 • To Be Completed On 5/31/15 • To Be Converted In 2Q15 20
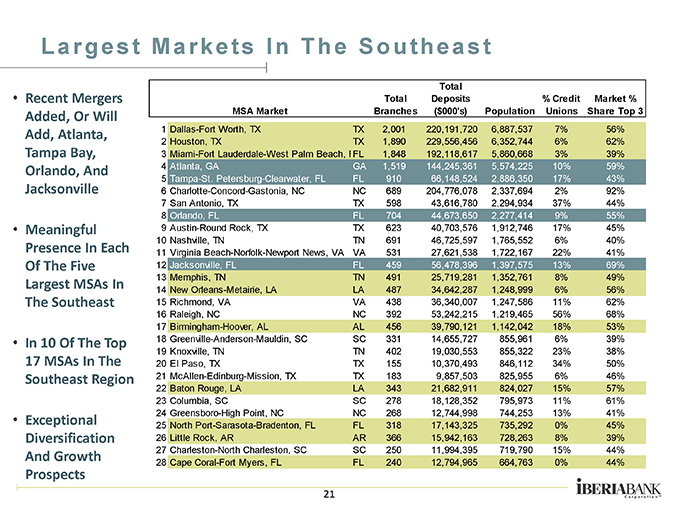
L a r g e s t M a r k e t s I n T h e S o u t h e a s t ic • Recent Mergers Added, Or Will Add, Atlanta, Tampa Bay, Orlando, And Jacksonville • Meaningful Presence In Each Of The Five Largest MSAs In The Southeast • In 10 Of The Top 17 MSAs In The Southeast Region• Exceptional Diversification And Growth Prospects Total Total Deposits % Credit Market % MSA Market Branches ($000’s) Population Unions Share Top 3 1 Dallas-Fort Worth, TX TX 2,001 220,191,720 6,887,537 7% 56% 2 Houston, TX TX 1,890 229,556,456 6,352,744 6% 62% 3 Miami-Fort Lauderdale-West Palm Beach, I FL 1,848 192,118,617 5,860,668 3% 39% 4 Atlanta, GA GA 1,519 144,245,361 5,574,225 10% 59% 5 Tampa-St. Petersburg-Clearwater, FL FL 910 66,148,524 2,886,350 17% 43% 6 Charlotte-Concord-Gastonia, NC NC 689 204,776,078 2,337,694 2% 92% 7 San Antonio, TX TX 598 43,616,780 2,294,934 37% 44% 8 Orlando, FL FL 704 44,673,650 2,277,414 9% 55% 9 Austin-Round Rock, TX TX 623 40,703,576 1,912,746 17% 45% 10 Nashville, TN TN 691 46,725,597 1,765,552 6% 40% 11 Virginia Beach-Norfolk-Newport News, VA VA 531 27,621,538 1,722,167 22% 41% 12 Jacksonville, FL FL 459 56,478,396 1,397,575 13% 69% 13 Memphis, TN TN 491 25,719,281 1,352,761 8% 49% 14 New Orleans-Metairie, LA LA 487 34,642,287 1,248,999 6% 56% 15 Richmond, VA VA 438 36,340,007 1,247,586 11% 62% 16 Raleigh, NC NC 392 53,242,215 1,219,465 56% 68% 17 Birmingham-Hoover, AL AL 456 39,790,121 1,142,042 18% 53% 18 Greenville-Anderson-Mauldin, SC SC 331 14,655,727 855,961 6% 39% 19 Knoxville, TN TN 402 19,030,553 855,322 23% 38% 20 El Paso, TX TX 155 10,370,493 846,112 34% 50% 21 McAllen-Edinburg-Mission, TX TX 183 9,857,503 825,955 6% 46% 22 Baton Rouge, LA LA 343 21,682,911 824,027 15% 57% 23 Columbia, SC SC 278 18,128,352 795,973 11% 61% 24 Greensboro-High Point, NC NC 268 12,744,998 744,253 13% 41% 25 North Port-Sarasota-Bradenton, FL FL 318 17,143,325 735,292 0% 45% 26 Little Rock, AR AR 366 15,942,163 728,263 8% 39% 27 Charleston-North Charleston, SC SC 250 11,994,395 719,790 15% 44% 28 Cape Coral-Fort Myers, FL FL 240 12,794,965 664,763 0% 44% 21
Strength in numbers Focus on earnings improvement Discipline is the bridge between goals and accomplishment. 22
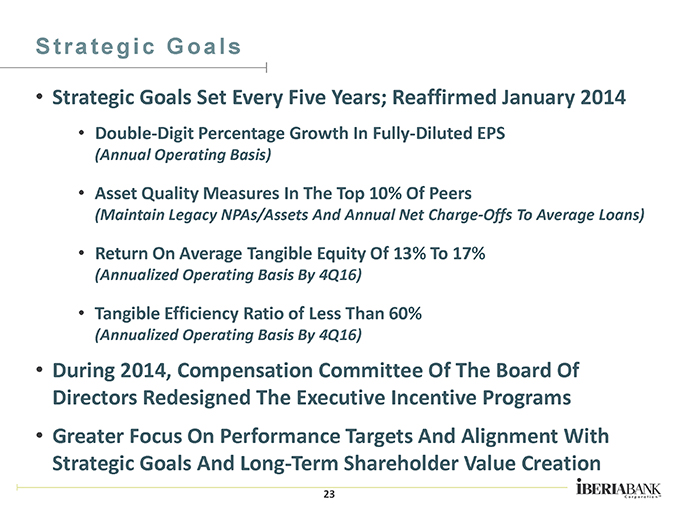
S t r a t e g i c G o a l s • Strategic Goals Set Every Five Years; Reaffirmed January 2014 • Double-Digit Percentage Growth In Fully-Diluted EPS (Annual Operating Basis) • Asset Quality Measures In The Top 10% Of Peers (Maintain Legacy NPAs/Assets And Annual Net Charge-Offs To Average Loans) • Return On Average Tangible Equity Of 13% To 17% (Annualized Operating Basis By 4Q16) • Tangible Efficiency Ratio of Less Than 60% (Annualized Operating Basis By 4Q16) • During 2014, Compensation Committee Of The Board Of Directors Redesigned The Executive Incentive Programs • Greater Focus On Performance Targets And Alignment With Strategic Goals And Long-Term Shareholder Value Creation 23
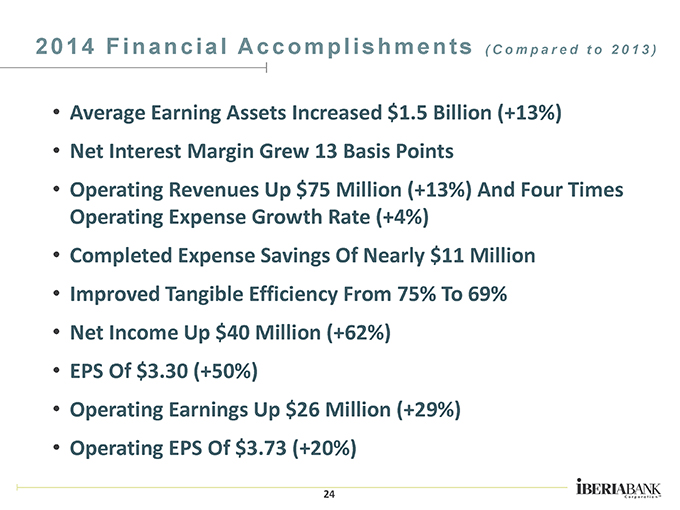
2 0 1 4 F i n a n c i a l A c c o m p l i s h m e n t s ( C o m p a r e d t o 2 0 1 3 ) • Average Earning Assets Increased $1.5 Billion (+13%) • Net Interest Margin Grew 13 Basis Points • Operating Revenues Up $75 Million (+13%) And Four Times Operating Expense Growth Rate (+4%) • Completed Expense Savings Of Nearly $11 Million • Improved Tangible Efficiency From 75% To 69% • Net Income Up $40 Million (+62%) • EPS Of $3.30 (+50%) • Operating Earnings Up $26 Million (+29%) • Operating EPS Of $3.73 (+20%) 24
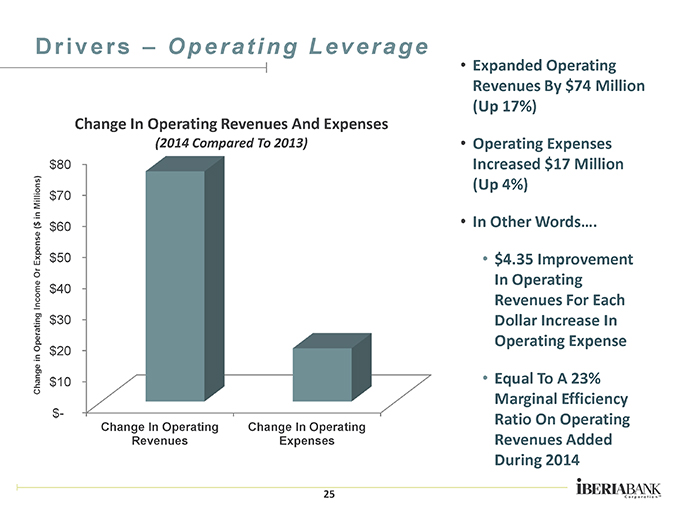
D r i v e r s – O p e r a t i n g L e v e r a g e Change In Operating Revenues And Expenses (2014 Compared To 2013) $80 $70 $60 $50 $40 $30 $20 $10 $- Change In Operating Revenues Expenses• Expanded Operating Revenues By $74 Million (Up 17%) • Operating Expenses Increased $17 Million (Up 4%) • In Other Words…. • $4.35 Improvement In Operating Revenues For Each Dollar Increase In Operating Expense • Equal To A 23% Marginal Efficiency Ratio On Operating Revenues Added During 2014 25
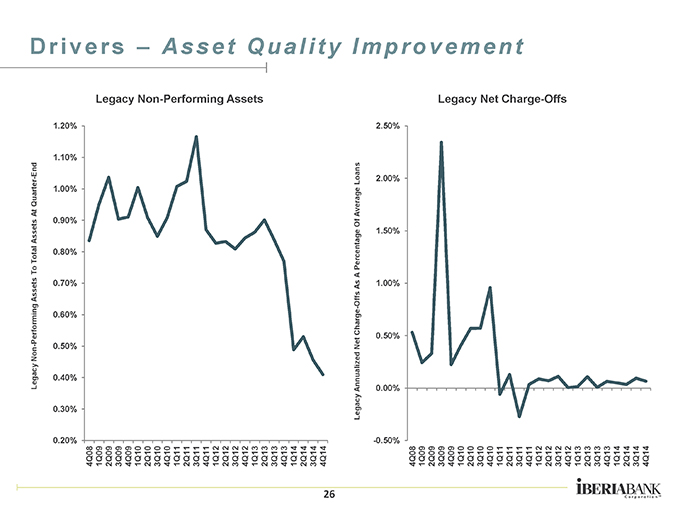
D r i v e r s – A s s e t Q u a l i t y I m p r o v e m e n t Legacy Non-Performing Assets Legacy Non-Performing Assets To Total Assets At Quarter-End 1.20% 1.10% 1.00% 0.90% 0.80% 0.70% 0.60% 0.50% 0.40% 0.30% 0.20% 4Q08 1Q09 2Q09 3Q09 4Q09 1Q10 2Q10 3Q10 4Q10 1Q11 2Q11 3Q11 4Q11 1Q12 2Q12 3Q12 4Q12 1Q13 2Q13 3Q13 4Q13 1Q14 2Q14 3Q14 4Q14 Legacy Net Charge-Offs Legacy Annualized Net Charge-Offs As A Percentage Of Average Loans 2.50% 2.00% 1.50% 1.00% 0.50% 0.00% -0.50% 4Q08 1Q09 2Q09 3Q09 4Q09 1Q10 2Q10 3Q10 4Q10 1Q11 2Q11 3Q11 4Q11 1Q12 2Q12 3Q12 4Q12 1Q13 2Q13 3Q13 4Q13 1Q14 2Q14 3Q14 4Q14 26
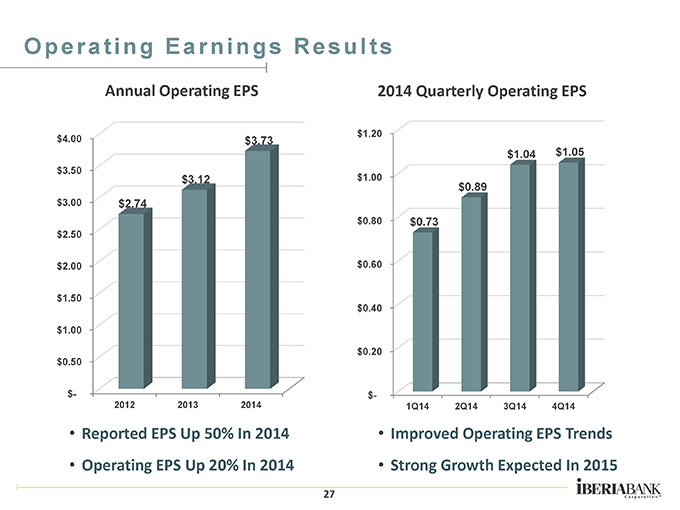
O p e r a t i n g E a r n i n g s R e s u l t s Annual Operating EPS $4.00 $3.50 $3.00 $2.50 $2.00 $1.50 $1.00 $0.50 $- $3.73 $3.12 $2.74 2012 2013 2014 Reported EPS Up 50% In 2014 Operating EPS Up 20% In 2014 2014 Quarterly Operating EPS $1.20 $1.00 $0.80 $0.60 $0.40 $0.20 $- $1.04 $1.05 $0.89 $0.73 1Q14 2Q14 3Q14 4Q14 Improved Operating EPS Trends Strong Growth Expected In 2015 27
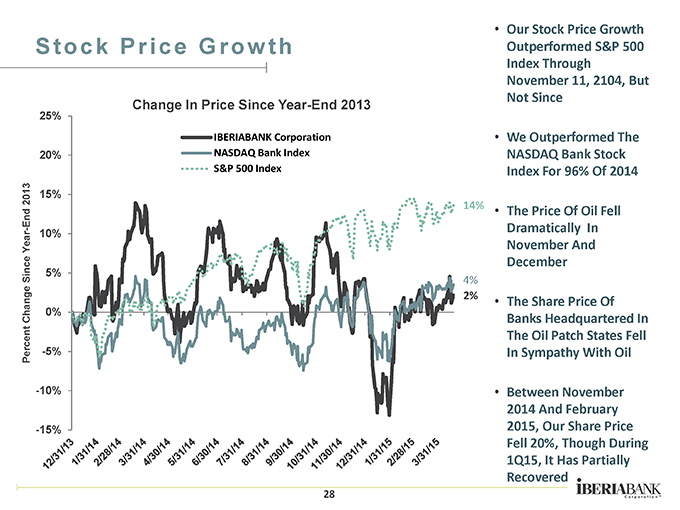
S t o c k P r i c e G r o w t h Change In Price Since Year-End 2013 IBERIABANK Corporation NASDAQ Bank Index S&P 500 Index Percent Change Since Year-End 2013 25% 20% 15% 10% 5% 0% -5% -10% -15% • Our Stock Price Growth Outperformed S&P 500 Index Through November 11, 2104, But Not Since • We Outperformed The NASDAQ Bank Stock Index For 96% Of 2014 • The Price Of Oil Fell Dramatically In November And December • The Share Price Of Banks Headquartered In The Oil Patch States Fell In Sympathy With Oil • Between November 2014 And February 2015, Our Share Price Fell 20%, Though During 1Q15, It Has Partially Recovered 28

C o n c l u d i n g R e m a r k s • Celebrating Our 128th Year – Another High Quality Growth Year • Improved Bottom-Line And Operating Performance • Multi-Faceted, Consistent Organic Growth Engine • Enhanced Diversification – Geographic, Businesses, Etc. • Successfully Completed Three Acquisitions In 2014 • Three Additional Acquisitions Announced In 2014 • Enhanced Regional, Market, And Business Leadership • Growth Achieved Not At The Expense Of Quality • Strong Infrastructure Supports Further Growth Opportunities • Well Positioned For Expected Interest Rate Environment • Focus And Alignment On Achieving Strategic Goals 29

Iberiabank corporation Member fdic | Equal housing lender