Attached files
| file | filename |
|---|---|
| 8-K - FIRST BANCORP. 8-K - FIRST BANCORP /PR/ | a51095103.htm |
| EX-99.1 - EXHIBIT 99.1 - FIRST BANCORP /PR/ | a51095103ex99_1.htm |
Exhibit 99.2

Financial Results 1Q 2015
This presentation contains “forward-looking statements” concerning First BanCorp’s (the “Corporation”) future economic performance. The words or phrases “would be,” “will allow,” “intends to,” “will likely result,” “are expected to,” “expect,” “anticipate,” “look forward,” “should,” “believes” and similar expressions are meant to identify “forward-looking statements” within the meaning of Section 27A of the Private Securities Litigation Reform Act of 1995, and are subject to the safe harbor created by such section. The Corporation wishes to caution readers not to place undue reliance on any such “forward-looking statements,” which speak only as of the date made, and to advise readers that various factors, including, but not limited to, uncertainty about whether the Corporation and FirstBank Puerto Rico (“FirstBank” or “the Bank”) will be able to fully comply with the written agreement dated June 3, 2010 that the Corporation entered into with the Federal Reserve Bank of New York (the “FED”); uncertainty as to the availability of certain funding sources, such as retail brokered CDs; the Corporation’s reliance on brokered CDs to fund operations and provide liquidity; the risk of not being able to fulfill the Corporation’s cash obligations or resume paying dividends to the Corporation’s stockholders in the future due to the Corporation’s inability to receive approval from the FED to receive dividends from FirstBank or FirstBank’s failure to generate sufficient cash flow to make a dividend payment to the Corporation; the strength or weakness of the real estate markets and of the consumer and commercial credit sectors and their impact on the credit quality of the Corporation’s loans and other assets, including the Corporation’s construction and commercial real estate loan portfolios, which have contributed and may continue to contribute to, among other things, the high levels of non-performing assets, charge-offs and the provision expense and may subject the Corporation to further risk from loan defaults and foreclosures; adverse changes in general economic conditions in the United States and in Puerto Rico, including the interest rate scenario, market liquidity, housing absorption rates, real estate prices and disruptions in the U.S. capital markets, which may reduce interest margins, impact funding sources and affect demand for all of the Corporation’s products and services and the value of the Corporation’s assets; an adverse change in the Corporation’s ability to attract new clients and retain existing ones; a decrease in demand for the Corporation’s products and services and lower revenues and earnings because of the continued recession in Puerto Rico and the current fiscal problems and budget deficit of the Puerto Rico government; uncertainty about regulatory and legislative changes for financial services companies in Puerto Rico, the United States and the U.S. and British Virgin Islands, which could affect the Corporation’s financial performance and could cause the Corporation’s actual results for future periods to differ materially from prior results and anticipated or projected results; uncertainty about the effectiveness of the various actions undertaken to stimulate the United States economy and stabilize the United States’ financial markets, and the impact such actions may have on the Corporation’s business, financial condition and results of operations; changes in the fiscal and monetary policies and regulations of the federal government, including those determined by the Federal Reserve System, the FDIC, government-sponsored housing agencies and regulators in Puerto Rico and the U.S. and British Virgin Islands; the risk of possible failure or circumvention of controls and procedures and the risk that the Corporation’s risk management policies may not be adequate; the risk that the FDIC may further increase the deposit insurance premium and/or require special assessments to replenish its insurance fund, causing an additional increase in the Corporation’s non-interest expense; risks of not being able to recover the assets pledged to Lehman Brothers Special Financing, Inc.; the impact on the Corporation’s results of operations and financial condition associated with acquisitions and dispositions; a need to recognize additional impairments on financial instruments or goodwill relating to acquisitions; risks that downgrades in the credit ratings of the Corporation’s long-term senior debt will adversely affect the Corporation’s ability to access necessary external funds; the impact of the Dodd-Frank Wall Street Reform and Consumer Protection Act on the Corporation’s businesses, business practices and cost of operations; and general competitive factors and industry consolidation. The Corporation does not undertake, and specifically disclaims any obligation, to update any “forward-looking statements” to reflect occurrences or unanticipated events or circumstances after the date of such statements except as required by the federal securities laws. Investors should refer to the Corporation’s Annual Report on Form 10-K for the year ended December 31, 2013 for a discussion of such factors and certain risks and uncertainties to which the Corporation is subject.

First Quarter 2015 Highlights Aurelio Alemán, President & Chief Executive Officer First Quarter 2015 Results of Operations Orlando Berges, Executive Vice President & Chief Financial Officer Questions & Answers

Key Highlights
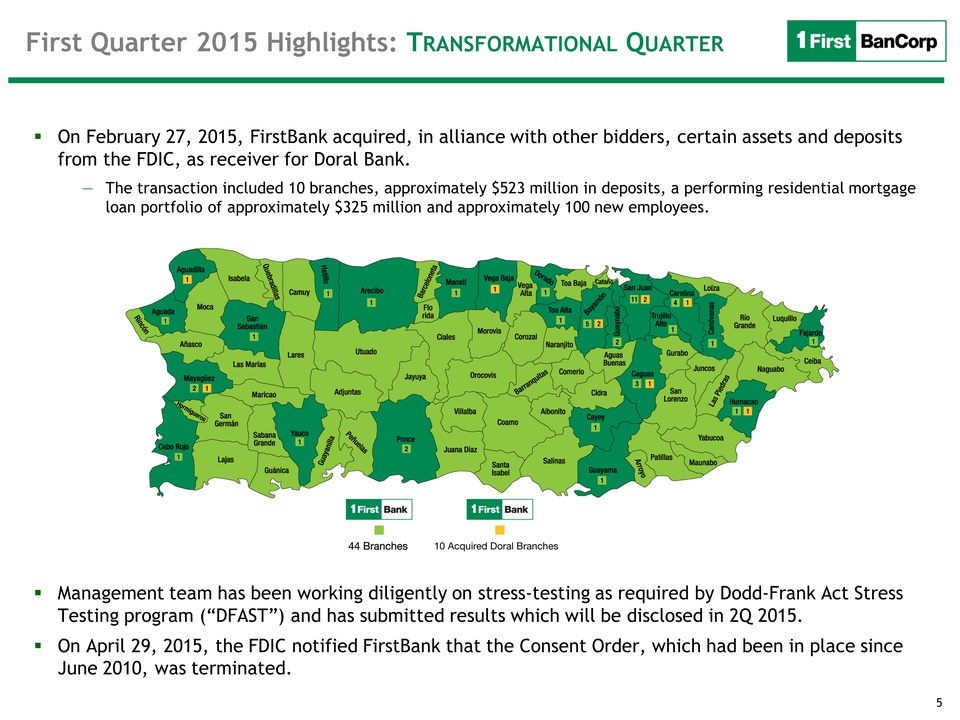
On February 27, 2015, FirstBank acquired, in alliance with other bidders, certain assets and deposits from the FDIC, as receiver for Doral Bank. — The transaction included 10 branches, approximately $523 million in deposits, a performing residential mortgage loan portfolio of approximately $325 million and approximately 100 new employees. Management team has been working diligently on stress-testing as required by Dodd-Frank Act Stress Testing program (“DFAST”) and has submitted results which will be disclosed in 2Q 2015. On April 29, 2015, the FDIC notified FirstBank that the Consent Order, which had been in place since June 2010, was terminated.
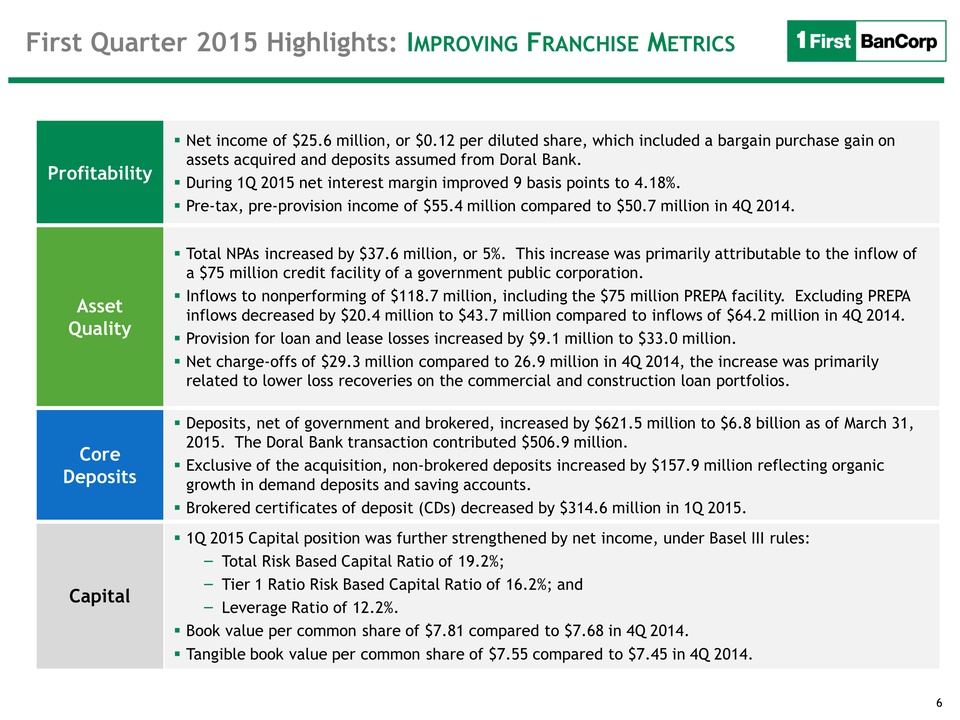
Profitability Net income of $25.6 million, or $0.12 per diluted share, which included a bargain purchase gain on assets acquired and deposits assumed from Doral Bank. During 1Q 2015 net interest margin improved 9 basis points to 4.18%. Pre-tax, pre-provision income of $55.4 million compared to $50.7 million in 4Q 2014. Asset Quality Total NPAs increased by $37.6 million, or 5%. This increase was primarily attributable to the inflow of a $75 million credit facility of a government public corporation. Inflows to nonperforming of $118.7 million, including the $75 million PREPA facility. Excluding PREPA inflows decreased by $20.4 million to $43.7 million compared to inflows of $64.2 million in 4Q 2014. Provision for loan and lease losses increased by $9.1 million to $33.0 million. Net charge-offs of $29.3 million compared to 26.9 million in 4Q 2014, the increase was primarily related to lower loss recoveries on the commercial and construction loan portfolios. Core Deposits Deposits, net of government and brokered, increased by $621.5 million to $6.8 billion as of March 31, 2015. The Doral Bank transaction contributed $506.9 million. Exclusive of the acquisition, non-brokered deposits increased by $157.9 million reflecting organic growth in demand deposits and saving accounts. Brokered certificates of deposit (CDs) decreased by $314.6 million in 1Q 2015. Capital 1Q 2015 Capital position was further strengthened by net income, under Basel III rules: ‒ Total Risk Based Capital Ratio of 19.2%; ‒ Tier 1 Ratio Risk Based Capital Ratio of 16.2%; and ‒ Leverage Ratio of 12.2%. Book value per common share of $7.81 compared to $7.68 in 4Q 2014. Tangible book value per common share of $7.55 compared to $7.45 in 4Q 2014.
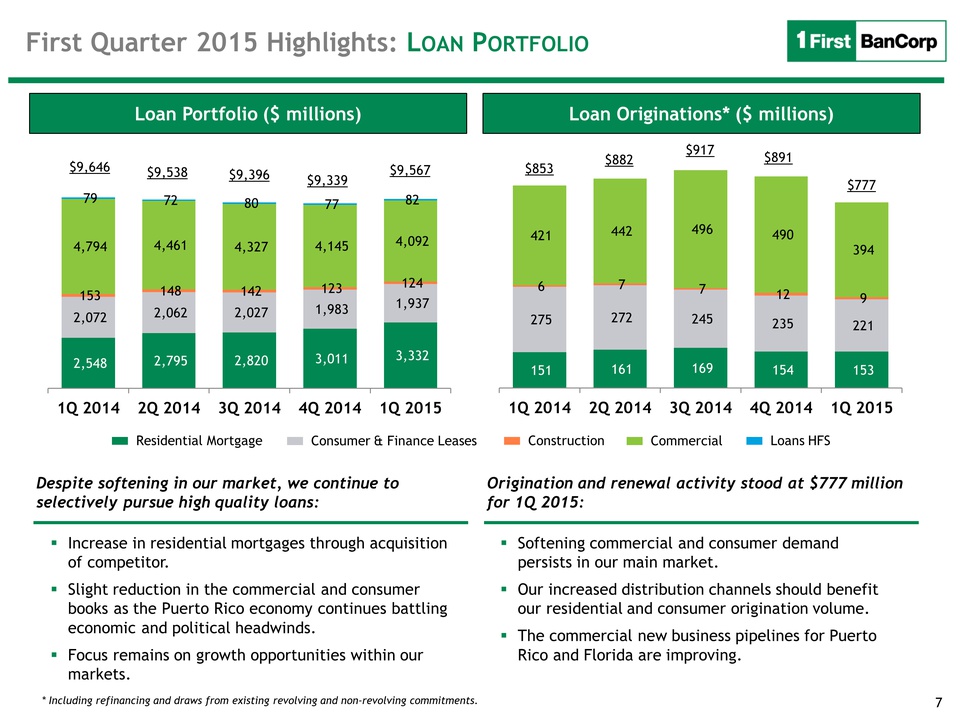
Loan Portfolio ($ millions) Loan Originations* ($ millions) 2,548 2,795 2,820 3,011 3,332 2,072 2,062 2,027 1,983 1,937 153 148 142 123 124 4,794 4,461 4,327 4,145 4,092 79 72 80 77 82 1Q 2014 2Q 2014 3Q 2014 4Q 2014 1Q 2015 $9,646 $9,538 $9,396 $9,339 $9,567 151 161 169 154 153 275 272 245 235 221 6 7 7 12 9 421 442 496 490 394 1Q 2014 2Q 2014 3Q 2014 4Q 2014 1Q 2015 $853 $882 $917 $891 $777 Residential Mortgage Consumer & Finance Leases Construction Commercial Loans HFS Increase in residential mortgages through acquisition of competitor. Slight reduction in the commercial and consumer books as the Puerto Rico economy continues battling economic and political headwinds. Focus remains on growth opportunities within our markets. Softening commercial and consumer demand persists in our main market. Our increased distribution channels should benefit our residential and consumer origination volume. The commercial new business pipelines for Puerto Rico and Florida are improving. Despite softening in our market, we continue to selectively pursue high quality loans: Origination and renewal activity stood at $777 million for 1Q 2015: * Including refinancing and draws from existing revolving and non-revolving commitments.
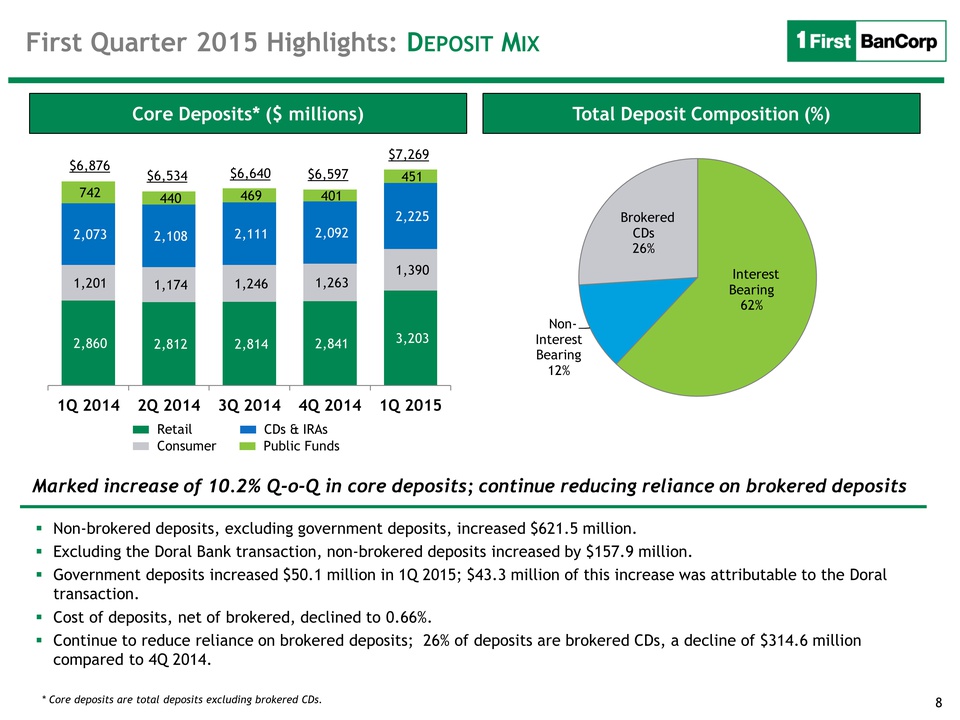
Core Deposits* ($ millions) Total Deposit Composition (%) 2,860 2,812 2,814 2,841 3,203 1,201 1,174 1,246 1,263 1,390 2,073 2,108 2,111 2,092 2,225 742 440 469 401 451 1Q 2014 2Q 2014 3Q 2014 4Q 2014 1Q 2015 $6,876 * Core deposits are total deposits excluding brokered CDs. $6,534 $6,640 $6,597 $7,269 Interest Bearing 62% Non- Interest Bearing 12% Brokered CDs 26% Non-brokered deposits, excluding government deposits, increased $621.5 million. Excluding the Doral Bank transaction, non-brokered deposits increased by $157.9 million. Government deposits increased $50.1 million in 1Q 2015; $43.3 million of this increase was attributable to the Doral transaction. Cost of deposits, net of brokered, declined to 0.66%. Continue to reduce reliance on brokered deposits; 26% of deposits are brokered CDs, a decline of $314.6 million compared to 4Q 2014. Marked increase of 10.2% Q-o-Q in core deposits; continue reducing reliance on brokered deposits
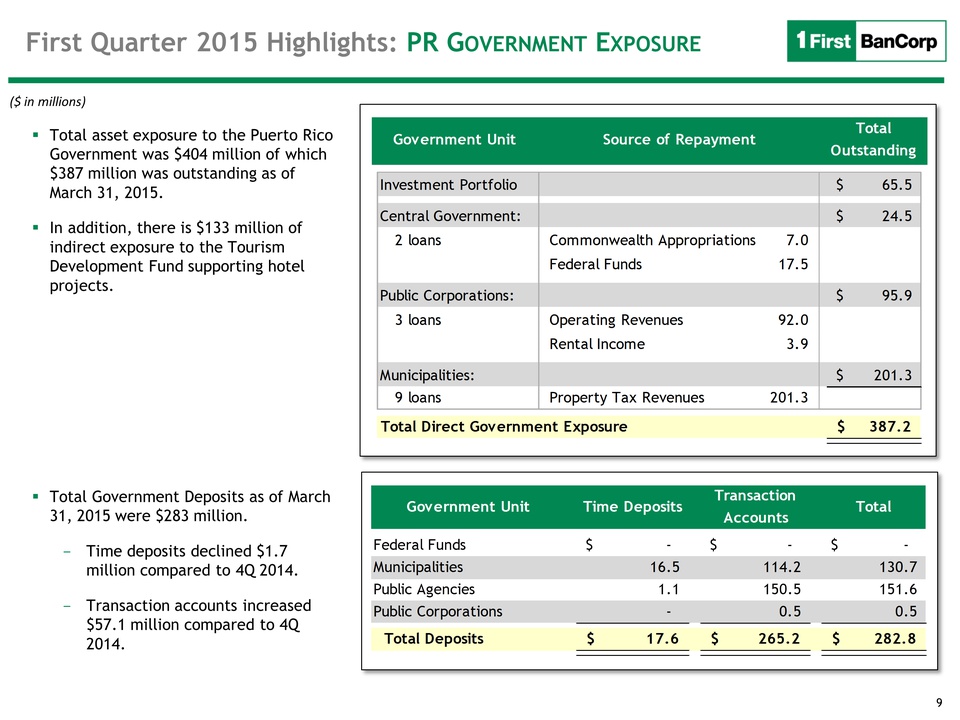
First Quarter 2015 Highlights: PR GOVERNMENT EXPOSURE Total asset exposure to the Puerto Rico Government was $404 million of which $387 million was outstanding as of March 31, 2015. In addition, there is $133 million of indirect exposure to the Tourism Development Fund supporting hotel projects. Total Government Deposits as of March 31, 2015 were $283 million. - Time deposits declined $1.7 million compared to 4Q 2014. - Transaction accounts increased $57.1 million compared to 4Q 2014. ($ in millions) Investment Portfolio $ 65.5 Central Government: $ 24.5 2 loans 7.0 17.5 Public Corporations: $ 95.9 3 loans 92.0 3.9 Municipalities: $ 2 01.3 9 loans 201.3 Total Direct Government Exposure $ 387.2 Government Unit Source of Repayment Total Outstanding Commonwealth Appropriations Federal Funds Operating Revenues Rental Income Property Tax Revenues Government Unit Time Deposits Transaction Accounts Total Federal Funds $ - $ - $ - Municipalities 16.5 114.2 130.7 Public Agencies 1.1 150.5 151.6 Public Corporations - 0.5 0.5 Total Deposits $ 17.6 $ 265.2 $ 282.8

Results of Operations
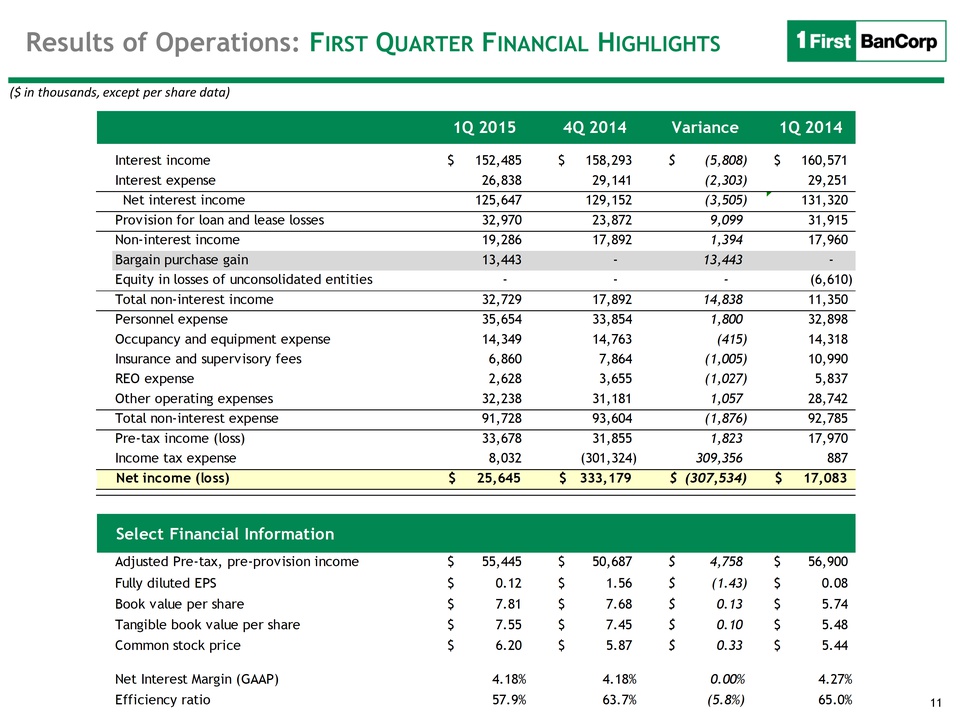
Results of Operations: FIRST QUARTER FINANCIAL HIGHLIGHTS ($ in thousands, except per share data) Select Financial Information 1Q 2015 4Q 2014 Variance 1Q 2014 Interest income $ 152,485 $ 158,293 $ (5,808) $ 160,571 Interest expense 26,838 29,141 (2,303) 29,251 Net interest income 125,647 129,152 (3,505) 131,320 Provision for loan and lease losses 32,970 23,872 9,099 31,915 Non-interest income 19,286 17,892 1,394 17,960 Bargain purchase gain 13,443 - 13,443 - Equity in losses of unconsolidated entities - - - (6,610) Total non-interest income 32,729 17,892 14,838 11,350 Personnel expense 35,654 33,854 1,800 32,898 Occupancy and equipment expense 14,349 14,763 (415) 14,318 Insurance and supervisory fees 6,860 7,864 (1,005) 10,990 REO expense 2,628 3,655 (1,027) 5,837 Other operating expenses 32,238 31,181 1,057 28,742 Total non-interest expense 91,728 93,604 (1,876) 92,785 Pre-tax income (loss) 33,678 31,855 1,823 17,970 Income tax expense 8,032 (301,324) 309,356 887 Net income (loss) $ 25,645 $ 333,179 $ (307,534) $ 17,083 Select Financial Information Adjusted Pre-tax, pre-provision income $ 55,445 $ 50,687 $ 4,758 $ 56,900 Fully diluted EPS $ 0.12 $ 1.56 $ (1.43) $ 0.08 Book value per share $ 7.81 $ 7.68 $ 0.13 $ 5.74 Tangible book value per share $ 7.55 $ 7.45 $ 0.10 $ 5.48 Common stock price $ 6.20 $ 5.87 $ 0.33 $ 5.44 Net Interest Margin (GAAP) 4.18% 4.18% 0.00% 4.27% Efficiency ratio 57.9% 63.7% (5.8%) 65.0%
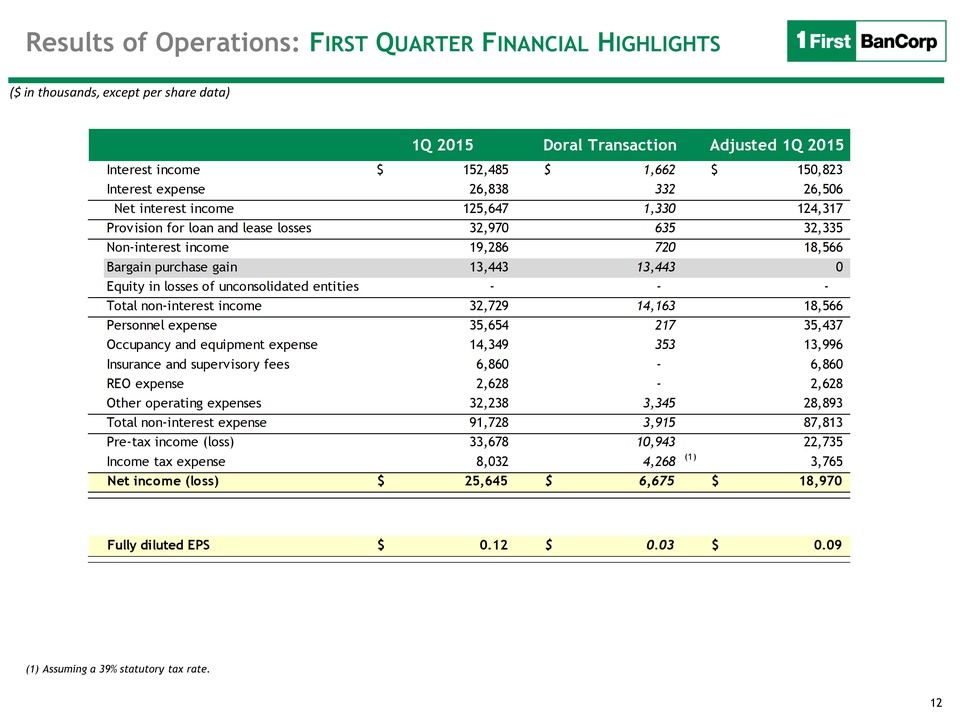
Results of Operations: FIRST QUARTER FINANCIAL HIGHLIGHTS ($ in thousands, except per share data) Select Financial Information (1) Assuming a 39% statutory tax rate. 1Q 2015 Doral Transaction Adjusted 1Q 2015 Interest income $ 152,485 $ 1,662 $ 150,823 Interest expense 26,838 332 26,506 Net interest income 125,647 1,330 124,317 Provision for loan and lease losses 32,970 635 32,335 Non-interest income 19,286 720 18,566 Bargain purchase gain 13,443 13,443 0 Equity in losses of unconsolidated entities - - - Total non-interest income 32,729 14,163 18,566 Personnel expense 35,654 217 35,437 Occupancy and equipment expense 14,349 353 13,996 Insurance and supervisory fees 6,860 - 6,860 REO expense 2,628 - 2,628 Other operating expenses 32,238 3,345 28,893 Total non-interest expense 91,728 3,915 87,813 Pre-tax income (loss) 33,678 10,943 22,735 Income tax expense 8,032 4,268 (1) 3,765 Net income (loss) $ 25,645 $ 6,675 $ 18,970 Fully diluted EPS $ 0.12 $ 0.03 $ 0.09
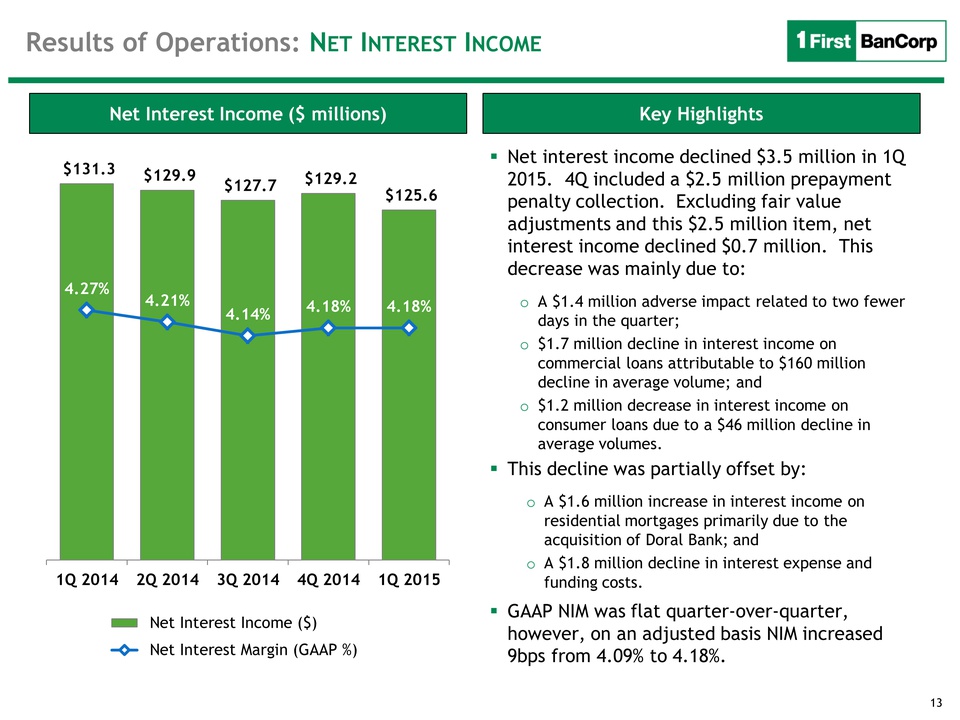
13 Net Interest Income ($ millions) Key Highlights $131.3 $129.9 $127.7 $129.2 $125.6 4.27% 4.21% 4.14% 4.18% 4.18% 1Q 2014 2Q 2014 3Q 2014 4Q 2014 1Q 2015 Net Interest Income ($) Net Interest Margin (GAAP %) Net interest income declined $3.5 million in 1Q 2015. 4Q included a $2.5 million prepayment penalty collection. Excluding fair value adjustments and this $2.5 million item, net interest income declined $0.7 million. This decrease was mainly due to: o A $1.4 million adverse impact related to two fewer days in the quarter; o $1.7 million decline in interest income on commercial loans attributable to $160 million decline in average volume; and o $1.2 million decrease in interest income on consumer loans due to a $46 million decline in average volumes. This decline was partially offset by: o A $1.6 million increase in interest income on residential mortgages primarily due to the acquisition of Doral Bank; and o A $1.8 million decline in interest expense and funding costs. GAAP NIM was flat quarter-over-quarter, however, on an adjusted basis NIM increased 9bps from 4.09% to 4.18%.
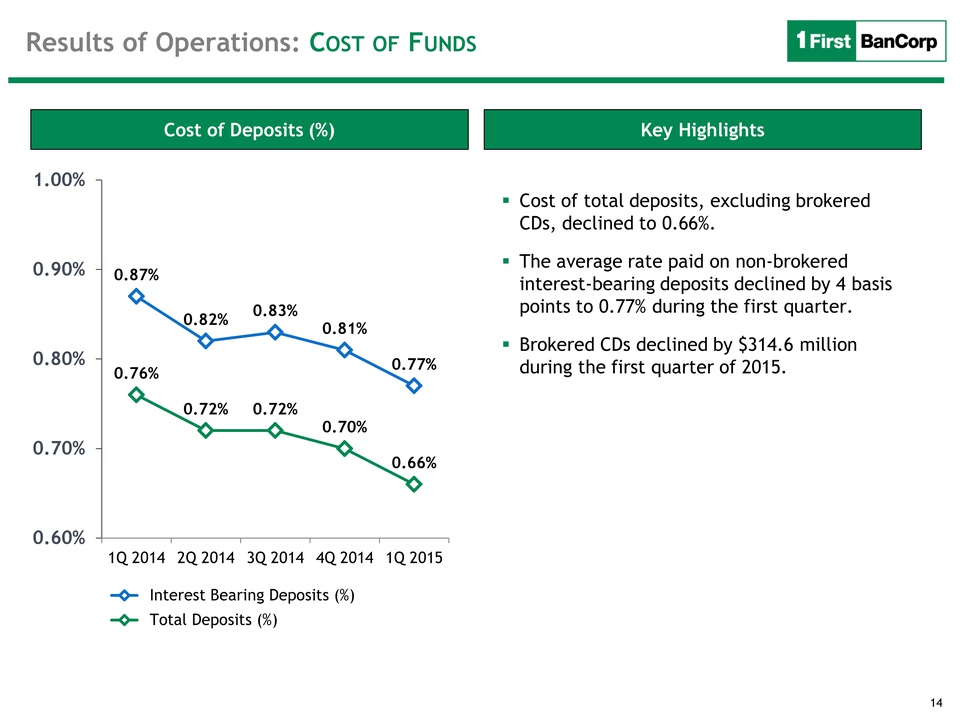
Cost of Deposits (%) Key Highlights 0.87% 0.82% 0.83% 0.81% 0.76% 0.77% 0.72% 0.72% 0.70% 0.66% 0.60% 0.70% 0.80% 0.90% 1.00% 1Q 2014 2Q 2014 3Q 2014 4Q 2014 1Q 2015 Interest Bearing Deposits (%) Total Deposits (%) Cost of total deposits, excluding brokered CDs, declined to 0.66%. The average rate paid on non-brokered interest-bearing deposits declined by 4 basis points to 0.77% during the first quarter. Brokered CDs declined by $314.6 million during the first quarter of 2015. Results of Operations: COST OF FUNDS
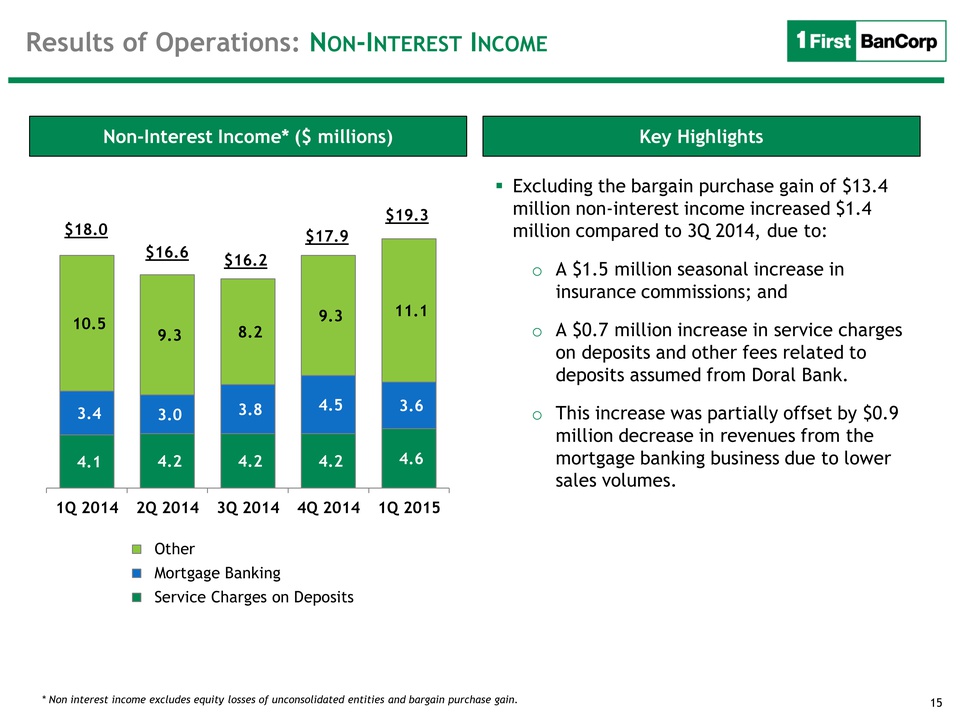
Non-Interest Income* ($ millions) Key Highlights 4.1 4.2 4.2 4.2 4.6 3.4 3.0 3.8 4.5 3.6 10.5 9.3 8.2 9.3 11.1 1Q 2014 2Q 2014 3Q 2014 4Q 2014 1Q 2015 Other Mortgage Banking Service Charges on Deposits * Non interest income excludes equity losses of unconsolidated entities and bargain purchase gain. Excluding the bargain purchase gain of $13.4 million non-interest income increased $1.4 million compared to 3Q 2014, due to: o A $1.5 million seasonal increase in insurance commissions; and o A $0.7 million increase in service charges on deposits and other fees related to deposits assumed from Doral Bank. o This increase was partially offset by $0.9 million decrease in revenues from the mortgage banking business due to lower sales volumes. $18.0 $16.6 $16.2 $17.9 $19.3 Results of Operations: NON-INTEREST INCOME
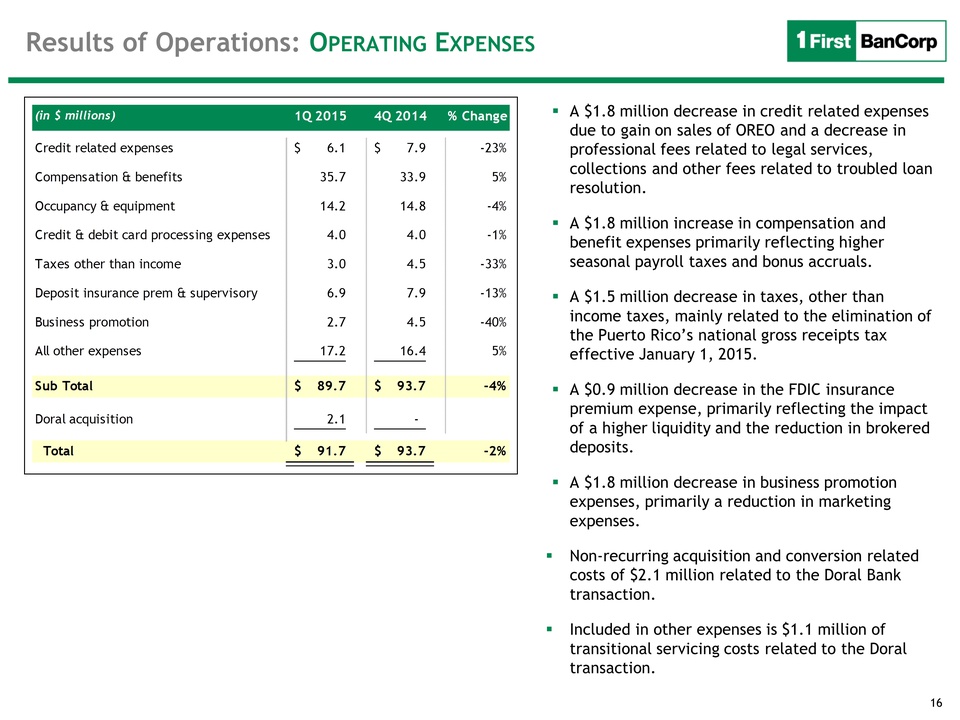
Results of Operations: OPERATING EXPENSES A $1.8 million decrease in credit related expenses due to gain on sales of OREO and a decrease in professional fees related to legal services, collections and other fees related to troubled loan resolution. A $1.8 million increase in compensation and benefit expenses primarily reflecting higher seasonal payroll taxes and bonus accruals. A $1.5 million decrease in taxes, other than income taxes, mainly related to the elimination of the Puerto Rico’s national gross receipts tax effective January 1, 2015. A $0.9 million decrease in the FDIC insurance premium expense, primarily reflecting the impact of a higher liquidity and the reduction in brokered deposits. A $1.8 million decrease in business promotion expenses, primarily a reduction in marketing expenses. Non-recurring acquisition and conversion related costs of $2.1 million related to the Doral Bank transaction. Included in other expenses is $1.1 million of transitional servicing costs related to the Doral transaction. (in $ millions) 1Q 2015 4Q 2014 % Change Credit related expenses $ 6.1 $ 7.9 -23% Compensation & benefits 35.7 33.9 5% Occupancy & equipment 14.2 14.8 -4% Credit & debit card processing expenses 4.0 4.0 -1% Taxes other than income 3.0 4.5 -33% Deposit insurance prem & supervisory 6.9 7.9 -13% Business promotion 2.7 4.5 -40% All other expenses 17.2 16.4 5% Sub Total $ 89.7 $ 93.7 -4% Doral acquisition 2.1 - Total $ 91.7 $ 93.7 -2%
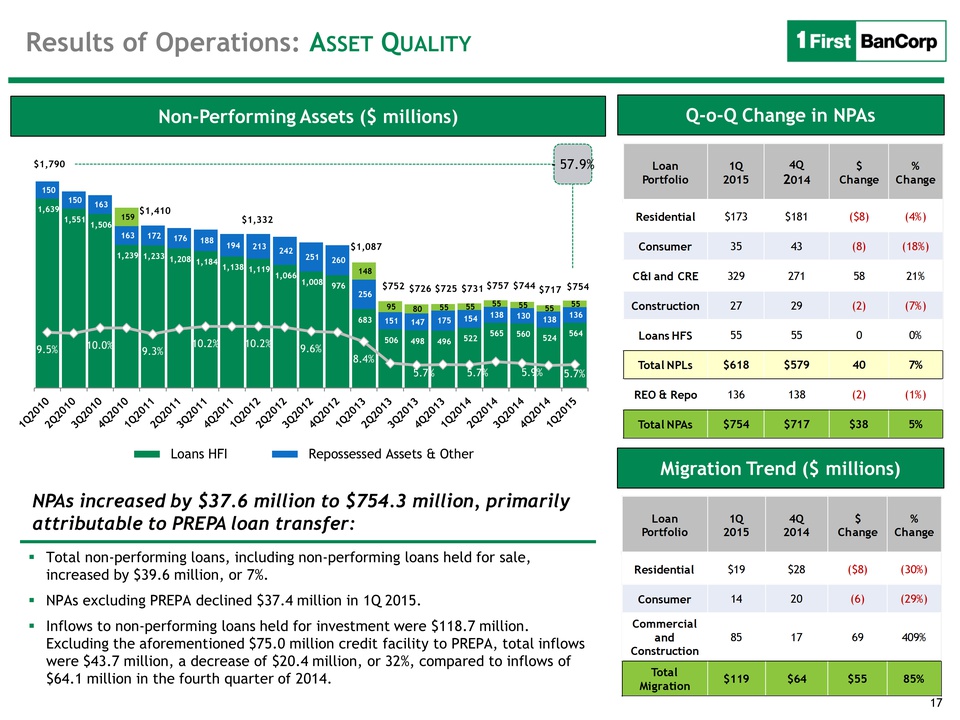
Non-Performing Assets ($ millions) 1,639 1,551 1,506 1,239 1,233 1,208 1,184 1,138 1,119 1,066 1,008 976 683 506 498 496 522 565 560 524 564 150 150 163 163 172 176 188 194 213 242 251 260 256 151 147 175 154 138 130 138 136 159 148 95 80 55 55 55 55 55 55 9.5% 10.0% 9.3% 10.2% 10.2% 9.6% 8.4% 5.7% 5.7% 5.9% 5.7% Loans HFI Repossessed Assets & Other $1,790 $1,410 $1,332 $1,087 $752 $726 $725 $731 $757 $744 $717 $754 - 57.9% Total non-performing loans, including non-performing loans held for sale, increased by $39.6 million, or 7%. NPAs excluding PREPA declined $37.4 million in 1Q 2015. Inflows to non-performing loans held for investment were $118.7 million. Excluding the aforementioned $75.0 million credit facility to PREPA, total inflows were $43.7 million, a decrease of $20.4 million, or 32%, compared to inflows of $64.1 million in the fourth quarter of 2014. NPAs increased by $37.6 million to $754.3 million, primarily attributable to PREPA loan transfer: Results of Operations: ASSET QUALITY Loan Portfolio 1Q 2015 4Q 2014 $ Change % Change Residential $173 $181 ($8) (4%) Consumer 35 43 (8) (18%) C&I and CRE 329 271 58 21% Construction 27 29 (2) (7%) Loans HFS 55 55 0 0% Total NPLs $618 $579 40 7% REO & Repo 136 138 (2) (1%) Total NPAs $754 $717 $38 5% Q-o-Q Change in NPAs Loan Portfolio 1Q 2015 4Q 2014 $ Change % Change Residential $19 $28 ($8) (30%) Consumer 14 20 (6) (29%) Commercial and Construction 85 17 69 409% Total Migration $119 $64 $55 85% Migration Trend ($ millions)
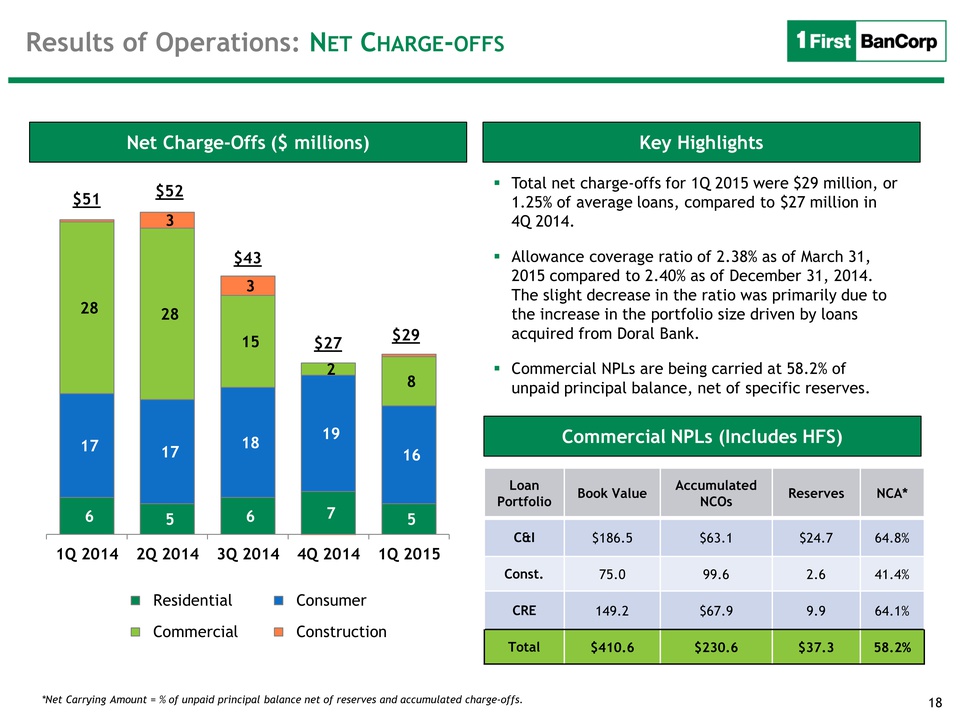
Net Charge-Offs ($ millions) Key Highlights 6 5 6 7 5 17 17 18 19 16 28 28 15 2 8 3 3 1Q 2014 2Q 2014 3Q 2014 4Q 2014 1Q 2015 Residential Consumer Commercial Construction $51 Total net charge-offs for 1Q 2015 were $29 million, or 1.25% of average loans, compared to $27 million in 4Q 2014. Allowance coverage ratio of 2.38% as of March 31, 2015 compared to 2.40% as of December 31, 2014. The slight decrease in the ratio was primarily due to the increase in the portfolio size driven by loans acquired from Doral Bank. Commercial NPLs are being carried at 58.2% of unpaid principal balance, net of specific reserves. Loan Portfolio Book Value Accumulated NCOs Reserves NCA* C&I $186.5 $63.1 $24.7 64.8% Const. 75.0 99.6 2.6 41.4% CRE 149.2 $67.9 9.9 64.1% Total $410.6 $230.6 $37.3 58.2% $52 $43 $27 $29 Commercial NPLs (Includes HFS) *Net Carrying Amount = % of unpaid principal balance net of reserves and accumulated charge-offs.
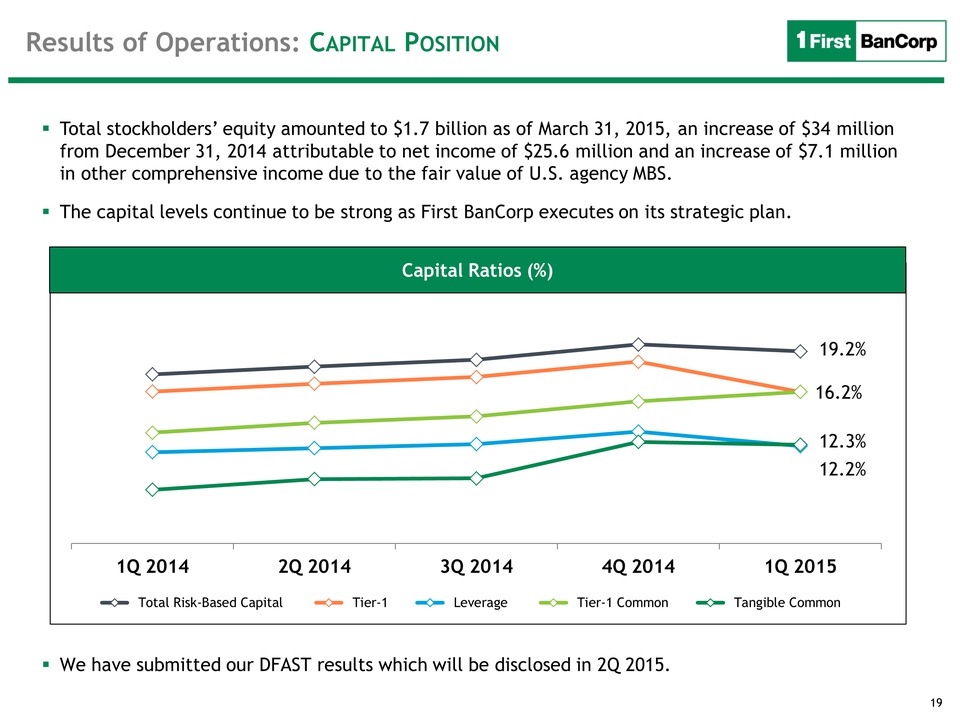
Results of Operations: CAPITAL POSITION Capital Ratios (%) Total stockholders’ equity amounted to $1.7 billion as of March 31, 2015, an increase of $34 million from December 31, 2014 attributable to net income of $25.6 million and an increase of $7.1 million in other comprehensive income due to the fair value of U.S. agency MBS. The capital levels continue to be strong as First BanCorp executes on its strategic plan. We have submitted our DFAST results which will be disclosed in 2Q 2015. Capital Ratios (%) 19.2% 12.2% 16.2% 12.3% 1Q 2014 2Q 2014 3Q 2014 4Q 2014 1Q 2015 Total Risk-Based Capital Tier-1 Leverage Tier-1 Common Tangible Common

Q & A

Exhibits
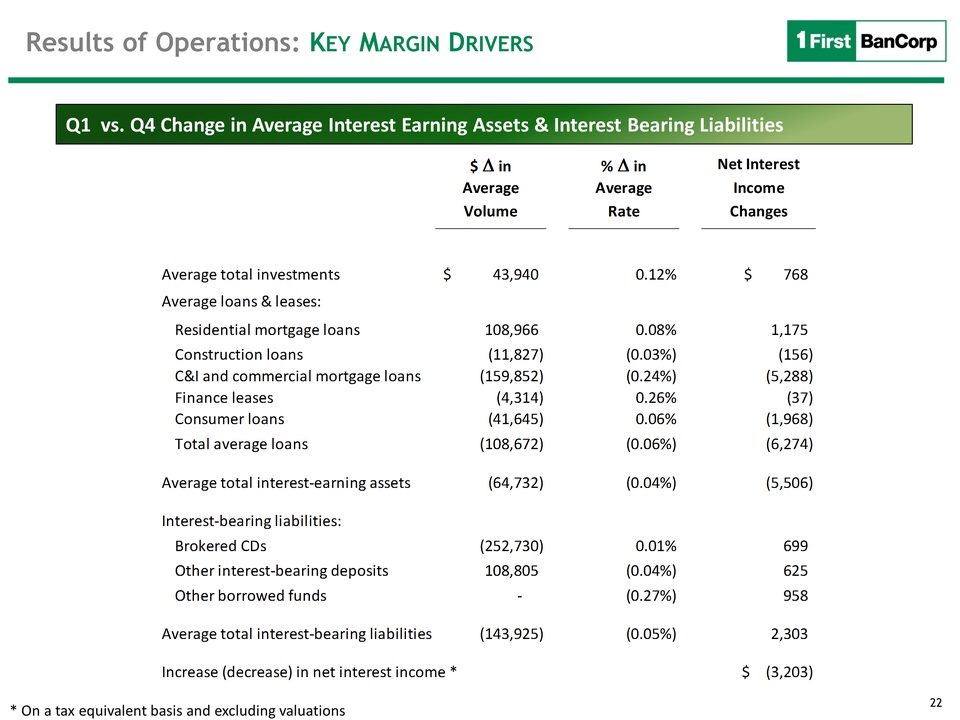
Q1 vs. Q4 Change in Average Interest Earning Assets & Interest Bearing Liabilities * On a tax equivalent basis and excluding valuations $ in % in Average Average Volume Rate Average total investments $ 4 3,940 0.12% $ 768 Average loans & leases: Residential mortgage loans 108,966 0.08% 1 ,175 Construction loans (11,827) (0.03%) (156) C&I and commercial mortgage loans (159,852) (0.24%) ( 5,288) Finance leases (4,314) 0.26% ( 37) Consumer loans (41,645) 0.06% ( 1,968) Total average loans (108,672) (0.06%) ( 6,274) Average total interest‐earning assets ( 64,732) (0.04%) ( 5,506) Interest‐bearing liabilities: Brokered CDs (252,730) 0.01% 699 Other interest‐bearing deposits 1 08,805 (0.04%) 625 Other borrowed funds ‐ (0.27%) 958 Average total interest‐bearing liabilities (143,925) (0.05%) 2,303 Increase (decrease) in net interest income * $ (3,203) Net Interest Income Changes
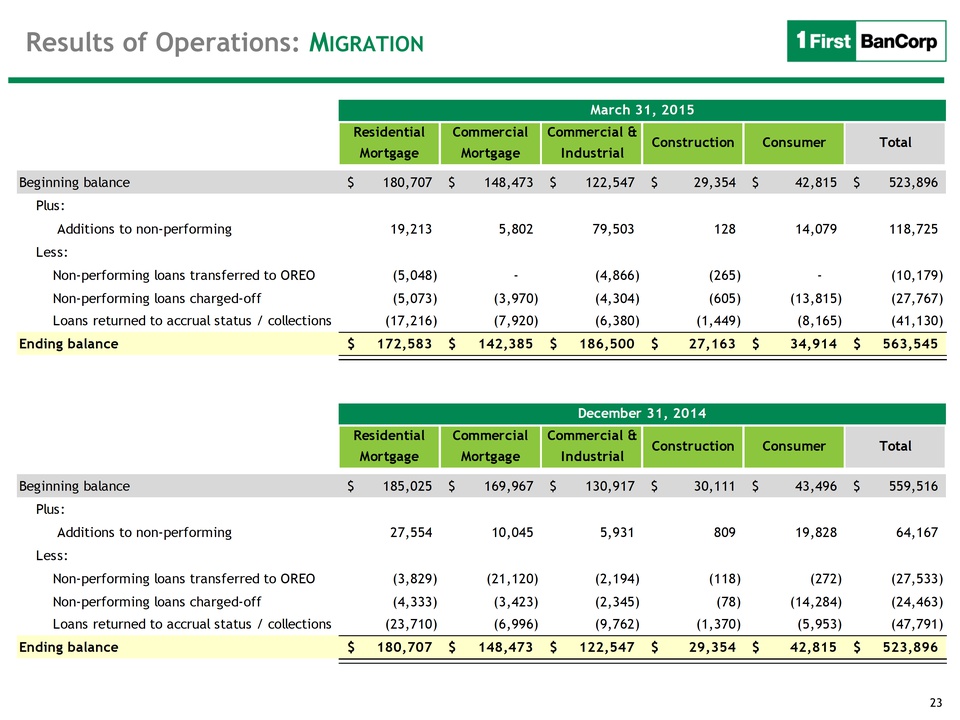
Results of Operations: MIGRATION Residential Mortgage Commercial Mortgage Commercial & Industrial Construction Consumer Total Beginning balance $ 180,707 $ 148,473 $ 122,547 $ 29,354 $ 42,815 $ 523,896 Plus: Additions to non-performing 19,213 5,802 79,503 128 14,079 118,725 Less: Non-performing loans transferred to OREO (5,048) - (4,866) (265) - ( 10,179) Non-performing loans charged-off (5,073) (3,970) (4,304) (605) ( 13,815) ( 27,767) Loans returned to accrual status / collections ( 17,216) (7,920) (6,380) (1,449) (8,165) ( 41,130) Ending balance $ 172,583 $ 1 42,385 $ 1 86,500 $ 27,163 $ 3 4,914 $ 5 63,545 Residential Mortgage Commercial Mortgage Commercial & Industrial Construction Consumer Total Beginning balance $ 185,025 $ 169,967 $ 130,917 $ 30,111 $ 43,496 $ 559,516 Plus: Additions to non-performing 27,554 10,045 5,931 809 19,828 64,167 Less: Non-performing loans transferred to OREO (3,829) ( 21,120) (2,194) (118) (272) ( 27,533) Non-performing loans charged-off (4,333) (3,423) (2,345) (78) ( 14,284) ( 24,463) Loans returned to accrual status / collections ( 23,710) (6,996) (9,762) (1,370) (5,953) ( 47,791) Ending balance $ 180,707 $ 1 48,473 $ 1 22,547 $ 29,354 $ 4 2,815 $ 5 23,896
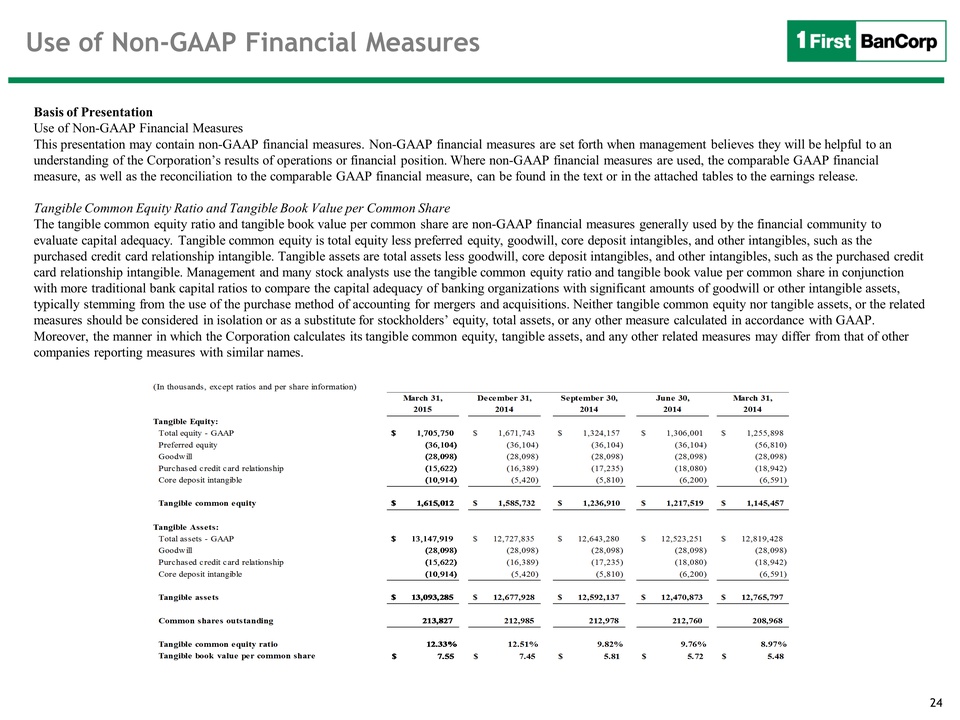
Use of Non-GAAP Financial Measures Basis of Presentation Use of Non-GAAP Financial Measures This presentation may contain non-GAAP financial measures. Non-GAAP financial measures are set forth when management believes they will be helpful to an understanding of the Corporation’s results of operations or financial position. Where non-GAAP financial measures are used, the comparable GAAP financial measure, as well as the reconciliation to the comparable GAAP financial measure, can be found in the text or in the attached tables to the earnings release. Tangible Common Equity Ratio and Tangible Book Value per Common Share The tangible common equity ratio and tangible book value per common share are non-GAAP financial measures generally used by the financial community to evaluate capital adequacy. Tangible common equity is total equity less preferred equity, goodwill, core deposit intangibles, and other intangibles, such as the purchased credit card relationship intangible. Tangible assets are total assets less goodwill, core deposit intangibles, and other intangibles, such as the purchased credit card relationship intangible. Management and many stock analysts use the tangible common equity ratio and tangible book value per common share in conjunction with more traditional bank capital ratios to compare the capital adequacy of banking organizations with significant amounts of goodwill or other intangible assets, typically stemming from the use of the purchase method of accounting for mergers and acquisitions. Neither tangible common equity nor tangible assets, or the related measures should be considered in isolation or as a substitute for stockholders’ equity, total assets, or any other measure calculated in accordance with GAAP. Moreover, the manner in which the Corporation calculates its tangible common equity, tangible assets, and any other related measures may differ from that of other companies reporting measures with similar names. (In thousands, except ratios and per share information) March 31, December 31, September 30, June 30, March 31, 2015 2014 2014 2014 2014 Total equity - GAAP $ 1,705,750 $ 1,671,743 $ 1,324,157 $ 1,306,001 $ 1,255,898 Preferred equity (36,104) (36,104) (36,104) (36,104) (56,810) Goodwill (28,098) (28,098) (28,098) (28,098) (28,098) Purchased credit card relationship (15,622) (16,389) (17,235) (18,080) (18,942) Core deposit intangible (10,914) (5,420) (5,810) (6,200) (6,591) Tangible common equity $ 1,615,012 $ 1,585,732 $ 1,236,910 $ 1,217,519 $ 1,145,457 Total assets - GAAP $ 13,147,919 $ 12,727,835 $ 12,643,280 $ 12,523,251 $ 12,819,428 Goodwill (28,098) (28,098) (28,098) (28,098) (28,098) Purchased credit card relationship (15,622) (16,389) (17,235) (18,080) (18,942) Core deposit intangible (10,914) (5,420) (5,810) (6,200) (6,591) Tangible assets $ 13,093,285 $ 12,677,928 $ 12,592,137 $ 12,470,873 $ 12,765,797 Common shares outstanding 213,827 212,985 212,978 212,760 208,968 Tangible common equity ratio 12.33% 12.51% 9.82% 9.76% 8.97% Tangible book value per common share $ 7.55 $ 7.45 $ 5.81 $ 5.72 $ 5.48
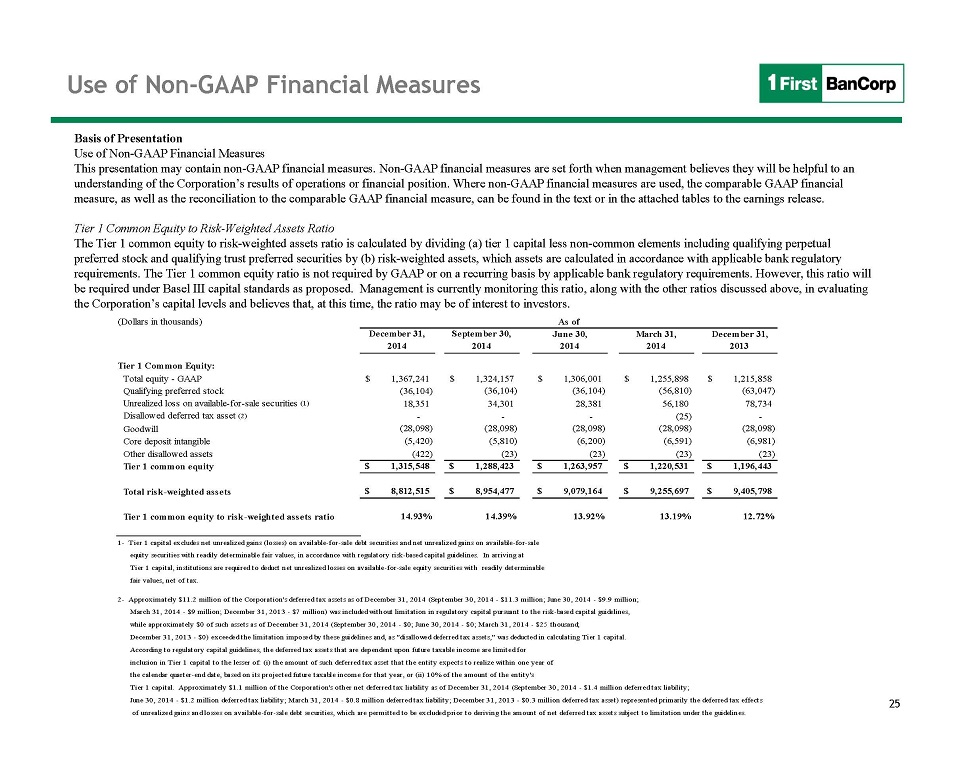
Use of Non-GAAP Financial Measures Basis of Presentation Use of Non-GAAP Financial Measures This presentation may contain non-GAAP financial measures. Non-GAAP financial measures are set forth when management believes they will be helpful to an understanding of the Corporation’s results of operations or financial position. Where non-GAAP financial measures are used, the comparable GAAP financial measure, as well as the reconciliation to the comparable GAAP financial measure, can be found in the text or in the attached tables to the earnings release. Tier 1 Common Equity to Risk-Weighted Assets Ratio The Tier 1 common equity to risk-weighted assets ratio is calculated by dividing (a) tier 1 capital less non-common elements including qualifying perpetual preferred stock and qualifying trust preferred securities by (b) risk-weighted assets, which assets are calculated in accordance with applicable bank regulatory requirements. The Tier 1 common equity ratio is not required by GAAP or on a recurring basis by applicable bank regulatory requirements. However, this ratio will be required under Basel III capital standards as proposed. Management is currently monitoring this ratio, along with the other ratios discussed above, in evaluating the Corporation’s capital levels and believes that, at this time, the ratio may be of interest to investors. (Dollars in thousands) December 31, September 30, June 30, March 31, December 31, 2014 2014 2014 2014 2013 Total equity - GAAP $ 1,367,241 $ 1,324,157 $ 1,306,001 $ 1,255,898 $ 1,215,858 Qualifying preferred stock (36,104) (36,104) (36,104) (56,810) (63,047) Unrealized loss on available-for-sale securities (1) 18,351 3 4,301 28,381 56,180 78,734 Disallowed deferred tax asset (2) - - - (25) - Goodwill (28,098) (28,098) (28,098) (28,098) (28,098) Core deposit intangible (5,420) (5,810) (6,200) (6,591) (6,981) Other disallowed assets (422) ( 23) (23) (23) (23) Tier 1 common equity $ 1,315,548 $ 1,288,423 $ 1,263,957 $ 1,220,531 $ 1,196,443 Total risk-weighted assets $ 8,812,515 $ 8,954,477 $ 9,079,164 $ 9,255,697 $ 9,405,798 Tier 1 common equity to risk-weighted assets ratio 14.93% 14.39% 13.92% 13.19% 12.72% 1- T ier 1 capital excludes net unrealized gains (losses) on available-for-sale debt securities and net unrealized gains on available-for-sale equity securities with readily determinable fair values, in accordance with regulatory risk-based capital guidelines. In arriving at Tier 1 capital, institutions are required to deduct net unrealized losses on available-for-sale equity securities with readily determinable fair values, net of tax. 2- Approximately $11.2 million of the Corporation's deferred tax assets as of December 31, 2014 (September 30, 2014 - $11.3 million; June 30, 2014 - $9.9 million; March 31, 2014 - $9 million; December 31, 2013 - $7 million) was included without limitation in regulatory capital pursuant to the risk-based capital guidelines, while approximately $0 of such assets as of December 31, 2014 (September 30, 2014 - $0; June 30, 2014 - $0; March 31, 2014 - $25 thousand; December 31, 2013 - $0) exceeded the limitation imposed by these guidelines and, as "disallowed deferred tax assets," was deducted in calculating T ier 1 capital. According to regulatory capital guidelines, the deferred tax assets that are dependent upon future taxable income are limited for inclusion in T ier 1 capital to the lesser of: (i) the amount of such deferred tax asset that the entity expects to realize within one year of the calendar quarter-end date, based on its projected future taxable income for that year, or (ii) 10% of the amount of the entity's Tier 1 capital. Approximately $1.1 million of the Corporation's other net deferred tax liability as of December 31, 2014 (September 30, 2014 - $1.4 million deferred tax liability; June 30, 2014 - $1.2 million deferred tax liability; March 31, 2014 - $0.8 million deferred tax liability; December 31, 2013 - $0.3 million deferred tax asset) represented primarily the deferred tax effects of unrealized gains and losses on available-for-sale debt securities, which are permitted to be excluded prior to deriving the amount of net deferred tax assets subject to limitation under the guidelines.
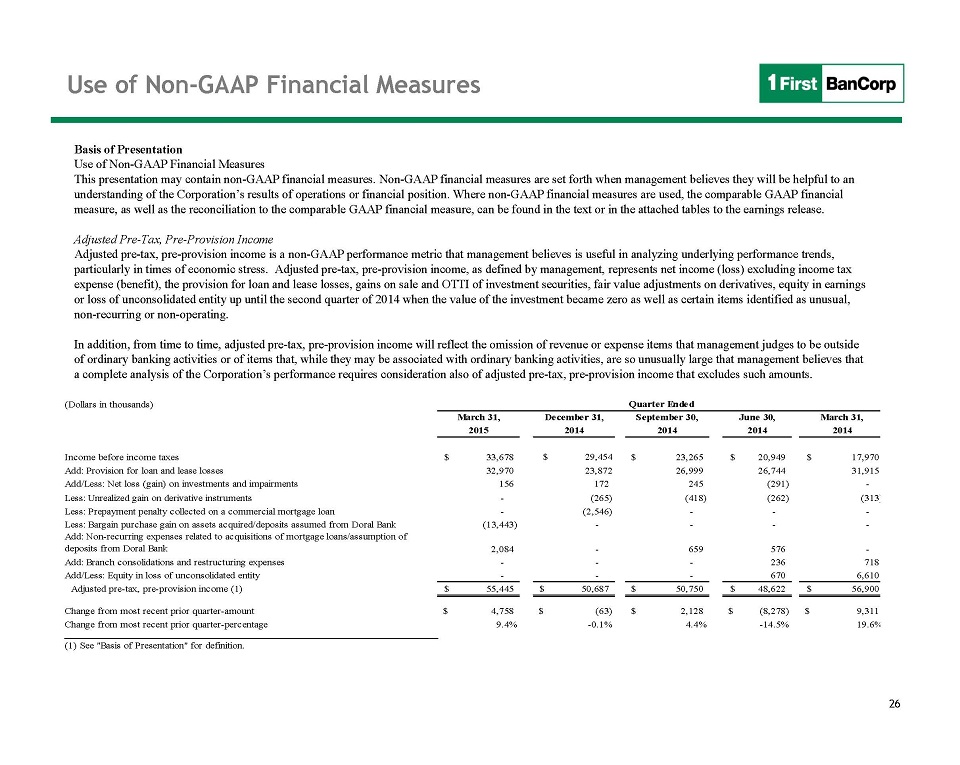
Use of Non-GAAP Financial Measures Basis of Presentation Use of Non-GAAP Financial Measures This presentation may contain non-GAAP financial measures. Non-GAAP financial measures are set forth when management believes they will be helpful to an understanding of the Corporation’s results of operations or financial position. Where non-GAAP financial measures are used, the comparable GAAP financial measure, as well as the reconciliation to the comparable GAAP financial measure, can be found in the text or in the attached tables to the earnings release. Adjusted Pre-Tax, Pre-Provision Income Adjusted pre-tax, pre-provision income is a non-GAAP performance metric that management believes is useful in analyzing underlying performance trends, particularly in times of economic stress. Adjusted pre-tax, pre-provision income, as defined by management, represents net income (loss) excluding income tax expense (benefit), the provision for loan and lease losses, gains on sale and OTTI of investment securities, fair value adjustments on derivatives, equity in earnings or loss of unconsolidated entity up until the second quarter of 2014 when the value of the investment became zero as well as certain items identified as unusual, non-recurring or non-operating. In addition, from time to time, adjusted pre-tax, pre-provision income will reflect the omission of revenue or expense items that management judges to be outside of ordinary banking activities or of items that, while they may be associated with ordinary banking activities, are so unusually large that management believes that a complete analysis of the Corporation’s performance requires consideration also of adjusted pre-tax, pre-provision income that excludes such amounts. (Dollars in thousands) March 31, December 31, September 30, June 30, March 31, 2015 2014 2014 2014 2014 Income before income taxes $ 33,678 $ 29,454 $ 23,265 $ 2 0,949 $ 17,970 Add: Provision for loan and lease losses 32,970 23,872 26,999 26,744 31,915 Add/Less: Net loss (gain) on investments and impairments 156 1 72 245 (291) - Less: Unrealized gain on derivative instruments - (265) ( 418) (262) (313) Less: Prepayment penalty collected on a commercial mortgage loan - (2,546) - - - Less: Bargain purchase gain on assets acquired/deposits assumed from Doral Bank (13,443) - - - - Add: Non-recurring expenses related to acquisitions of mortgage loans/assumption of deposits from Doral Bank 2,084 - 659 5 76 - Add: Branch consolidations and restructuring expenses - - - 2 36 718 Add/Less: Equity in loss of unconsolidated entity - - - 6 70 6,610 Adjusted pre-tax, pre-provision income (1) $ 55,445 $ 5 0,687 $ 5 0,750 $ 4 8,622 $ 56,900 Change from most recent prior quarter-amount $ 4,758 $ (63) $ 2,128 $ (8,278) $ 9,311 Change from most recent prior quarter-percentage 9.4% -0.1% 4.4% -14.5% 19.6% (1) See "Basis of Presentation" for definition.