Attached files
| file | filename |
|---|---|
| 8-K - 8-K - STATE BANK FINANCIAL CORP | stbz-20150504x8k.htm |

State Bank Financial Corporation 2015 Gulf South Bank Conference Joe Evans, Chairman and Chief Executive Officer Tom Wiley, Vice Chairman and President May 2015

2 Cautionary Note Regarding Forward-Looking Statements Certain statements contained in this presentation that are not statements of historical fact are forward-looking statements. These forward-looking statements, which are based on certain assumptions and describe our future plans, strategies and expectations, can generally be identified by the use of the words “may,” “would,” “could,” “will,” “expect,” “anticipate,” “project”, “believe,” “intend,” “plan” and “estimate,” as well as similar expressions. These forward-looking statements include statements related to expected cost savings related to our recent acquisition, the sustainability of our core operating franchise, the strength of our credit metrics on our organic loans, the opportunity to use the mortgage and SBA platforms from our recent acquisitions, the growth of our payroll business, our projected growth, continued improvement in our deposit funding mix, our well-positioned franchise, our execution of strategic priorities, our anticipated future financial performance, and management’s long-term performance goals, as well as statements relating to the anticipated effects on results of operations and financial condition from expected developments or events, including projections of future amortization of the FDIC receivable and accretion on loans, the impact of the expiration of loss share agreements, anticipated internal growth, and plans to establish or acquire banks or the assets of failed banks. These forward-looking statements involve significant risks and uncertainties that could cause our actual results to differ materially from those anticipated in such statements. Potential risks and uncertainties include the following: • negative reactions to our recent acquisitions by the customers, employees and counterparties of the acquired banks, or difficulties related to the transition of services; • general economic conditions (both generally and in our markets) may be less favorable than expected, which could result in, among other things, a deterioration in credit quality, a reduction in demand for credit and a decline in real estate values; • a general decline in the real estate and lending markets, particularly in our market areas, could negatively affect our financial results; • we may be unable to collect reimbursements on losses that we incur on our assets covered under loss share agreements with the FDIC as we anticipate; • costs or difficulties related to the integration of the banks we have acquired or may acquire may be greater than expected; • restrictions or conditions imposed by our regulators on our operations may make it more difficult for us to achieve our goals; • legislative or regulatory changes, including changes in accounting standards and compliance requirements, may adversely affect us; • competitive pressures among depository and other financial institutions may increase significantly; • changes in the interest rate environment may reduce margins or the volumes or values of the loans we make or have acquired; • other financial institutions have greater financial resources and may be able to develop or acquire products that enable them to compete more successfully than we can; • our ability to attract and retain key personnel can be affected by the increased competition for experienced employees in the banking industry; • adverse changes may occur in the bond and equity markets; • war or terrorist activities may cause deterioration in the economy or cause instability in credit markets; • economic, governmental or other factors may prevent the projected population, residential and commercial growth in the markets in which we operate; and • we will or may continue to face the risk factors discussed from time to time in the periodic reports we file with the SEC. For these forward-looking statements, we claim the protection of the safe harbor for forward-looking statements contained in the Private Securities Litigation Reform Act of 1995. You should not place undue reliance on the forward-looking statements, which speak only as of the date of this report. All subsequent written and oral forward- looking statements attributable to us or any person acting on our behalf are expressly qualified in their entirety by the cautionary statements contained or referred to in this section. We undertake no obligation to publicly update or revise any forward-looking statements, whether as a result of new information, future events or otherwise. See Item 1A, Risk Factors, in our Annual Report on Form 10-K for the most recently ended fiscal year, for a description of some of the important factors that may affect actual outcomes.

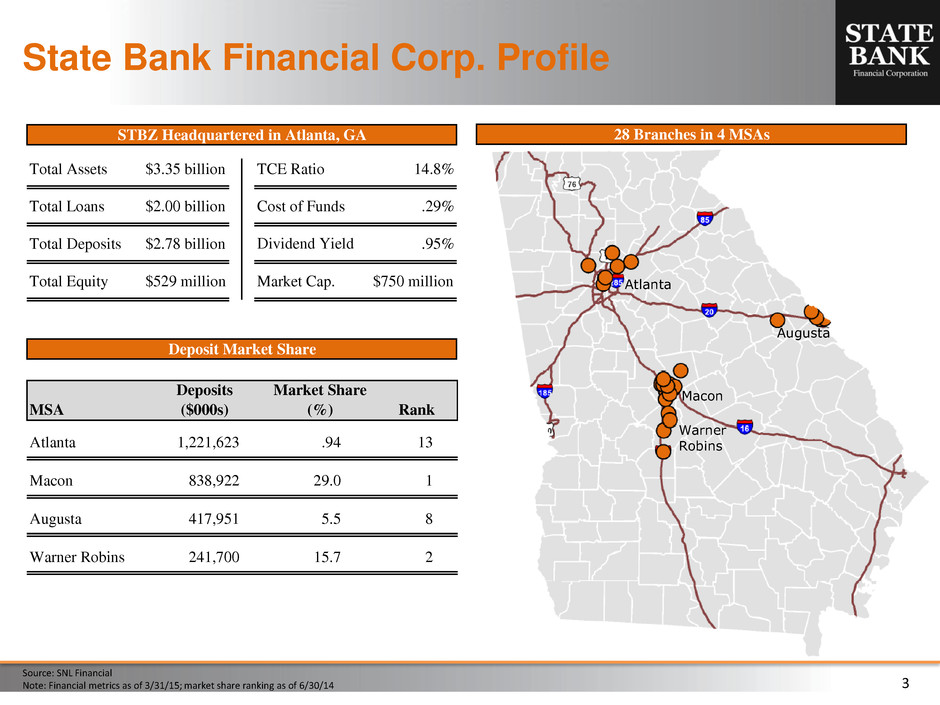
3 State Bank Financial Corp. Profile Source: SNL Financial Note: Financial metrics as of 3/31/15; market share ranking as of 6/30/14 28 Branches in 4 MSAs Atlanta Macon Warner Robins Augusta STBZ Headquartered in Atlanta, GA Deposit Market Share Total Assets $3.35 billion TCE Ratio 14.8% Total Loans $2.00 billion Cost of Funds .29% Total Deposits $2.78 billion Dividend Yield .95% Total Equity $529 million Market Cap. $750 million MSA Deposits ($000s) Market Share (%) Rank Atlanta 1,221,623 .94 13 Macon 838,922 29.0 1 Augusta 417,951 5.5 8 Warner Robins 241,700 15.7 2

4 State Bank Financial Corp. Highlights STBZ Profile $3.35 billion in assets with 28 branches in Atlanta, Macon and Augusta 5th highest deposit market share in Georgia among Georgia-based banks 5th highest market cap among publicly traded Georgia-based banks Low cost transaction-based funding driven by commercial relationships in metro markets Management Depth State Bank Executive Officers average 30 years of banking experience, substantially all of which is within the local Georgia markets the company serves Senior management has a healthy balance of community bank and regional bank experience Management team with a track record of successful acquisitions / integrations and building long-term shareholder value Low Risk Profile Capital levels to support growth and opportunistic transactions Low cost core deposits Solid credit metrics Strong infrastructure in operations, compliance and risk management Asset-sensitive balance sheet

5 Market Contribution Atlanta 45% Macon 31% Augusta 15% Warner Robins 9% Deposits by Market Atlanta 49% Macon 7% Augusta 17% Warner Robins 3% Other GA 8% Outside GA 17% 1 Includes organic and purchased non-credit impaired loans Note: Deposits as of 6/30/14; loans outstanding as of 3/31/15 Loans Outstanding by Market 1

6 Retail 24% Multifamily 15% Office 14% Residential 12% Hospitality 10% Land/Lots 10% Industrial 6% Sr Housing 3% Restaurants 2% Other 4% Loan Portfolio ($ i n mi llio n s) 1 Includes organic and purchased non-credit impaired loans 0 500 1,000 1,500 2,000 1Q10 2Q 3Q 4Q 1Q11 2Q 3Q 4Q 1Q12 2Q 3Q 4Q 1Q13 2Q 3Q 4Q 1Q14 2Q 3Q 4Q 1Q15 Total Loan Portfolio Organic & Purchased Non-Credit ImpairedPurchased Credit Impaired Loan Portfolio 1 CRE Composition 1 Other CRE 39% Residential Constr 7% Comm Constr 12% Land/Dev 6% Owner- occupied RE 15% Residential RE 11% Comm/fin/ag 8% Leases 1% Consumer 1%

7 NIB 25% IB Transaction 20% Savings & MMA 38% CDs 14% Brokered/ Wholesale 3% Funding Advantage Continued focus on increasing transaction deposits Noninterest-bearing demand deposits make up 25% of total deposits Total cost of funds of 29 bps is down 4 bps from the prior quarter and down 8 bps from the prior year period ($ i n mi llio n s) 0 200 400 600 800 1,000 1,200 1,400 Transaction Deposit Accounts Noninterest-bearing Interest-bearing 1.82% .29% 0.0% 0.5% 1.0% 1.5% 2.0% Cost of Funds Deposit Mix

8 Acquisition History 2009 – 2011 2012 2014 2015 2015 12 FDIC-assisted acquisitions Total Assets: $3.9 billion Total Deposits: $3.6 billion Total Assets: $186 million Total Deposits: $148 million Total Assets: $517 million Total Deposits: $422 million Payroll Services Company Independent Insurance Agency

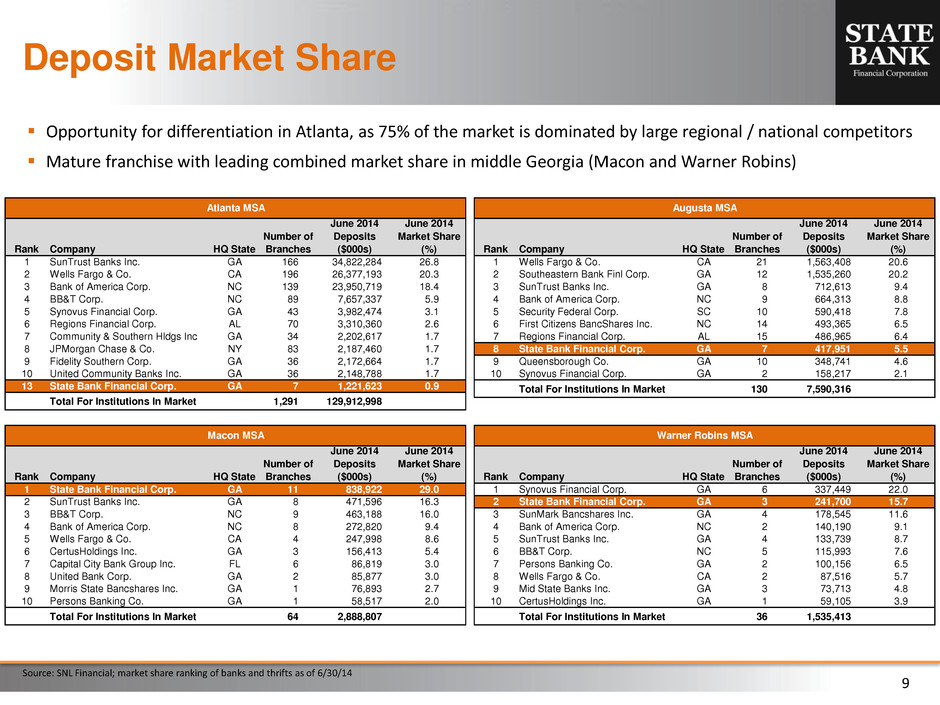
9 Source: SNL Financial; market share ranking of banks and thrifts as of 6/30/14 Deposit Market Share Opportunity for differentiation in Atlanta, as 75% of the market is dominated by large regional / national competitors Mature franchise with leading combined market share in middle Georgia (Macon and Warner Robins) Rank Company HQ State Number of Branches June 2014 Deposits ($000s) June 2014 Market Share (%) 1 SunTrust Banks Inc. GA 166 34,822,284 26.8 2 Wells Fargo & Co. CA 196 26,377,193 20.3 3 Bank of America Corp. NC 139 23,950,719 18.4 4 BB&T Corp. NC 89 7,657,337 5.9 5 Synovus Financi l Corp. GA 43 3,982,474 3.1 6 Regio s Fina cial Corp. AL 70 3,310,360 2.6 7 Community & Southern Hldgs Inc GA 34 2,202,617 1.7 8 JPMorgan Chase & Co. NY 83 2,187,460 1.7 9 Fidelity Southern Corp. GA 36 2,172,664 1.7 10 United Community Banks Inc. GA 36 2,148,788 1.7 13 State Bank Financial Corp. GA 7 1,221,623 0.9 Total For Institutions In Market 1,291 129,912,998 Atlanta MSA Rank Company HQ State Number of Branches June 2014 Deposits ($000s) June 2014 Market Share (%) 1 State Bank Financial Corp. GA 11 838,922 29.0 2 SunTrust Banks Inc. A 8 471,596 16.3 3 BB&T Corp. NC 9 463,188 16.0 4 Bank of America Corp. NC 8 272,820 9.4 5 Wells Fa go & Co. CA 4 247 8.6 6 CertusHoldings Inc. GA 3 156,413 5.4 7 Capital City Bank Group Inc. FL 6 86,819 3.0 8 United Bank Corp. GA 2 85,877 3.0 9 Morris State Bancshares Inc. GA 1 76,893 2.7 10 Persons Banking Co. GA 1 58,517 2.0 Total For Institutions In Market 64 2,888,807 Macon MSA Rank Company HQ State Number of Branches Deposits ($000s) June 2014 Market Share (%) 1 Synovus Financial Corp. GA 6 337,449 22.0 2 State Bank Financial Corp. GA 3 241,700 15.7 3 SunMark Bancshares Inc. GA 4 78,545 11.6 4 Bank of America Corp. NC 2 140,190 9.1 5 SunTrust B nks Inc. GA 4 133,739 8.7 6 BB&T Corp. NC 5 115,993 7.6 7 Persons Banking Co. GA 2 100,156 6.5 8 Wells Fargo & Co. CA 2 87,516 5.7 9 Mid State Banks Inc. GA 3 73,713 4.8 10 CertusHoldings Inc. GA 1 59,105 3.9 Total For Institutions In Market 36 1,535,413 Warner Robins MSA Rank Company HQ State Number of Branches June 2014 Deposits ($000s) June 2014 Market Share (%) 1 Wells Fargo & Co. CA 2 1,563,408 20.6 2 Southeastern Bank Finl Corp. GA 12 1,535,260 20.2 3 SunTrust Banks Inc. GA 8 712,613 9.4 4 Bank of America Corp. NC 9 664,313 8.8 5 Security Federal Corp. SC 10 590,418 7.8 6 First Citizen BancShares Inc. NC 14 493,365 6.5 7 Regions Financial Corp. AL 15 486,965 6.4 8 tate Bank Financial Corp. 7 4 7,951 5.5 9 Quee sborough Co. 10 348,741 4.6 10 ynovus Financial Corp. 2 158,217 2.1 Total For Institutions In Market 130 7,590,316 Augusta MSA

10 Note: Consolidated financial results for 1Q 2015 contained throughout this presentation are unaudited; numbers may not add due to rounding 1Q15 Results Summary 1Q15 net income of $9.2 million, or $.25 per diluted share Significant improvement in noninterest income, led by mortgage origination and SBA lending Organic loan growth of over $113 million during 1Q15 Created insurance division through purchase of Boyett Agency Increased 1Q15 dividend to $.05 per common share Income Statement Highlights (dollars in thousands, except per share data) 1Q15 4Q14 1Q14 Interest income on invested funds $3,602 $2,928 $2,493 Interest income on loans 21,400 17,416 15,248 Accretion income on loans 16,069 14,124 26,536 Interest expense 1,979 1,923 1,894 Net interest income 39,092 32,545 42,383 Provision for loan losses (organic & PNCI) 1,072 775 - Provision for loan losses (PCI) 2,121 415 590 Net interest income after provision for loan losses 35,899 31,356 41,793 Noninterest income 10,257 5,285 3,130 (Amortization) accretion of FDIC receivable (1,448) 1,652 (15,292) Total noninterest expense 30,094 25,799 23,083 Income before income taxes 14,614 12,494 6,548 Income tax expense 5,410 4,909 2,226 Net income $9,204 $7,585 $4,322 Diluted net income per share .25 .22 .13 Dividends per share .05 .04 .03 Tangible book value per share 13.70 13.97 13.36 Balance Sheet Highlights (period-end) Total Loans $2,000,189 $1,634,529 $1,413,192 Organic 1,433,468 1,320,393 1,166,913 Purchased non-credit impaired 375,874 107,797 - Purchased credit impaired 190,847 206,339 246,279 Total assets 3,351,908 2,882,210 2,622,491 Noninterest-bearing deposits 691,938 577,295 471,414 Total deposits 2,777,935 2,391,682 2,141,061 Shareholders’ equity 529,246 464,095 441,439

11 Noninterest Income Key Initiatives Combined mortgage production of over $118mm in the first quarter, leading to $2.7mm in fee income Significant opportunity within State Bank’s existing builder finance program as we continue to leverage First Bank of Georgia’s mortgage platform across State Bank footprint Mortgage SBA Payroll SBA team production of $8.5mm in 1Q15 Total SBA fee income of $1.1mm; 11.2% premium on 7(a) production Strong SBA pipeline and increased activity coming from traditional commercial bankers Payroll fee income increased 22% year-over-year to $1.2mm in 1Q15 17% increase in number of checks processed and number of clients in 1Q15 versus 1Q14 Continue to increase number of new payroll clients and improve integration with bankers and clients by leveraging treasury / payments expertise

12 State Bank Financial Corp. STBZ Profile $3.35 billion in assets with 28 branches in Atlanta, Macon and Augusta 5th highest deposit market share in Georgia among Georgia-based banks 5th highest market cap among publicly traded Georgia-based banks Low cost transaction-based funding driven by commercial relationships in metro markets Management Depth Low Risk Profile Capital levels to support growth and opportunistic transactions Low cost core deposits Solid credit metrics Strong infrastructure in operations, compliance and risk management Asset-sensitive balance sheet State Bank Executive Officers average 30 years of banking experience, substantially all of which is within the local Georgia markets the company serves Senior management has a healthy balance of community bank and regional bank experience Management team with a track record of successful acquisitions / integrations and building long-term shareholder value
