Attached files
| file | filename |
|---|---|
| 8-K - 8-K - SOUTH STATE Corp | a15-10720_18k.htm |
Exhibit 99.1
|
|
Investor Presentation First Quarter 2015 |
|
|
Cautionary Statement Regarding Forward Looking Statements Statements included in this report which are not historical in nature are intended to be, and are hereby identified as, forward looking statements for purposes of the safe harbor provided by Section 21E of the Securities Exchange Act of 1934. Forward looking statements generally include words such as “expects,” “projects,” “anticipates,” “believes,” “intends,” “estimates,” “strategy,” “plan,” “potential,” “possible” and other similar expressions. The Company cautions readers that forward looking statements are subject to certain risks and uncertainties that could cause actual results to differ materially from anticipated results. Such risks and uncertainties, include, among others, the following possibilities: (1) the outcome of any legal proceedings instituted against the Company; (2) credit risks associated with an obligor’s failure to meet the terms of any contract with the bank or otherwise fail to perform as agreed under the terms of any loan-related document; (3) interest risk involving the effect of a change in interest rates on the bank’s earnings, the market value of the bank's loan and securities portfolios, and the market value of the Company's equity; (4) liquidity risk affecting the bank’s ability to meet its obligations when they come due; (5) risks associated with an anticipated increase in the Company's investment securities portfolio, including risks associated with acquiring and holding investment securities or potentially determining that the amount of investment securities the Company desires to acquire are not available on terms acceptable to the Company; (6) price risk focusing on changes in market factors that may affect the value of traded instruments in “mark-to-market” portfolios; (7) transaction risk arising from problems with service or product delivery; (8) compliance risk involving risk to earnings or capital resulting from violations of or nonconformance with laws, rules, regulations, prescribed practices, or ethical standards; (9) regulatory change risk resulting from new laws, rules, regulations, accounting principles, proscribed practices or ethical standards, including, without limitation, increased capital requirements (including, without limitation, the impact of the capital rules adopted to implement Basel III), Consumer Financial Protection Bureau rules and regulations, and potential changes in accounting principles relating to loan loss recognition; (10) strategic risk resulting from adverse business decisions or improper implementation of business decisions; (11) reputation risk that adversely affects earnings or capital arising from negative public opinion; (12) terrorist activities risk that results in loss of consumer confidence and economic disruptions; (13) cybersecurity risk related to our dependence on internal computer systems and the technology of outside service providers, as well as the potential impacts of third-party security breaches, subjects the company to potential business disruptions or financial losses resulting from deliberate attacks or unintentional events; (14) economic downturn risk potentially resulting in deterioration in the credit markets, greater than expected non-interest expenses, excessive loan losses and other negative consequences, which risks could be exacerbated by potential negative economic developments resulting from federal spending cuts and/or one or more federal budget-related impasses or actions; (15) greater than expected noninterest expenses; (16) excessive loan losses; (17) failure to realize synergies and other financial benefits from, and to limit liabilities associates with, mergers and acquisitions; (18) potential deposit attrition, higher than expected costs, customer loss and business disruption associated with merger and acquisition integration, including, without limitation, potential difficulties in maintaining relationships with key personnel and other integration related-matters; (19) the risks of fluctuations in market prices for Company common stock that may or may not reflect economic condition or performance of the Company; (20) the payment of dividends on Company common stock is subject to regulatory supervision as well as the discretion of the board of directors of the Company, the Company's performance and other factors; and (21) other risks and uncertainties disclosed in the Company's most recent Annual Report on Form 10-K filed with the SEC or disclosed in documents filed or furnished by the Company with or to the SEC after the filing of such Annual report on Form 10-K, any of which could cause actual results to differ materially from future results expressed, implied or otherwise anticipated by such forward looking statements. The Company undertakes no obligation to update or otherwise revise any forward-looking statements, whether as a result of new information, future events, or otherwise. Non-GAAP Measures Statements included in this presentation include non-GAAP measures and should be read along with the accompanying tables to the earnings release which provide a reconciliation of non-GAAP measures to GAAP measures. Management believes that these non-GAAP measures provide additional useful information. Non-GAAP measures should not be considered as an alternative to any measure of performance or financial condition as promulgated under GAAP, and investors should consider the company's performance and financial condition as reported under GAAP and all other relevant information when assessing the performance or financial condition of the company. Non-GAAP measures have limitations as analytical tools, and investors should not consider them in isolation or as a substitute for analysis of the company's results or financial condition as reported under GAAP. Forward Looking Statements and Non GAAP Measures |
|
|
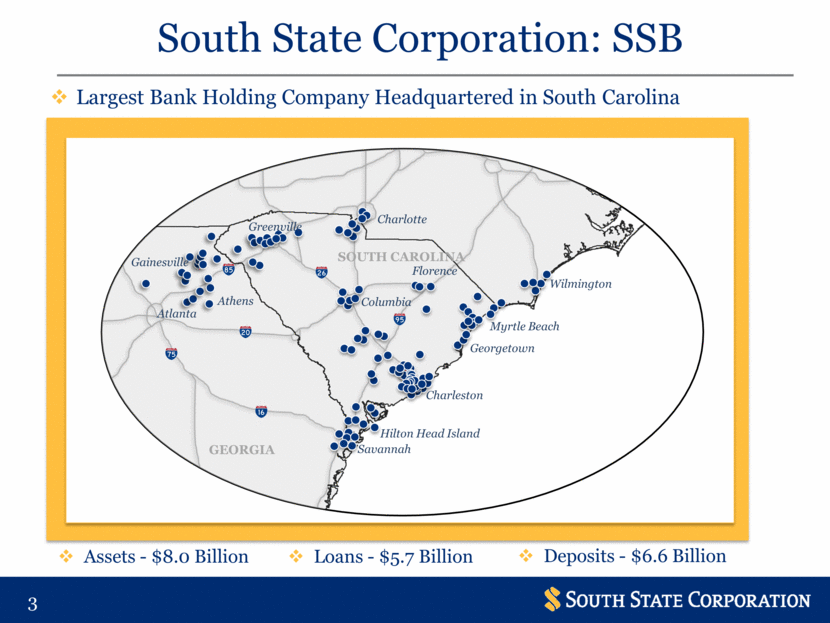
South State Corporation: SSB Assets - $8.0 Billion Largest Bank Holding Company Headquartered in South Carolina Loans - $5.7 Billion Deposits - $6.6 Billion GEORGIA Charlotte Wilmington Myrtle Beach Hilton Head Island Savannah Atlanta Florence Columbia Athens Gainesville Georgetown Charleston Greenville SOUTH CAROLINA |
|
|
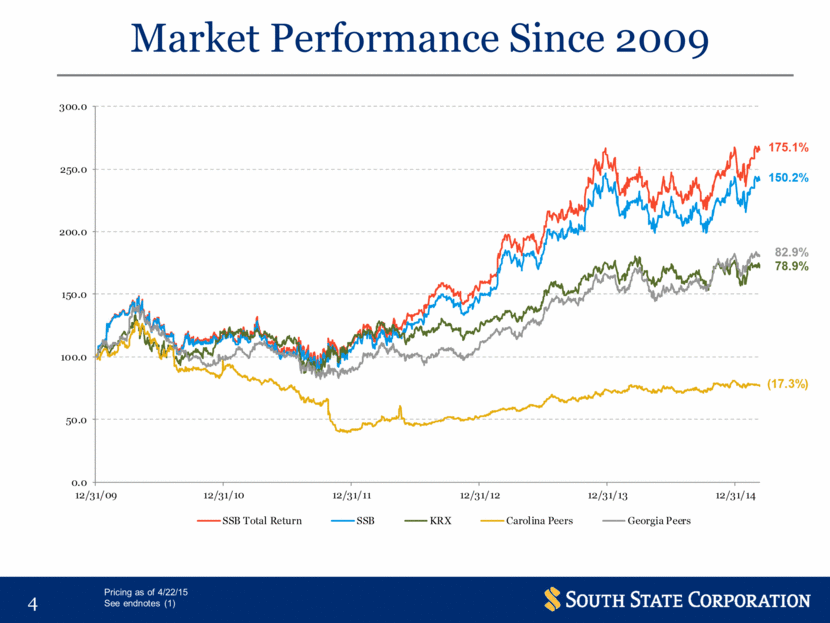
Market Performance Since 2009 Pricing as of 4/22/15 See endnotes (1) 0.0 50.0 100.0 150.0 200.0 250.0 300.0 12/31/09 12/31/10 12/31/11 12/31/12 12/31/13 12/31/14 SSB Total Return SSB KRX Carolina Peers Georgia Peers 175.1% 150.2% (17.3%) 82.9% 78.9% |
|
|
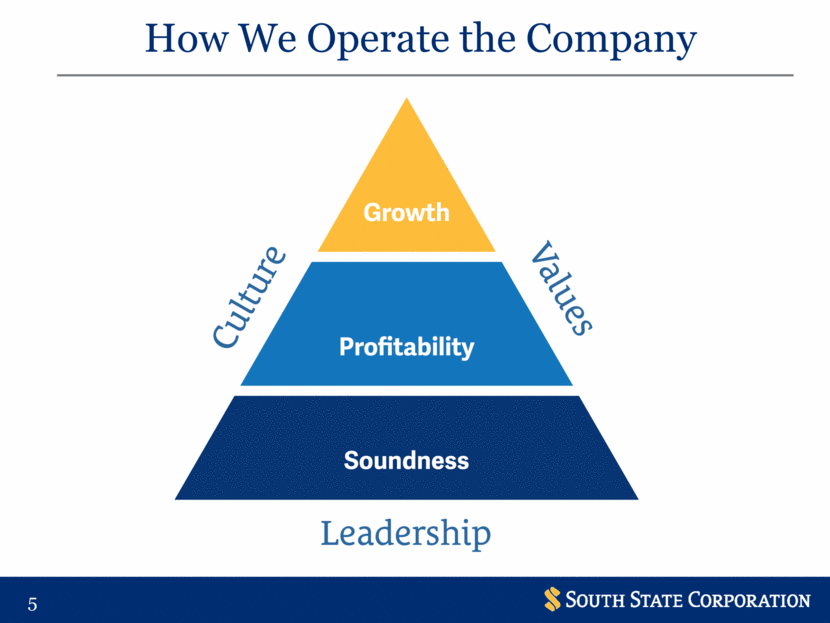
How We Operate the Company |
|
|
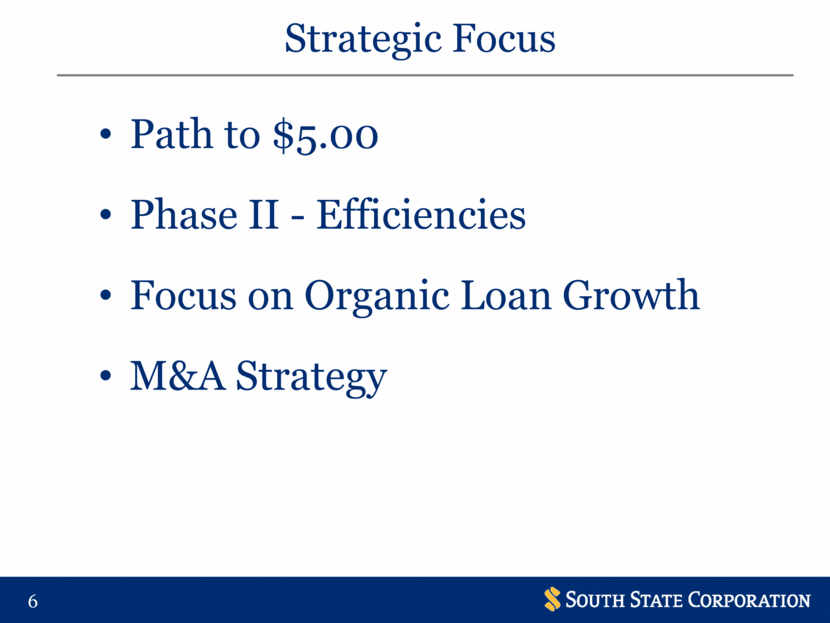
Path to $5.00 Phase II - Efficiencies Focus on Organic Loan Growth M&A Strategy Strategic Focus |
|
|
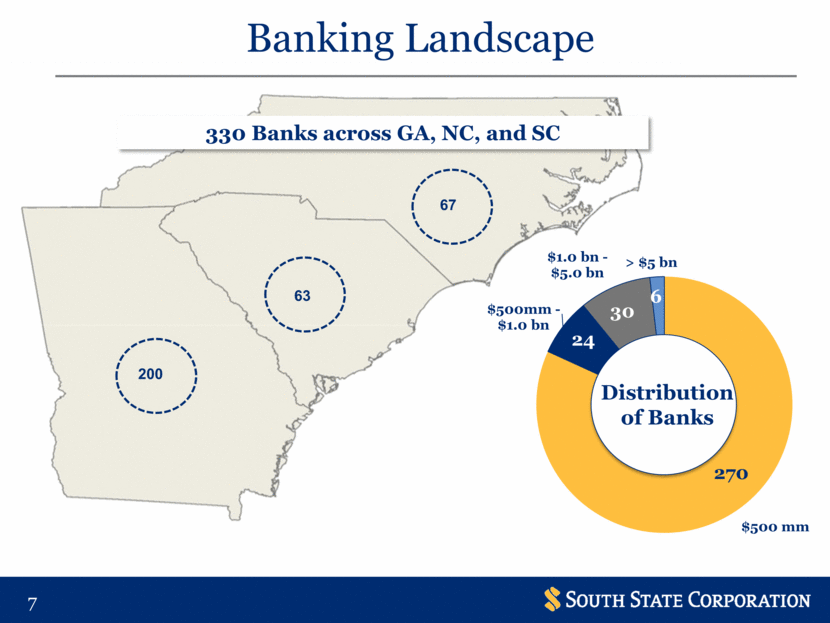
63 67 200 Banking Landscape 330 Banks across GA, NC, and SC Distribution of Banks 270 $500 mm $500mm - $1.0 bn $1.0 bn - $5.0 bn > $5 bn 6 24 30 |
|
|
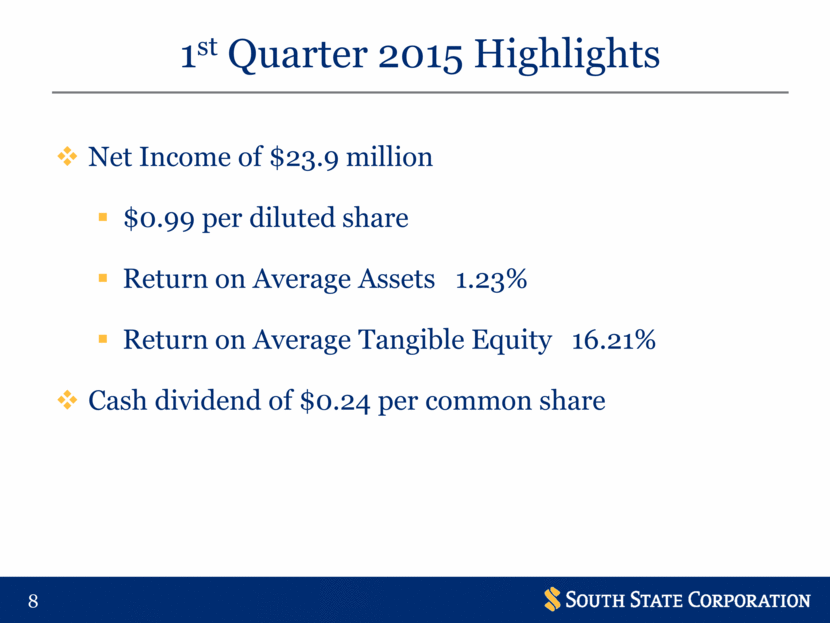
Net Income of $23.9 million $0.99 per diluted share Return on Average Assets 1.23% Return on Average Tangible Equity 16.21% Cash dividend of $0.24 per common share 1st Quarter 2015 Highlights |
|
|
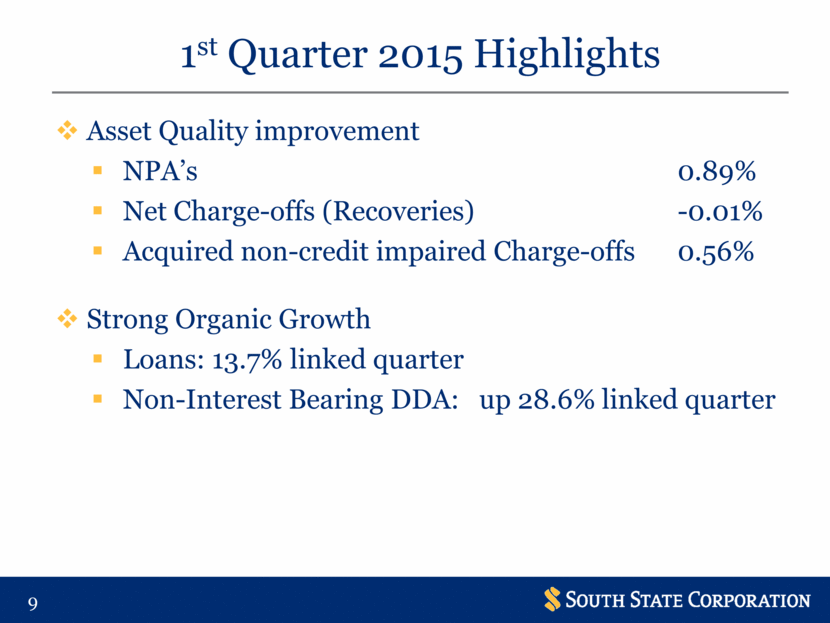
1st Quarter 2015 Highlights Asset Quality improvement NPA’s 0.89% Net Charge-offs (Recoveries) -0.01% Acquired non-credit impaired Charge-offs 0.56% Strong Organic Growth Loans: 13.7% linked quarter Non-Interest Bearing DDA: up 28.6% linked quarter |
|
|
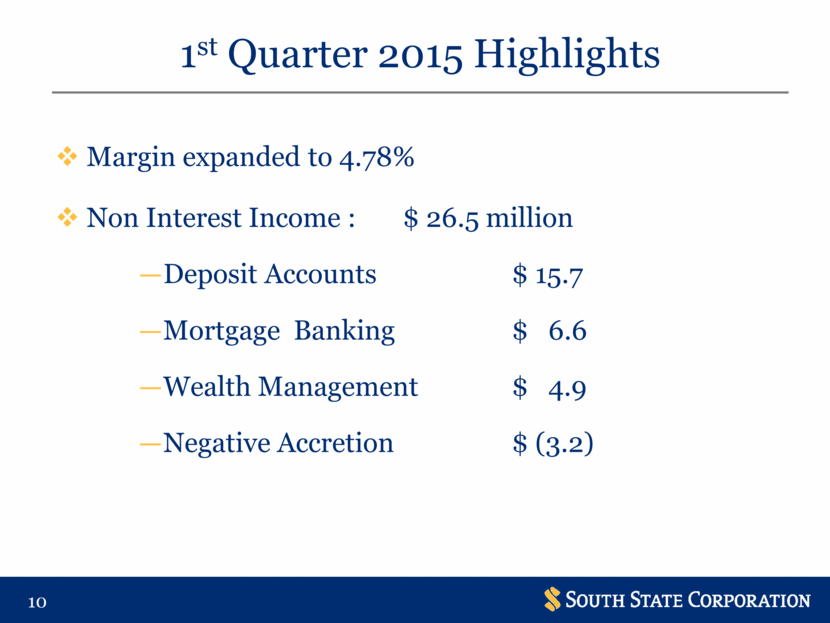
1st Quarter 2015 Highlights Margin expanded to 4.78% Non Interest Income : $ 26.5 million Deposit Accounts $ 15.7 Mortgage Banking $ 6.6 Wealth Management $ 4.9 Negative Accretion $ (3.2) |
|
|
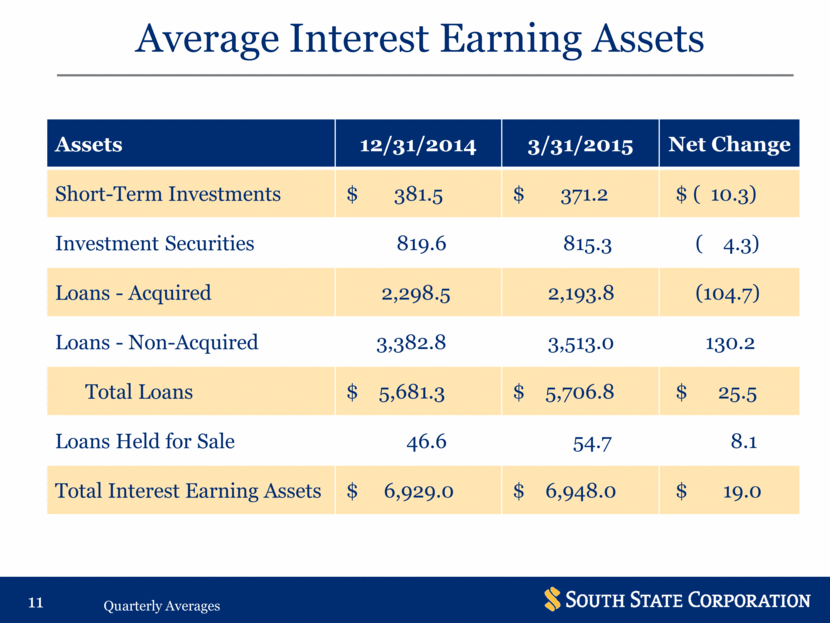
Average Interest Earning Assets Assets 12/31/2014 3/31/2015 Net Change Short-Term Investments $ 381.5 $ 371.2 $ ( 10.3) Investment Securities 819.6 815.3 ( 4.3) Loans - Acquired 2,298.5 2,193.8 (104.7) Loans - Non-Acquired 3,382.8 3,513.0 130.2 Total Loans $ 5,681.3 $ 5,706.8 $ 25.5 Loans Held for Sale 46.6 54.7 8.1 Total Interest Earning Assets $ 6,929.0 $ 6,948.0 $ 19.0 Quarterly Averages |
|
|
BRANCH INITIATIVES |
|
|
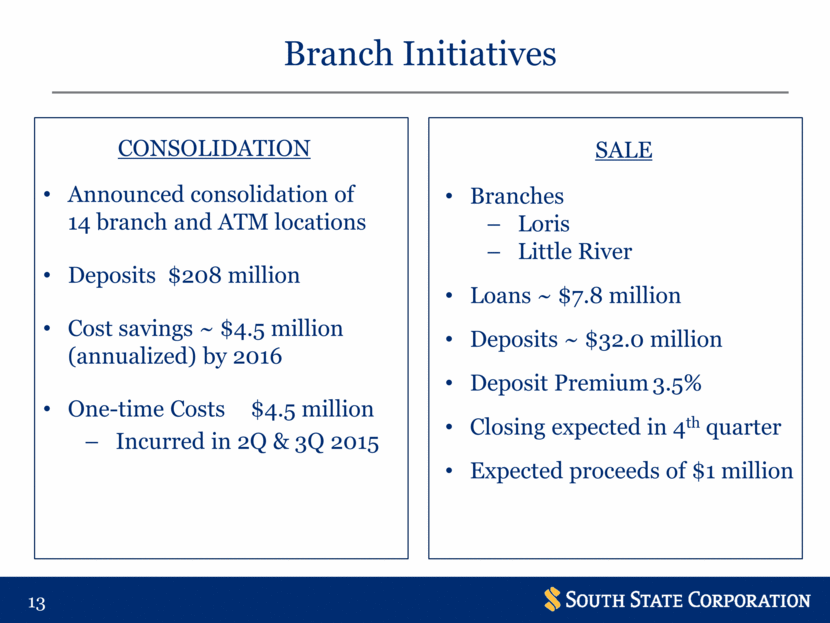
CONSOLIDATION Announced consolidation of 14 branch and ATM locations Deposits $208 million Cost savings ~ $4.5 million (annualized) by 2016 One-time Costs $4.5 million Incurred in 2Q & 3Q 2015 Branch Initiatives SALE Branches Loris Little River Loans ~ $7.8 million Deposits ~ $32.0 million Deposit Premium 3.5% Closing expected in 4th quarter Expected proceeds of $1 million |
|
|
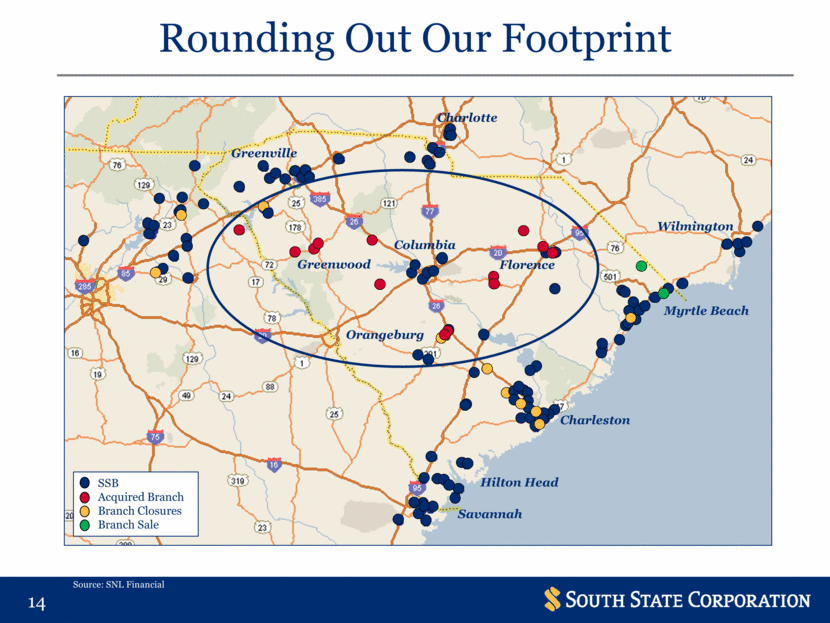
Rounding Out Our Footprint Source: SNL Financial SSB Acquired BAC Branch Orangeburg Charlotte Florence Columbia Greenwood Greenville Savannah Charleston Myrtle Beach Wilmington Hilton Head SSB Acquired Branch Branch Closures Branch Sale |
|
|
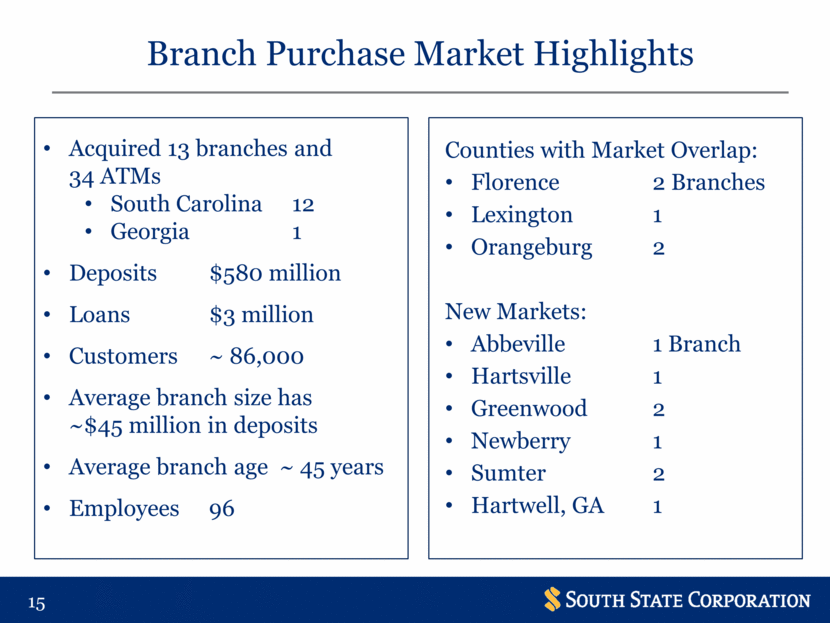
Branch Purchase Market Highlights Acquired 13 branches and 34 ATMs South Carolina 12 Georgia 1 Deposits $580 million Loans $3 million Customers ~ 86,000 Average branch size has ~$45 million in deposits Average branch age ~ 45 years Employees 96 Counties with Market Overlap: Florence 2 Branches Lexington 1 Orangeburg 2 New Markets: Abbeville 1 Branch Hartsville 1 Greenwood 2 Newberry 1 Sumter 2 Hartwell, GA 1 |
|
|
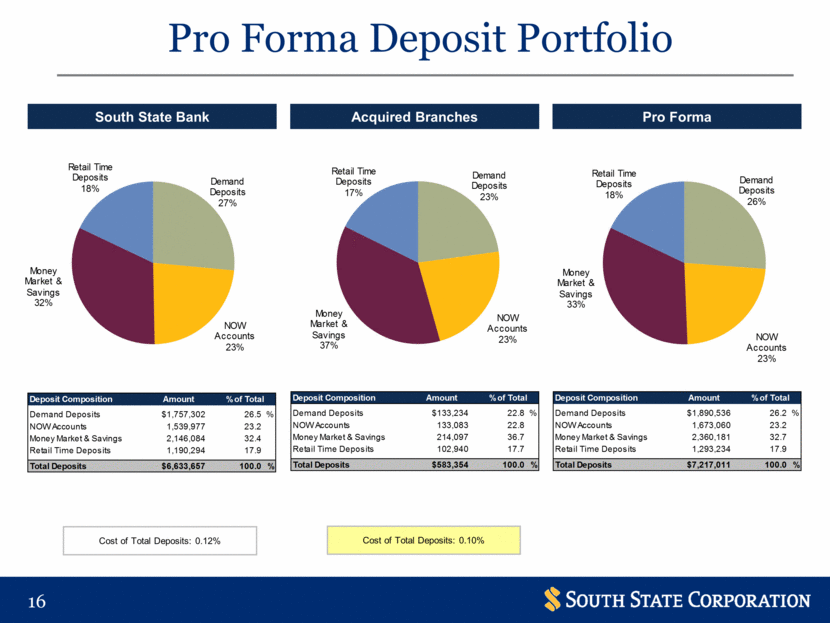
Pro Forma Deposit Portfolio South State Bank Acquired Branches Pro Forma Cost of Total Deposits: 0.12% Cost of Total Deposits: 0.10% Deposit Composition Amount % of Total Demand Deposits $1,757,302 26.5 % NOW Accounts 1,539,977 23.2 Money Market & Savings 2,146,084 32.4 Retail Time Deposits 1,190,294 17.9 Total Deposits $6,633,657 100.0 % Demand Deposits 26% NOW Accounts 23% Money Market & Savings 33% Retail Time Deposits 18% Deposit Composition Amount % of Total Demand Deposits $1,890,536 26.2 % NOW Accounts 1,673,060 23.2 Money Market & Savings 2,360,181 32.7 Retail Time Deposits 1,293,234 17.9 Total Deposits $7,217,011 100.0 % Deposit Composition Amount % of Total Demand Deposits $133,234 22.8 % NOW Accounts 133,083 22.8 Money Market & Savings 214,097 36.7 Retail Time Deposits 102,940 17.7 Total Deposits $583,354 100.0 % Demand Deposits 23% NOW Accounts 23% Money Market & Savings 37% Retail Time Deposits 17% Demand Deposits 27% NOW Accounts 23% Money Market & Savings 32% Retail Time Deposits 18% |
|
|
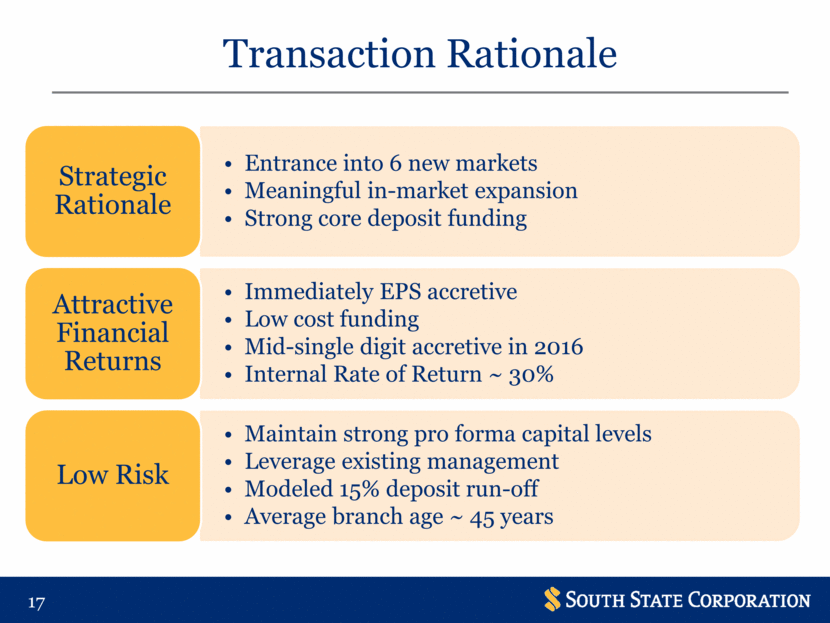
Transaction Rationale Entrance into 6 new markets Meaningful in-market expansion Strong core deposit funding Strategic Rationale Immediately EPS accretive Low cost funding Mid-single digit accretive in 2016 Internal Rate of Return ~ 30% Attractive Financial Returns Maintain strong pro forma capital levels Leverage existing management Modeled 15% deposit run-off Average branch age ~ 45 years Low Risk |
|
|
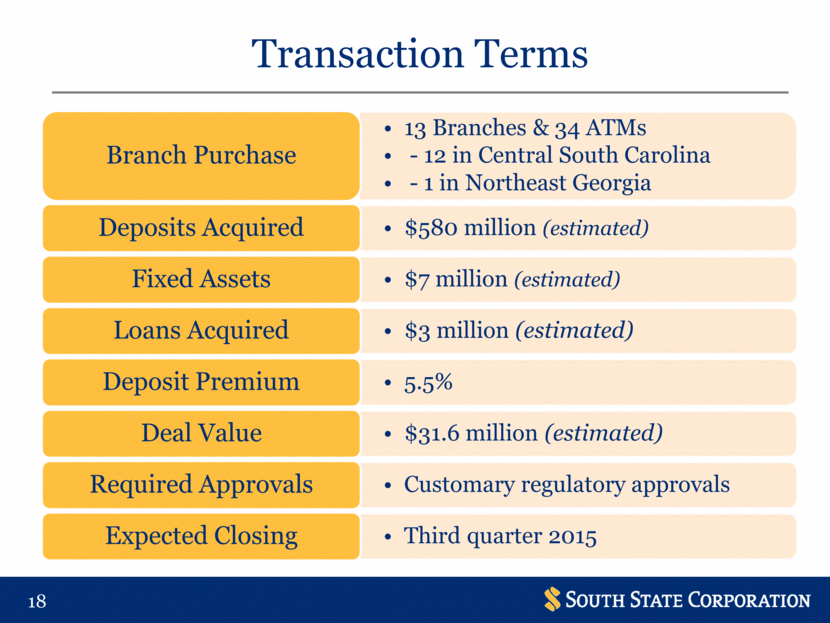
Transaction Terms 13 Branches & 34 ATMs - 12 in Central South Carolina - 1 in Northeast Georgia Branch Purchase $580 million (estimated) Deposits Acquired $7 million (estimated) Fixed Assets $3 million (estimated) Loans Acquired 5.5% Deposit Premium $31.6 million (estimated) Deal Value Customary regulatory approvals Required Approvals Third quarter 2015 Expected Closing |
|
|
SOUNDNESS |

|
|
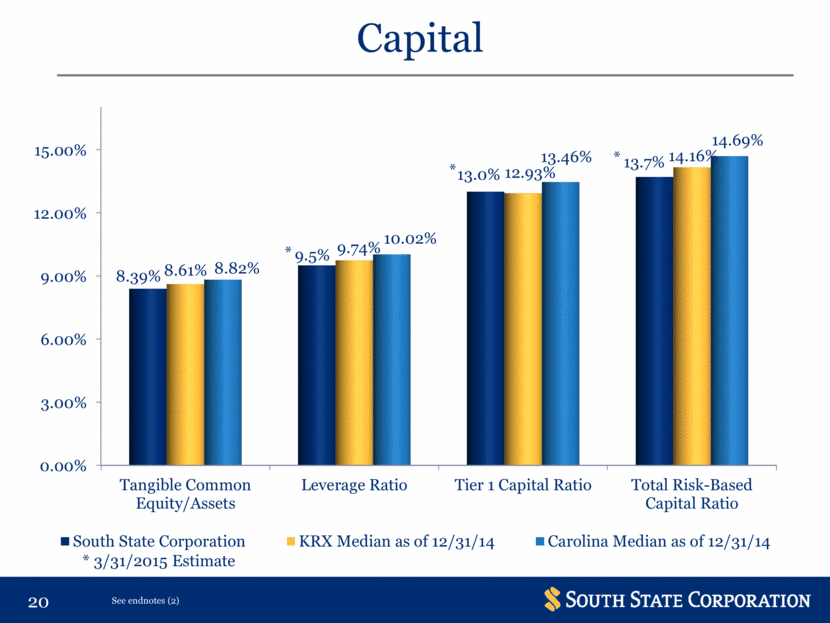
Capital See endnotes (2) * 3/31/2015 Estimate * * * |
|
|
PROFITABILITY |
|
|
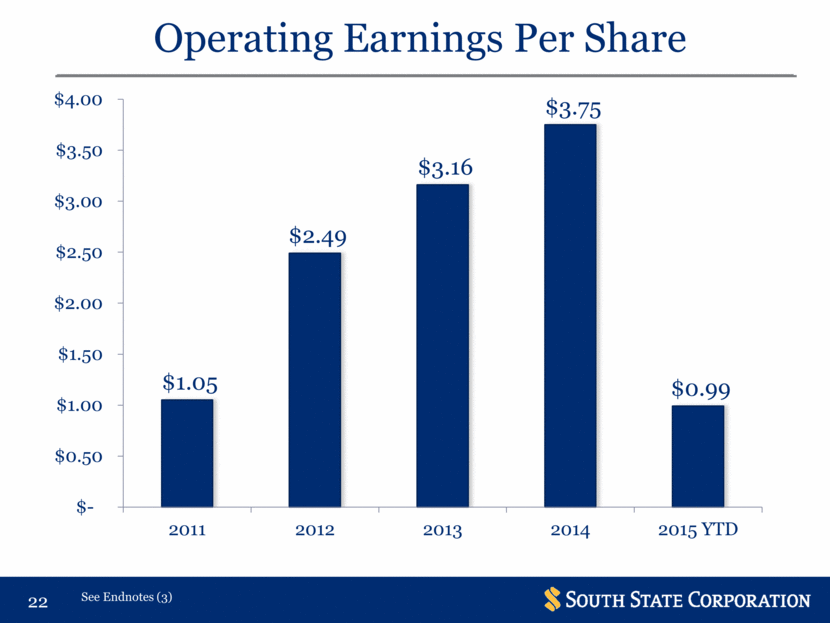
Operating Earnings Per Share See Endnotes (3) |
|
|
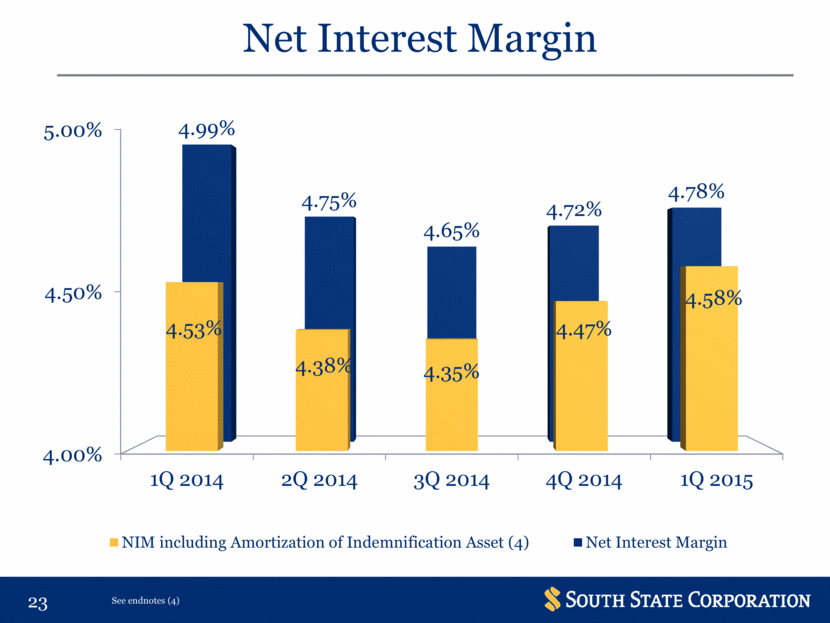
Net Interest Margin See endnotes (4) |
|
|
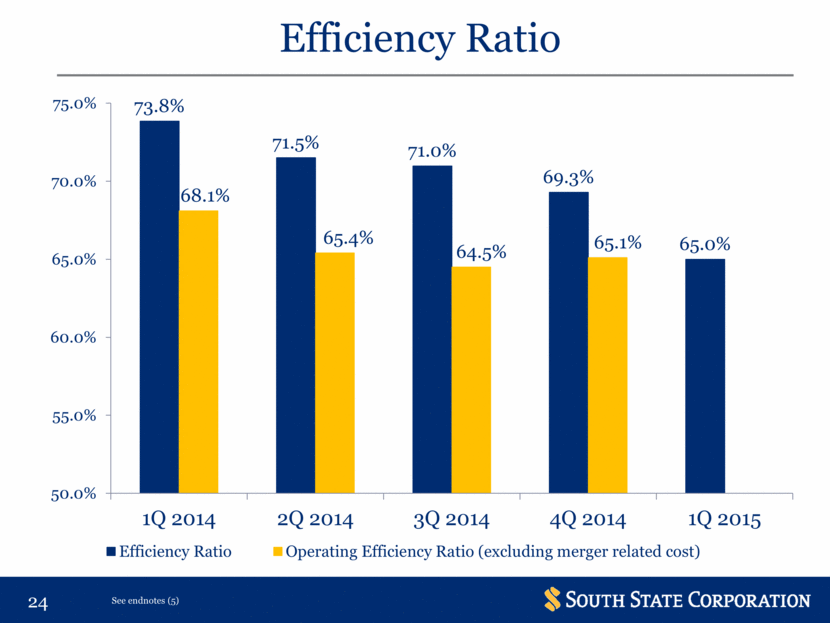
Efficiency Ratio See endnotes (5) |
|
|
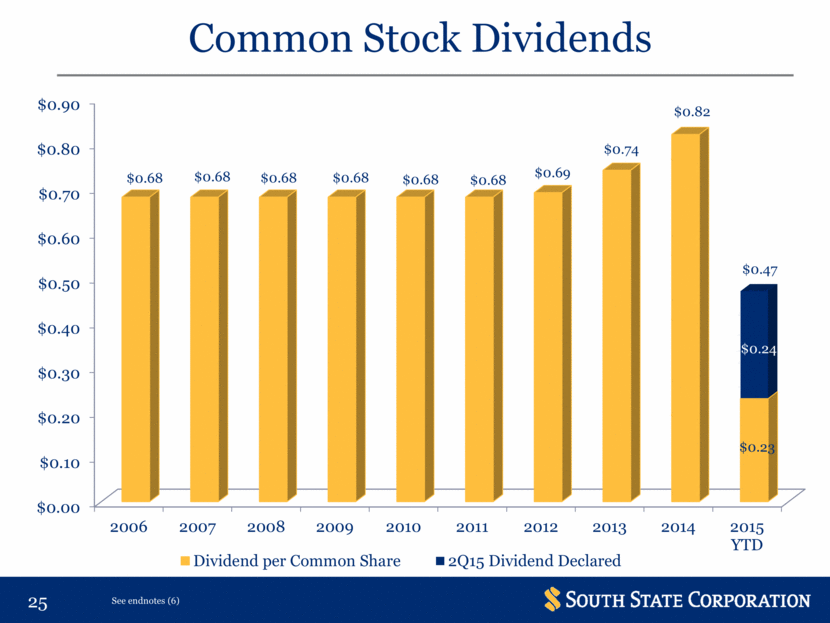
Common Stock Dividends See endnotes (6) $0.47 |
|
|
GROWTH |

|
|
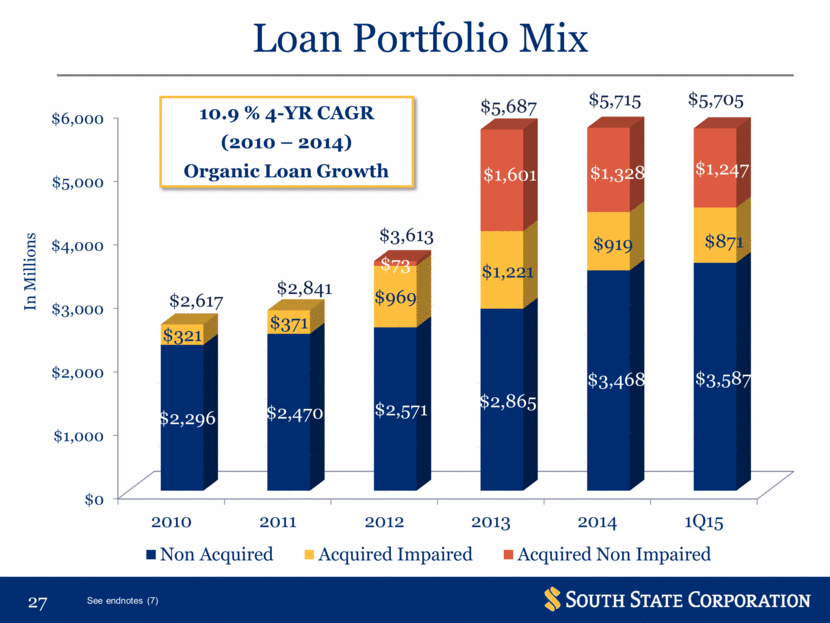
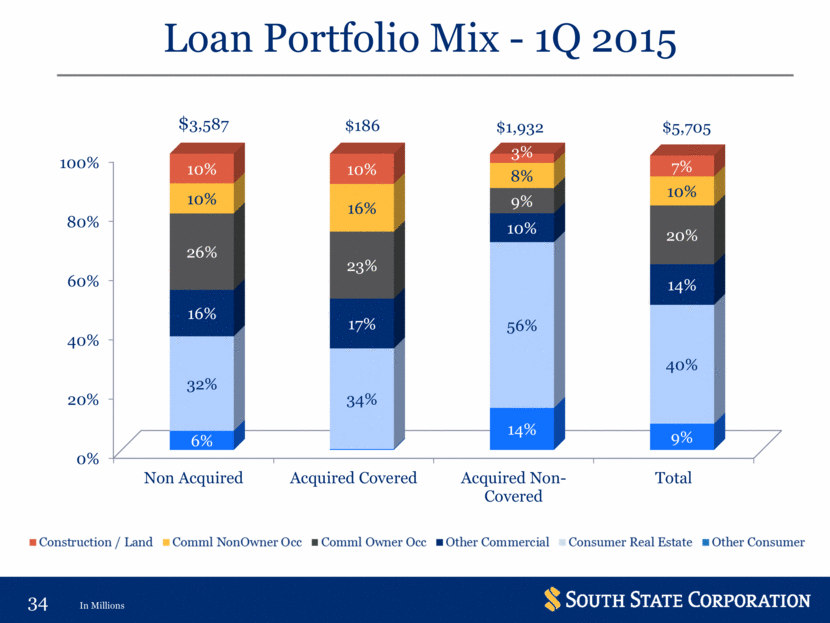
Loan Portfolio Mix In Millions $2,617 $2,841 $3,613 $5,687 $5,715 See endnotes (7) $5,705 |
|
|
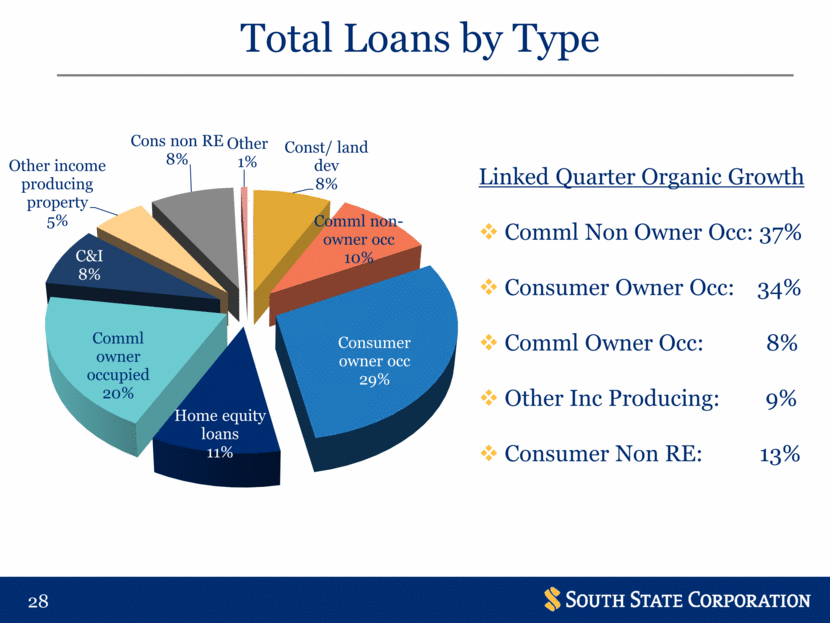
Total Loans by Type Linked Quarter Organic Growth Comml Non Owner Occ: 37% Consumer Owner Occ: 34% Comml Owner Occ: 8% Other Inc Producing: 9% Consumer Non RE: 13% |
|
|
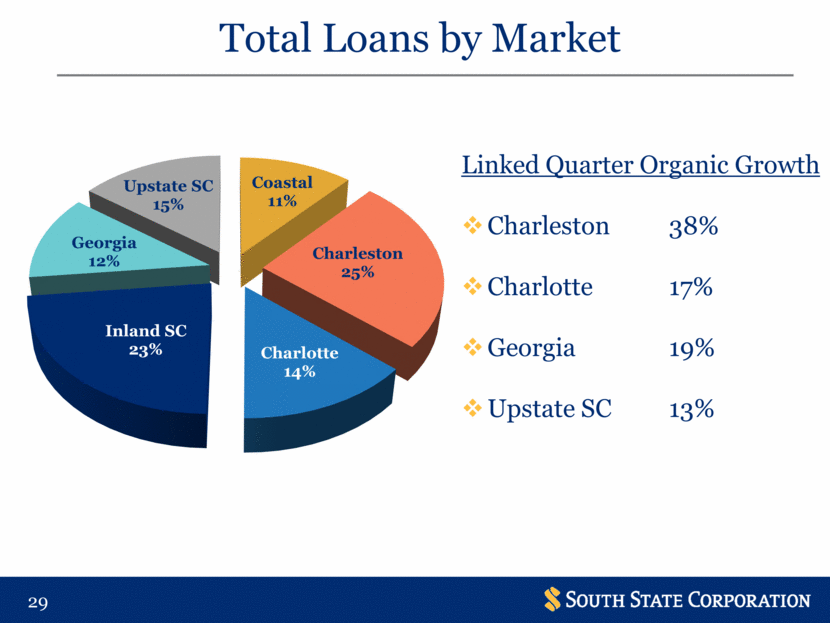
Total Loans by Market Linked Quarter Organic Growth Charleston 38% Charlotte 17% Georgia 19% Upstate SC 13% |
|
|
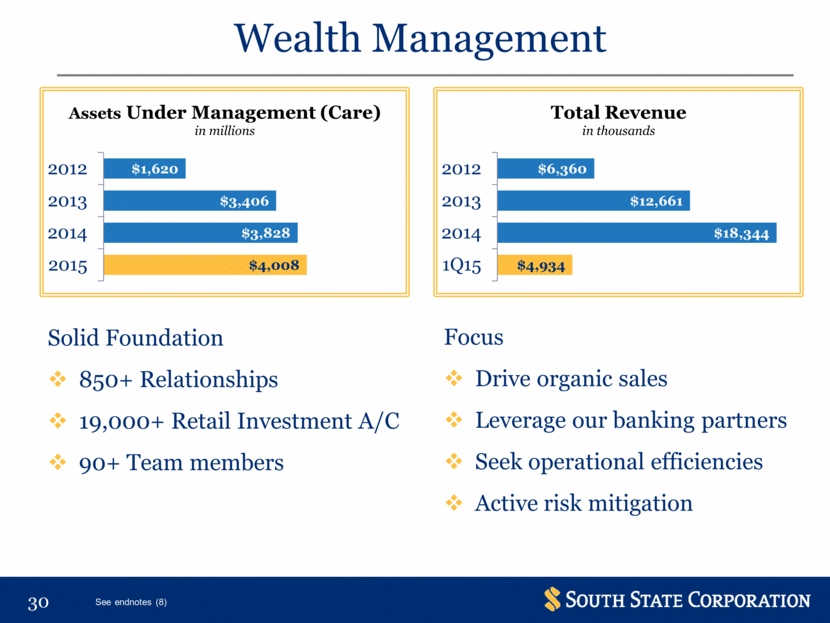
Wealth Management Solid Foundation 850+ Relationships 19,000+ Retail Investment A/C 90+ Team members Focus Drive organic sales Leverage our banking partners Seek operational efficiencies Active risk mitigation See endnotes (8) $4,008 $3,828 $3,406 $1,620 2015 2014 2013 2012 Assets Under Management (Care) in millions $4,934 $18,344 $12,661 $6,360 1Q15 2014 2013 2012 Total Revenue in thousands |
|
|
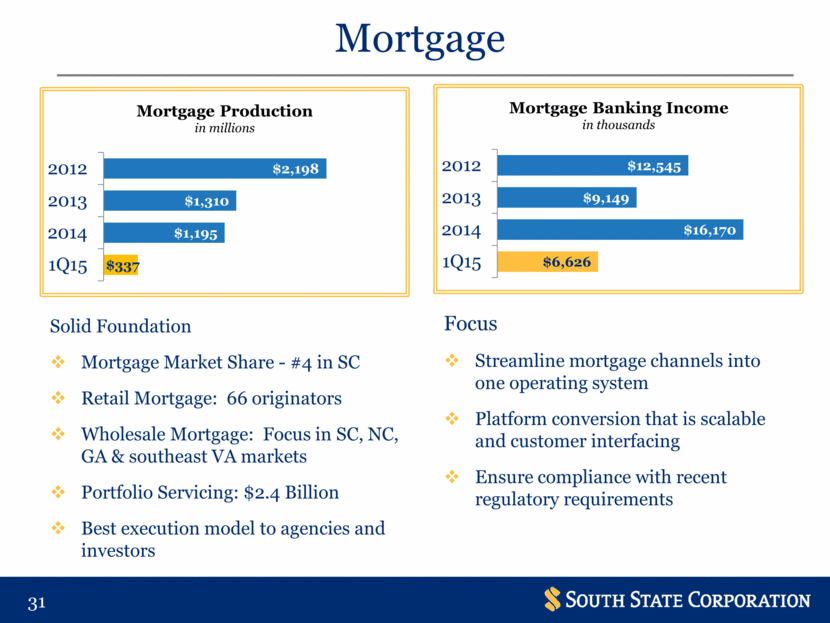
Solid Foundation Mortgage Market Share - #4 in SC Retail Mortgage: 66 originators Wholesale Mortgage: Focus in SC, NC, GA & southeast VA markets Portfolio Servicing: $2.4 Billion Best execution model to agencies and investors Mortgage Focus Streamline mortgage channels into one operating system Platform conversion that is scalable and customer interfacing Ensure compliance with recent regulatory requirements $337 $1,195 $1,310 $2,198 1Q15 2014 2013 2012 Mortgage Production in millions $6,626 $16,170 $9,149 $12,545 1Q15 2014 2013 2012 Mortgage Banking Income in thousands |
|
|
Supplemental |

|
|
Index Supplemental Information Loan Portfolio Mix .. 34 Investment Portfolio 35 Revenue Diversification .36 M&A/Asset Growth 37 Market Demographics .....38 Analyst Recommendations ......50 |
|
|
Loan Portfolio Mix - 1Q 2015 $186 $1,932 $5,705 In Millions |
|
|
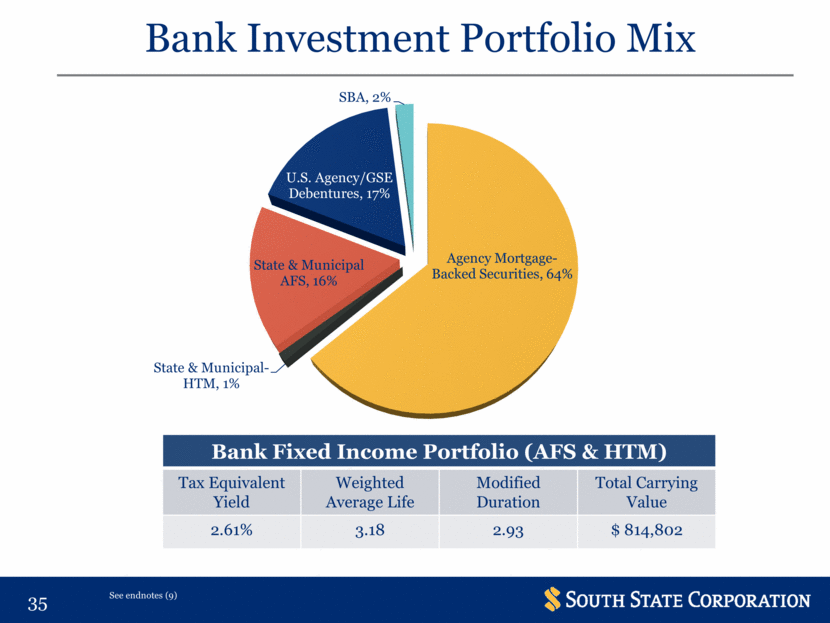
Bank Investment Portfolio Mix Bank Fixed Income Portfolio (AFS & HTM) Tax Equivalent Yield Weighted Average Life Modified Duration Total Carrying Value 2.61% 3.18 2.93 $ 814,802 See endnotes (9) |
|
|
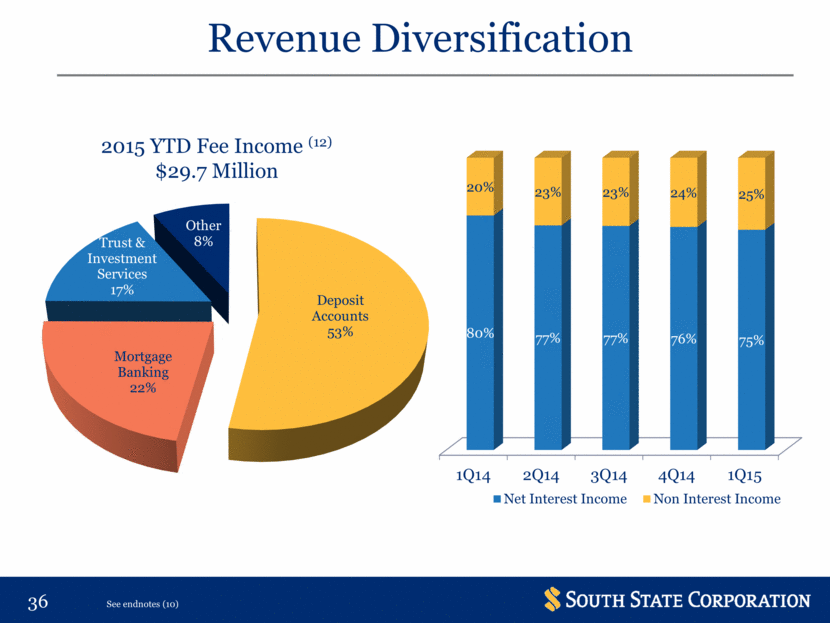
Revenue Diversification 2015 YTD Fee Income (12) $29.7 Million See endnotes (10) 1Q14 2Q14 3Q14 4Q14 1Q15 80% 77% 77% 76% 75% 20% 23% 23% 24% 25% Net Interest Income Non Interest Income |
|
|
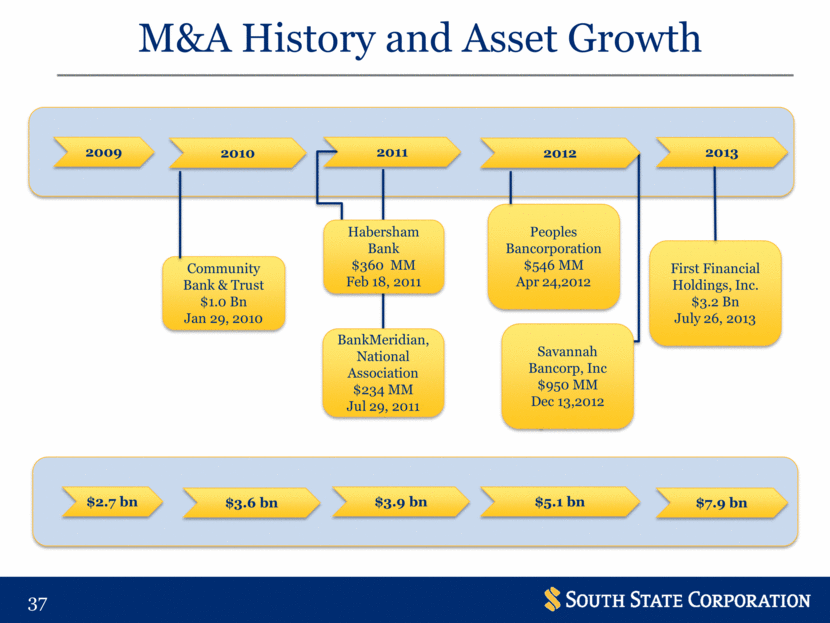
M&A History and Asset Growth 2009 2010 2011 2012 $2.7 bn $3.6 bn $3.9 bn $5.1 bn 2013 $7.9 bn Community Bank & Trust $1.0 Bn Jan 29, 2010 Habersham Bank $360 MM Feb 18, 2011 BankMeridian, National Association $234 MM Jul 29, 2011 Peoples Bancorporation $546 MM Apr 24,2012 Savannah Bancorp, Inc $950 MM Dec 13,2012 First Financial Holdings, Inc. $3.2 Bn July 26, 2013 |
|
|
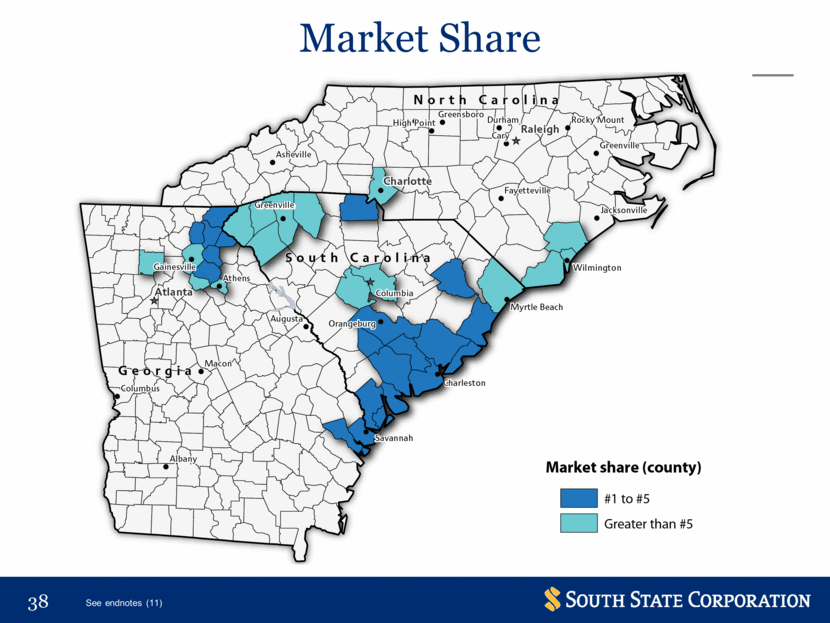
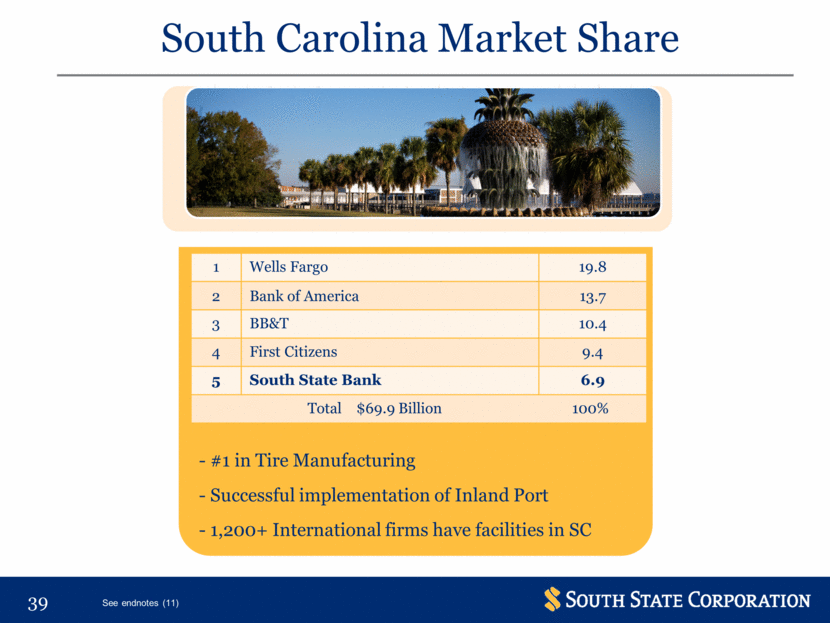
Market Share See endnotes (11) |
|
|
1 Wells Fargo 19.8 2 Bank of America 13.7 3 BB&T 10.4 4 First Citizens 9.4 5 South State Bank 6.9 Total $69.9 Billion 100% See endnotes (11) South Carolina Market Share - #1 in Tire Manufacturing - Successful implementation of Inland Port - 1,200+ International firms have facilities in SC |
|
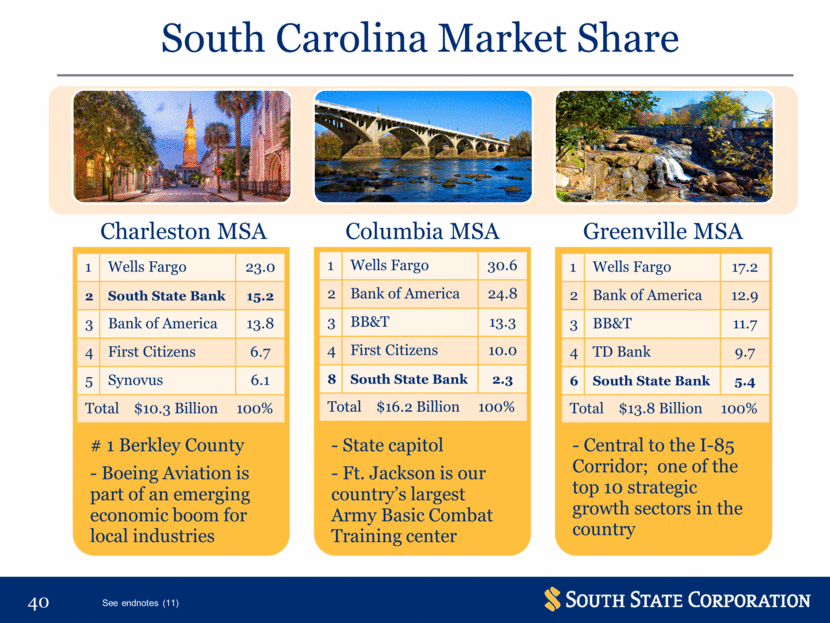
|
South Carolina Market Share Charleston MSA Columbia MSA Greenville MSA 1 Wells Fargo 23.0 2 South State Bank 15.2 3 Bank of America 13.8 4 First Citizens 6.7 5 Synovus 6.1 Total $10.3 Billion 100% 1 Wells Fargo 30.6 2 Bank of America 24.8 3 BB&T 13.3 4 First Citizens 10.0 8 South State Bank 2.3 Total $16.2 Billion 100% 1 Wells Fargo 17.2 2 Bank of America 12.9 3 BB&T 11.7 4 TD Bank 9.7 6 South State Bank 5.4 Total $13.8 Billion 100% See endnotes (11) # 1 Berkley County - Boeing Aviation is part of an emerging economic boom for local industries - State capitol - Ft. Jackson is our country’s largest Army Basic Combat Training center - Central to the I-85 Corridor; one of the top 10 strategic growth sectors in the country |
|
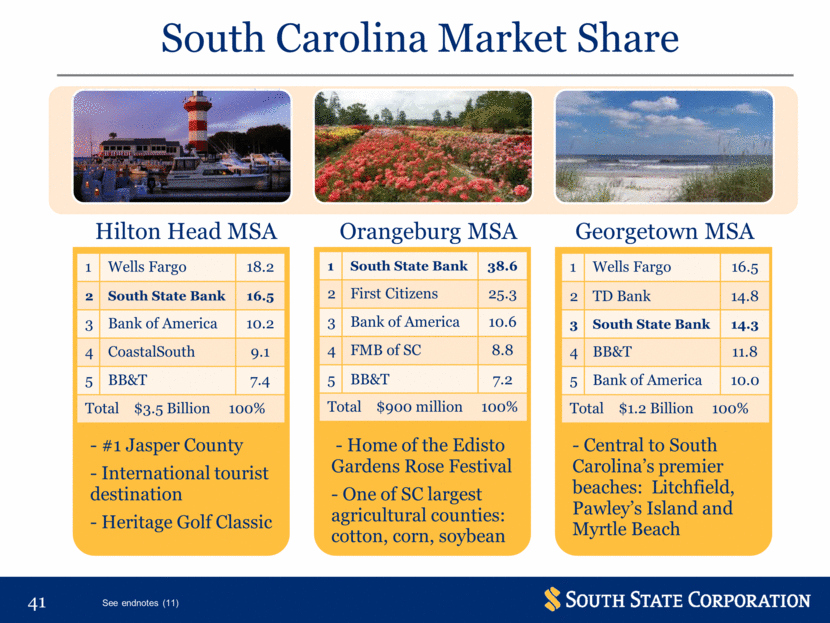
|
South Carolina Market Share Hilton Head MSA Orangeburg MSA Georgetown MSA 1 Wells Fargo 18.2 2 South State Bank 16.5 3 Bank of America 10.2 4 CoastalSouth 9.1 5 BB&T 7.4 Total $3.5 Billion 100% 1 South State Bank 38.6 2 First Citizens 25.3 3 Bank of America 10.6 4 FMB of SC 8.8 5 BB&T 7.2 Total $900 million 100% 1 Wells Fargo 16.5 2 TD Bank 14.8 3 South State Bank 14.3 4 BB&T 11.8 5 Bank of America 10.0 Total $1.2 Billion 100% See endnotes (11) - #1 Jasper County - International tourist destination - Heritage Golf Classic - Home of the Edisto Gardens Rose Festival - One of SC largest agricultural counties: cotton, corn, soybean - Central to South Carolina’s premier beaches: Litchfield, Pawley’s Island and Myrtle Beach |
|
|
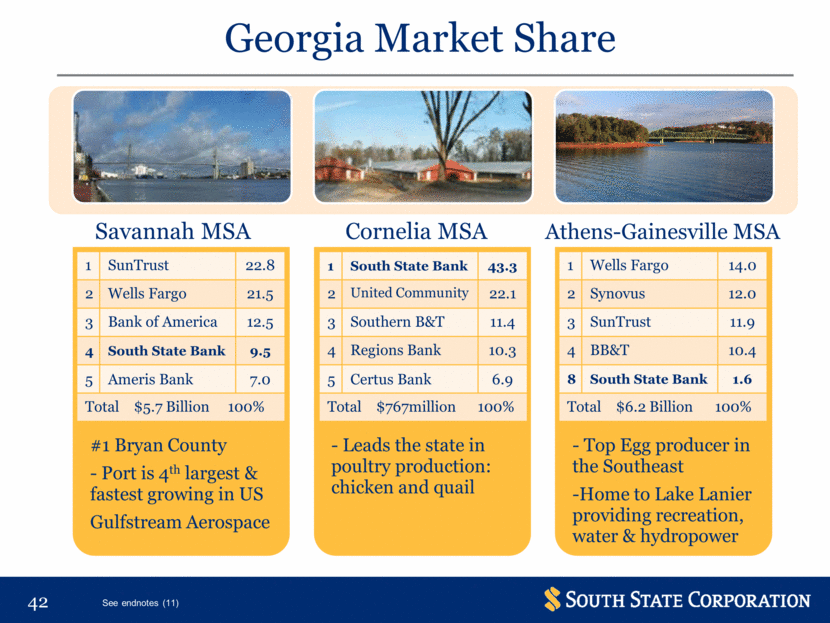
Georgia Market Share Savannah MSA Cornelia MSA Athens-Gainesville MSA 1 South State Bank 43.3 2 United Community 22.1 3 Southern B&T 11.4 4 Regions Bank 10.3 5 Certus Bank 6.9 Total $767million 100% See endnotes (11) 1 SunTrust 22.8 2 Wells Fargo 21.5 3 Bank of America 12.5 4 South State Bank 9.5 5 Ameris Bank 7.0 Total $5.7 Billion 100% 1 Wells Fargo 14.0 2 Synovus 12.0 3 SunTrust 11.9 4 BB&T 10.4 8 South State Bank 1.6 Total $6.2 Billion 100% #1 Bryan County - Port is 4th largest & fastest growing in US Gulfstream Aerospace - Leads the state in poultry production: chicken and quail - Top Egg producer in the Southeast -Home to Lake Lanier providing recreation, water & hydropower |
|
|
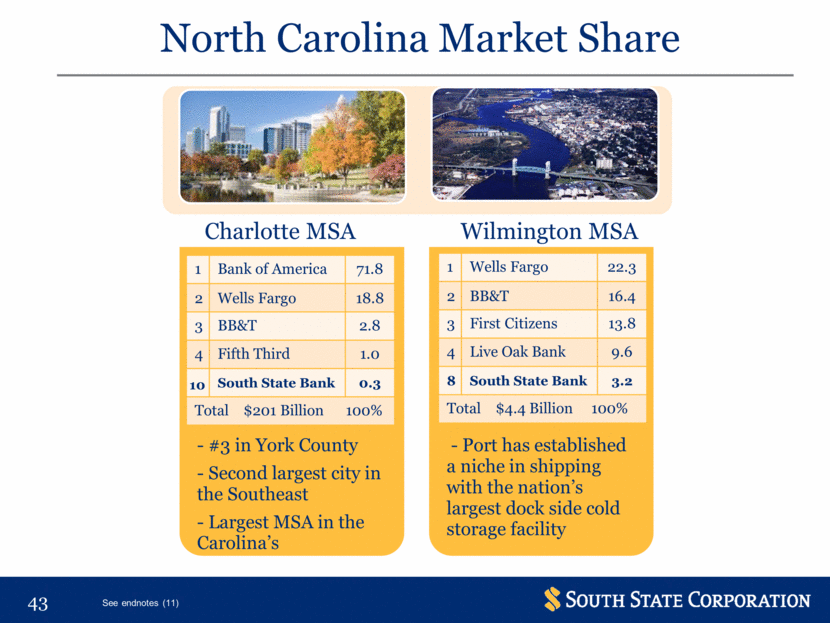
North Carolina Market Share Charlotte MSA Wilmington MSA 1 Wells Fargo 22.3 2 BB&T 16.4 3 First Citizens 13.8 4 Live Oak Bank 9.6 8 South State Bank 3.2 Total $4.4 Billion 100% See endnotes (11) 1 Bank of America 71.8 2 Wells Fargo 18.8 3 BB&T 2.8 4 Fifth Third 1.0 South State Bank 0.3 Total $201 Billion 100% 10 - #3 in York County - Second largest city in the Southeast - Largest MSA in the Carolina’s - Port has established a niche in shipping with the nation’s largest dock side cold storage facility |
|
|
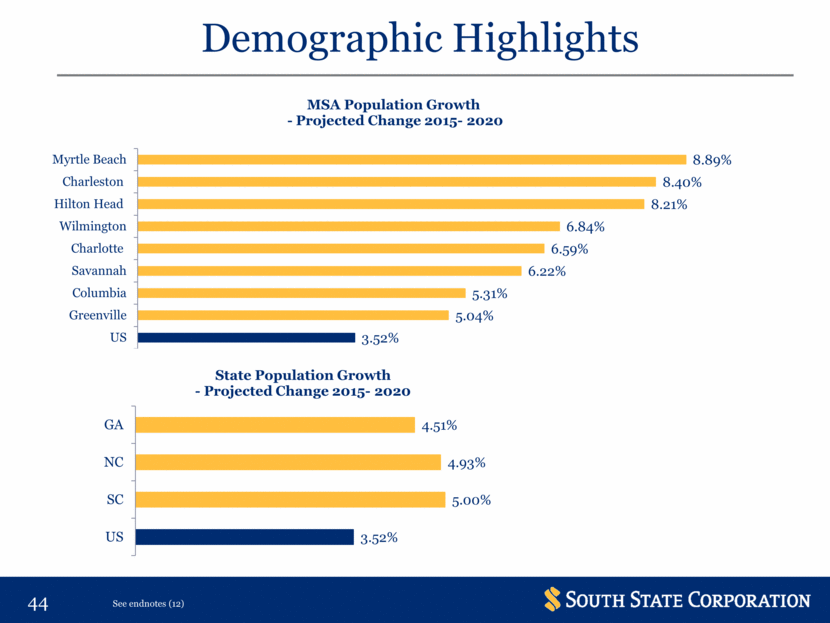
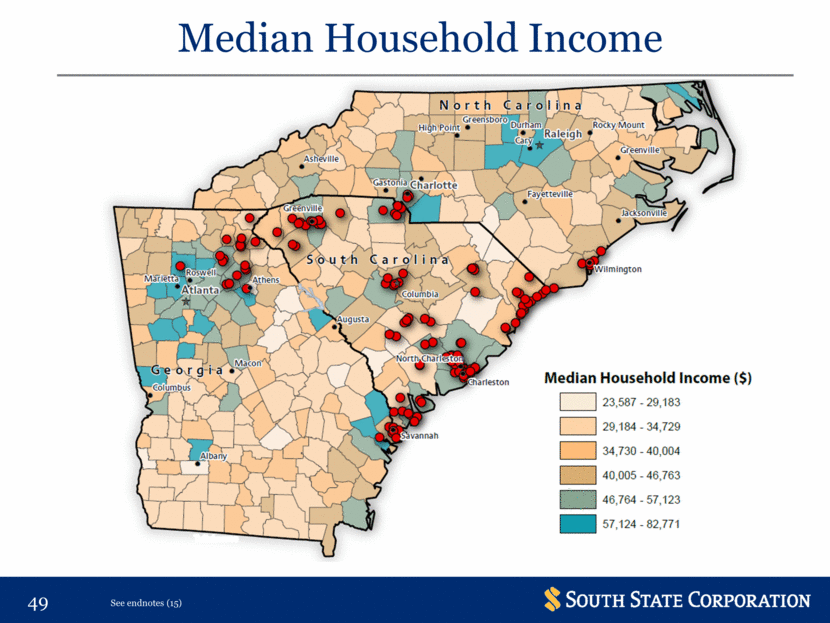
Demographic Highlights See endnotes (12) 3.52% 5.00% 4.93% 4.51% US SC NC GA State Population Growth - Projected Change 2015 - 2020 3.52% 5.04% 5.31% 6.22% 6.59% 6.84% 8.21% 8.40% 8.89% US Greenville Columbia Savannah Charlotte Wilmington Hilton Head Charleston Myrtle Beach MSA Population Growth - Projected Change 2015 - 2020 |
|
|
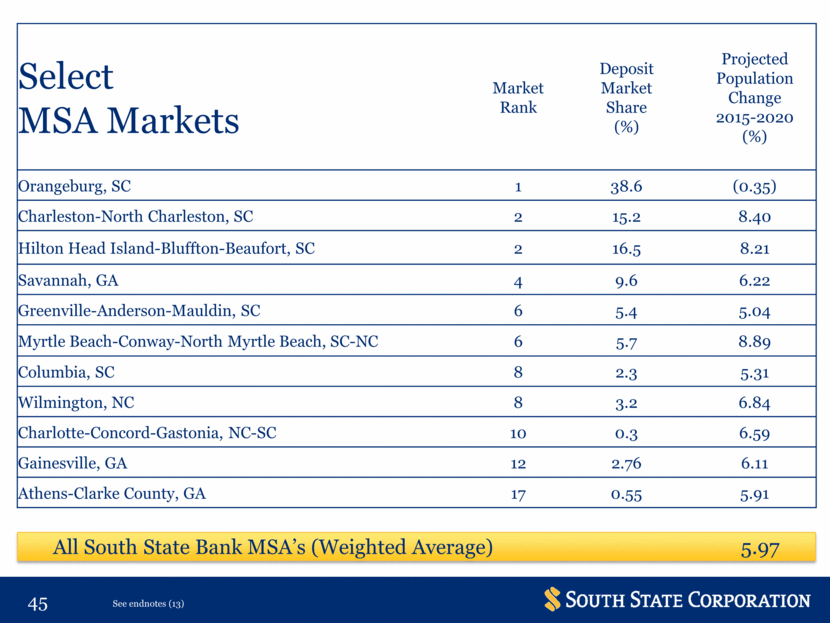
Select MSA Markets Market Rank Deposit Market Share (%) Projected Population Change 2015-2020 (%) Orangeburg, SC 1 38.6 (0.35) Charleston-North Charleston, SC 2 15.2 8.40 Hilton Head Island-Bluffton-Beaufort, SC 2 16.5 8.21 Savannah, GA 4 9.6 6.22 Greenville-Anderson-Mauldin, SC 6 5.4 5.04 Myrtle Beach-Conway-North Myrtle Beach, SC-NC 6 5.7 8.89 Columbia, SC 8 2.3 5.31 Wilmington, NC 8 3.2 6.84 Charlotte-Concord-Gastonia, NC-SC 10 0.3 6.59 Gainesville, GA 12 2.76 6.11 Athens-Clarke County, GA 17 0.55 5.91 See endnotes (13) All South State Bank MSA’s (Weighted Average) 5.97 |
|
|
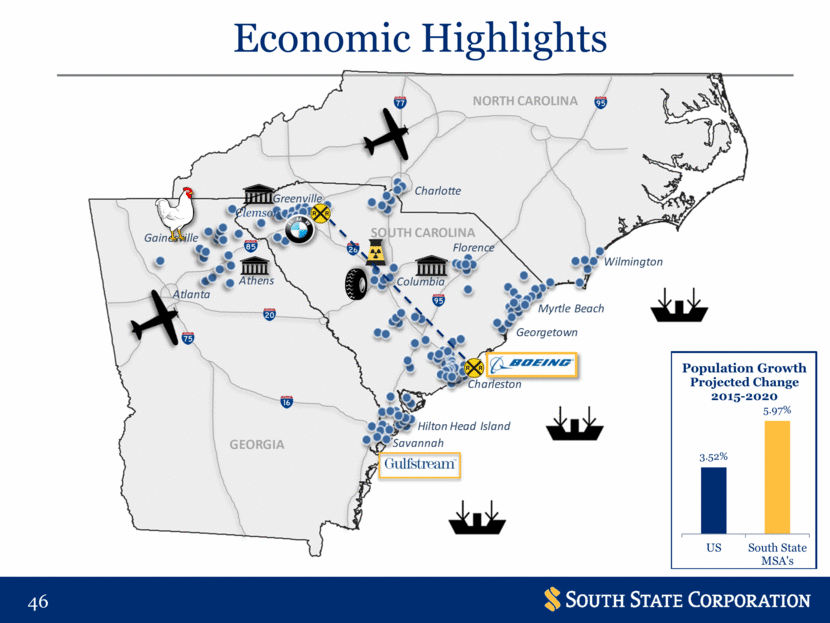
Economic Highlights Clemson 3.52% 5.97% US South State MSA's Population Growth Projected Change 2015 - 2020 |
|
|
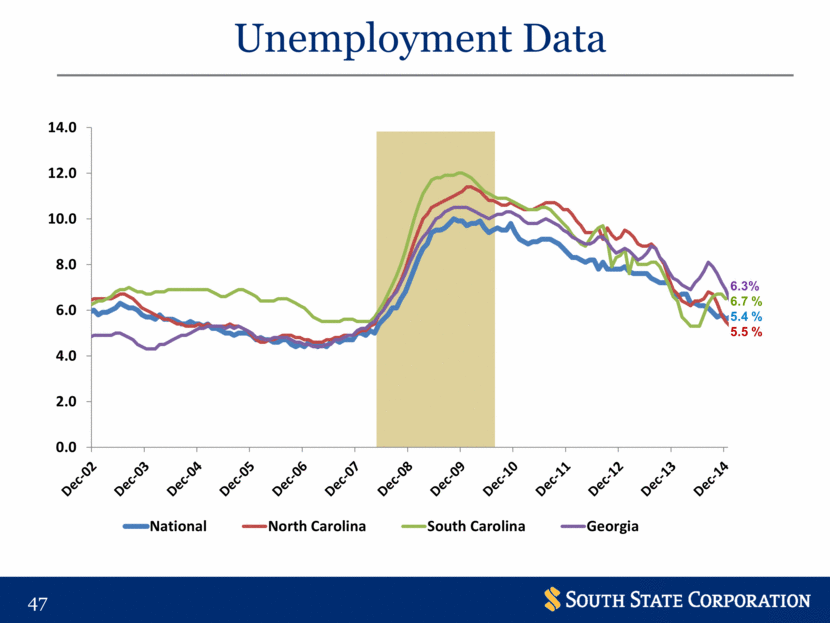
Unemployment Data 0.0 2.0 4.0 6.0 8.0 10.0 12.0 14.0 National North Carolina South Carolina Georgia 6.3% 6.7 % 5.4 % 5.5 % |
|
|
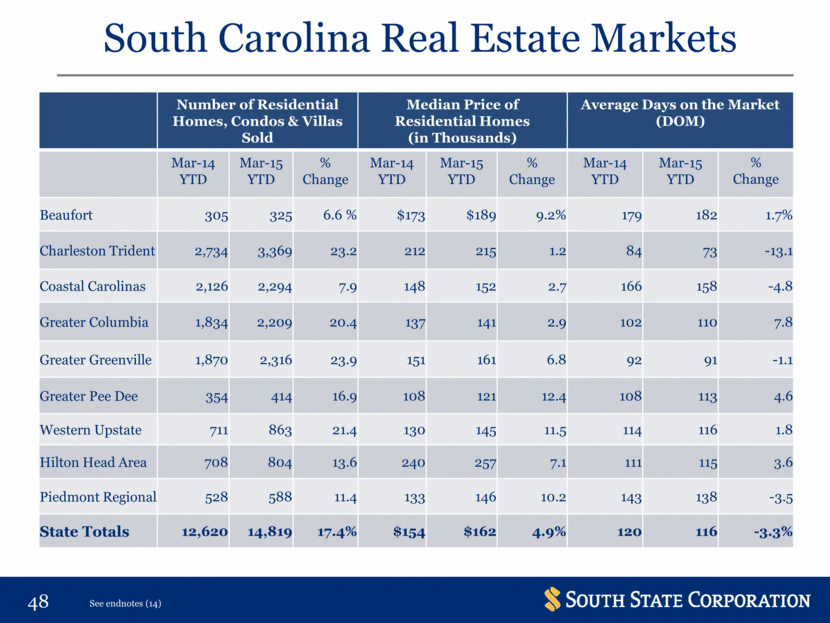
South Carolina Real Estate Markets Number of Residential Homes, Condos & Villas Sold Median Price of Residential Homes (in Thousands) Average Days on the Market (DOM) Mar-14 YTD Mar-15 YTD % Change Mar-14 YTD Mar-15 YTD % Change Mar-14 YTD Mar-15 YTD % Change Beaufort 305 325 6.6 % $173 $189 9.2% 179 182 1.7% Charleston Trident 2,734 3,369 23.2 212 215 1.2 84 73 -13.1 Coastal Carolinas 2,126 2,294 7.9 148 152 2.7 166 158 -4.8 Greater Columbia 1,834 2,209 20.4 137 141 2.9 102 110 7.8 Greater Greenville 1,870 2,316 23.9 151 161 6.8 92 91 -1.1 Greater Pee Dee 354 414 16.9 108 121 12.4 108 113 4.6 Western Upstate 711 863 21.4 130 145 11.5 114 116 1.8 Hilton Head Area 708 804 13.6 240 257 7.1 111 115 3.6 Piedmont Regional 528 588 11.4 133 146 10.2 143 138 -3.5 State Totals 12,620 14,819 17.4% $154 $162 4.9% 120 116 -3.3% See endnotes (14) |
|
|
Median Household Income See endnotes (15) |
|
|
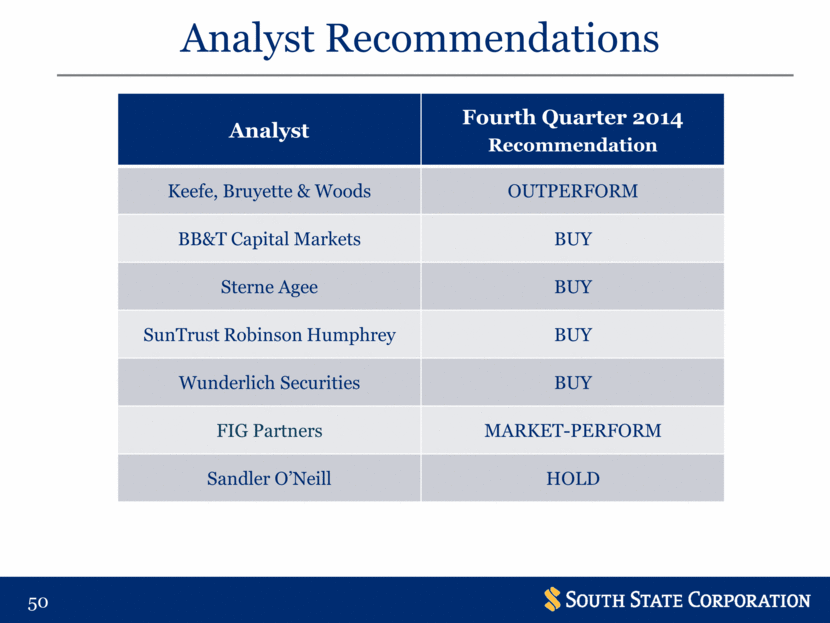
Analyst Recommendations Analyst Fourth Quarter 2014 Recommendation Keefe, Bruyette & Woods OUTPERFORM BB&T Capital Markets BUY Sterne Agee BUY SunTrust Robinson Humphrey BUY Wunderlich Securities BUY FIG Partners MARKET-PERFORM Sandler O’Neill HOLD |
|
|
Investor Contacts 520 Gervais Street Columbia, South Carolina 29201 800-277-2175 www.southstatebank.com Robert R. Hill, Jr. Chief Executive Officer John C. Pollok Senior Executive Vice President and Chief Financial Officer / Chief Operating Officer |
|
|
Endnotes Source: SNL Financial. Pricing performance show from 12/31/09 -4/22/15. Peers include all major exchange traded banks headquartered in North or South Carolina with total assets between $500 million and $10.0 billion. Georgia peers include all major exchange traded banks headquartered in Georgia with total assets between $500 million and $10.0 billion; excludes merger targets.(1)Total return includes distribution of dividends. Source: SNL Financial and Company filings. SSB, KRX Median and Carolina Median as of 12/31/2014. KRX is a composition of 50 regionally diversified mid- & small-cap banking institutions in the U.S. The index is calculated using an equal-weighted method and components comply with the GICS and ICS classification standards. Carolina’s includes all publicly traded banks and thrifts in North and South Carolina with assets between $500 million and $10.0 billion. SSB credit quality ratios exclude acquired loans. Excludes Merger Expenses & Securities (Gains) Losses. 2011 also excludes FDIC acquisition gains Income reduced by amortization of Indemnification Asset and average balance increased for the average loan Indemnification Asset balance Efficiency ratio = NIE / Net Interest Income + Non Interest Income less securities gain/(loss). Operating efficiency ratio (exc’l) = same as above except excludes merger cost from NIE Dividend paid for 156 consecutive quarters since 1976, Prior to 1976, dividends were paid semi-annually. 2Q 2015 dividend declared 4/28/2015, with a record date of 05/22/2015, and payable 5/29/2015. Acquired loans are net of purchase accounting adjustments. Relationships include our respective divisions: Trust Asset Management, Minis & Company, American Pensions Fair value for AFS securities; amortized/accreted cost for HTM securities. Does not include : FHLB stock, Corporate stocks held at BHC of banks, or investment in unconsolidated subsidiaries. Total Income= Net Interest Income + Noninterest Income (excluding negative accretion of indemnification asset and securities gains (losses). Fees generated from services provided by SSB. Source: SNL deposit data as of June 30, 2014 Source: SNL Financial, Demographic Data pulled on 4/23/2015 Source: SNL Financial Source: Rates from S.C. Realtors MLS Stats Source: SNL, Projected 2014 |