Attached files
| file | filename |
|---|---|
| 8-K - CURRENT REPORT - MUTUALFIRST FINANCIAL INC | v409354_8k.htm |
| EX-99.2 - PRESS RELEASE - MUTUALFIRST FINANCIAL INC | v409354_ex99-2.htm |
Exhibit 99.1

2015 Annual Meeting
FORWARD LOOKING STATEMENT This presentation contains statements which constitute forward looking statements within the meaning of the Private Securities Litigation Reform Act of 1995. These statements may appear in a number of places in this presentation and include statements regarding the intent, belief, outlook, estimate or expectations of the company, its directors or its officers primarily with respect to future events and the future financial performance of the company, including but not limited to preliminary estimated ProForma combined financial information. Readers of this presentation are cautioned that any such forward looking statements are not guarantees of future events or performance and involve risk and uncertainties, and that actual results may differ materially from those in the forward looking statements as a result of various factors. These factors include, but are not limited to, the loss of deposits and loan demand to competitors; substantial changes in financial markets; changes in real estate values and the real estate market; regulatory changes; or other risk factors discussed in the latest SEC form 10 - k. The Company does not undertake – and specifically disclaims any obligation – to publicly release the result of any revisions which may be made to any forward - looking statements to reflect events or circumstances after the date of such statements or to reflect the occurrence of anticipated or unanticipated events.
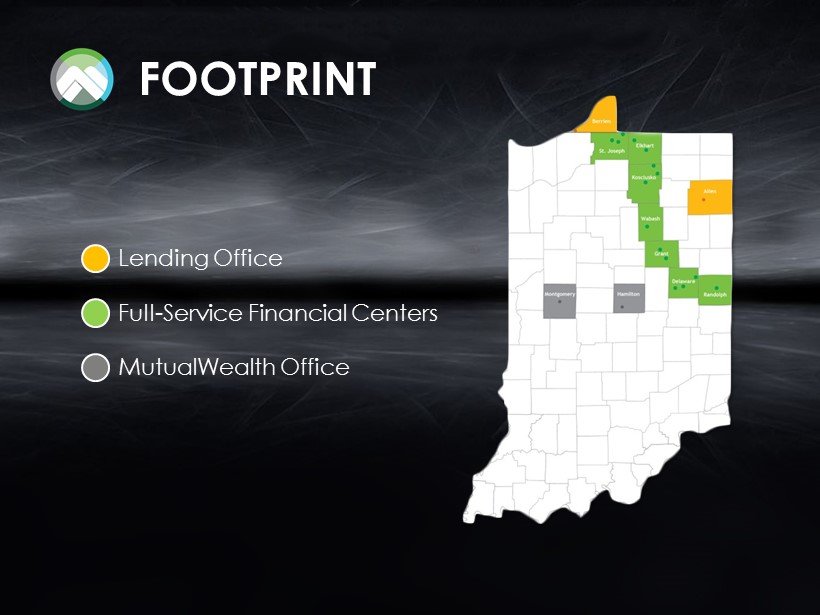
FOOTPRINT Lending Office MutualWealth Office Full - Service Financial Centers
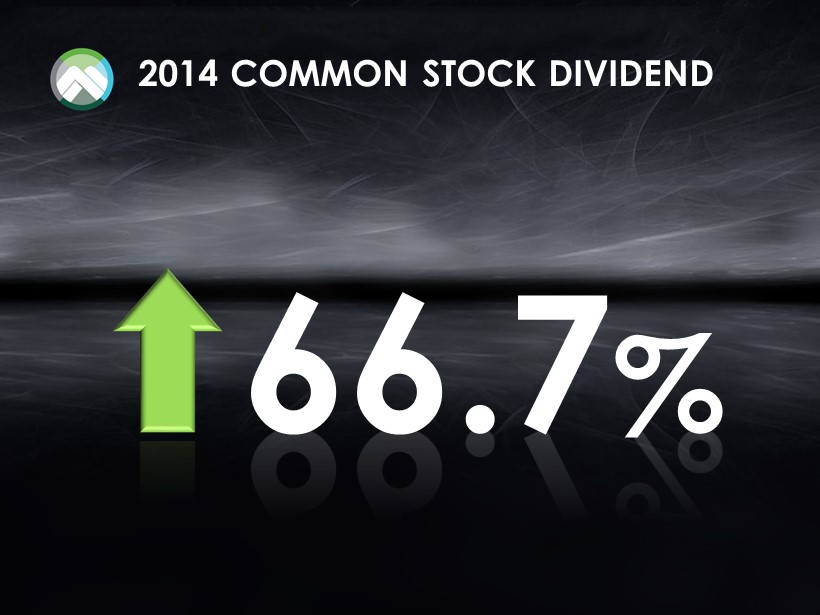
2014 COMMON STOCK DIVIDEND 66.7 %

2014 CONSUMER LOAN GROWTH 14.6 %

2014 COMMERCIAL LOAN GROWTH 10.4 %
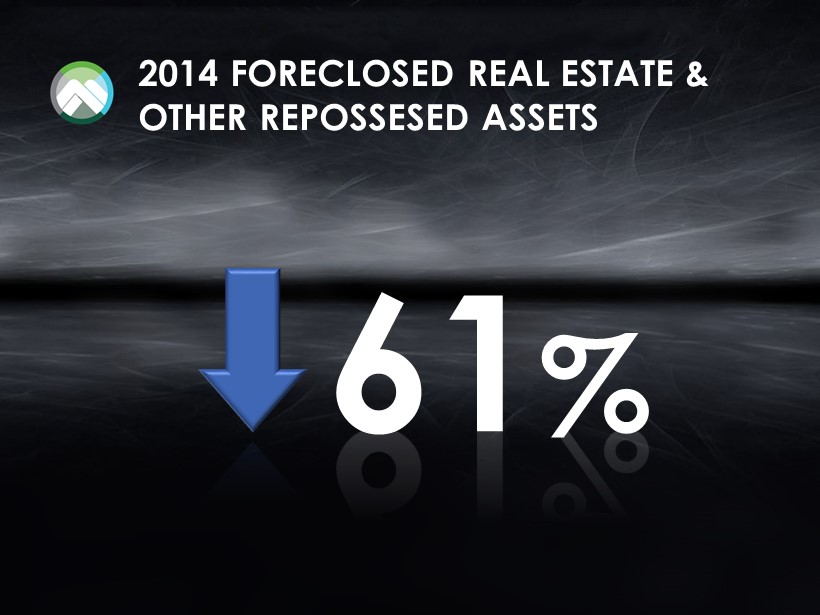
2014 FORECLOSED REAL ESTATE & OTHER REPOSSESED ASSETS 61 %

2014 NET CHARGE OFFS .11 %
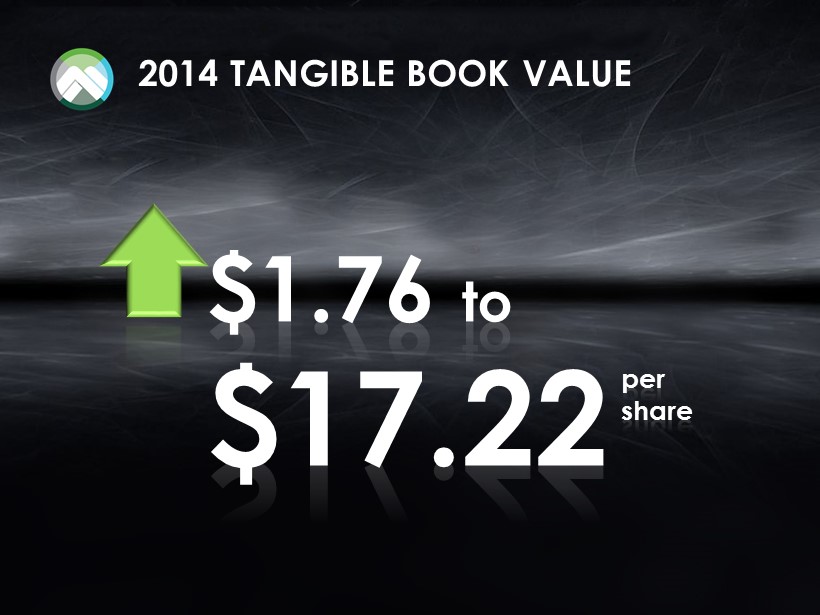
2014 TANGIBLE BOOK VALUE $ 1.76 to $17.22 per share

2014 ACQUISITIONS Completed two acquisitions that enhance non - interest income

MOMENTUM (YEAR - END) 2011 2012 2013 2014 ROA 0.24% 0.50% 0.66% 0.77% ROE 1.39% 5.47% 7.42% 9.37% Margin 3.16% 3.05% 3.13% 3.26% TCE 7.05% 7.62% 7.91% 8.68% Diluted EPS $0.20 $0.82 $1.09 $1.46 4th Quarter Dividend $0.06 $0.06 $0.06 $0.10 Stock Price $7.07 $11.43 $17.13 $21.88 TBV $14.38 $15.33 $15.46 $17.22 NPA 2.75% 2.21% 1.22% 0.75%
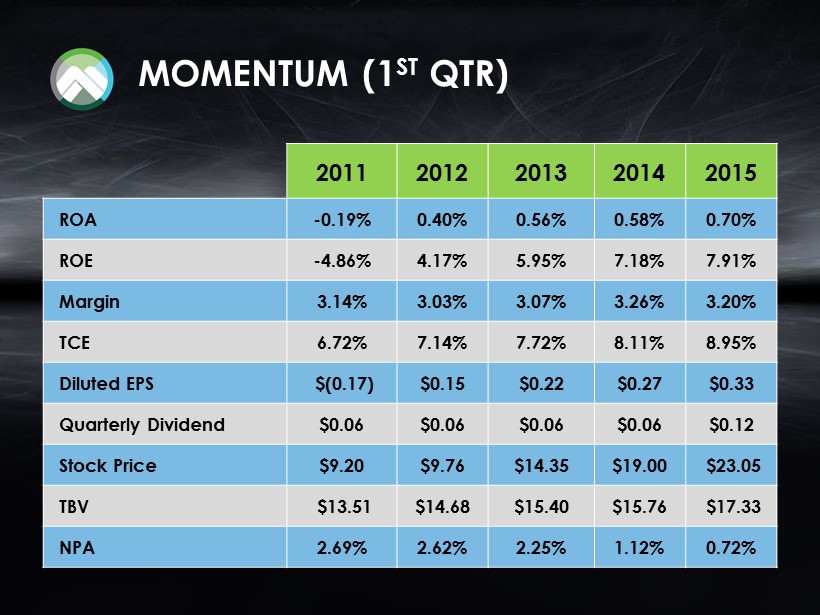
MOMENTUM (1 ST QTR) 2011 2012 2013 2014 2015 ROA - 0.19% 0.40% 0.56% 0.58% 0.70% ROE - 4.86% 4.17% 5.95% 7.18% 7.91% Margin 3.14% 3.03% 3.07% 3.26% 3.20% TCE 6.72% 7.14% 7.72% 8.11% 8.95% Diluted EPS $( 0.17) $0.15 $0.22 $0.27 $0.33 Quarterly Dividend $0.06 $0.06 $0.06 $0.06 $0.12 Stock Price $9.20 $9.76 $14.35 $19.00 $23.05 TBV $13.51 $14.68 $15.40 $15.76 $17.33 NPA 2.69% 2.62% 2.25% 1.12% 0.72%
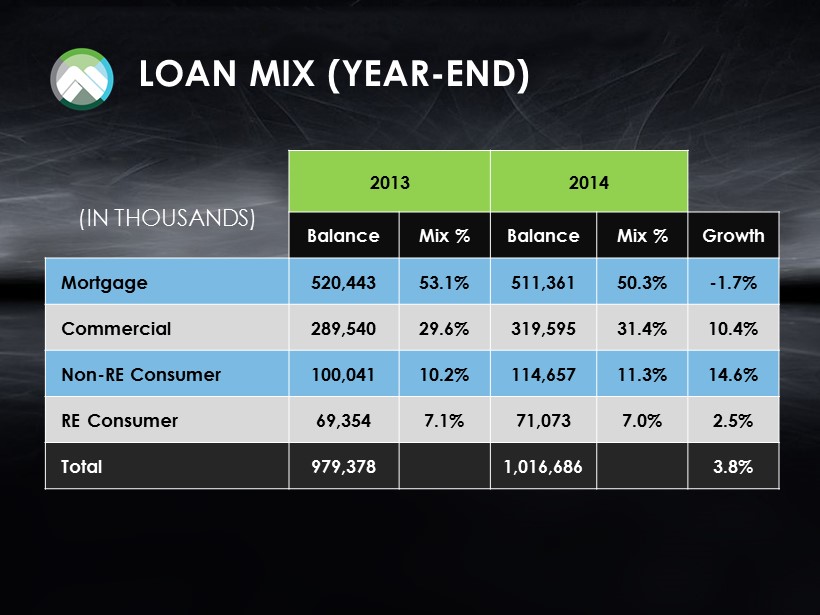
LOAN MIX (YEAR - END) (IN THOUSANDS) 2013 2014 Balance Mix % Balance Mix % Growth Mortgage 520,443 53.1% 511,361 50.3% - 1.7% Commercial 289,540 29.6% 319,595 31.4% 10.4% Non - RE Consumer 100,041 10.2% 114,657 11.3% 14.6% RE Consumer 69,354 7.1% 71,073 7.0% 2.5% Total 979,378 1,016,686 3.8%

LOAN MIX (1 st QTR) (IN THOUSANDS) 2014 2015 Balance Mix % Balance Mix % Growth Mortgage 515,819 52.8% 506,746 49.5% - 1.8% Commercial 291,407 29.8% 326,511 31.9% 12.0% Non - RE Consumer 101,706 10.4% 120,679 11.8% 18.7% RE Consumer 68,917 7.0% 69,671 6.8% 1.1% Total 977,849 1,023,607 4.7%

DEPOSIT MIX (YEAR - END) (IN THOUSANDS) 2013 2014 Balance Mix % Balance Mix % Growth Non - Interest Checking 144,195 14.7% 154,178 15.2% 6.9% Savings 119,380 12.2% 124,051 12.2% 3.9% Interest Bearing Checking 261,706 26.7% 253,041 24.9% - 3.3% Money Markets 115,924 11.8% 146,768 14.4% 26.6% Certificates 471,879 48.2% 401,281 39.5% - 15.0% Total 1,113,084 1,079,319 - 3.0%

DEPOSIT MIX (1 ST QTR) (IN THOUSANDS) 2014 2015 Balance Mix % Balance Mix % Growth Non - Interest Checking 148,856 15.2% 163,435 16.1% 9.8% Savings 126,794 12.9% 129,951 12.8% 2.5% Interest Bearing Checking 251,959 25.7% 254,142 25.0% 0.9% Money Markets 129,916 13.2% 148,576 14.6% 14.4% Certificates 447,436 45.6% 390,021 38.4% - 12.8% Total 1,104,961 1,086,125 - 1.7%

2015 - 2019 Strategic Plan Framework

Traction & Movement 2015 - 2019 is all about…

It’s the difference between moving forward and spinning our wheels. We could focus all we want on our processes, systems, and strategies, but if we don’t deliver the experience customers crave, we won’t get traction in our markets and won’t provide value to our stakeholders.
Our GPS
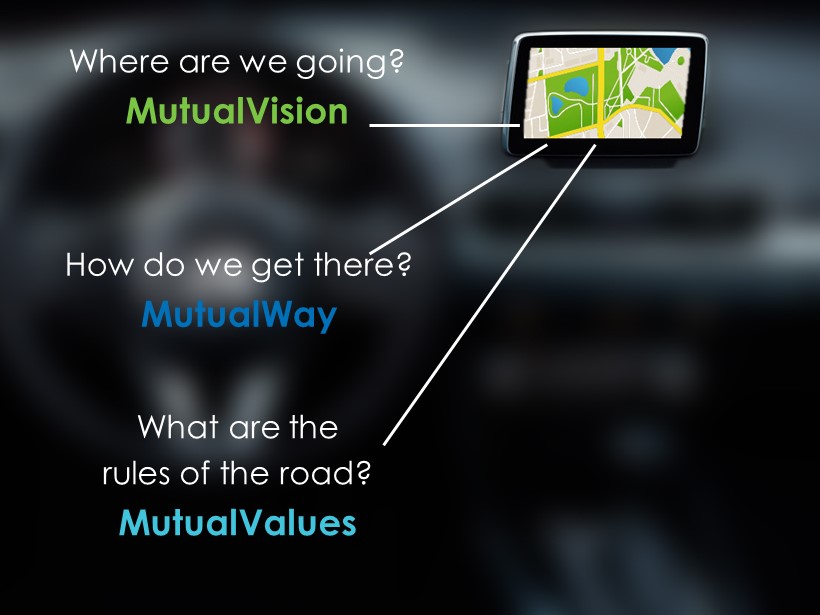
Where are we going? MutualVision How do we get there? MutualWay What are the rules of the road? MutualValues
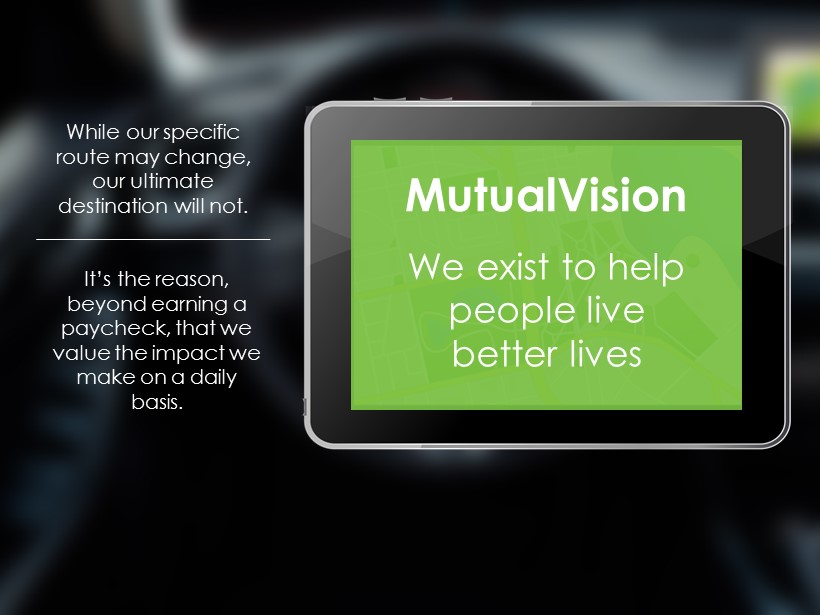
MutualVision We exist to help people live better lives It’s the reason, beyond earning a paycheck, that we value the impact we make on a daily basis. While our specific route may change, our ultimate destination will not.

MutualWay The MutualWay is the framework that encompasses all activities associated with accomplishing the MutualVision . It’s our roadmap that ensures value in the delivery of products and services to all internal & external clients. It requires the following in everything we do: • Quality • Consistency • Flexibility • Compliance Consideration that ALL of our stakeholders (Shareholders , Customers , Employees, and Communities) have a vested interest in our success Utilizing creativity and technology to deliver simple solutions to complex needs An understanding of what our clients value to determine the most effective and efficient process to deliver that value

MutualValues MutualValues are our rules of the road. They’re our cultural identity and are lived out by our people. While the financial services industry is ever changing, how we treat our stakeholders will not.

CHARACTER Any success that jeopardizes our integrity is worthless. Even when it’s difficult , we exercise the highest standard of ethics and seek to do the right thing, always. COMPASSION People don’t care about how much you know until they know how much you care. In other words, compassion is THE prerequisite to building trusted, loyal, and beneficial relationships with balance to all stakeholders. COMPETITION Like the most successful athletes, the most successful companies, are highly competitive. Our ultimate reward is the satisfaction of knowing that we’ve done our absolute best. CLASS Every experience stakeholders have with us, whether it’s in person, with advertising or online, will impact their perception of MutualBank. Therefore , we ensure that every M utualBank touch - point maintains and improves our reputation in the marketplace.
Our Engine
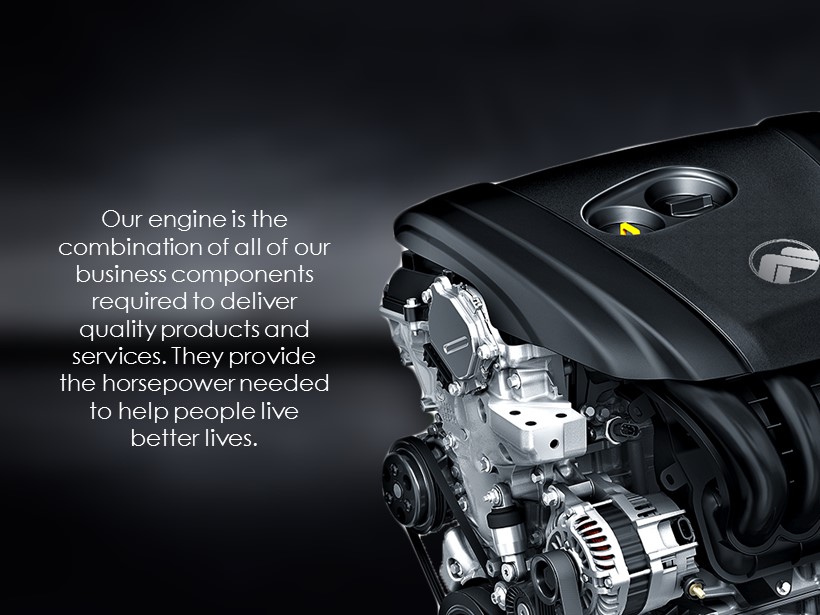
Our engine is the combination of all of our business components required to deliver quality products and services. They provide the horsepower needed to help people live better lives. Risk Management

Risk Management They include: • Employees • Culture • Technology • Data • Delivery Systems • Infrastructure • Risk Management • Presence

Tires

Our tires are where the rubber meets the road. They are our delivery channels where customers interact with us and experience our products and services. We could know where we’re going and have the engine to get there, but if we don’t deliver the desired customer experience, we’re not going to get traction or move forward.

Financial Centers Phone

Online Mobile

Focus Areas

Our focus areas are the three broad categories of products and services we offer. They are the “lanes” we accelerate in and they all work together on the road to help people live better lives.

2015 - 2019 Strategic Plan Framework