Attached files
| file | filename |
|---|---|
| 8-K - FORM 8-K - HOME BANCORP, INC. | v409322_8k.htm |
Exhibit 99.1
May 2015 1 st Quarter 2015 Investor Presentation
Forward Looking Statements Certain comments in this presentation contain certain forward looking statements (as defined in the Securities Exchange Act of 1934 and the regulations hereunder). Forward looking statements are not historical facts but instead represent only the beliefs, expectations or opinions of Home Bancorp, Inc. and its management regarding future events, many of which, by their nature, are inherently uncertain. Forward looking statements may be identified by the use of such words as: “believe”, “expect”, “anticipate”, “intend”, “plan”, “estimate”, or words of similar meaning, or future or conditional terms such as “wi ll” , “would”, “should”, “could”, “may”, “likely”, “probably”, or “possibly.” Forward looking statements include, but are not limit ed to, financial projections and estimates and their underlying assumptions; statements regarding plans, objectives and expectations with respect to future operations, products and services; and statements regarding future performance. Such statements are subject to certain risks, uncertainties and assumption, many of which are difficult to predict and generally a re beyond the control of Home Bancorp, Inc. and its management, that could cause actual results to differ materially from those expressed in, or implied or projected by, forward looking statements. The following factors, among others, could cause actual results to differ materially from the anticipated results or other expectations expressed in the forward looking statements: (1) economic and competitive conditions which could affect the volume of loan originations, deposit flows and real estate values; (2) the levels of non - interest income and expense and the amount of loan losses; (3) competitive pressure among depository institutions increasing significantly; (4) changes in the interest rate environment causing reduced interest margins; (5) gen era l economic conditions, either nationally or in the markets in which Home Bancorp, Inc. is or will be doing business, being less favorable than expected; (6) political and social unrest, including acts of war or terrorism; or (7) legislation or changes i n regulatory requirements adversely affecting the business in which Home Bancorp, Inc. is engaged. Home Bancorp, Inc. undertakes no obligation to update these forward looking statements to reflect events or circumstances that occur after the date on which such statements were made. As used in this report, unless the context otherwise requires, the terms “we,” “our,” “us,” or the “Company” refer to Home Bancorp, Inc. and the term the “Bank” refers to Home Bank, a nationally chartered bank and wholly owned subsidiary of the Company. In addition, unless the context otherwise requires, references to the operations of the Company include the operations of the Bank. For a more detailed description of the factors that may affect Home Bancorp’s operating results or the outcomes described in these forward - looking statements, we refer you to our filings with the Securities and Exchange Commission, including our annual report on Form 10 - K for the year ended December 31, 2014. Home Bancorp assumes no obligation to update the forward - looking statements made during this presentation. For more information, please visit our website www.home24bank.com. 2
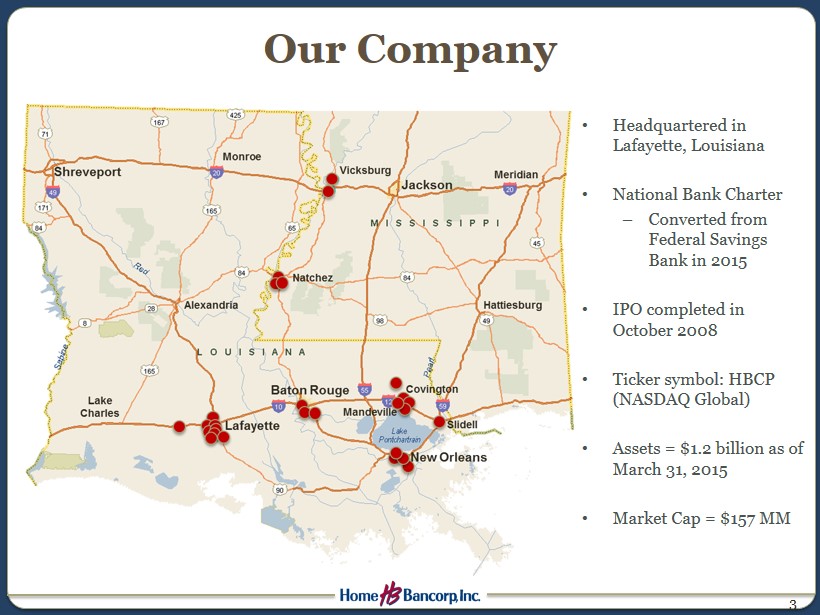
Our Company 3 • Headquartered in Lafayette, Louisiana • National Bank Charter – Converted from Federal Savings Bank in 2015 • IPO completed in October 2008 • Ticker symbol: HBCP (NASDAQ Global) • Assets = $1.2 billion as of March 31, 2015 • Market Cap = $157 MM
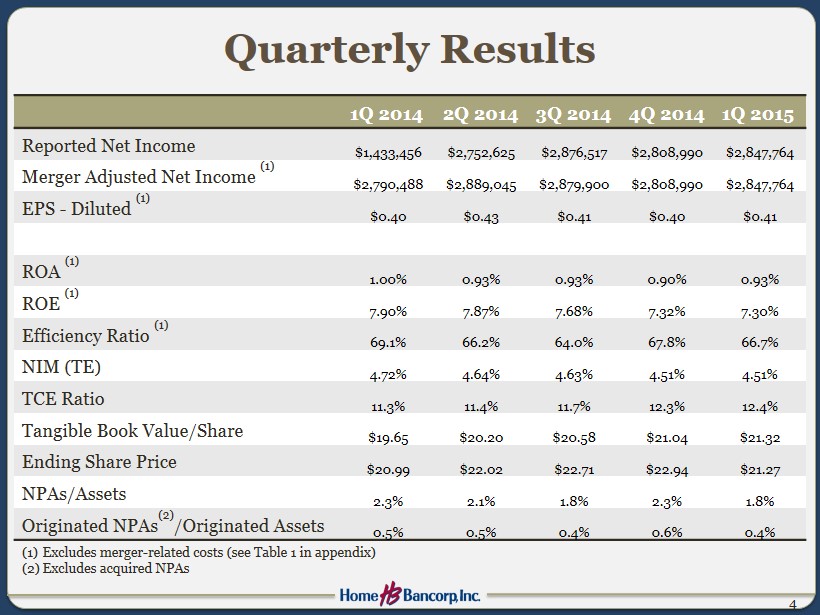
Quarterly Results 4 1Q 2014 2Q 2014 3Q 2014 4Q 2014 1Q 2015 Reported Net Income $ 1,433,456 $2,752,625 $ 2,876,517 $2,808,990 $2,847,764 Merger Adjusted Net Income (1) $ 2,790,488 $ 2,889,045 $ 2,879,900 $2,808,990 $2,847,764 EPS - Diluted (1) $0.40 $ 0.43 $ 0.41 $0.40 $0.41 ROA (1) 1.00% 0.93% 0.93% 0.90% 0.93% ROE (1) 7.90% 7.87% 7.68% 7.32% 7.30% Efficiency Ratio (1) 69.1% 66.2% 64.0% 67.8% 66.7% NIM (TE) 4.72% 4.64% 4.63% 4.51% 4.51% TCE Ratio 11.3% 11.4% 11.7% 12.3% 12.4% Tangible Book Value/Share $19.65 $20.20 $20.58 $21.04 $21.32 Ending Share Price $20.99 $22.02 $22.71 $22.94 $21.27 NPAs/Assets 2.3% 2.1% 1.8% 2.3% 1.8% Originated NPAs (2) /Originated Assets 0.5% 0.5% 0.4% 0.6% 0.4% (1) Excludes merger - related costs (see Table 1 in appendix) (2) Excludes acquired NPAs
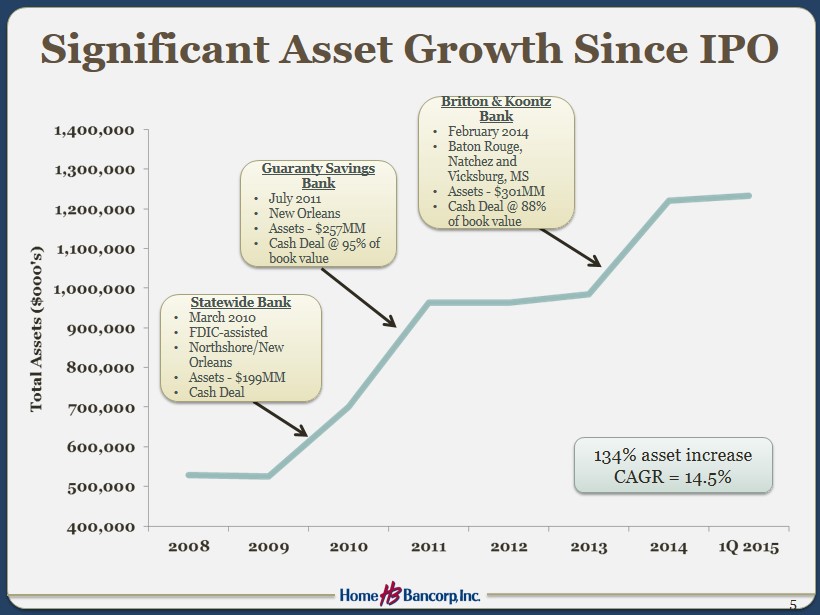
Significant Asset Growth Since IPO 5 134% asset increase CAGR = 14.5% Statewide Bank • March 2010 • FDIC - a ssisted • Northshore/New Orleans • Assets - $199MM • Cash Deal Guaranty Savings Bank • July 2011 • New Orleans • Assets - $257MM • Cash Deal @ 95% of book value Britton & Koontz Bank • February 2014 • Baton Rouge, Natchez and Vicksburg, MS • Assets - $301MM • Cash Deal @ 88% of book value
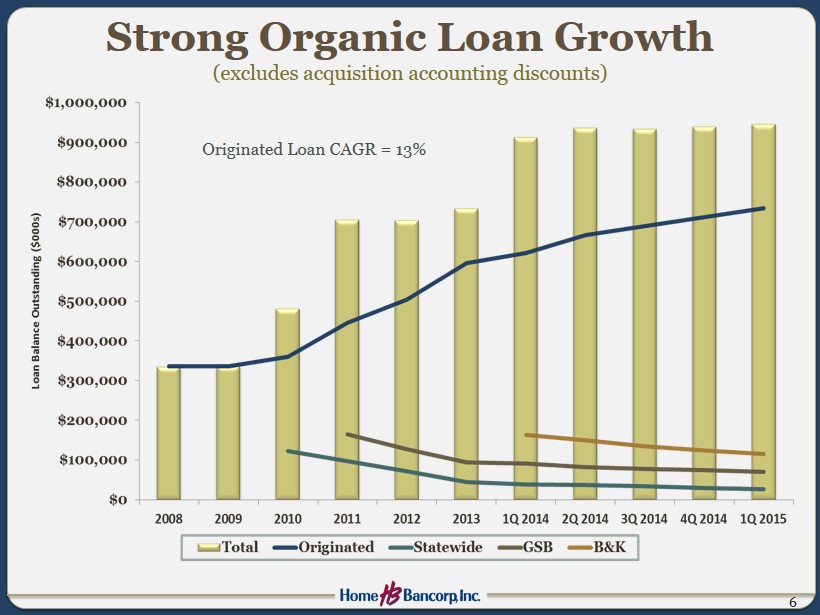
Strong Organic Loan Growth (excludes acquisition accounting discounts ) Originated Loan CAGR = 13% 6
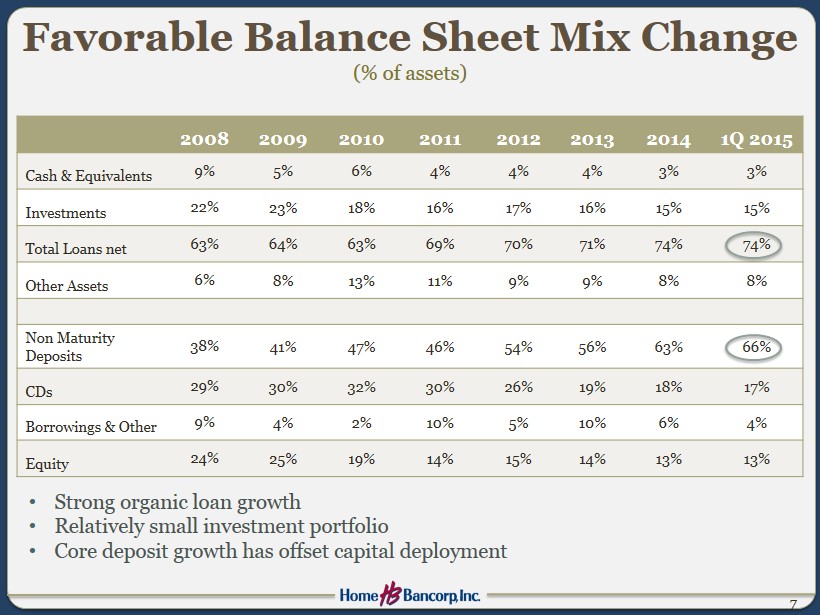
Favorable Balance Sheet Mix Change (% of assets) 7 2008 2009 2010 2011 2012 2013 2014 1Q 2015 Cash & Equivalents 9% 5% 6% 4% 4% 4% 3 % 3 % Investments 22% 23% 18% 16% 17% 16% 15% 15% Total Loans net 63% 64% 63% 69% 70% 71% 74% 74% Other Assets 6% 8% 13% 11% 9% 9% 8% 8% Non Maturity Deposits 38% 41% 47% 46% 54% 56% 63% 66% CDs 29% 30% 32% 30% 26% 19% 18% 17% Borrowings & Other 9% 4% 2% 10% 5% 10% 6% 4% Equity 24% 25% 19% 14% 15% 14% 13% 13% • Strong organic loan growth • Relatively small investment portfolio • Core deposit growth has offset capital deployment
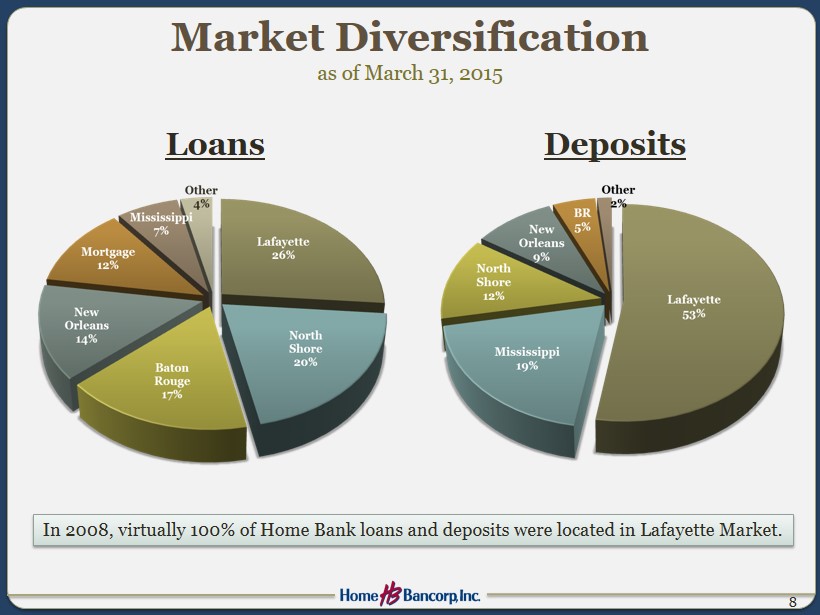
8 In 2008, virtually 100% of Home Bank loans and deposits were located in Lafayette Market. Market Diversification as of March 31, 2015 Loans Deposits
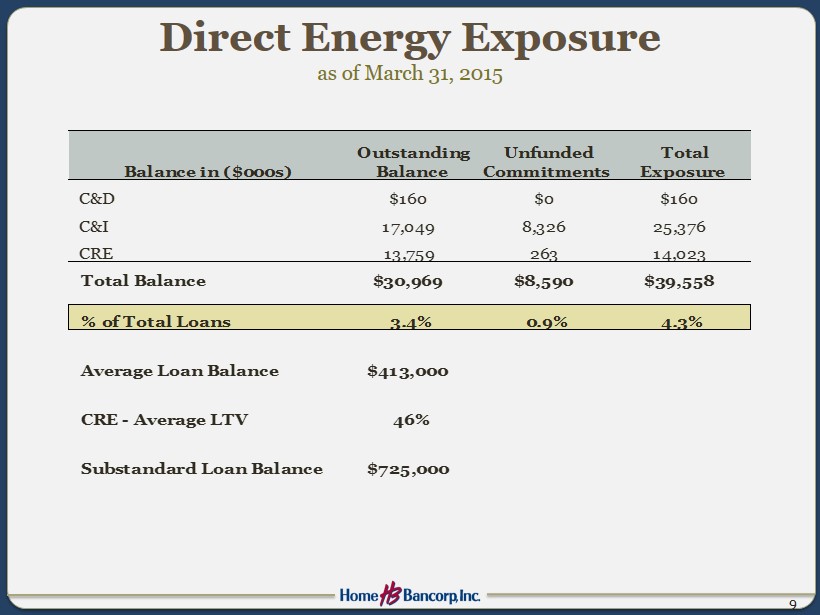
Direct Energy Exposure as of March 31, 2015 9 C&D $160 $0 $160 C&I 17,049 8,326 25,376 CRE 13,759 263 14,023 Total Balance $30,969 $8,590 $39,558 % of Total Loans 3.4% 0.9% 4.3% Average Loan Balance $413,000 CRE - Average LTV 46% Substandard Loan Balance $725,000 Outstanding Balance Unfunded Commitments Total Exposure Balance in ($000s)
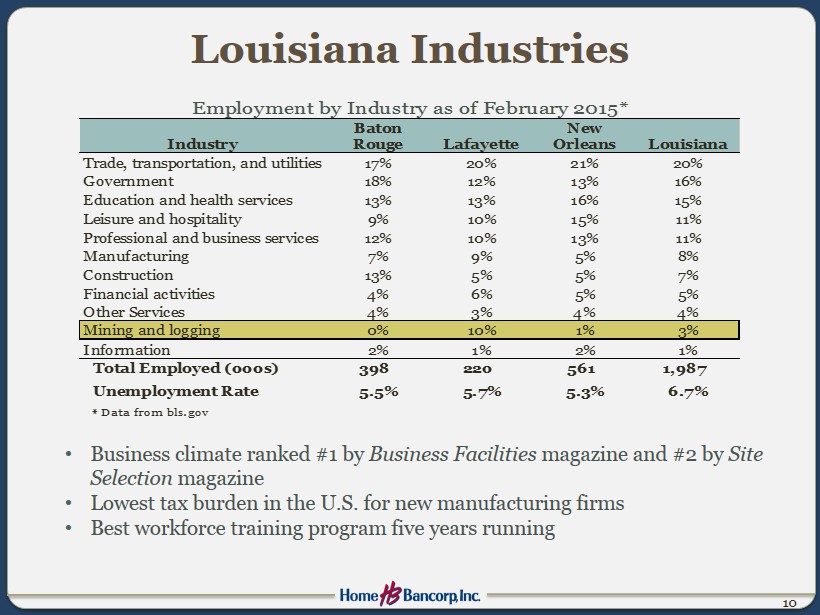
Louisiana Industries 10 • Business climate ranked #1 by Business Facilities magazine and #2 by Site Selection magazine • Lowest tax burden in the U.S. for new manufacturing firms • Best workforce training program five years running Trade, transportation, and utilities 17% 20% 21% 20% Government 18% 12% 13% 16% Education and health services 13% 13% 16% 15% Leisure and hospitality 9% 10% 15% 11% Professional and business services 12% 10% 13% 11% Manufacturing 7% 9% 5% 8% Construction 13% 5% 5% 7% Financial activities 4% 6% 5% 5% Other Services 4% 3% 4% 4% Mining and logging 0% 10% 1% 3% Information 2% 1% 2% 1% Total Employed (000s) 398 220 561 1,987 Unemployment Rate 5.5% 5.7% 5.3% 6.7% * Data from bls.gov Employment by Industry as of February 2015* Baton Rouge Lafayette New Orleans LouisianaIndustry
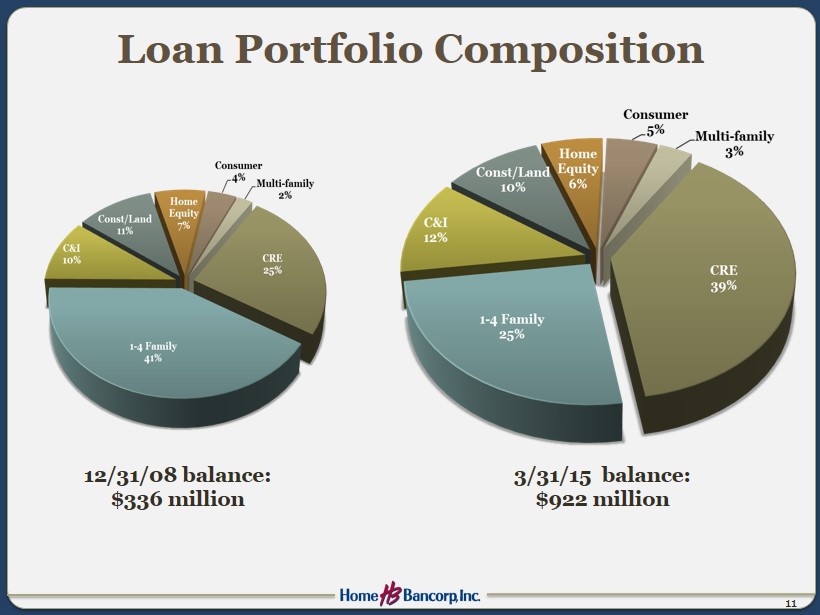
Loan Portfolio Composition 11 12/31/08 balance: $336 million 3/31/15 balance: $922 million
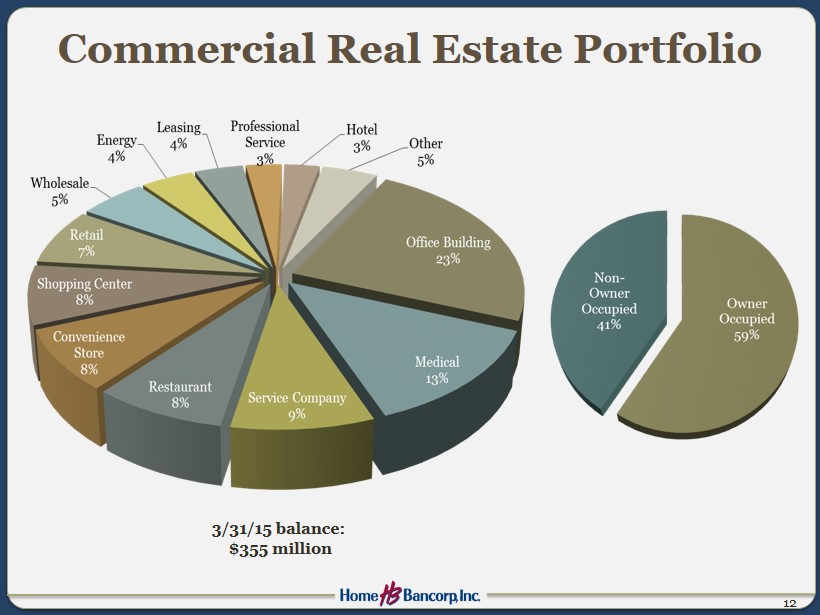
Commercial Real Estate Portfolio 12 3/31/15 balance: $355 million
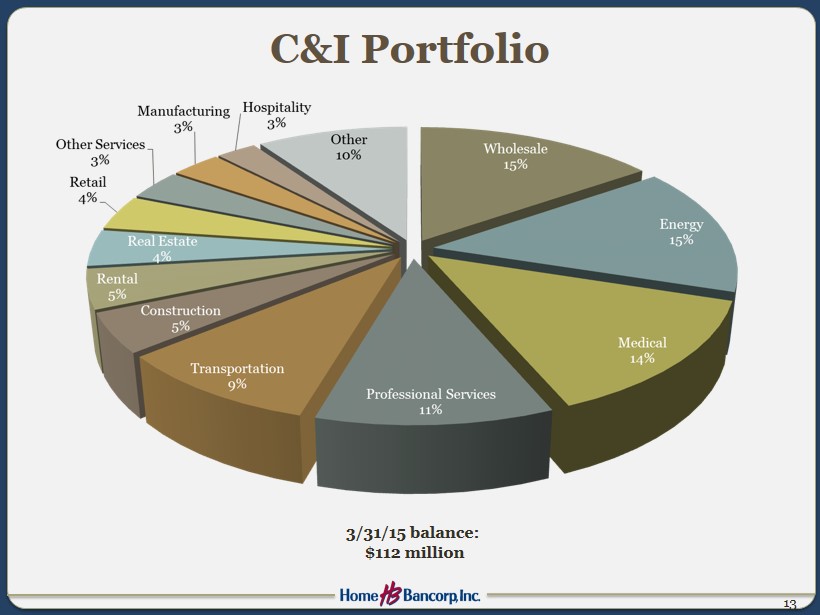
C&I Portfolio 13 3/31/15 balance: $112 million
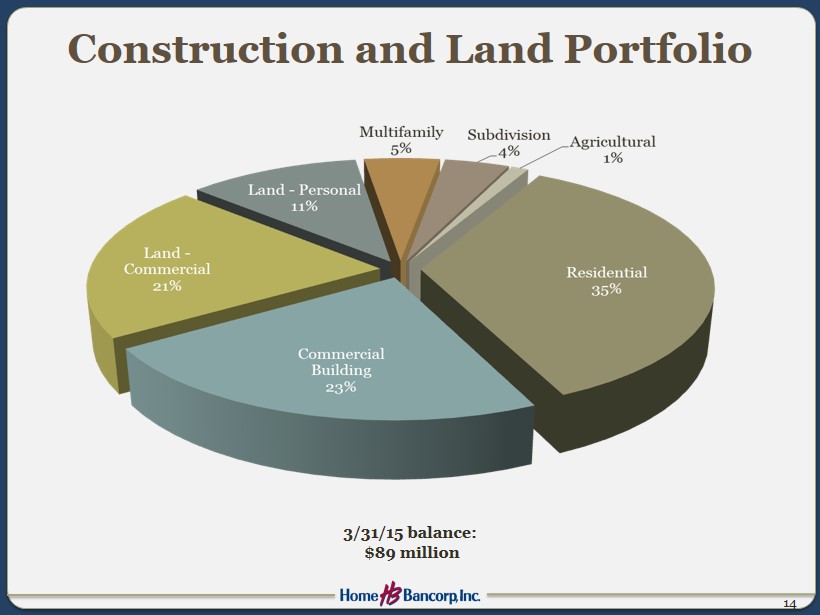
Construction and Land Portfolio 14 3/31/15 balance: $89 million
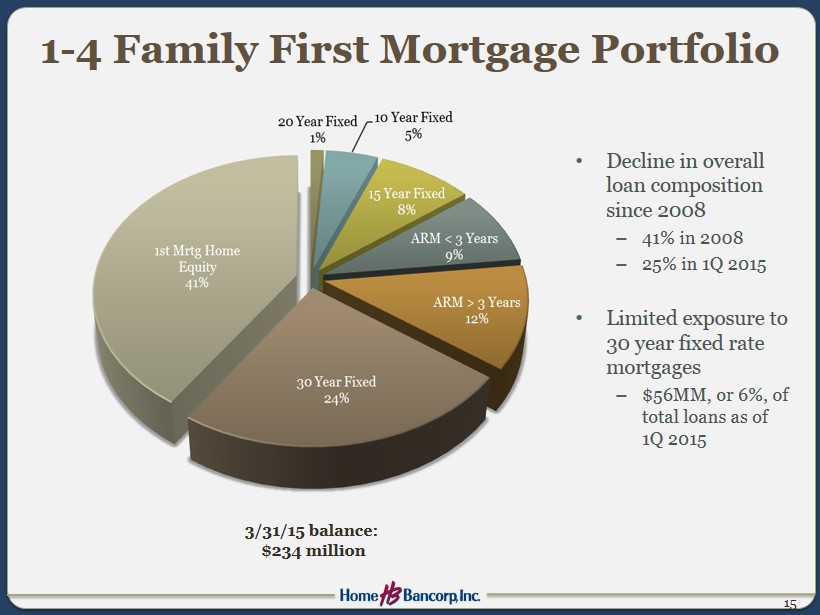
1 - 4 Family First Mortgage Portfolio • Decline in overall loan composition since 2008 – 41% in 2008 – 25% in 1Q 2015 • Limited exposure to 30 year fixed rate mortgages – $56MM, or 6%, of total loans as of 1Q 2015 15 3/31/15 balance: $234 million
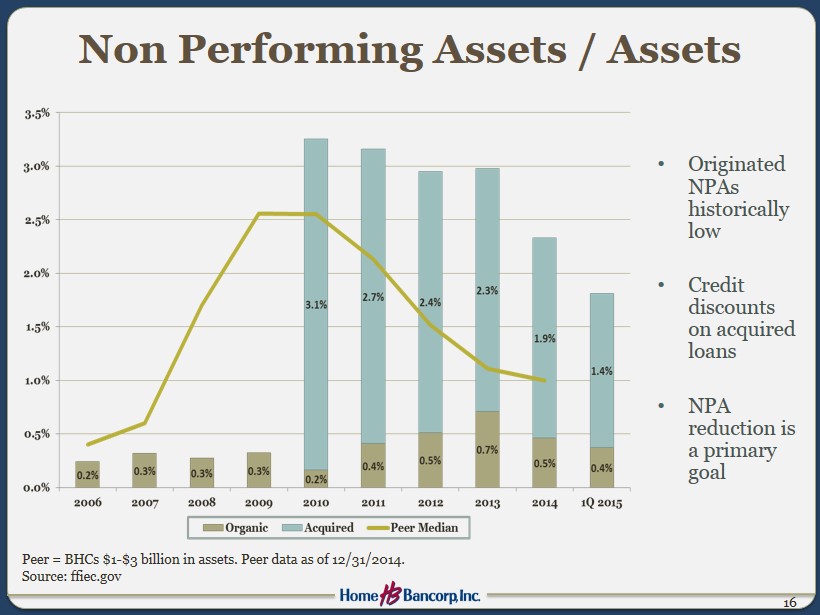
Non Performing Assets / Assets • Originated NPAs historically low • Credit discounts on acquired loans • NPA reduction is a primary goal 16 Peer = BHCs $1 - $3 billion in assets. Peer data as of 12/31/2014. Source: ffiec.gov

• Credit discount on acquired loans = 11.3% of outstanding balance 17 Credit Coverage
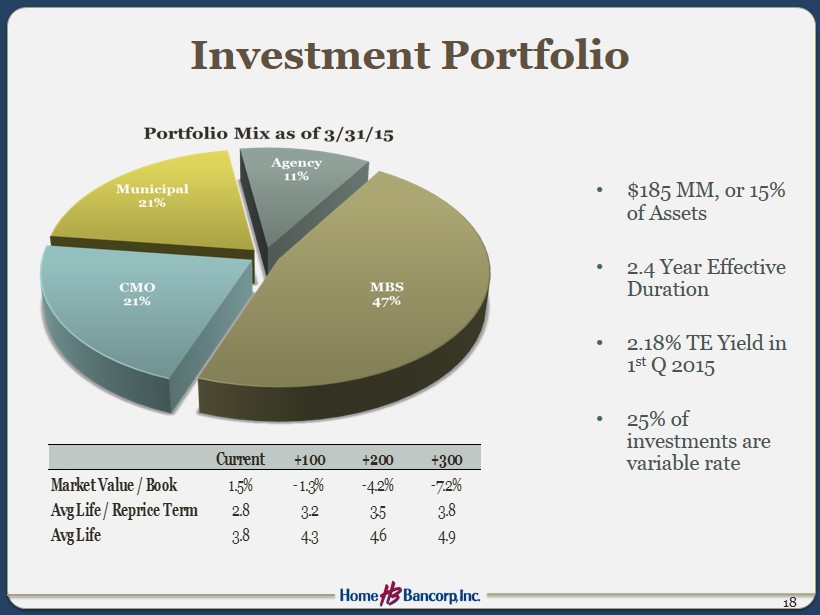
• $185 MM, or 15% of Assets • 2.4 Year Effective Duration • 2.18% TE Yield in 1 st Q 2015 • 25% of investments are variable rate 18 Investment Portfolio Current +100 +200 +300 Market Value / Book 1.5% -1.3% -4.2% -7.2% Avg Life / Reprice Term 2.8 3.2 3.5 3.8 Avg Life 3.8 4.3 4.6 4.9
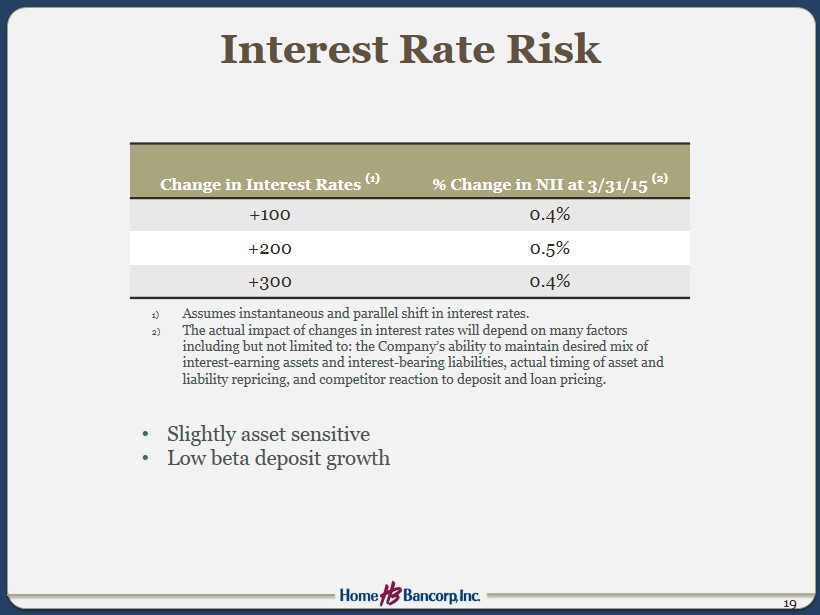
Interest Rate Risk Change in Interest Rates (1) % Change in NII at 3/31/15 (2) +100 0.4% +200 0.5% +300 0.4% 19 1) Assumes instantaneous and parallel shift in interest rates. 2) The actual impact of changes in interest rates will depend on many factors including but not limited to: the Company’s ability to maintain desired mix of interest - earning assets and interest - bearing liabilities, actual timing of asset and liability repricing , and competitor reaction to deposit and loan pricing. • Slightly asset sensitive • Low beta deposit growth
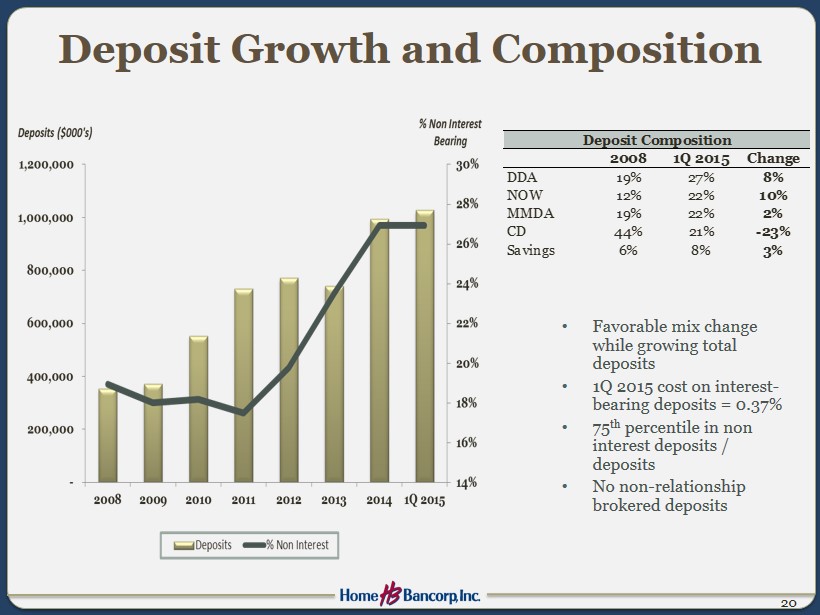
Deposit Growth and Composition 20 2008 1Q 2015 Change DDA 19% 27% 8% NOW 12% 22% 10% MMDA 19% 22% 2% CD 44% 21% -23% Savings 6% 8% 3% Deposit Composition • Favorable mix change while growing total deposits • 1Q 2015 cost on interest - bearing deposits = 0.37% • 75 th percentile in non interest deposits / deposits • No non - relationship brokered deposits
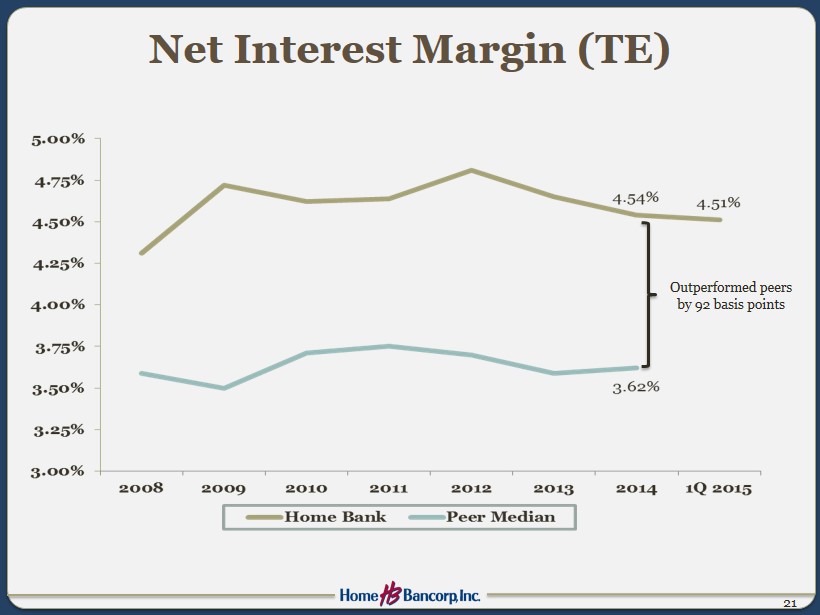
Net Interest Margin (TE) 21 Outperformed peers by 92 basis points
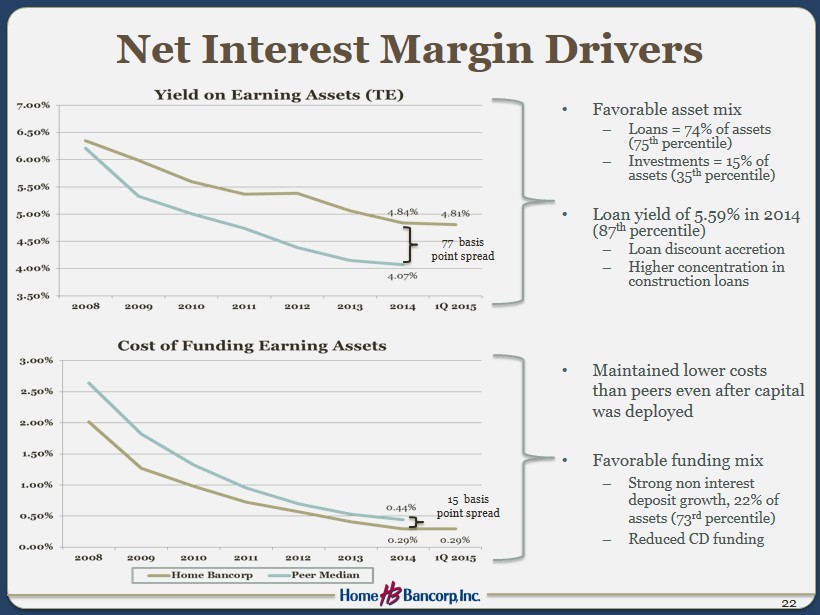
Net Interest Margin Drivers • Favorable asset mix – Loans = 74% of assets (75 th percentile) – Investments = 15% of assets (35 th percentile) • Loan yield of 5.59% in 2014 (87 th percentile) – Loan discount accretion – Higher concentration in construction loans 22 • Maintained lower costs than peers even after capital was deployed • Favorable funding mix – Strong non interest deposit growth, 22% of assets (73 rd percentile) – Reduced CD funding 77 basis point spread 15 basis point spread
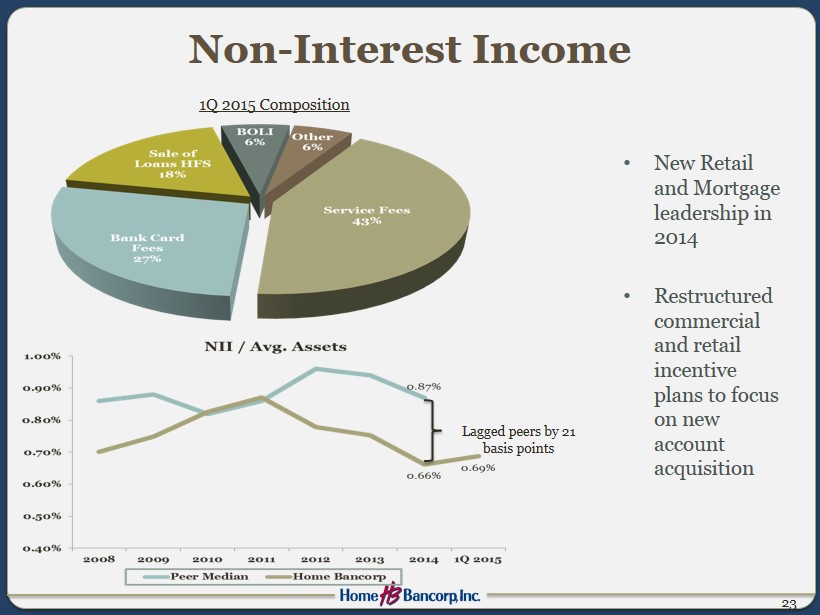
Non - Interest Income • New Retail and Mortgage leadership in 2014 • Restructured commercial and retail incentive plans to focus on new account acquisition 23 1Q 2015 Composition Lagged peers by 21 basis points
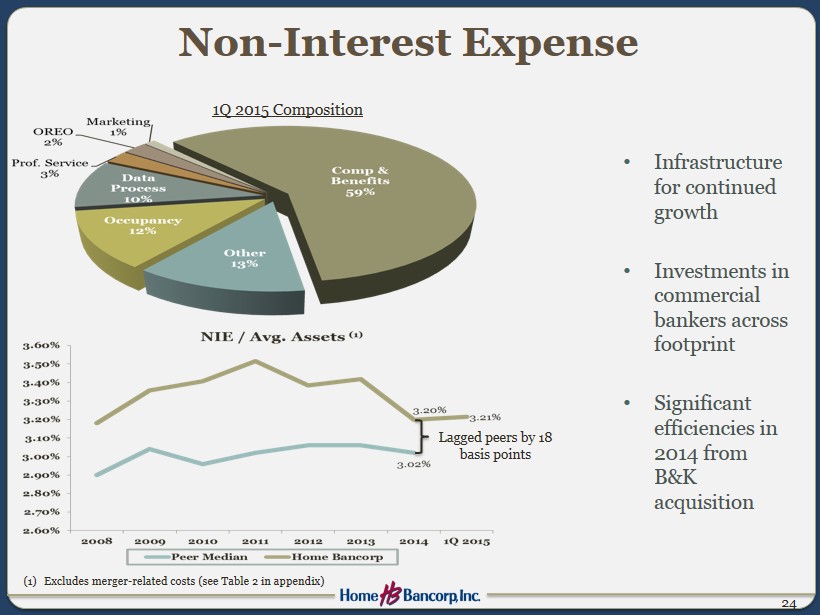
Non - Interest Expense • Infrastructure for continued growth • Investments in commercial bankers across footprint • Significant efficiencies in 2014 from B&K acquisition 24 1Q 2015 Composition Lagged peers by 18 basis points (1) Excludes merger - related costs (see Table 2 in appendix)
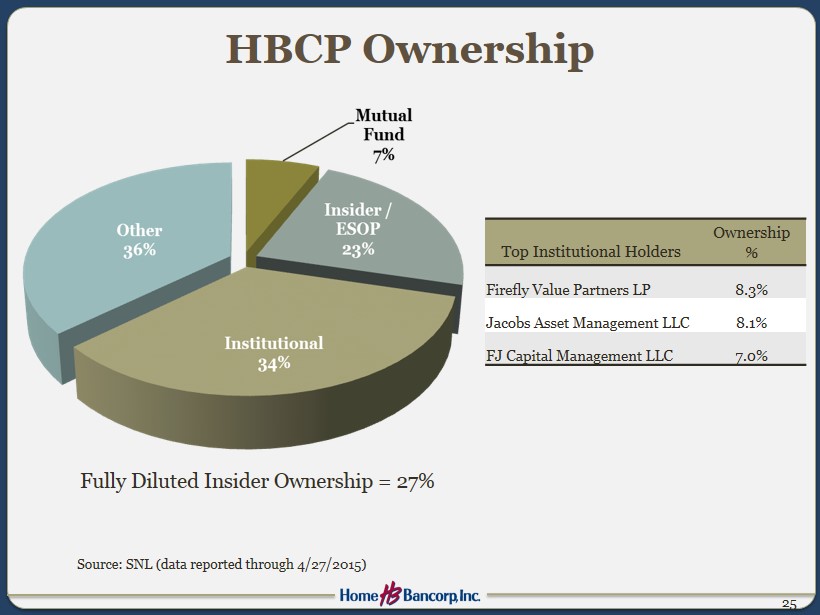
HBCP Ownership 25 Source: SNL (data reported through 4/27/2015) Top Institutional Holders Ownership % Firefly Value Partners LP 8.3% Jacobs Asset Management LLC 8.1% FJ Capital Management LLC 7.0% Fully Diluted Insider Ownership = 27%
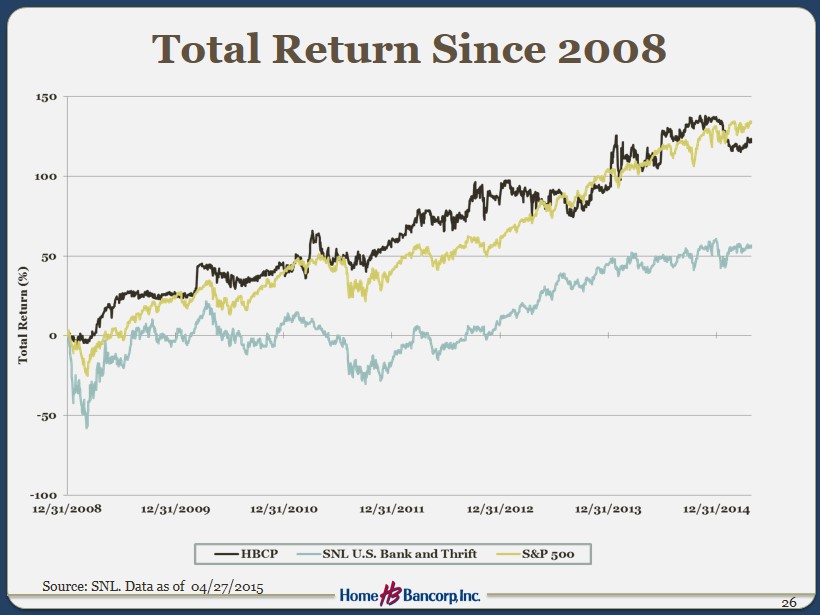
Total Return Since 2008 26 Source: SNL. Data as of 04/27/2015
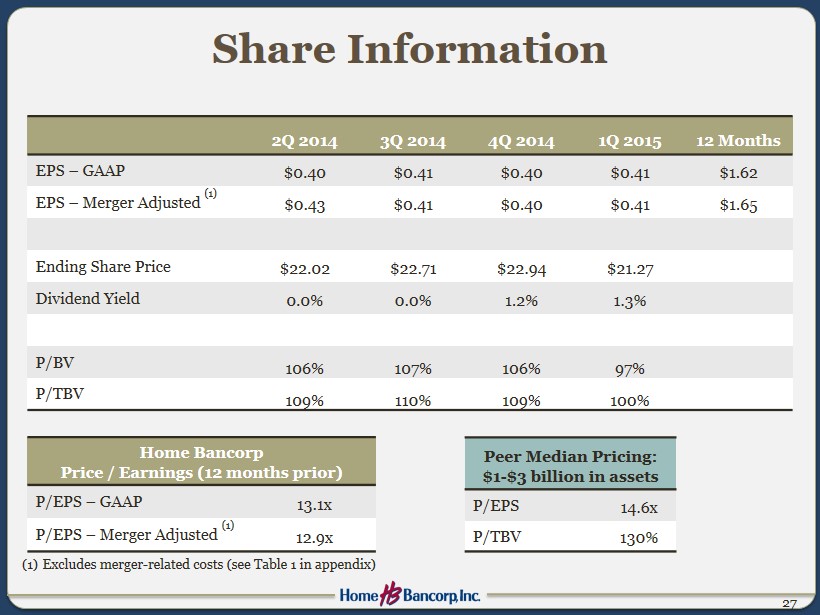
Share Information 27 2Q 2014 3Q 2014 4Q 2014 1Q 2015 12 Months EPS – GAAP $0.40 $0.41 $0.40 $0.41 $1.62 EPS – Merger Adjusted (1) $0.43 $0.41 $0.40 $0.41 $1.65 Ending Share Price $22.02 $22.71 $22.94 $21.27 Dividend Yield 0.0% 0.0% 1.2% 1.3% P/ BV 106% 107% 106% 97% P/TBV 109% 110% 109% 100% Home Bancorp Price / Earnings (12 months prior) P/EPS – GAAP 13.1x P/EPS – Merger Adjusted (1) 12.9x (1) Excludes merger - related costs (see Table 1 in appendix) Peer Median Pricing: $1 - $3 billion in assets P/EPS 14.6x P/TBV 130%

Tangible Common Equity Ratio 28
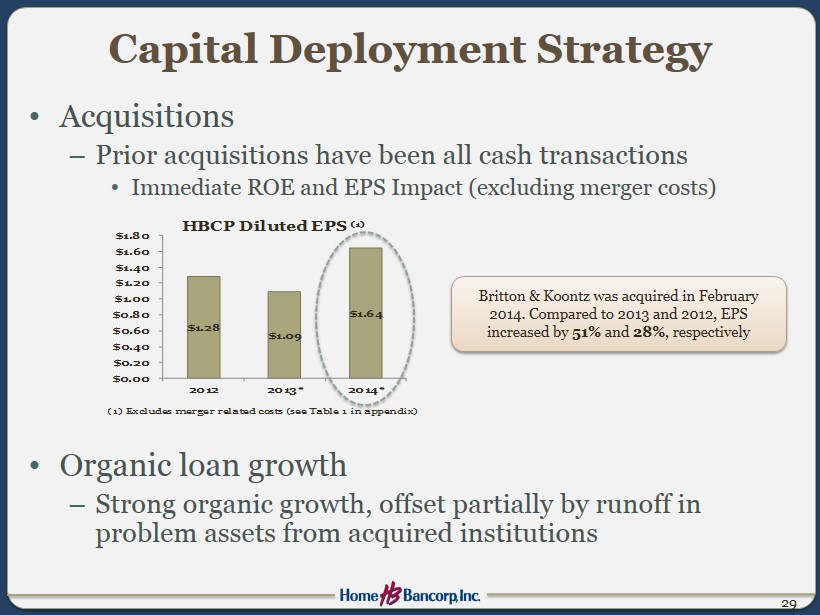
Capital Deployment Strategy • Acquisitions – Prior acquisitions have been all cash transactions • Immediate ROE and EPS Impact (excluding merger costs) • Organic loan growth – Strong organic growth, offset partially by runoff in problem assets from acquired institutions 29 (1) Excludes merger related costs (see Table 1 in appendix) $1.28 $1.09 $1.64 $0.00 $0.20 $0.40 $0.60 $0.80 $1.00 $1.20 $1.40 $1.60 $1.80 2012 2013* 2014* HBCP Diluted EPS (1) Britton & Koontz was acquired in February 2014. Compared to 2013 and 2012, EPS increased by 51% and 28% , respectively
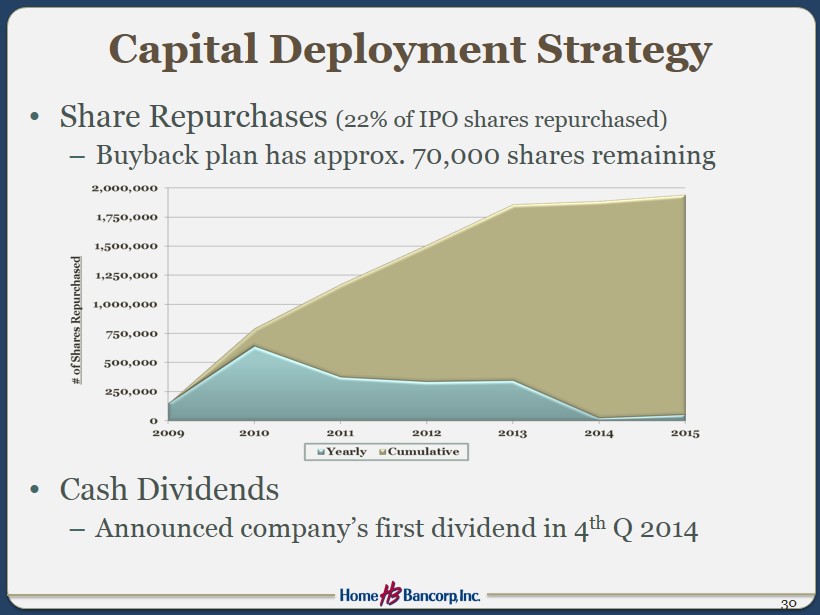
Capital Deployment Strategy • Share Repurchases (22% of IPO shares repurchased) – Buyback plan has approx. 70,000 shares remaining • Cash Dividends – Announced company’s first dividend in 4 th Q 2014 30
Investment Perspective • Consistently superior organic asset quality • Deep customer relationships – 107 years • Successful acquirer; experienced deal team • Strong capital base – Disciplined deployment – Well positioned for further acquisitions • Low direct energy exposure • Trading at 100% of tangible book value 31
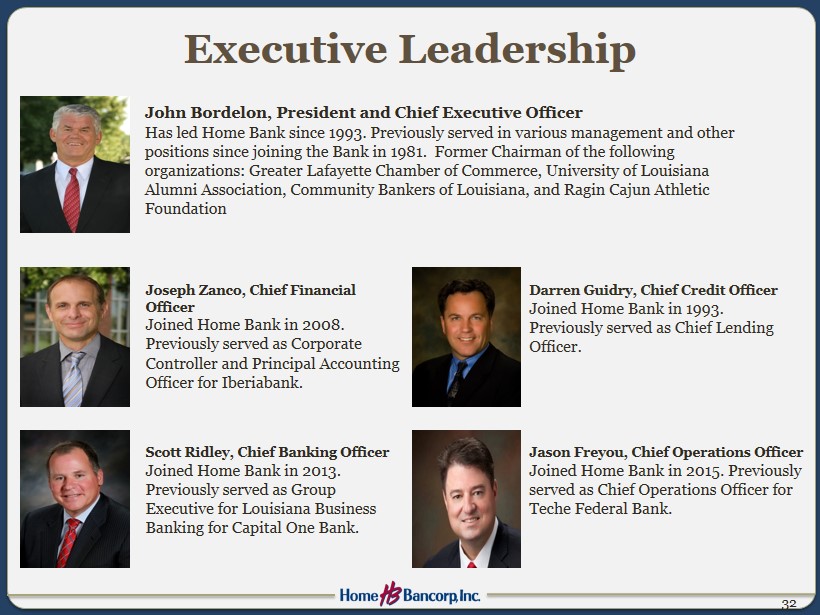
Executive Leadership 32 Jason Freyou, Chief Operations Officer Joined Home Bank in 2015. Previously served as Chief Operations Officer for Teche Federal Bank. Darren Guidry, Chief Credit Officer Joined Home Bank in 1993. Previously served as Chief Lending Officer. Scott Ridley, Chief Banking Officer Joined Home Bank in 2013. Previously served as Group Executive for Louisiana Business Banking for Capital One Bank. Joseph Zanco, Chief Financial Officer Joined Home Bank in 2008. Previously served as Corporate Controller and Principal Accounting Officer for Iberiabank . John Bordelon, President and Chief Executive Officer Has led Home Bank since 1993. Previously served in various management and other positions since joining the Bank in 1981 . Former Chairman of the following organizations: Greater Lafayette Chamber of Commerce , University of Louisiana Alumni Association, Community Bankers of Louisiana, and Ragin Cajun Athletic Foundation
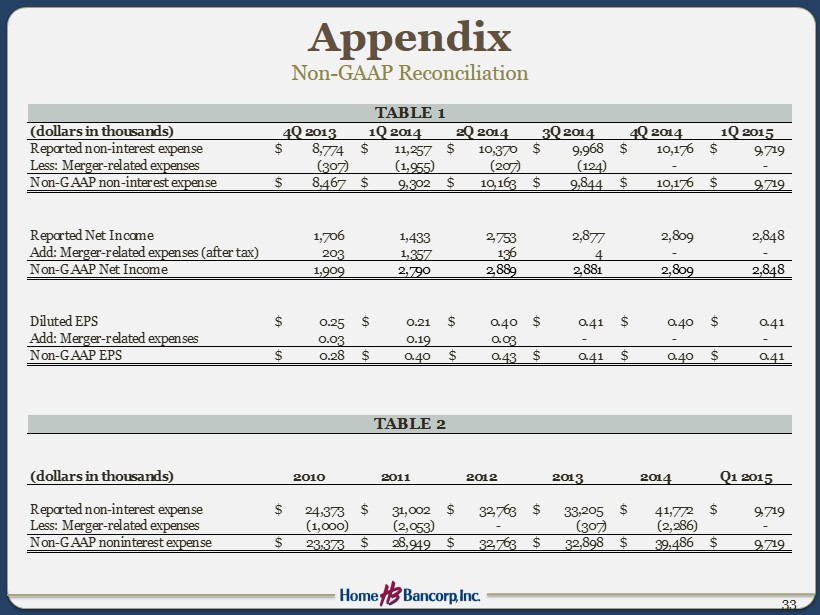
Appendix Non - GAAP Reconciliation 33 (dollars in thousands) 4Q 2013 1Q 2014 2Q 2014 3Q 2014 4Q 2014 1Q 2015 Reported non-interest expense 8,774$ 11,257$ 10,370$ 9,968$ 10,176$ 9,719$ Less: Merger-related expenses (307) (1,955) (207) (124) - - Non-GAAP non-interest expense 8,467$ 9,302$ 10,163$ 9,844$ 10,176$ 9,719$ Reported Net Income 1,706 1,433 2,753 2,877 2,809 2,848 Add: Merger-related expenses (after tax) 203 1,357 136 4 - - Non-GAAP Net Income 1,909 2,790 2,889 2,881 2,809 2,848 Diluted EPS 0.25$ 0.21$ 0.40$ 0.41$ 0.40$ 0.41$ Add: Merger-related expenses 0.03 0.19 0.03 - - - Non-GAAP EPS 0.28$ 0.40$ 0.43$ 0.41$ 0.40$ 0.41$ TABLE 1 Reported non-interest expense 24,373$ 31,002$ 32,763$ 33,205$ 41,772$ 9,719$ Less: Merger-related expenses (1,000) (2,053) - (307) (2,286) - Non-GAAP noninterest expense 23,373$ 28,949$ 32,763$ 32,898$ 39,486$ 9,719$ Q1 2015 TABLE 2 201420132011 20122010(dollars in thousands)