Attached files
| file | filename |
|---|---|
| 8-K - FORM 8-K - Great Ajax Corp. | t1501034_8k.htm |
| EX-99.1 - EXHIBIT 99.1 - Great Ajax Corp. | t1501034_ex99-1.htm |
Exhibit 99.2
First Quarter Earnings Conference Call May 4, 2015
Safe Harbor Disclosure 1 □ We make forward - looking statements in this presentation that are subject to risks and uncertainties. These forward - looking statements include information about possible or assumed future results of our business, financial condition, liquidity, resu lts of operations, cash flow and plans and objectives. When we use the words “believe,” “expect,” “anticipate,” “estimate,” “plan,” “continue,” “intend,” “should,” “may” or similar expressions, we intend to identify forward - looking statements. □ Statements regarding the following subjects, among others, may be forward - looking: market trends in our industry, interest rates, real estate values, the debt financing markets or the general economy or the demand for residential real estate loans; our business and investment strategy; our projected operating results; actions and initiatives of the U.S. government and changes to U.S. government policies and the execution and impact of these actions, initiatives and policies; the state of the U.S. economy generally or in specific geographic regions; economic trends and economic recoveries; our ability to obtain and maintain financing arrangements; changes in the value of our mortgage portfolio; changes to our portfolio of properties; impact of and changes in governmental regulations, tax law and rates, accounting guidance and similar matters; our ability to satisfy the REIT qualification requirements for U.S. federal income tax purposes; availability of qualified personnel; estima tes relating to our ability to make distributions to our shareholders in the future; general volatility of the capital markets an d t he market price of our shares of common stock; and degree and nature of our competition. □ The forward - looking statements are based on our beliefs, assumptions and expectations of our future performance, taking into account all information currently available to us. Forward - looking statements are not predictions of future events. These beliefs, assumptions and expectations can change as a result of many possible events or factors, not all of which are known t o us. If a change occurs, our business, financial condition, liquidity and results of operations may vary materially from those expressed in our forward - looking statements. Furthermore, forward - looking statements are subject to risks and uncertainties, including, among other things, those described under Item 1A of our Annual Report on Form 10 - K for the year ended December 31, 2014, which can be accessed through the link to our SEC filings on our website ( www.great - ajax.com ) or at the SEC's website ( www.sec.gov ). Other risks, uncertainties, and factors that could cause actual results to differ materially from those projected may be described from time to time in reports we file with the SEC, including reports on Forms 10 - Q, 10 - K and 8 - K. Any forward - looking statement speaks only as of the date on which it is made. New risks and uncertainties arise over time, and it is not possible for us to predict those events or how they may affect us. Except as required by law, we are not obligated to, and do not intend to, update or revise any forward - looking statements, whether as a result of new information, future events or otherwise.
Business Overview 2 □ Leverage long - standing relationships to acquire loans through privately negotiated transactions from a diverse group of customers – Over 90% of acquisitions by Great Ajax Corp. have been privately negotiated – Acquisitions made in 72 transactions □ Use our manager’s proprietary analytics to price each pool on an asset - by - asset basis □ Adjust individual loan bid price to accumulate clusters of loans in attractive demographic metropolitan areas – Typical acquisitions contain 25 – 100 loans with total market value between $5 – $20 million □ Our affiliated servicer services the loans asset - by - asset and borrower - by - borrower □ Objective is to maximize returns for each asset by utilizing full menu of loss mitigation and asset optimization techniques □ Use moderate non - mark - to - market leverage – Three securitizations since inception totaling $248.7 million of loan UPB
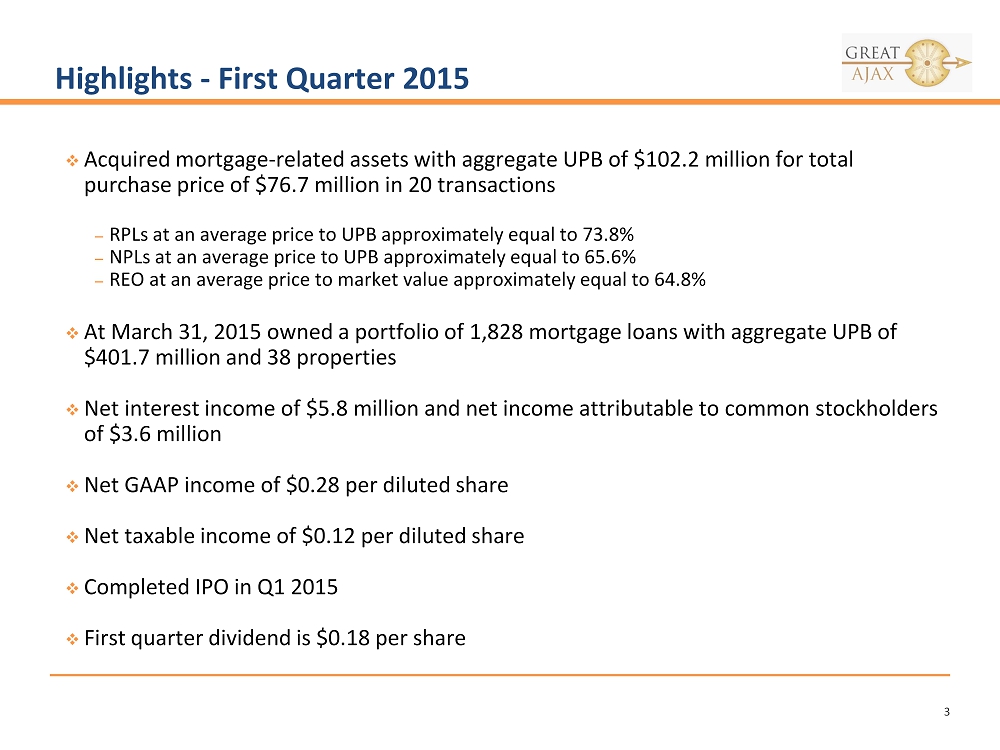
Highlights - First Quarter 2015 3 □ Acquired mortgage - related assets with aggregate UPB of $102.2 million for total purchase price of $76.7 million in 20 transactions – RPLs at an average price to UPB approximately equal to 73.8% – NPLs at an average price to UPB approximately equal to 65.6% – REO at an average price to market value approximately equal to 64.8% □ At March 31, 2015 owned a portfolio of 1,828 mortgage loans with aggregate UPB of $401.7 million and 38 properties □ Net interest income of $5.8 million and net income attributable to common stockholders of $3.6 million □ Net GAAP income of $0.28 per diluted share □ Net taxable income of $0.12 per diluted share □ Completed IPO in Q1 2015 □ First quarter dividend is $0.18 per share
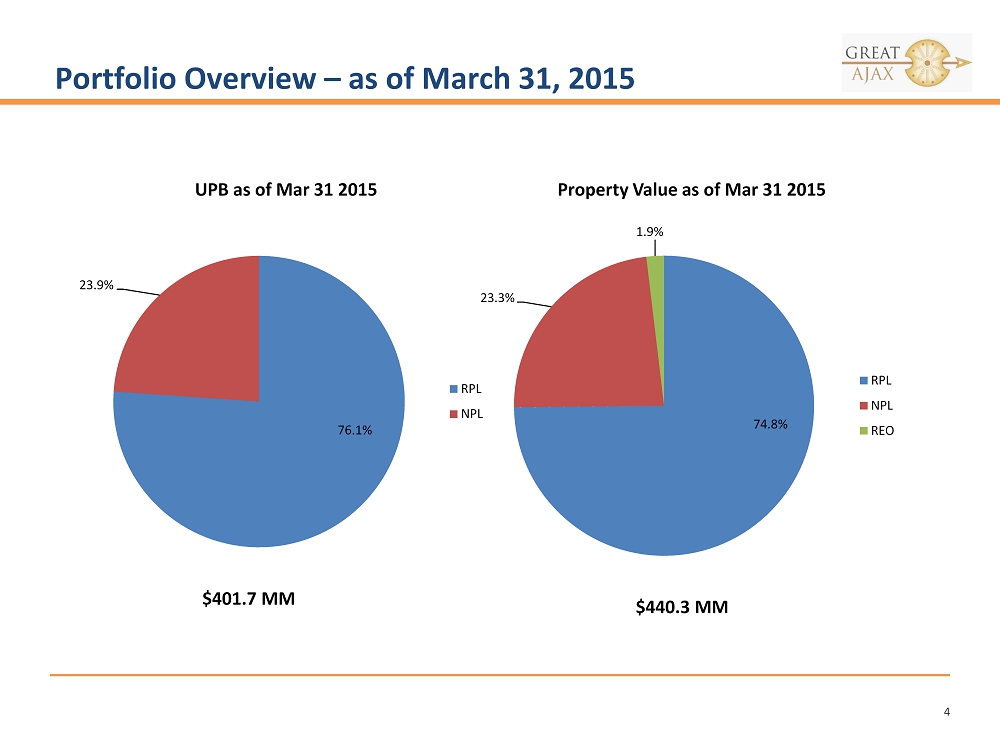
Portfolio Overview – as of March 31, 2015 4 $401.7 MM $440.3 MM 74.8% 23.3% 1.9% Property Value as of Mar 31 2015 RPL NPL REO 76.1% 23.9% UPB as of Mar 31 2015 RPL NPL
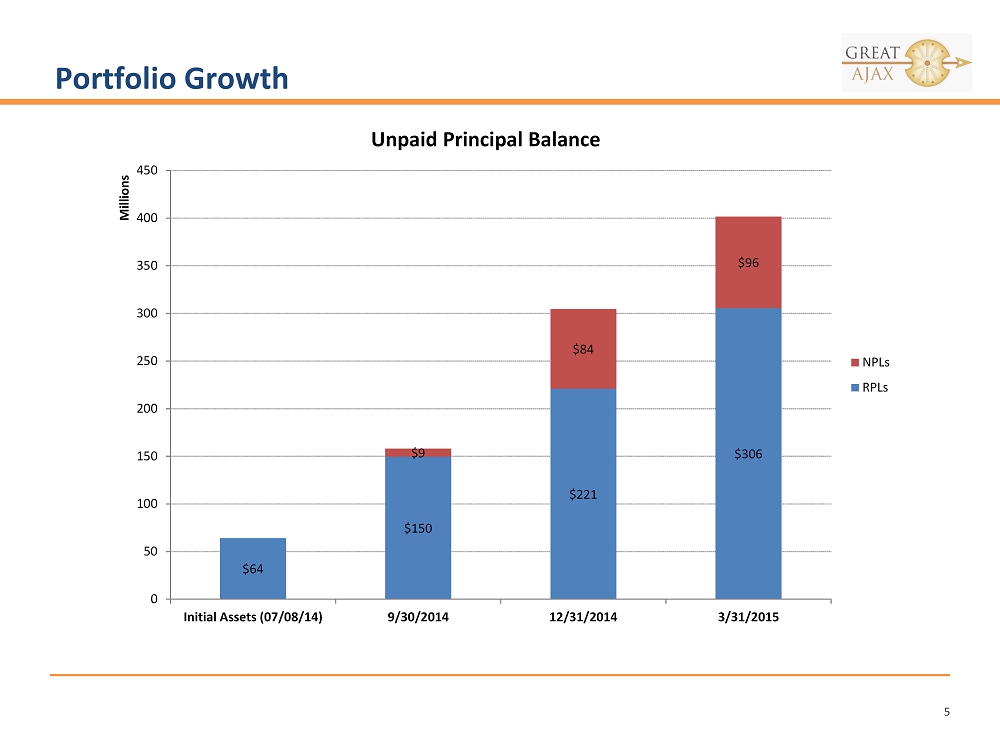
Portfolio Growth 5 $64 $150 $221 $306 $9 $84 $96 0 50 100 150 200 250 300 350 400 450 Initial Assets (07/08/14) 9/30/2014 12/31/2014 3/31/2015 Millions NPLs RPLs Unpaid Principal Balance

Portfolio Growth 6 Re - performing Loans $64 $150 $221 $306 $73 $161 $230 $330 $49 $113 $163 $226 0 50 100 150 200 250 300 350 Initial Assets (07/08/14) 9/30/2014 12/31/2014 3/31/2015 Millions UPB BPO Price

Portfolio Growth 7 $9 $84 $96 $8 $84 $103 $5 $50 $59 0 20 40 60 80 100 120 Initial Assets (07/08/14) 9/30/2014 12/31/2014 3/31/2015 Millions UPB BPO Price Non - performing Loans
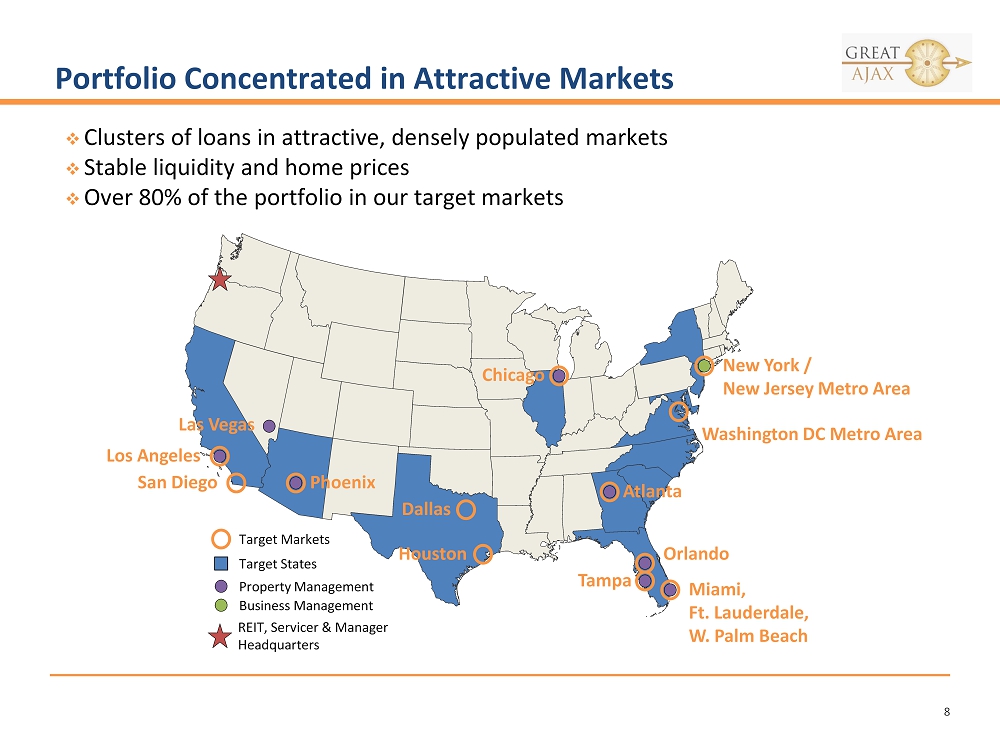
Portfolio Concentrated in Attractive Markets 8 □ Clusters of loans in attractive, densely populated markets □ Stable liquidity and home prices □ Over 80% of the portfolio in our target markets Target States Target Markets Los Angeles San Diego Dallas Houston Phoenix Washington DC Metro Area Chicago Atlanta Orlando Tampa Miami, Ft. Lauderdale, W. Palm Beach New York / New Jersey Metro Area Las Vegas REIT, Servicer & Manager Headquarters Property Management Business Management
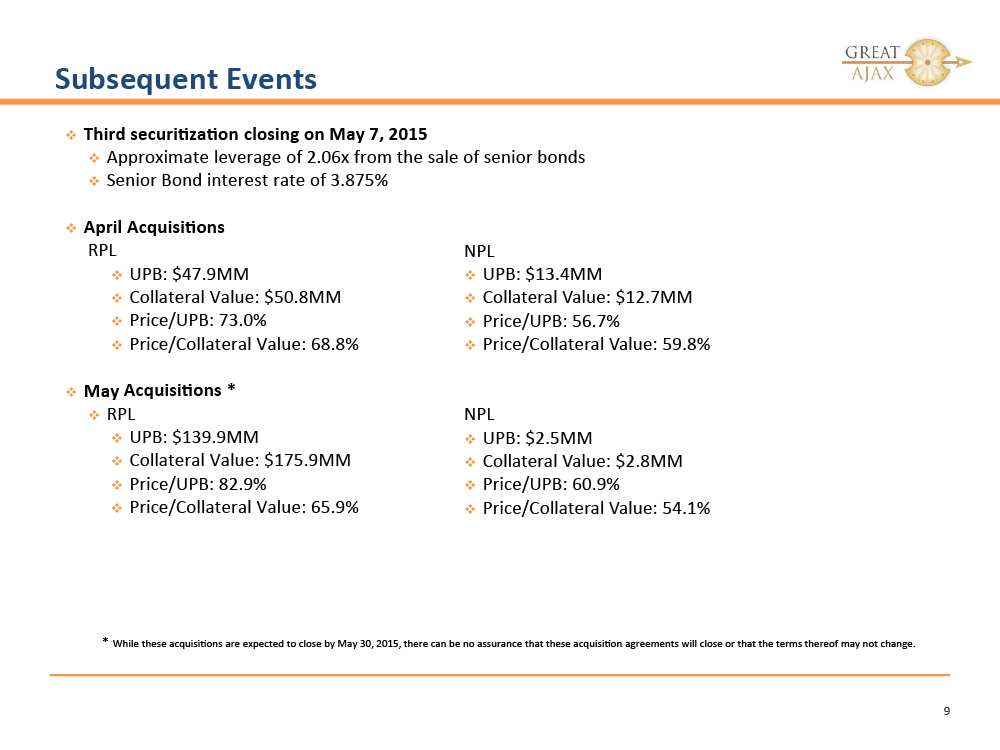
Subsequent Events 9 □ Third securitization closing on May 7, 2015 □ Approximate leverage of 2.06x from the sale of senior bonds □ Senior Bond interest rate of 3.875% □ April Acquisitions RPL □ UPB: $47.9MM □ Collateral Value: $50.8MM □ Price/UPB: 73.0% □ Price/Collateral Value: 68.8% □ May Acquisitions * □ RPL □ UPB: $139.9MM □ Collateral Value: $175.9MM □ Price/UPB: 82.9% □ Price/Collateral Value: 65.9% * While these acquisitions are expected to close by May 30, 2015, there can be no assurance that these acquisition agreements w ill close or that the terms thereof may not change. NPL □ UPB: $13.4MM □ Collateral Value: $12.7MM □ Price/UPB: 56.7% □ Price/Collateral Value: 59.8% NPL □ UPB: $2.5MM □ Collateral Value: $2.8MM □ Price/UPB: 60.9% □ Price/Collateral Value: 54.1%
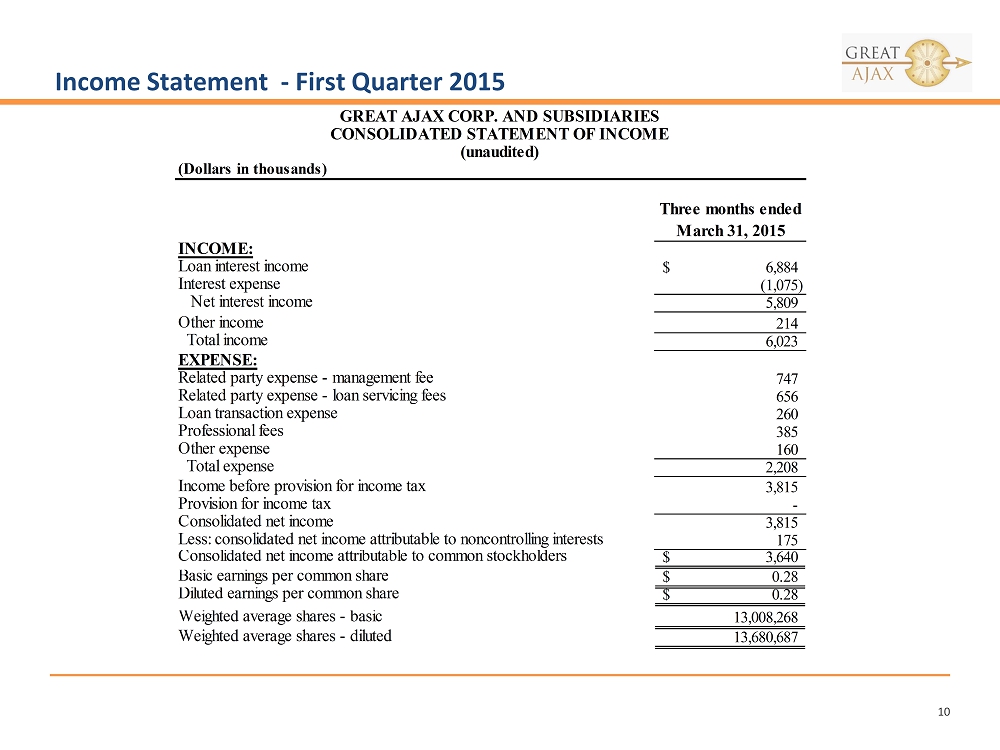
Income Statement - First Quarter 2015 10 GREAT AJAX CORP. AND SUBSIDIARIES CONSOLIDATED STATEMENT OF INCOME (unaudited) (Dollars in thousands) Three months ended March 31, 2015 INCOME: Loan interest income 6,884$ Interest expense (1,075) Net interest income 5,809 Other income 214 Total income 6,023 EXPENSE: Related party expense - management fee 747 Related party expense - loan servicing fees 656 Loan transaction expense 260 Professional fees 385 Other expense 160 Total expense 2,208 Income before provision for income tax 3,815 Provision for income tax - Consolidated net income 3,815 Less: consolidated net income attributable to noncontrolling interests 175 Consolidated net income attributable to common stockholders 3,640$ Basic earnings per common share 0.28$ Diluted earnings per common share 0.28$ Weighted average shares - basic 13,008,268 Weighted average shares - diluted 13,680,687
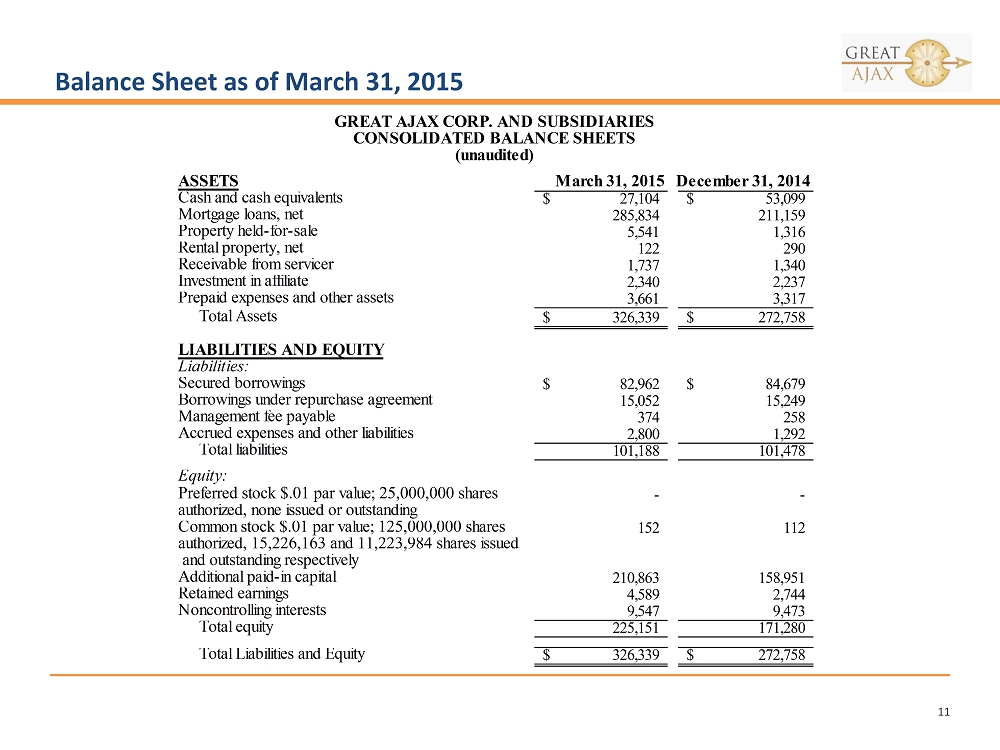
Balance Sheet as of March 31, 2015 11 GREAT AJAX CORP. AND SUBSIDIARIES CONSOLIDATED BALANCE SHEETS (unaudited) ASSETS March 31, 2015 December 31, 2014 Cash and cash equivalents 27,104$ 53,099$ Mortgage loans, net 285,834 211,159 Property held-for-sale 5,541 1,316 Rental property, net 122 290 Receivable from servicer 1,737 1,340 Investment in affiliate 2,340 2,237 Prepaid expenses and other assets 3,661 3,317 Total Assets 326,339$ 272,758$ LIABILITIES AND EQUITY Liabilities: Secured borrowings 82,962$ 84,679$ Borrowings under repurchase agreement 15,052 15,249 Management fee payable 374 258 Accrued expenses and other liabilities 2,800 1,292 Total liabilities 101,188 101,478 Equity: - - 152 112 Additional paid-in capital 210,863 158,951 Retained earnings 4,589 2,744 Noncontrolling interests 9,547 9,473 Total equity 225,151 171,280 Total Liabilities and Equity 326,339$ 272,758$ Preferred stock $.01 par value; 25,000,000 shares Common stock $.01 par value; 125,000,000 shares authorized, 15,226,163 and 11,223,984 shares issued and outstanding respectively authorized, none issued or outstanding