Attached files
| file | filename |
|---|---|
| EX-2.1 - EX-2.1 - CECO ENVIRONMENTAL CORP | d918028dex21.htm |
| EX-99.3 - EX-99.3 - CECO ENVIRONMENTAL CORP | d918028dex993.htm |
| EX-99.5 - EX-99.5 - CECO ENVIRONMENTAL CORP | d918028dex995.htm |
| EX-99.4 - EX-99.4 - CECO ENVIRONMENTAL CORP | d918028dex994.htm |
| EX-99.6 - EX-99.6 - CECO ENVIRONMENTAL CORP | d918028dex996.htm |
| EX-99.1 - EX-99.1 - CECO ENVIRONMENTAL CORP | d918028dex991.htm |
| EX-10.1 - EX-10.1 - CECO ENVIRONMENTAL CORP | d918028dex101.htm |
| 8-K - 8-K - CECO ENVIRONMENTAL CORP | d918028d8k.htm |
Exhibit 99.2
|
|
Exhibit 99.2
CECO to Acquire PMFG
Creating a Global Leader in Environmental, Energy and Fluid Handling Technologies
May 4, 2015
|
|
Forward Looking Statements
Information in this document contains forward-looking statements, which involve a number of risks and uncertainties. CECO Environmental Corp. (“CECO”) and PMFG, Inc. (“PMFG”) caution readers that any forward-looking information is not a guarantee of future performance and that actual results could differ materially from those contained in the forward-looking information. All such forward-looking statements include, but are not limited to, statements about the benefits of the business combination transaction involving CECO and PMFG, including future financial and operating results, the new company’s plans, objectives, expectations and intentions and other statements that are not historical facts.
The following factors, among others, could cause actual results to differ from those set forth in the forward-looking statements: the failure of CECO or PMFG stockholders to approve the transaction; the failure to obtain regulatory approvals; the risk that the businesses will not be integrated successfully; the risk that the cost savings and any other synergies from the transaction may not be fully realized or may take longer to realize than expected; disruption from the transaction making it more difficult to maintain relationships with customers, employees or suppliers; competition and its effect on pricing, spending, third-party relationships and revenues. Additional factors that may affect future results are contained in CECO’s and PMFG’s filings with the SEC. CECO and PMFG disclaim any obligation to update and revise statements contained in these materials based on new information or otherwise.
Important Information for Investors and Stockholders
This communication does not constitute an offer to sell or the solicitation of an offer to buy securities or a solicitation of any vote or approval. This communication is not a substitute for the prospectus/proxy statement that CECO and PMFG will file with the SEC. Investors in CECO or PMFG are urged to read the prospectus/proxy statement, which will contain important information, including detailed risk factors, when it becomes available. The prospectus/proxy statement and other documents that will be filed by CECO and PMFG with the SEC will be available free of charge at the SEC’s website, www.sec.gov, or by directing a request when such a filing is made to (1) CECO Environmental Corp., by mail at 4625 Red Bank Road Suite 200, Cincinnati, Ohio 45227, Attention: Investor Relations, by telephone at 800-333-5475 or by going to CECO’s Investor page on its corporate website at www.cecoenviro.com; or (2) PMFG, Inc. by mail at 14651 North Dallas Parkway Suite 500, Dallas, Texas 75254, Attention: Investor Relations, by telephone at 877-879-7634, or by going to PMFG, Inc.’s Investors page on its corporate website at www.pmfginc.com. A final prospectus/proxy statement will be mailed to CECO’s stockholders and shareholders of PMFG.
Non-GAAP
Today’s presentation also contains non-GAAP financial measures. For purposes of Regulation G, a non-GAAP financial measure is a numerical measure of historical or future financial performance that excludes amounts that are included in the most directly comparable measure calculated and p resented in accordance with GAAP in the statement of income, balance sheet or statement of cash flows (or equivalent statements). In accordance with the requirements of Regulation G, the table in the Appendix to the presentation slides presents the most directly comparable GAAP financial measure and reconciles non -GAAP adjusted EBITDA to the comparable GAAP measure. Adjusted EBITDA is not calculated in accordance with GAAP, and should be considered supplemental to, and not as a substitute for, or superior to, financial measures calculated in accordance with GAAP.
Proxy Solicitation
CECO and PMFG, and certain of their respective directors, executive officers and other members of management and employees may be deemed participants in the solicitation of proxies in connection with the proposed transactions. Information about the directors and executive officers of CECO is set forth in the proxy statement for CECO’s 2015 annual meeting of stockholders and CECO’s 10-K for the year ended December 31, 2014. Information about the directors and executive officers of PMFG is set forth in the proxy statement for PMFG’s 2014 annual meeting of shareholders and PMFG’s Form 10-K for the year ended June 28, 2014. Investors may obtain additional information regarding the interests of such participants in the proposed transactions by reading the prospectus/proxy statement for such proposed transactions when it becomes available.
| 2 |
|
|
|
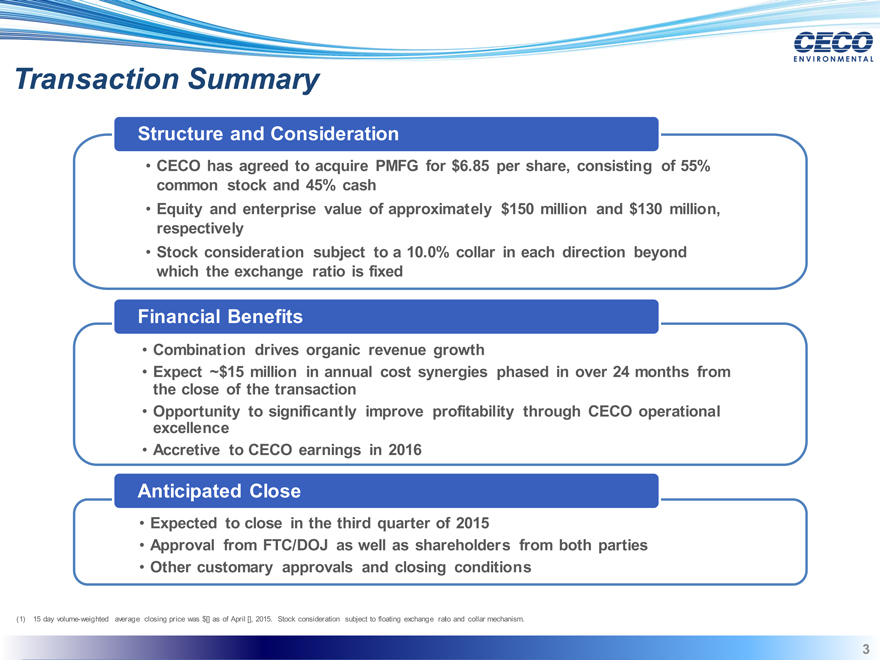
Transaction Summary
Structure and Consideration
CECO has agreed to acquire PMFG for $6.85 per share, consisting of 55% common stock and 45% cash Equity and enterprise value of approximately $150 million and $130 million, respectively Stock consideration subject to a 10.0% collar in each direction beyond which the exchange ratio is fixed
Financial Benefits
Combination drives organic revenue growth
Expect ~$15 million in annual cost synergies phased in over 24 months from the close of the transaction Opportunity to significantly improve profitability through CECO operational excellence Accretive to CECO earnings in 2016
Anticipated Close
Expected to close in the third quarter of 2015
Approval from FTC/DOJ as well as shareholders from both parties Other customary approvals and closing conditions
(1) 15 day volume-weighted average closing price was $[] as of April [], 2015. Stock consideration subject to floating exchange ratio and collar mechanism.
| 3 |
|
|
|
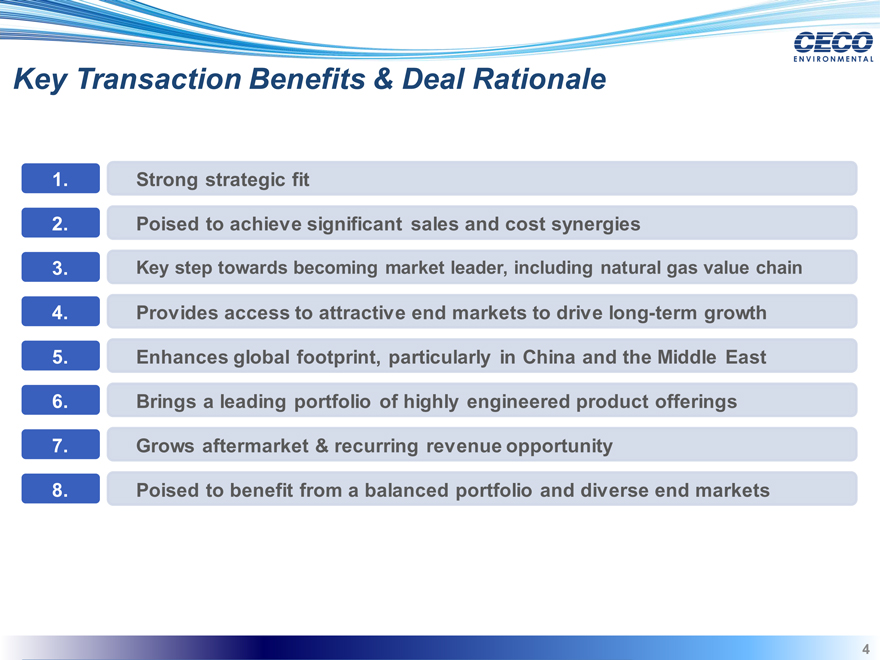
Key Transaction Benefits & Deal Rationale
1. Strong strategic fit
2. Poised to achieve significant sales and cost synergies
3. Key step towards becoming market leader, including natural gas value chain
4. Provides access to attractive end markets to drive long-term growth
5. Enhances global footprint, particularly in China and the Middle East
6. Brings a leading portfolio of highly engineered product offerings
7. Grows aftermarket & recurring revenue opportunity
8. Poised to benefit from a balanced portfolio and diverse end markets
| 4 |
|
|
|
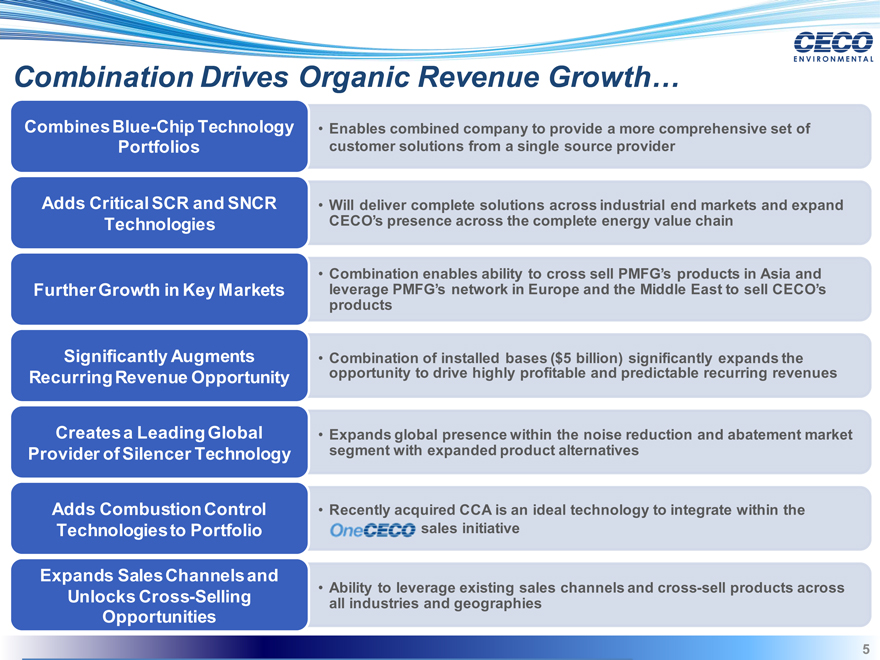
Combination Drives Organic Revenue Growth…
Combines Blue-Chip Technology Portfolios
Adds Critical SCR and SNCR Technologies
Further Growth in Key Markets
Significantly Augments Recurring Revenue Opportunity
Creates a Leading Global Provider of Silencer Technology
Adds Combustion Control Technologies to Portfolio
Expands Sales Channels and Unlocks Cross-Selling Opportunities
Enables combined company to provide a more comprehensive set of customer solutions from a single source provider
Will deliver complete solutions across industrial end markets and expand CECO’s presence across the complete energy value chain
Combination enables ability to cross sell PMFG’s products in Asia and leverage PMFG’s network in Europe and the Middle East to sell CECO’s products
Combination of installed bases ($5 billion) significantly expands the opportunity to drive highly profitable and predictable recurring revenues
Expands global presence within the noise reduction and abatement market segment with expanded product alternatives
Recently acquired CCA is an ideal technology to integrate within the sales initiative
Ability to leverage existing sales channels and cross-sell products across all industries and geographies
| 5 |
|
|
|
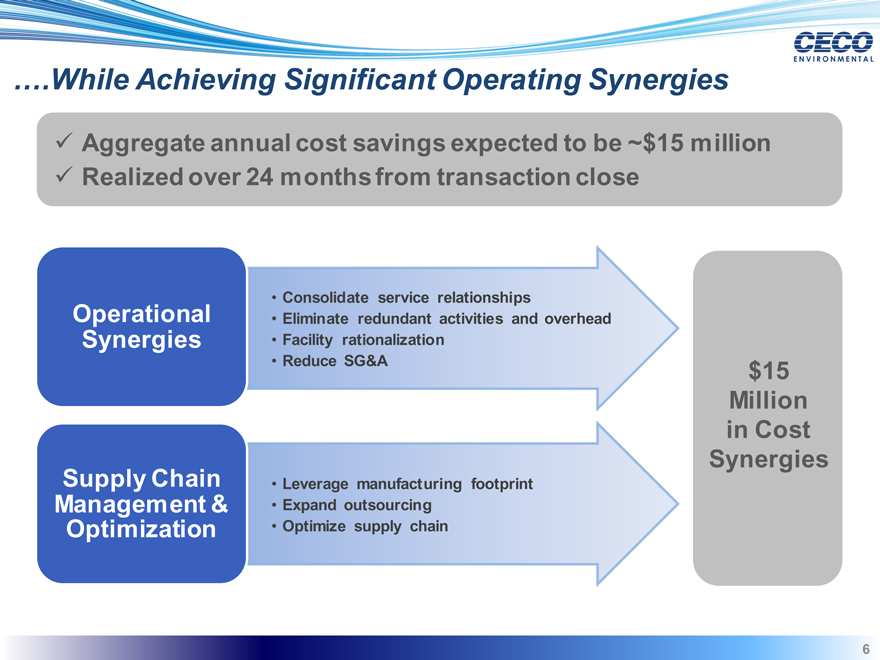
….While Achieving Significant Operating Synergies
Aggregate annual cost savings expected to be ~$15 million Realized over 24 months from transaction close
Operational
Synergies
Supply Chain
Management & Optimization
Consolidate service relationships
Eliminate redundant activities and overhead Facility rationalization Reduce SG&A
Leverage manufacturing footprint
Expand outsourcing
Optimize supply chain
$15
Million in Cost
Synergies
| 6 |
|
|
|
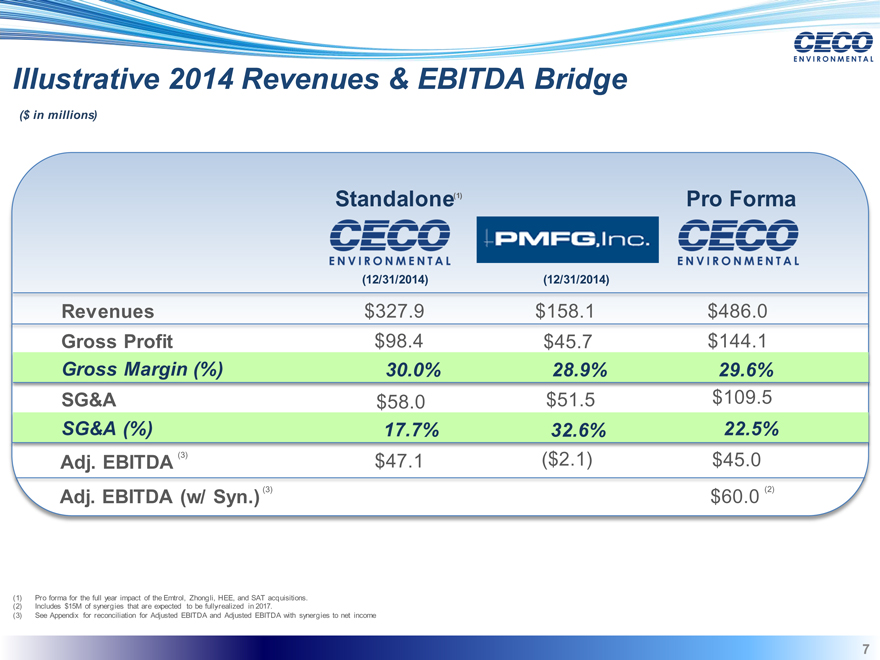
Illustrative 2014 Revenues & EBITDA Bridge
($ in millions)
Standalone(1) Pro Forma
(12/31/2014) (12/31/2014)
Revenues $327.9 $158.1 $486.0
Gross Profit $98.4 $45.7 $144.1
Gross Margin (%) 30.0% 28.9% 29.6%
SG&A $58.0 $51.5 $109.5
SG&A (%) 17.7% 32.6% 22.5%
Adj. EBITDA (3) $47.1 ($2.1) $45.0
Adj. EBITDA (w/ Syn.) (3) $60.0 (2)
| (1) |
|
Pro forma for the full year impact of the Emtrol, Zhongli, HEE, and SAT acquisitions. |
| (2) |
|
Includes $15M of synergies that are expected to be fully-realized in 2017. |
| (3) |
|
See Appendix for reconciliation for Adjusted EBITDA and Adjusted EBITDA with synergies to net income |
| 7 |
|
|
|
Summary
Combines two industry leaders into one premier organization Poised to achieve significant sales growth and cost synergies Provides access to attractive end markets to enhance global growth Grows aftermarket and recurring revenue opportunity Strong balance sheet and cash flow to support growth Drives long term value creation for shareholders
| 8 |
|
|
|
Appendix
9
|
|
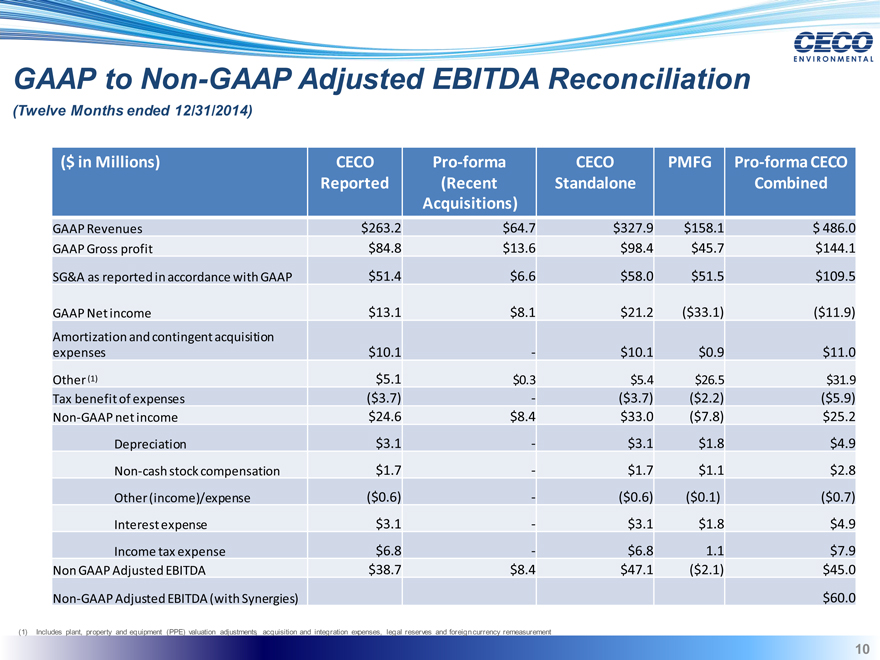
GAAP to Non-GAAP Adjusted EBITDA Reconciliation
(Twelve Months ended 12/31/2014)
($ in Millions) CECO Pro-forma CECO PMFG Pro-forma CECO
Reported (Recent Standalone Combined
Acquisitions)
GAAP Revenues $263.2 $64.7 $327.9 $158.1 $ 486.0
GAAP Gross profit $84.8 $13.6 $98.4 $45.7 $144.1
SG&A as reported in accordance with GAAP $51.4 $6.6 $58.0 $51.5 $109.5
GAAP Net income $13.1 $8.1 $21.2 ($33.1) ($11.9)
Amortization and contingent acquisition
expenses $10.1—$10.1 $0.9 $11.0
Other (1) $5.1 $0.3 $5.4 $26.5 $31.9
Tax benefit of expenses ($3.7)—($3.7) ($2.2) ($5.9)
Non-GAAP net income $24.6 $8.4 $33.0 ($7.8) $25.2
Depreciation $3.1—$3.1 $1.8 $4.9
Non-cash stock compensation $1.7—$1.7 $1.1 $2.8
Other (income)/expense ($0.6)—($0.6) ($0.1) ($0.7)
Interest expense $3.1—$3.1 $1.8 $4.9
Income tax expense $6.8—$6.8 1.1 $7.9
Non GAAP Adjusted EBITDA $38.7 $8.4 $47.1 ($2.1) $45.0
Non-GAAP Adjusted EBITDA (with Synergies) $60.0
(1) Includes plant, property and equipment (PPE) valuation adjustments, acquisition and integration expenses, legal reserves and foreign currency remeasurement
10