Attached files
| file | filename |
|---|---|
| 8-K - FORM 8-K - PUBLIC SERVICE ENTERPRISE GROUP INC | d919115d8k.htm |
| EX-99 - EX-99 - PUBLIC SERVICE ENTERPRISE GROUP INC | d919115dex99.htm |
 Public Service Enterprise Group
PSEG Earnings Conference Call
1
st
Quarter
2015
May 1, 2015
EXHIBIT 99.1 |
| 1
Forward-Looking Statement
Certain of the matters discussed in this report about our and our subsidiaries' future
performance, including, without limitation, future revenues, earnings, strategies, prospects, consequences and all
other statements that are not purely historical constitute “forward-looking
statements” within the meaning of the Private Securities Litigation Reform Act of 1995. Such forward-looking statements
are subject to risks and uncertainties, which could cause actual results to differ materially
from those anticipated. Such statements are based on management's beliefs as well as assumptions made by
and information currently available to management. When used herein, the words
“anticipate,” “intend,” “estimate,” “believe,” “expect,” “plan,” “should,” “hypothetical,” “potential,” “forecast,”
“project,” variations of such words and similar expressions are intended to identify
forward-looking statements. Factors that may cause actual results to differ are often presented with the forward-
looking statements themselves. Other factors that could cause actual results to differ
materially from those contemplated in any forward-looking statements made by us herein are discussed in filings
we make with the United States Securities and Exchange Commission (SEC), including our Annual
Report on Form 10-K and subsequent reports on Form 10-Q and Form 8-K and available on our
website: http://www.pseg.com. These factors include, but are not limited to:
•
adverse changes in the demand for or the price of the capacity and energy that we sell into
wholesale electricity markets, •
adverse changes in energy industry law, policies and regulation, including market structures
and transmission planning, •
any inability of our transmission and distribution businesses to obtain adequate and timely
rate relief and regulatory approvals from federal and state regulators, •
changes in federal and state environmental regulations and enforcement that could increase our
costs or limit our operations, •
changes in nuclear regulation and/or general developments in the nuclear power industry,
including various impacts from any accidents or incidents experienced at our facilities or by
others in the industry, that could limit operations of our nuclear generating units,
•
actions or activities at one of our nuclear units located on a multi-unit site that might
adversely affect our ability to continue to operate that unit or other units located at the same site,
•
any inability to manage our energy obligations, available supply and risks,
•
adverse outcomes of any legal, regulatory or other proceeding, settlement, investigation or
claim applicable to us and/or the energy industry, •
any deterioration in our credit quality or the credit quality of our counterparties,
•
availability of capital and credit at commercially reasonable terms and conditions and our
ability to meet cash needs, •
changes in the cost of, or interruption in the supply of, fuel and other commodities necessary
to the operation of our generating units, •
delays in receipt of necessary permits and approvals for our construction and development
activities, •
delays or unforeseen cost escalations in our construction and development activities,
•
any inability to achieve, or continue to sustain, our expected levels of operating
performance, •
any equipment failures, accidents, severe weather events or other incidents that impact our
ability to provide safe and reliable service to our customers, and any inability to obtain
sufficient insurance coverage or recover proceeds of insurance with respect to such events,
•
acts of terrorism, cybersecurity attacks or intrusions that could adversely impact our
businesses, •
increases in competition in energy supply markets as well as for transmission projects,
•
any inability to realize anticipated tax benefits or retain tax credits,
•
challenges associated with recruitment and/or retention of a qualified workforce,
•
adverse performance of our decommissioning and defined benefit plan trust fund investments and
changes in funding requirements, •
changes in technology, such as distributed generation and micro grids, and greater reliance on
these technologies, and •
changes in customer behaviors, including increases in energy efficiency, net-metering and
demand response. All of the forward-looking statements made in this report are qualified by these
cautionary statements and we cannot assure you that the results or developments anticipated by management will be
realized or even if realized, will have the expected consequences to, or effects on, us or our
business prospects, financial condition or results of operations. Readers are cautioned not to place undue
reliance on these forward-looking statements in making any investment decision.
Forward-looking statements made in this report apply only as of the date of this report. While we may elect to
update forward-looking statements from time to time, we specifically disclaim any
obligation to do so, even if internal estimates change, unless otherwise required by applicable securities laws.
The forward-looking statements contained in this report are intended to qualify for the
safe harbor provisions of Section 27A of the Securities Act of 1933, as amended, and Section 21E of the
Securities Exchange Act of 1934, as amended. |
 2
GAAP Disclaimer
PSEG presents Operating Earnings and Adjusted Earnings Before Interest, Taxes,
Depreciation and
Amortization
(EBITDA)
in
addition
to
its
Net
Income
reported
in
accordance
with
accounting
principles generally accepted in the United States (GAAP). Operating Earnings and
Adjusted EBITDA are non-GAAP financial measures that differ from Net
Income. Operating Earnings exclude gains or losses associated with Nuclear
Decommissioning Trust (NDT), Mark-to-Market (MTM) accounting, and
other material one-time items. PSEG presents Operating Earnings
because
management
believes
that
it
is
appropriate
for
investors
to
consider
results
excluding
these items in addition to the results reported in accordance with GAAP. PSEG
believes that the non-GAAP financial measures of Operating Earnings
provides a consistent and comparable measure of performance of its
businesses to help shareholders understand performance trends. PSEG
is
presenting
Adjusted
EBITDA
because
it
provides
investors
with
additional
information
to
compare our business performance to other companies and understand performance
trends. Adjusted EBITDA excludes the same items as our Operating Earnings
measure as well as income tax expense, interest expense, depreciation and
amortization and major maintenance expense
costs
at
Power’s
fossil
generation
facilities.
This
information
is
not
intended
to
be
viewed
as an alternative to GAAP information. The last two slides in this presentation
(Slides A and B) include
a
list
of
items
excluded
from
Net
Income
to
reconcile
to
Operating
Earnings
and
Adjusted
EBITDA with a reference to that slide included on each of the slides where the
non-GAAP information appears.
These
materials
and
other
financial
releases
can
be
found
on
the
pseg.com
website
under
the
investor
tab,
or
at
http://investor.pseg.com/ |
| PSEG
2015 Q1 Review
Ralph Izzo
Chairman, President and Chief Executive Officer
*
*
*
*
*
*
*
*
*
* |
 4
Q1 Earnings Summary –
PSEG Delivers Strong Operating Results
$ millions (except EPS)
2015
2014
Operating Earnings
$ 529
$ 515
Reconciling Items, Net of Tax
57
(129)
Net Income
$ 586
$ 386
EPS from Operating Earnings*
$ 1.04
$ 1.01
Quarter ended March 31
*
See
Slide
A
for
Items
excluded
from
Net
Income
to
reconcile
to
Operating
Earnings. |
 5
PSEG –
Q1 2015 Highlights
Strong Operating Earnings
Operating earnings of $1.04 per share vs. $1.01 per share in Q1 2014
Power benefited from higher prices on its hedged output, monetization of its
gas supply and improved performance from CCGTs
Increased earnings contribution from PSE&G’s investment in transmission
Operational Excellence
PSEG Power CCGT units improved fleet availability; nuclear capacity factor at
95% Diversity and location of Power’s fleet provided flexibility to
participate in market PSE&G maintained high system reliability during a
record-setting cold winter PSEG Disciplined Capital Investment
Increased
common
dividend
to
indicative
annual
rate
of
$1.56
per
share
BPU
approved
Energy
Efficiency
Extension
II
for
additional
$95
million
investment
Transmission projects in construction –
on schedule and on budget
S-R expected to be fully energized in May (Hopatcong to Susquehanna)
Settlement reached on Superstorm Sandy-related insurance claims fully
compensates PSEG for repairs covered by our policies |
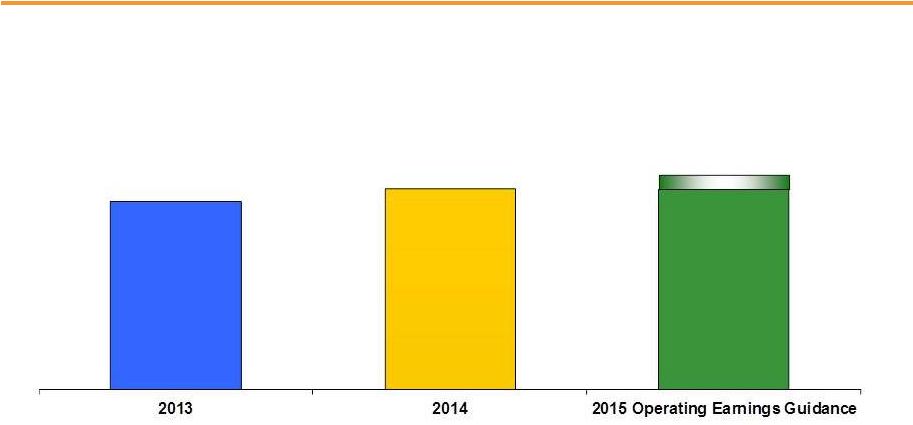 6
$2.75 -
$2.95E
PSEG –
Maintaining 2015 Guidance
$2.58
*
See
Slide
A
for
Items
excluded
from
Net
Income
to
reconcile
to
Operating
Earnings.
E
=
Estimate.
$2.76
2015 guidance reflects continued increased level of investment,
and assumes normal weather and unit operations |
| PSEG
2015 Q1 Operating Company Review
Caroline Dorsa
EVP and Chief Financial Officer
*
*
*
*
*
*
*
*
*
* |
 8
Q1 Operating Earnings by Subsidiary
Operating Earnings
Earnings per Share
$ millions (except EPS)
2015
2014
2015
2014
PSE&G
$ 242
$ 214
$ 0.47
$ 0.42
PSEG Power
278
293
0.55
0.58
PSEG Enterprise/Other
9
8
0.02
0.01
Operating Earnings*
$ 529
$ 515
$ 1.04
$ 1.01
Quarter ended March 31
*
See
Slide
A
for
Items
excluded
from
Net
Income
to
reconcile
to
Operating
Earnings. |
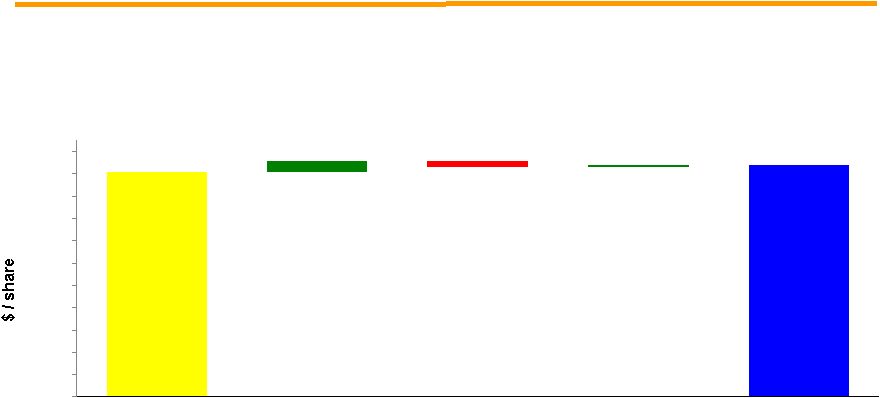 9
$1.01
0.05
0.01
$1.04
(0.03)
0.00
0.10
0.20
0.30
0.40
0.50
0.60
0.70
0.80
0.90
1.00
1.10
PSEG EPS Reconciliation –
Q1 2015 versus Q1 2014
Q1 2015
Operating
Earnings*
Q1 2014
Operating
Earnings*
PSEG Power
PSE&G
PSEG
Enterprise/
Other
*
See
Slide
A
for
Items
excluded
from
Net
Income
to
reconcile
to
Operating
Earnings.
Capacity (0.09)
Gas Send-Out 0.04
Higher Pension
Expense (0.01)
Absence of
Charge 0.03
Transmission
Earnings 0.03
Gas Volume &
Demand 0.01
Storm Insurance
Recovery 0.01
Interest Income
and
PSEG
Long Island |
| PSE&G
2015 Q1 Review
*
*
*
*
*
*
*
*
*
* |
 11
PSE&G –
Q1 EPS Summary
$ millions (except EPS)
Q1 2015
Q1 2014
Variance
Operating Revenues
$ 2,002
$ 2,145
$ (143)
Operating Expenses
Energy Costs
892
1,045
(153)
Operation & Maintenance
412
462
(50)
Depreciation & Amortization
247
227
20
Total Operating Expenses
1,551
1,734
(183)
Operating Earnings/Net Income
$ 242
$ 214
$ 28
EPS from Operating Earnings/Net Income
$ 0.47
$ 0.42
$ 0.05 |
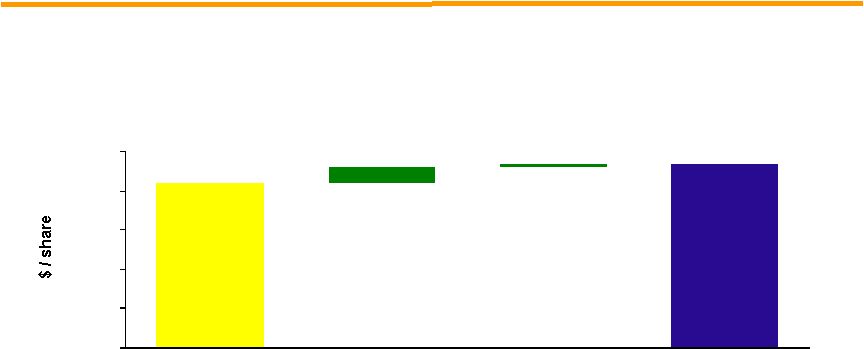 12
PSE&G EPS Reconciliation –
Q1 2015 versus Q1 2014
$0.42
0.04
0.01
$0.47
0.00
0.10
0.20
0.30
0.40
0.50
Transmission
Earnings 0.03
Gas Volume
& Demand 0.01
Storm Insurance
Recovery
Q1 2014
Operating
Earnings*
Q1 2015
Operating
Earnings*
* Operating Earnings is equal to Net Income. |
 13
PSE&G –
Q1 2015 Operating Highlights
Operations
BPU approved $95 million Energy Efficiency Extension II in April; investment over
next 3 years Gas
System
Modernization
Program
filed
with
the
BPU
in
February;
first
phase
proposes to spend $1.6 billion over 5 years to replace aging cast iron and
unprotected steel pipes PSE&G extended BGSS gas rate credits through
April 2015; this winter’s total PSE&G bill credit is ~$236, or a
32% savings for the average gas customer (Nov 2014-April 2015)
Susquehanna-Roseland transmission line expected fully in service for Summer
2015 Regulatory and Market
Environment
PSE&G invested ~$600 million in T&D upgrades during Q1 as part of its
full-year, $2.6 billion investment program
PSE&G operating earnings* for full-year 2015 are forecast at $735 million
to $775 million Financial
Coldest
Q1
in
over
45
years:
Heating
degree
days
were
5.7%
above
last
winter
and
25%
above
normal
Weather
normalized
electric
sales:
Slight
overall
improvement
of
0.2%,
led
by
the
commercial
and
industrial segment
Gas
deliveries
continue
to
benefit
from
low
commodity
prices
and
modest
economic
growth,
weather
adjusted
deliveries
grew
by
0.4%,
led
by
a
1%
advance
in
the
residential
segment
* Operating Earnings is equal to Net Income. |
| PSEG
Power 2015 Q1 Review
*
*
*
*
*
*
*
*
*
* |
 15
PSEG Power –
Q1 Earnings Summary
$ millions (except EPS)
Q1 2015
Q1 2014
Variance
Operating Revenues
$ 1,725
$ 1,700
$ 25
Operating Earnings
$ 278
$ 293
$ (15)
Reconciling Items, Net of Tax*
57
(129)
186
Net Income
$ 335
$ 164
$ 171
EPS from Operating Earnings*
$ 0.55
$ 0.58
$ (0.03)
Adjusted EBITDA**
$ 626
$ 651
$ (25)
*
See
Slide
A
for
Items
excluded
from
Net
Income
to
reconcile
to
Operating
Earnings; Includes the financial impact from Mark-to-Market positions with
forward delivery months. ** See Slide B for a reconciliation of Adjusted
EBITDA to Operating Earnings and Net Income. E = Estimate |
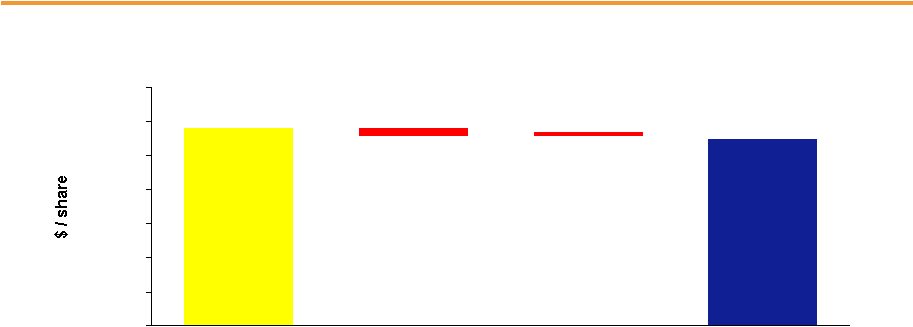 16
$0.58
$0.55
(0.01)
0.00
0.10
0.20
0.30
0.40
0.50
0.60
0.70
(0.02)
Capacity (0.09)
Gas
Send-Out 0.04
Absence of
Charge 0.03
PSEG Power EPS Reconciliation –
Q1 2015 versus Q1 2014
Q1 2015
Operating
Earnings*
Q1 2014
Operating
Earnings*
Higher
Pension
Expense
* See Slide A for Items excluded from Net Income to reconcile to
Operating Earnings. |
 PSEG
Power’s Q1 2015 and Full-Year 2015 Guidance for Adjusted EBITDA
Three Months Ended
March 31,
Full-Year 2015
Guidance
($ in millions)
2015
2014
Low
High
Operating Earnings**
$278
$293
$620
$680
Add:
Fossil Major Maintenance, pre-tax
49
58
115
115
Depreciation & Amortization, pre-tax
77
73
305
305
Interest Expense, pre-tax
31
31
125
125
Income Taxes
191
196
380
420
Adjusted EBITDA
$626
$651
$1,545E
$1,645E
17
PSEG Power -
Adjusted EBITDA*
* See Slide B for a reconciliation of Adjusted EBITDA to
Operating Earnings and Net Income. E = Estimate. ** See
Slide A for Items excluded from Net Income to reconcile to Operating Earnings; Includes the financial impact from Mark-to-Market positions with forward delivery months. |
 18
PSEG Power –
Generation Measures
8,049
7,832
3,975
4,177
2,529
2,541
0
7,500
15,000
2014
2015
Quarter ended March 31
Total Nuclear
Total Coal*
Oil & Natural Gas
Generation by Fuel (GWh)**
14,538
Quarter ended March 31
* Includes figures for Pumped Storage. Also includes natural gas fuel
switching intervals. ** Excludes Solar and Kalaeloa
2014
2015
Combined
Cycle
PJM and NY
49%
55%
Coal*
NJ (Coal/Gas)
21%
17%
PA
83%
91%
CT
73%
68%
Nuclear
100%
95%
14,565
Fleet Capacity Factors (%) |
 19
PSEG Power –
Fuel Costs
Quarter ended March 31
($ millions)
2014
2015
Coal
$87
$82
Oil & Gas
365
247
Total Fossil
452
329
Nuclear
62
55
Total Fuel
Cost
$514
$384
Total
Generation
(GWh)
14,565
14,538
$ / MWh
35.29
26.41
PSEG Power –
Fuel Costs |
 20
PSEG Power –
Gross Margin Performance
$0
$15
$30
$45
$60
2013
2014
2015
$47
$48
Quarter ended March 31
Hedging profile captured returns amid lower price volatility than in Q1 2014
Q1 spot prices significantly lower across PJM, ISO-NE, and NYISO versus year
ago Capacity prices were lower year-over-year
Access to lower-cost Marcellus gas continues to benefit spark spreads
Q1 2015 Regional Performance
Region
Gross
Margin ($M)
Comment
PJM
$623
Higher prices on hedged output offset
lower wholesale market prices and a
decline in capacity revenue
New
England
$51
Hedging profile improved margins
offsetting lower market prices
New York
$13
Higher volumes with improved fuel
availability
PSEG Power Gross Margin ($/MWh)
$50 |
 21
Hedging Update
Contracted Energy*
* Hedge percentages and prices as of March 31, 2015. Revenues of full
requirement load deals based on contract price, including renewable energy credits, ancillary, and transmission
components but excluding capacity.
Hedges include positions with MTM accounting treatment and options.
Apr-Dec
2015
2016
2017
Volume TWh
26
37
37
Base Load
% Hedged
100%
80-85%
40-45%
(Nuclear and Base Load Coal)
Price $/MWh
$52
$51
$52
Volume TWh
17
20
20
Intermediate Coal, Combined
% Hedged
30-35%
0%
0%
Cycle, Peaking
$52
--
--
Volume TWh
41-43
55-57
55-57
Total
% Hedged
70-75%
50-55%
25-30%
Price $/MWh
$52
$51
$52
Price $/MWh |
 22
PSEG Power –
Q1 Operating Highlights
Q1 output flat with Q1 2014 at 14.5 GWh
Nuclear fleet’s capacity factor at 95%
CCGT production up 16% to 3.9 TWh on improved availability at Linden
Operations
Regulatory and Market
Environment
Financial
PJM’s Capacity Performance (CP) proposal pending at FERC
FERC granted PJM request to postpone Reliability Pricing Model (RPM) auction for
the 2018/2019 delivery year
Base load output in 2015 hedged at an average price of $52/MWh vs. 2014
average hedge price of $48/MWh
2015 BGS load projected at 11-12 TWh
Bergen
and
Peach
Bottom
2
capacity
uprates
scheduled
to
add
96MW
for
Summer
2015
Power’s total debt as a percentage of capitalization at March 31 was 31%
Power’s operating earnings* for full-year 2015 are forecast at $620
million to $680 million, and Adjusted EBITDA** at $1.55 billion to $1.65
billion *
See
Slide
A
for
Items
excluded
from
Net
Income
to
reconcile
to
Operating
Earnings;
Includes
the
financial
impact
from
Mark-to-Market
positions
with
forward
delivery
months.
**
See
Slide
B
for
a
reconciliation
of
Adjusted
EBITDA
to
Operating
Earnings
and
Net
Income.
E
=
Estimate. |
| PSEG
*
*
*
*
*
*
*
*
*
*
* |
 24
PSEG Financial Highlights
Maintaining 2015 operating earnings guidance of $2.75 -
$2.95 per share
Focused on maintaining operating efficiency and customer reliability
PSE&G expected to contribute over 50% of 2015 operating earnings
Infrastructure Spend
PSE&G T&D spend for 2015 expected to be $2.6 billion
PSE&G received approval in April 2015 from the NJ Board of Public Utilities
(BPU) to invest an additional $95 million over a three-year period on
Energy Efficiency programs Utility’s Gas System Modernization Program
filed with the BPU in February; first phase proposes to spend $1.6 billion
over 5 years to replace aging cast iron and unprotected steel pipes
Power’s AGP and nuclear uprate programs ongoing
Financial position remains strong
Positive cash from Power and increasing cash flow from operations at PSE&G
supports dividend growth and funds capital spending program without the need
to issue equity Debt as a percentage of capitalization was 41% at March
31 Increased common dividend 5.4% to indicative annual rate of $1.56 per
share Increasing regulated earnings mix supports dividend growth
|
 25
PSEG Sandy-related insurance settlement proceeds
($ millions, pre-tax)
Pre-2015
Q1 2015
Q2 2015E
Total
PSEG Power
$44
$133
TBD
TBD
PSE&G
6
26**
TBD
TBD
PSEG
$50*
$159
~$54***
~$264
* PSE&G received $6 million of insurance settlement proceeds
in Q4 2012. Power received $19 million and $25 million of
insurance settlement proceeds in Q4 2012 and Q2 2013, respectively.
** PSE&G share of proceeds reduced O&M; Property, Plant and
Equipment; and Regulatory Assets. ***The amounts to be recorded by PSEG Power
and PSE&G will be determined in second quarter 2015. TBD = To Be Determined. |
 26
PSEG 2015 Guidance for Operating Income –
by Subsidiary
and PSEG Power Adjusted EBITDA
$ millions (except EPS)
2015E
2014
PSE&G
$735 -
$775
$725
PSEG Power
$620 -
$680
$642
PSEG Enterprise/Other
$40 -
$45
$33
Operating Earnings*
$1,395 -
$1,500
$1,400
Earnings per Share
$2.75 -
$2.95E
$2.76
Anticipates Another Year of Growth in Operating Earnings
$ millions (except EPS)
2015E
2014
PSEG Power
$1,545 -
$1,645
$1,584
PSEG Power Adjusted EBITDA**
* See Slide A for Items excluded from Net Income to reconcile to Operating Earnings;
Includes the financial impact from Mark-to-Market positions with forward delivery months.
** See Slide B for a reconciliation of Adjusted EBITDA to Operating Earnings and Net
Income. E = Estimate. |
 PSEG
Liquidity as of March 31, 2015 27
Expiration
Total
Available
Company
Facility
Date
Facility
Usage
Liquidity
($Millions)
PSE&G
5-year Credit Facility
Mar-18
$600
(A,C)
$14
$586
5-Year Credit Facility (Power)
Apr-19
$1,600
$178
$1,422
5-Year Credit Facility (Power)
Mar-18
$1,000
(A,D)
$0
$1,000
5-Year Bilateral (Power)
Sep-15
$100
$0
$100
5-year Credit Facility (PSEG)
Apr-19
$500
$8
$492
5-year Credit Facility (PSEG)
Mar-18
$500
(A,B)
$0
$500
Total
$4,300
$200
$4,100
(A) In April 2015, expiration dates of these facilities were extended to April
2020. $636
(B) PSEG facility will be reduced by $23 million in April 2016, and $12 million in
March 2018. PSE&G ST Investment
$316
(C) PSE&G facility will be reduced by $29 million in April 2016,
and $14 million in March 2018.
Total Liquidity Available
$5,052
Total Parent / Power Liquidity
$4,150
PSEG /
Power
PSEG Money Pool ST Investment
(D) Power facility will be reduced by $48 million in April 2016,
and $24 million in March 2018. |
 A
Items Excluded from Net Income to Reconcile to Operating Earnings
Please see Slide 2 for an explanation of PSEG’s use of Operating Earnings as a
non-GAAP financial measure and how it differs from Net Income.
2015
2014
2014
2013
Operating Earnings
529
$
515
$
1,400
$
1,309
$
Gain (Loss) on Nuclear Decommissioning Trust (NDT)
Fund Related Activity (PSEG Power)
2
9
68
40
Gain (Loss) on Mark-to-Market (MTM)
(a)
(PSEG Power)
(20)
(132)
66
(74)
Storm
O&M,
net
of
insurance
recoveries
(PSEG
Power)
75
(6)
(16)
(32)
Net Income
586
$
386
$
1,518
$
1,243
$
Fully Diluted Average Shares Outstanding (in Millions)
508
508
508
508
Operating Earnings
1.04
$
1.01
$
2.76
$
2.58
$
Gain (Loss) on NDT Fund Related Activity (PSEG Power)
-
0.02
0.13
0.08
Gain (Loss) on MTM
(a)
(PSEG Power)
(0.04)
(0.26)
0.13
(0.14)
Storm O&M, net of insurance recoveries (PSEG Power)
0.15
(0.01)
(0.03)
(0.07)
Net Income
1.15
$
0.76
$
2.99
$
2.45
$
(a) Includes the financial impact from positions with forward delivery
months. ($ Millions, Unaudited)
($ Per Share Impact -
Diluted, Unaudited)
PUBLIC SERVICE ENTERPRISE GROUP INCORPORATED
Consolidated Operating Earnings Reconciliation
Reconciling Items, net of tax
Three Months Ended
Year Ended
March 31,
December 31, |
 B
Items Excluded from Net Income to Reconcile to Operating Earnings
and Adjusted EBITDA
Please see Slide 2 for an explanation of PSEG’s use of Operating Earnings and
Adjusted EBITDA as non-GAAP financial measures and how they differ from Net
Income. 2015
2014
Adjusted EBITDA
626
$
651
$
Fossil Major Maintenance, pre-tax
(49)
(58)
Depreciation and Amortization, pre-tax
(b)
(77)
(73)
Interest Expense, pre-tax
(b)
(31)
(31)
Income Taxes
(b)
(191)
(196)
Operating Earnings
278
$
293
$
Gain (Loss) on NDT Fund Related Activity, pre-tax
7
19
Gain (Loss) on MTM, pre-tax
(a)
(34)
(223)
Storm O&M, net of insurance recoveries, pre-tax
127
(10)
Income Taxes related to Operating Earnings
(43)
85
Net Income
335
$
164
$
(a) Includes the financial impact from positions with forward delivery
months. (b) Excludes amounts related to Operating Earnings reconciling items
($ Millions, Unaudited)
PSEG Power Adjusted EBITDA Reconcilation
Reconciling Items
Three Months Ended
March 31,
2014
1,584
$
(144)
(291)
(120)
(387)
642
$
138
111
(27)
(104)
760
$
Year Ended
December 31,
reconciling items |