Attached files
| file | filename |
|---|---|
| EX-99.1 - EX-99.1 - Virtu KCG Holdings LLC | d918786dex991.htm |
| 8-K - FORM 8-K - Virtu KCG Holdings LLC | d918786d8k.htm |
 KCG Holdings, Inc. (NYSE: KCG)
1st Quarter 2015 Earnings Presentation
May 1, 2015
Exhibit 99.2 |
 Certain statements contained herein may constitute "forward-looking
statements" within the meaning of the safe harbor provisions of the
U.S. Private Securities Litigation Reform Act of 1995. Forward-looking
statements are typically identified by words such as "believe,"
"expect," "anticipate," "intend," "target,"
"estimate," "continue," "positions," "prospects" or "potential," by future conditional verbs such as
"will," "would," "should," "could" or
"may," or by variations of such words or by similar expressions. These "forward-looking statements"
are not historical facts and are based on current expectations, estimates and
projections about KCG's industry, management's beliefs and certain
assumptions made by management, many of which, by their nature, are inherently uncertain and beyond our control. Any
forward-looking statement contained herein speaks only as of the date on
which it is made. Accordingly, readers are cautioned that any such
forward-looking statements are not guarantees of future performance and are subject to certain risks, uncertainties and assumptions
that are difficult to predict including, without limitation, risks associated
with: (i) the strategic business combination (the "Mergers") of
Knight Capital Group, Inc. ("Knight") and GETCO Holding Company, LLC
("GETCO"), including, among other things, (a) difficulties and
delays in integrating the Knight and GETCO businesses or fully realizing cost
savings and other benefits, (b) the inability to sustain revenue and
earnings growth, and (c) customer and client reactions to the Mergers; (ii) the August 1, 2012 technology issue that resulted
in Knight's broker-dealer subsidiary sending numerous erroneous orders in
NYSE-listed and NYSE Arca securities into the market and the impact to
Knight's business as well as actions taken in response thereto and consequences thereof; (iii) the sale of KCG's reverse mortgage
origination and securitization business, sale of KCG's futures commission
merchant and the sale of KCG Hotspot; (iv) changes in market structure,
legislative, regulatory or financial reporting rules, including the increased focus by regulators, the New York Attorney General,
Congress and the media on market structure issues, and in particular, the
scrutiny of high frequency trading, alternative trading systems, market
fragmentation, colocation, access to market data feeds, and remuneration arrangements such as payment for order flow and
exchange fee structures; (v) past or future changes to organizational structure
and management; (vi) KCG's ability to develop competitive new products and
services in a timely manner and the acceptance of such products and services by KCG's customers and potential
customers; (vii) KCG's ability to keep up with technological changes; (viii)
KCG's ability to effectively identify and manage market risk, operational
and technology risk, legal risk, liquidity risk, reputational risk, counterparty and credit risk, international risk, regulatory risk,
and compliance risk; (ix) the cost and other effects of material contingencies,
including litigation contingencies, and any adverse judicial,
administrative or arbitral rulings or proceedings; (x) the effects of increased
competition and KCG's ability to maintain and expand market share; and (xi)
the commencement and completion of the proposed tender offer. The list above is not exhaustive. Readers should carefully
review the risks and uncertainties disclosed in KCG's reports with the SEC,
including, without limitation, those detailed under "Risk Factors"
in KCG's Annual Report on Form 10-K for the year-ended December 31, 2014, and other reports or documents KCG files with, or
furnishes to, the SEC from time to time.
Safe Harbor
For
additional
disclosures,
please
see
https://www.kcg.com/legal/global-disclosures. |
 1st Quarter 2015 Summary
Solid financial results amid a slight decline in U.S. equity market conditions
quarter over quarter
Market making grew the percentage of consolidated U.S. equity share and dollar
volume on both a quarter over quarter and year over year basis
KCG BondPoint grew trade volumes across Corporates, Municipals and CDs on both a
quarter over quarter and year over year basis
Completed the sale of KCG Hotspot to BATS
Raised $500 million in 6.875% Senior Secured Notes due in 2020, repaid $117
million in Convertible
Notes
upon
maturity
in
March
2015,
and
subsequent
to
the
quarter
redeemed $305 million in 8.250% Senior Secured Notes due in 2018
Subsequent to 1Q15, announced plans to launch a modified Dutch auction tender
offer for up to $330 million of common stock as part of an expanded $400
million share repurchase program
1 |
 KCG Financial Results
Pre-Tax Earnings (Loss) from Continuing Operations By Business Segment
(in thousands)
(unaudited)
For the three months ended
March 31, 2014
December 31, 2014
March 31, 2015
Market Making
Revenues
$ 277,346
$ 238,740
$ 224,548
Expenses
201,314
196,030
185,208
Pre-tax earnings
76,032
42,710
39,340
Global Execution Services
Revenues
87,220
93,369
464,266
Expenses
85,204
83,401
83,208
Pre-tax earnings
2,016
9,968
381,058
Corporate and Other
Revenues
19,091
14,030
7,342
Expenses
37,755
40,177
21,612
Pre-tax loss
(18,664)
(26,147)
(14,270)
Consolidated
Revenues
383,657
346,139
696,156
Expenses
324,273
319,608
290,028
Pre-tax earnings
$ 59,384
$ 26,531
$ 406,128
Notes:¹
2
1
See addendum for a reconciliation of GAAP to non-GAAP financial
results. 1st quarter 2015 results include a gain of $385.0 million from the sale of KCG
Hotspot as well as expenses of $11.3 million directly related to the
sale plus lease loss accruals
4th quarter 2014 results include a $2.1 million gain from the sale of KCG’s
FCM as well as expenses of $6.1 million related to lease loss accruals 1st quarter 2014 results include a gain of $9.6 million from the merger of BATS
and Direct Edge as well as expenses of $7.8 million related to debt
reduction and lease loss accruals |
 Market Conditions
3
Avg. daily volume in select securities markets
1Q14
4Q14
1Q15
Consolidated U.S. equity share volume
6.9 bn
7.1 bn
6.9 bn
854.2 mn
790.9 mn
795.2 mn
ETF share volume
789.4 mn
1,024.7 mn
1,002.9 mn
Consolidated U.S. equity dollar volume
$275.8 bn
$291.3 bn
$285.6 bn
U.S. equity futures contracts
3.8 mn
3.9 mn
3.5 mn
U.S. options contracts
17.9 mn
17.9 mn
16.3 mn
European equity notional value traded (USD)
$1,197.2 bn
$1,176.4 bn
$1,272.7 bn
Asian equity share volume
7.4 bn
6.1 bn
6.0 bn
U.S. Treasury notional volume
$522.1 bn
$507.4 bn
$531.8 bn
U.S. corporate bond notional volume
$20.8 bn
$19.8 bn
$23.9 bn
Transactions under 250 bonds
13,334
11,747
12,622
FX notional value traded (USD) among reporting venues
$232.2 bn
$271.5 bn
$271.2 bn
–
Avg. daily consolidated U.S. equity dollar and share volume
declined 2.0% and 2.8%, respectively, quarter over quarter
–
Market-wide retail trading activity remained fairly strong
relative to previous quarters
–
Avg. daily European equity notional volume rose 8.0% quarter
over quarter while Asian equity share volume declined 2.6%
–
In foreign exchange, avg. daily notional value traded among
reporting venues was flat
–
Approximate decrease in aggregate avg. daily futures volume of
4% and decrease in options volume of 9%
–
Macro events contributed to volatility among certain energy
commodities
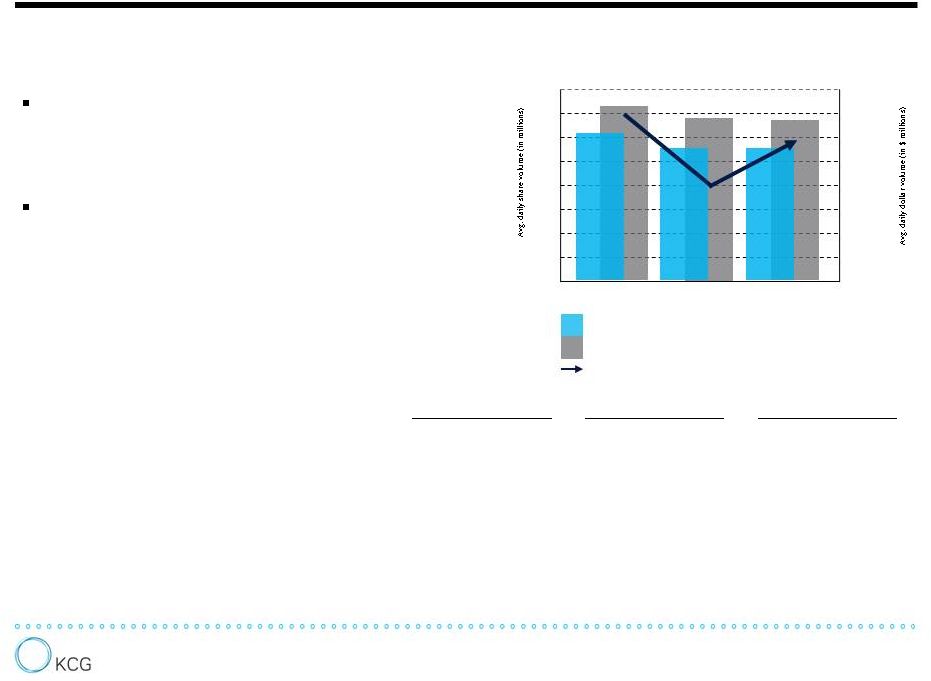
1Q15 market conditions in U.S. equities
17.3
9.7
14.6
8,000
$400,000
6,000
$300,000
4,000
$200,000
2,000
$100,000
January
February
March
1Q15
Average
daily consolidated U.S. equity share volume
Average daily consolidated U.S. equity dollar volume
Average realized volatility for the S&P 500
A slight decline in the U.S. equity market from 4Q14
Mixed market conditions in all other asset classes
“Retail”
SEC
Rule
605
U.S.
equity
share
volume
1
Sources: BATS Global Markets, VistaOne Solutions, Thomson Reuters, OCC, CSI,
Bloomberg, Reuters, EBS, SIFMA, TRACE, MSRB; 1Q15 SEC Rule 605 U.S. equity share volume includes an
estimate of March 2015 total based on public and proprietary data
1 |
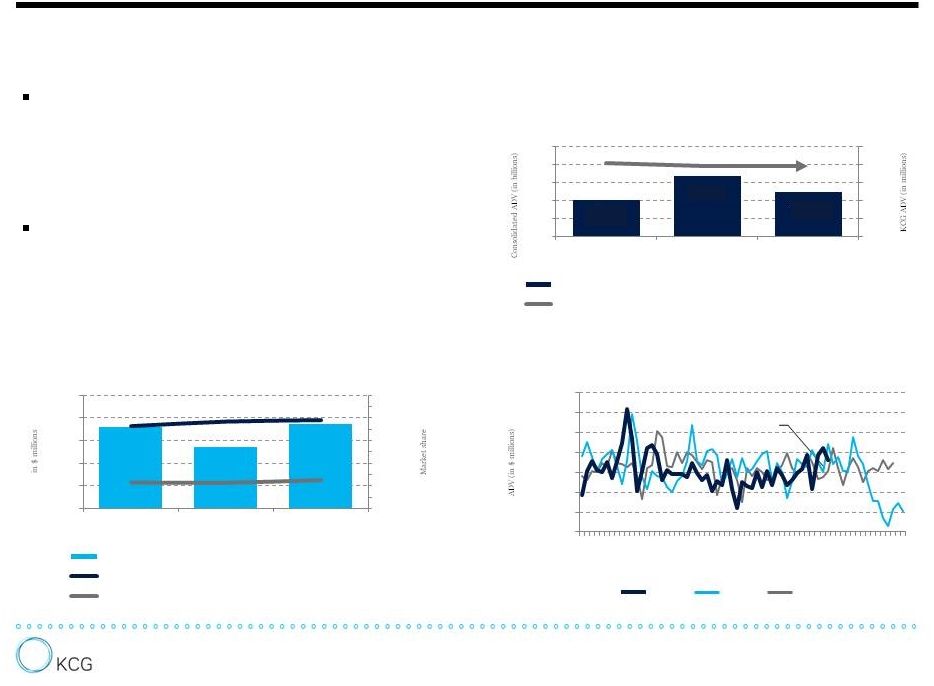
 The Market Making Segment
Revenues from U.S. equities impacted by decline in
market volumes partially offset by KCG market share
gains
A slight decline in revenues from all other asset
classes
4
1Q15 Market Making revenue distribution²
-20%
-10%
0%
10%
20%
30%
40%
50%
-$100
-$50
$0
$50
$100
$150
$200
$250
1Q14
4Q14
1Q15
Primary drivers of revenues from U.S. equities¹
KCG revenue from U.S. equity market making
Avg. daily SEC Rule 605 U.S equity share volume*
Avg. daily consolidated U.S equity dollar volume
Avg. daily consolidated U.S equity share volume
Avg. realized volatility for the S&P 500
861.9
933.4
933.0
213.2
193.3
192.5
0
200
400
600
800
1,000
1Q14
4Q14
1Q15
KCG retail and total exchange-listed volume
KCG avg. daily SEC Rule 605 U.S equity share volume
78%
22%
U.S. equities
Non-U.S. equities
KCG increased market share of consolidated dollar and share
volume quarter over quarter
KCG market share of SEC Rule 605 share volume roughly flat
quarter over quarter amidst a focus on strategic clients and
persistent strong competition
Results from U.S. Treasuries, commodities and options offset
by European equities
Sources: KCG, SEC, VistaOne Solutions; ¹ 1Q15 SEC Rule
605 share volume includes an estimate of March 2015 total based on public and proprietary data. ²
Revenue from market making in U.S.
equities of $174.7 million in the first quarter of 2015 is a factor, along with
total dollar volume during the quarter of $1.89 trillion that results in average revenue capture of 0.92 basis points. Market
making in non-U.S. equities includes European and Asian equities, fixed
income, currencies and commodities. KCG avg. daily exchange - listed
share volume |
 Strong Market-Wide Net Retail Inflows in 1Q15
KCG’s Individual Investor Gauge represents estimated market-wide
gross and net retail investor flows based on public and proprietary data
derived from monthly SEC Rule 605-eligible volume. Estimated
market-wide
net
retail
inflows
of
$62.8
billion
in
1Q15
–
an
increase
of
$33.1
billion
from
4Q14
Estimated
market-wide
gross
retail
flows
of
$1.26
trillion
in
1Q15
–
a
decrease
of
$113
billion
from
4Q14
5
$0
$100,000,000,000
$200,000,000,000
$300,000,000,000
$400,000,000,000
$500,000,000,000
$600,000,000,000
$15,000,000,000
$10,000,000,000
$5,000,000,000
$0
$5,000,000,000
$10,000,000,000
$15,000,000,000
$20,000,000,000
$25,000,000,000
$30,000,000,000
$35,000,000,000
-
-
-
Est. Market-Wide Gross and Net Retail U.S. Equity Flows
Market-Wide Net (Est.)
Market-Wide Gross (Est.) |
 The Global Execution Services Segment
6
Sources: KCG, BATS Global Markets, TRACE, MSRB, Rosenblatt
Close of sale to BATS
1Q15
4Q14
1Q14
0.0%
2.5%
5.0%
7.5%
10.0%
12.5%
15.0%
17.5%
20.0%
22.5%
25.0%
$90
$105
$120
$135
$150
$165
18.2%
19.2%
19.5%
5.8%
5.7%
6.3%
1Q14
4Q14
1Q15
Avg. daily fixed income par value traded
Market share of corporate bond transactions under 250 bonds
Market share of muni bond transactions under 250 bonds
3.0
4.0
5.0
6.0
7.0
8.0
281.0
334.3
299.0
1Q14
4Q14
1Q15
200
240
280
320
360
400
Avg. daily algorithmic trading and order routing U.S equity share volume
Avg. daily consolidated U.S. equity share volume
$0
$10,000
$20,000
$30,000
$40,000
$50,000
$60,000
$70,000
1
4
7
10
13
16
19
22
25
28
31
34
37
40
43
46
49
52
55
58
61
65
KCG Hotspot avg. daily notional dollar volume
KCG algorithmic trading and order routing
U.S. equity share volume
Growth of KCG BondPoint
In agency execution, solid results demonstrate
progress with institutional clients
Among trading venues, continued good performance
KCG BondPoint grew market share amid a seasonally strong
first quarter
KCG Hotspot sale completed on March 13th
Knight Match accounted for 3.4% of dark liquidity
–
–
–
–
–
Decline in algorithmic trading and order routing driven by
focus on strategic clients and higher margin order flow
Good contributions from sales traders in the U.S. and U.K.
as well as the reconstituted ETF trading team
Trading days |
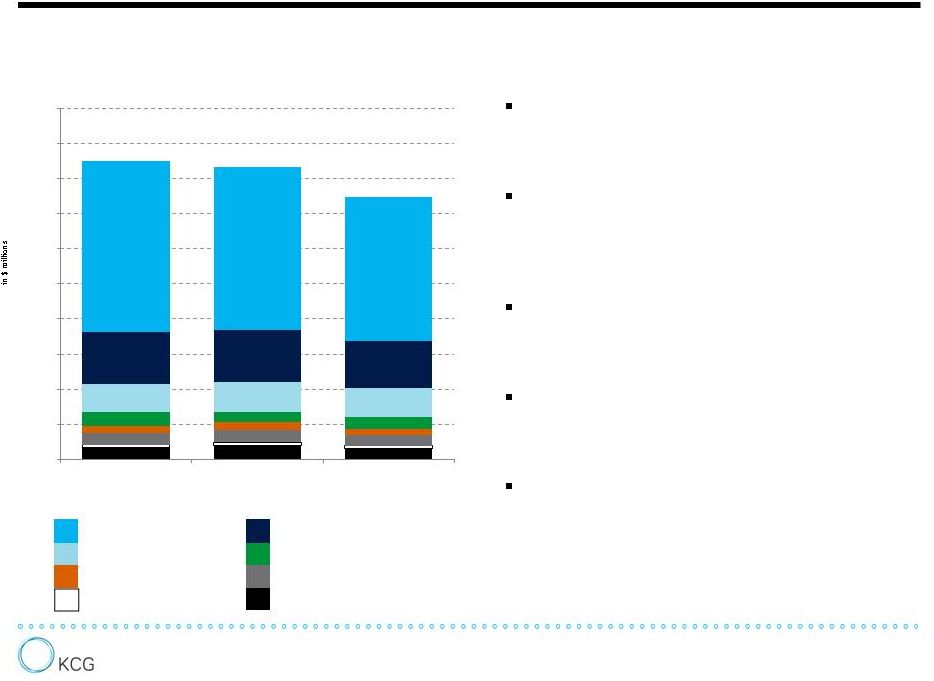 Consolidated Expenses
Compensation and Benefits declined to
$102.3 million as a result of reduced
headcount and lower bonus accruals
Communications and Data Processing
decreased $3.2 million due to reduced market
data and terminal fees, connectivity costs and
maintenance expenses
Occupancy and equipment rentals declined
$1.2 million due to reduced lease operating
expenses and real estate taxes
Other expenses declined $2.0 million in part
due to decreased VAT expenses and regulatory
dues
Among transaction-based expenses not
included in the chart, Execution and
Clearance Fees declined $13.9 million due to
reduced regulatory transaction fees and lower
trade volumes
7
†
See addendum for a reconciliation of GAAP to non-GAAP financial
results. Compensation and benefits
Communications and data processing
Depreciation and amortization
Debt interest expense
Professional fees
Occupancy and equipment rentals
Business development
Other
$212.8 mn
$208.4 mn
$186.6 mn
$0
$25
$50
$75
$100
$125
$150
$175
$200
$225
$250
1Q14
4Q14
1Q15
Consolidated
non-GAAP
quarterly
expenses
† |
 Additional Financials
Consolidated Statements of Financial Condition
(in millions)
(unaudited)
March 31, 2014
December 31, 2014
March 31, 2015
Cash and cash equivalents
$ 651.9
$ 578.8
$ 990.5
Debt
1
472.3
422.3
799.8
Stockholders’
equity
1,566.2
1,522.6
1,783.3
Debt-to-tangible
equity
ratio²
0.35
0.31
0.30
Tangible
book
value
per
share³
$10.85
$11.72
$13.86
Book value per share
$12.46
$13.03
$15.10
Shares outstanding including restricted
stock units (in thousands)
125,695
116,860
118,091
8
1
Debt at March 31, 2015 includes the 8.25% $305 million Senior Secured Notes,
which were redeemed subsequent to the quarter close using funds held in escrow.
2
Debt-to-tangible equity ratio at March 31, 2015 excludes the $305
million senior secured notes redeemed subsequent to the quarter close.
4
Tangible book value is calculated by subtracting goodwill and intangible assets
from equity. |
 Announced Modified Dutch Auction Tender Offer
Subsequent to the first quarter of 2015, KCG announced plans to launch a modified
Dutch auction tender offer to repurchase for cash outstanding KCG Class A
Common Stock for an aggregate purchase price of up to $330 million
Authorization part of an expanded $400 million share repurchase program
The
tender
offer
represents
a
premium
of
5%
to
9%
of
the
closing
price
of
KCG
Class
A
Common
Stock on the NYSE of $12.84 on April 30, 2015
Under the proposed terms:
Expected to commence on May 4, 2015 and remain open for 20 business days
Stockholders may offer to sell stock to KCG at specified prices in the range of
$13.50 to $14.00 per share Upon expiration of the offer, KCG will select
the lowest price in the range that will allow it to repurchase shares
having an aggregate purchase price of up to $330 million (or if the offer is not
fully subscribed, all shares properly tendered and not withdrawn)
All shares
tendered
at
or
below
the
clearing
price
accepted
will
be
repurchased
at
the
same
price,
subject to the
proration and the other terms of the offer
If the aggregate purchase price for shares tendered exceeds the available $330
million, allocations will be made on a pro rata basis from stockholders
tendering at or below the selected purchase price, subject to certain
priorities
Assuming the offer is fully subscribed, KCG will repurchase a minimum of 23.6
million shares, or 22% of total shares outstanding excluding restricted
stock units (RSUs) as of April 29, 2015 9
–
–
–
–
– |
 Additional Information Regarding the Tender Offer
10
The tender offer described in this presentation has not yet commenced. This
presentation is for informational purposes only, is not a recommendation
to buy or sell KCG common stock, and does not constitute an offer to buy
or the solicitation to sell shares of KCG common
stock.
The
tender
offer
will
be
made
only
pursuant
to
the
Offer
to
Purchase,
Letter
of
Transmittal
and
related
materials
that
KCG
expects
to
file
Monday,
May
4
th
with
the
Securities and Exchange Commission. Stockholders should read carefully the Offer
to Purchase, Letter of Transmittal and related materials because they
contain important information, including the various terms of, and
conditions to, the tender offer. Once the tender offer is commenced ,
stockholders will be able to obtain a free copy of the tender offer
statement
on
Schedule
TO,
the
Offer
to
Purchase,
Letter
of
Transmittal
and
other
documents that KCG will be filing with the Securities and Exchange Commission at
the Commission’s
website
at
www.sec.gov
or
and
the
investor
information
section
of
KCG’s
website
at
www.kcg.com. |
 |
 3
months ended March 31, 2015 Market Making
Global Execution
Services
Corporate and
Other
Consolidated
Reconciliation of GAAP revenues to non-GAAP revenues:
GAAP revenues
$ 224,548
$ 464,266
$ 7,342
$ 696,156
Gain on sale of KCG Hotspot
-
(385,026)
-
(385,026)
Non-GAAP revenues
$ 224,548
$ 79,240
$ 7,342
$ 311,130
Regulation G Reconciliation of Non-GAAP
Financial Measures (Continuing Operations)
11 |
 3
months ended December 31, 2014 Market Making
Global Execution
Services
Corporate and
Other
Consolidated
Reconciliation of GAAP revenues to non-GAAP revenues:
GAAP revenues
$ 238,740
$ 93,369
$ 14,030
$ 346,139
Gain on sale of FCM
-
(2,116)
-
(2,116)
Non-GAAP revenues
$ 238,740
$ 91,253
$ 14,030
$ 344,023
Regulation G Reconciliation of Non-GAAP
Financial Measures (Continuing Operations)
12 |
 3
months ended March 31, 2014 Market Making
Global Execution
Services
Corporate and
Other
Consolidated
Reconciliation of GAAP revenues to non-GAAP revenues:
GAAP revenues
$ 277,346
$ 87,220
$ 19,091
$ 383,657
Income resulting from the merger of BATS and Direct Edge, net
-
-
(9,644)
(9,644)
Non-GAAP revenues
$ 277,346
$ 87,220
$ 9,447
$ 374,013
Regulation G Reconciliation of Non-GAAP
Financial Measures (Continuing Operations)
13 |
 Regulation G Reconciliation of Non-GAAP
Financial Measures (Continuing Operations)
3 months ended March 31, 2015
Market Making
Global Execution
Services
Corporate and
Other
Consolidated
Reconciliation of GAAP pre-tax to non-GAAP pre-tax:
GAAP income (loss) from continuing operations before
income taxes
$ 39,340
$ 381,058
$ (14,270)
$ 406,128
Gain on sale of KCG Hotspot
-
(385,026)
-
(385,026)
Professional fees related to sale of KCG Hotspot
-
6,736
-
6,736
Compensation expense related to sale of KCG Hotspot
-
4,457
-
4,457
Lease loss accrual, net
-
-
132
132
Non-GAAP income (loss) from continuing operations before
income taxes
$ 39,340
$ 7,225
$ 14,138
$ 32,427
14 |
 Regulation G Reconciliation of Non-GAAP
Financial Measures (Continuing Operations)
3 months ended December 31, 2014
Market Making
Global Execution
Services
Corporate and
Other
Consolidated
Reconciliation of GAAP pre-tax to non-GAAP pre-tax:
GAAP income (loss) from continuing operations before
income taxes
$ 42,710
$ 9,968
$ (26,147)
$ 26,531
Gain on sale of FCM
-
(2,116)
-
(2,116)
Lease loss accrual, net
-
-
6,117
6,117
Non-GAAP income (loss) from continuing operations before
income taxes
$ 42,710
$ 7,852
$ (20,030)
$ 30,532
15 |
 Regulation G Reconciliation of Non-GAAP
Financial Measures (Continuing Operations)
16
3 months ended March 31, 2014
Market Making
Global Execution
Services
Corporate and
Other
Consolidated
Reconciliation of GAAP pre-tax to non-GAAP pre-tax:
GAAP income (loss) from continuing operations before
income taxes
$ 76,032
$ 2,016
$ (18,664)
$ 59,384
Writedown of capitalized debt costs
-
-
7,557
7,557
Income resulting from the merger of BATS and Direct Edge, net
-
-
(9,644)
(9,644)
Lease loss accrual, net
359
-
(93)
266
Non-GAAP income (loss) from continuing operations before
income taxes
$ 76,391
$ 2,016
$ (20,844)
$ 57,563 |
 Regulation G Reconciliation of Non-GAAP
Financial Measures (Continuing Operations)
3 months ended March 31, 2015
GAAP
Adjustments for
non-GAAP presentation
KCG non-GAAP,
normalized expenses
Reconciliation of GAAP expenses to KCG non-GAAP
normalized expenses:
Employee compensation and benefits
106,718
4,457
102,261
Communications and data processing
33,764
-
33,764
Depreciation and amortization
20,615
-
20,615
Debt interest expense
8,463
-
8,463
Professional fees
11,181
6,736
4,445
Occupancy and equipment rentals
7,340
-
7,340
Business development
1,857
-
1,857
Lease loss accrual, net
132
132
-
Other
7,808
-
7,808
Total expenses¹
$ 197,878
$ 11,325
$ 186,553
17
1
Total expenses exclude transaction-based expenses which fluctuate based on
market conditions and client activity. |
 3
months ended December 31, 2014 GAAP
Adjustments for
non-GAAP presentation
KCG non-GAAP,
normalized expenses
Reconciliation of GAAP expenses to KCG non-GAAP
normalized expenses:
Employee compensation and benefits
116,214
-
116,214
Communications and data processing
36,945
-
36,945
Depreciation and amortization
21,224
-
21,224
Debt interest expense
7,721
-
7,721
Professional fees
5,695
-
5,695
Occupancy and equipment rentals
8,514
-
8,514
Business development
2,308
-
2,308
Lease loss accrual, net
6,117
6,117
-
Other
9,822
-
9,822
Total expenses¹
$ 214,561
$ 6,117
$ 208,444
Regulation G Reconciliation of Non-GAAP
Financial Measures (Continuing Operations)
18
1
Total expenses exclude transaction-based expenses which fluctuate based on
market conditions and client activity. |
 Regulation G Reconciliation of Non-GAAP
Financial Measures (Continuing Operations)
19
3 months ended March 31, 2014
GAAP
Adjustments for
non-GAAP presentation
KCG non-GAAP, normalized
expenses
Reconciliation of GAAP expenses to KCG non-GAAP
normalized expenses:
Employee compensation and benefits
122,319
-
122,319
Communications and data processing
36,796
-
36,796
Depreciation and amortization
20,103
-
20,103
Debt interest expense
9,524
-
9,524
Professional fees
5,402
-
5,402
Occupancy and equipment rentals
8,285
-
8,285
Business development
1,683
-
1,683
Lease loss accrual and writedown of capitalized debt costs
7,823
7,823
-
Other
8,643
-
8,643
Total expenses¹
$ 220,578
$ 7,823
$ 212,755
1
Total expenses exclude transaction-based expenses which fluctuate based on
market conditions and client activity. |
 |