Attached files
| file | filename |
|---|---|
| EX-31.2 - EXHIBIT 31.2 - INTEGRATED FREIGHT Corp | ex31x2.htm |
| EX-32.2 - EXHIBIT 32.2 - INTEGRATED FREIGHT Corp | ex32x2.htm |
| EX-31.1 - EXHIBIT 31.1 - INTEGRATED FREIGHT Corp | ex31x1.htm |
| EX-32.1 - EXHIBIT 32.1 - INTEGRATED FREIGHT Corp | ex32x1.htm |
UNITED STATES
SECURITIES AND EXCHANGE COMMISSION
Washington, D.C. 20549
FORM 10-K
|
☑
|
ANNUAL REPORT PURSUANT TO SECTION 13 OR 15(d) OF THE SECURITIES EXCHANGE ACT OF 1934: For the fiscal year ended March 31, 2014
|
|
☐
|
TRANSITION REPORT PURSUANT TO SECTION 13 OR 15(d) OF THE SECURITIES EXCHANGE ACT OF 1934:
|
Commission file number: 000–14273
INTEGRATED FREIGHT CORPORATION
(Exact name of registrant as specified in its charter)
|
FLORIDA
|
|
84–0868815
|
|
State or other jurisdiction of
incorporation or organization
|
|
I.R.S. Employer
Identification No.
|
|
100 Main Street North 208
Southbury, Connecticut
|
|
06488
|
|
(Address of principal executive offices)
|
|
(Zip code)
|
Issuer’s telephone number: (203) 628-7142
Securities registered under Section 12(b) of the Exchange Act: None
Securities registered under Section 12(g) of the Exchange Act:
|
Title of each class:
|
Name of Exchange on which registered:
|
||
|
Common Stock, $0.001 par value per share
|
(None)
|
||
|
Indicate by check mark if the registrant is a well-known seasoned issuer, as defined in Rule 405 of the Securities Act.
|
Yes
☐
|
No
☑
|
|
|
Indicate by check mark if the registrant is not required to file reports pursuant to Section 13 or Section 15(d) of the Act.
|
Yes
☐
|
No
☑
|
|
Indicate by check mark whether the registrant (1) has filed all reports required to be filed by Section 13 or 15(d) of the Securities Exchange Act of 1934 during the preceding 12 months (or for such shorter period that the registrant was required to file such reports), and (2) has been subject to such filing requirements for the past 90 days.
|
Yes
☐
|
No
☑
|
|
Indicate by check mark whether the registrant has submitted electronically and posted on its corporate Web site, if any, every Interactive Data File required to be submitted and posted pursuant to Rule 405 of Regulation S-T (§ 232.405 of this chapter) during the preceding 12 months (or for such shorter period that the registrant was required to submit and post such files).
|
Yes
☐
|
No
☑
|
|
Indicate by check mark if disclosure of delinquent filers pursuant to Item 405 of Regulation S-K (§ 229.405 of this chapter) is not contained herein, and will not be contained, to the best of registrant’s knowledge, in definitive proxy or information statements incorporated by reference in Part III of this Form 10-K or any amendment to this Form 10-K.
|
☑
|
|
Indicate by check mark whether the registrant is a large accelerated filer, an accelerated filer, a non-accelerated filer, or a smaller reporting company. See the definitions of “large accelerated filer,” “accelerated filer” and “smaller reporting company” in Rule 12b-2 of the Exchange Act.
|
|
Large accelerated filer
|
☐
|
Accelerated filer
|
☐
|
|
|
|
Non-accelerated filer
|
☐
|
Smaller reporting company
|
☑
|
|
|
|
Indicate by check mark whether the registrant is a shell company (as defined in Rule 12b-2 of the Act).
|
Yes
☐
|
No
☑
|
|||
|
Aggregate market value of the voting and non-voting common equity held by non-affiliates computed by reference to the price at which the common equity was last sold, or the average bid and asked price of such common equity, as of the last business day of the registrant’s most recently completed second fiscal quarter ended September 30, 2013 was approximately $55,780.
|
|
The number of shares of the registrant’s common stock outstanding at April 24, 2015 was: 434,580,251 shares
|
Table of Contents
|
PART I
|
5
|
|
ITEM 1. BUSINESS.
|
5
|
|
ITEM 1A. RISK FACTORS.
|
11
|
|
ITEM 1B. UNRESOLVED STAFF COMMENTS.
|
17
|
|
ITEM 2. PROPERTIES.
|
17
|
|
ITEM 3. LEGAL PROCEEDINGS.
|
18
|
|
ITEM 4. MINE SAFETY DISCLOSURES.
|
19
|
|
PART II
|
20
|
|
ITEM 5. MARKET FOR REGISTRANT'S COMMON EQUITY, RELATED STOCKHOLDER MATTERS AND ISSUER PURCHASES OF EQUITY SECURITIES.
|
20
|
|
ITEM 6. SELECTED FINANCIAL DATA
|
21
|
|
ITEM 7. MANAGEMENT'S DISCUSSION AND ANALYSIS OR PLAN OF OPERATION
|
22
|
|
ITEM 7A. QUANTITATIVE AND QUALITATIVE DISCLOSURES ABOUT MARKET RISK.
|
30
|
|
ITEM 8. FINANCIAL STATEMENTS AND SUPPLEMENTARY DATA.
|
30
|
|
ITEM 9. CHANGES IN AND DISAGREEMENTS WITH ACCOUNTANTS ON ACCOUNTING AND FINANCIAL DISCLOSURE
|
30 |
|
ITEM 9A. CONTROLS AND PROCEDURES.
|
31 |
|
PART III
|
32
|
|
ITEM 10. DIRECTORS, EXECUTIVE OFFICERS AND CORPORATE GOVERNANCE.
|
32
|
|
ITEM 11. EXECUTIVE COMPENSATION.
|
34
|
|
ITEM 12. SECURITY OWNERSHIP OF CERTAIN BENEFICIAL OWNERS AND MANAGEMENT AND RELATED STOCKHOLDER MATTERS.
|
35
|
|
ITEM 13. CERTAIN RELATIONSHIPS AND RELATED TRANSACTIONS, AND DIRECTOR INDEPENDENCE.
|
36
|
|
ITEM 14. PRINCIPAL ACCOUNTING FEES AND SERVICES.
|
36
|
|
PART IV
|
37
|
|
ITEM 15. EXHIBITS, FINANCIAL STATEMENT SCHEDULES.
|
37
|
|
SIGNATURES
|
38
|
3
USE OF PRONOUNS
“We”, “our” and “us", as used in this annual report, refer to Integrated Freight Corporation, and our wholly owned subsidiaries. The” Company”, as used in the notes to our financial statements, refers to Integrated Freight Corporation and subsidiaries on a consolidated basis. “You” as used in this annual report, refers to the reader.
DOCUMENTS INCORPORATED BY REFERENCE
We have not incorporated any documents by reference.
SUMMARIES OF REFERENCED DOCUMENTS
This annual report on Form 10-K contains references to, summaries of and selected information from agreements and other documents. These agreements and documents are not incorporated by reference; but, they are filed as exhibits to this annual report or to other reports we have filed with the U.S. Securities and Exchange Commission. Whenever we make reference in this annual report to any of our agreements and other documents, the references are not necessarily complete. The summaries of and selected information from those agreements and other documents are qualified in their entirety by reference to the full agreements and other documents. You may obtain the full text of the agreements and documents from the Public Reference Section of or online from the Commission. See “Where You Can Find Agreements And Other Documents Referred To In This Annual Report” for instructions as to how to access and obtain this information.
WHERE YOU CAN FIND AGREEMENTS AND OTHER DOCUMENTS REFERRED TO IN THIS ANNUAL REPORT
We file reports with the U.S. Securities and Exchange Commission pursuant to Section 15(d) of the Securities Exchange Act of 1934. You may read and copy any reports and other materials we have filed with the Commission at the Commission’s Public Reference Room at 100 F Street, N.E., Washington, D.C. 20549. You may obtain information on the operation of the Public Reference Room by calling the Commission at 1-800-SEC-0330. The Commission maintains an Internet site at which you may obtain all reports, proxy and information statements, and other information that we file with the Commission. The address of the Commission’s web site is http://www.sec.gov. Under “Forms and Filings”, select “Search for Company Filings”.
FORWARD-LOOKING STATEMENTS
This annual report on Form 10–K and the information incorporated by reference, if any, includes “forward–looking statements” within the meaning of Section 27A of the Securities Act of 1933, as amended, and Section 21E of the Securities and Exchange Act of 1934, as amended. We intend the forward–looking statements to be covered by the safe harbor provisions for forward–looking statements in these sections.
This annual report on Form 10–K contains forward-looking statements that involve risks and uncertainties. We use words such as “project,” “believe,” “anticipate,” “plan,” “expect,” “estimate,” “intend,” “should,” “would,” “could,” “will,” or “may,” or other such words, verbs in the future tense and words and phrases that convey similar meaning and uncertainty of future events or outcomes to identify these forward-looking statements. There are a number of important factors beyond our control that could cause actual results to differ materially from the results anticipated by these forward-looking statements. While we make these forward–looking statements based on various factors and derived using numerous assumptions, you have no assurance the factors and assumptions will prove to be materially accurate when the events they anticipate actually occur in the future.
These important factors include those that we discuss in this annual report under the caption “Risk Factors”, as well as elsewhere in this annual report. You should read these factors and the other cautionary statements made in this annual report as being applicable to all related forward-looking statements wherever they appear in this annual report. If one or more of these factors materialize, or if any underlying assumptions prove incorrect, our actual results, performance or achievements may vary materially from any future results, performance or achievements expressed or implied by these forward-looking statements. We undertake no obligation to publicly update any forward-looking statements, whether as a result of new information, future events or otherwise.
4
PART I
ITEM 1. BUSINESS.
Our corporate and business history.
We have and have had the following wholly owned subsidiaries, during the periods indicated:
|
·
|
Integrated Freight Corporation, a Florida corporation, (“Original IFC”) between December 3, 2009, when we acquired a controlling interest in original IFC, and December 23, 2009, when we merged Original IFC into us.
|
|
·
|
Morris Transportation, Inc., an Arkansas corporation, beginning September 1, 2008, when we acquired a controlling interest in Original IFC. Original IFC purchased all of Morris Transportation’s common stock as of September 1, 2008.
|
|
·
|
Smith Systems Transportation, Inc., a Nebraska corporation, beginning September 1, 2008, when we acquired a controlling interest in Original IFC. Original IFC purchased all of Smith System’s common stock as of September 1, 2008.
|
|
·
|
Triple C Transport, Inc., a Nebraska corporation, beginning as of May 5, 2010, when we purchased all of its common stock, and June 30, 2012 when we sold Triple C Transport.
|
|
·
|
Cross Creek Trucking, Inc., an Oregon corporation, beginning April 1, 2011, when we purchased all of its common stock, and June 30, 2012 when we sold Cross Creek Trucking.
|
|
·
|
Integrated Freight Services, a Florida corporation, beginning April 1, 2011, when we formed the Company and began operations, and June 30, 2012 when we sold Integrated Freight Services.
|
The address of our principal executive office is 100 Main Street North, 208, Southbury, CT 06488 and our telephone number is (203) 628-7142.
We were incorporated as Douglas County Industries, Inc. in Colorado in 1981. We underwent several name changes prior to 1997, our name at that time being DCX, Inc. In 1997, we acquired all of the outstanding shares of what is now PlanGraphics, Inc. headquartered in Frankfort, Kentucky and in which we have no interest. In 1998, we changed our name to Integrated Spatial Information Solutions, Inc. from DCX, Inc. In 2002, we changed our name to PlanGraphics, Inc. from Integrated Spatial Information Solutions, Inc. On August 18, 2010, we changed our name to Integrated Freight Corporation when we changed our corporate domicile to Florida from Colorado. We have been continuously engaged in a business since inception in 1981 and have never been a shell company, as defined in the regulations under the federal securities laws.
Original IFC was incorporated as Integrated Freight Systems, Inc. in Florida on May 13, 2008 by Paul A. Henley, its founder. Original IFC changed its name to Integrated Freight Corporation on July 27, 2009. Original IFC was founded for the purpose of acquiring operating motor freight companies. We operate the following companies:
|
Company Name
|
Year Established
|
|
Acquisition Date
|
|
|
|
|
|
|
|
|
Morris Transportation, Inc.
|
1998
|
|
As of December 23, 2009
|
|
|
Smith Systems Transportation, Inc.
|
1992
|
|
As of December 23, 2009
|
|
In February 2011, we incorporated Integrated Freight Services, Inc. to operate as a freight brokerage company. We sold Cross Creek Trucking, Triple C Transport, and Integrated Freight Services to Deep South Capital effective June 30, 2012.
Although we may eventually consolidate some operational functions of these subsidiaries, such as insurance, fuel and tire purchasing, we are operating the two remaining subsidiaries as independent companies under the management of their founders and stockholders from whom we purchased them. Such operations are currently being conducted pursuant to the terms of Exhibit “B” to an Engagement Agreement for Consulting Services with Fuselier Consulting LLC.
5
Overview of Our Truck Transportation Business
We are a holding company with two operating motor freight carriers, providing truck load service throughout the forty-eight contiguous United States. We do not specialize in any specific types of freight or commodities. We carry dry freight and certain hazardous materials (“hazmat”) including hazardous waste. We provide long-haul, regional and local service to our customers. During parts of the fiscal year ended March 31, 2014, we also transported refrigerated freight. We have discontinued our refrigerated freight operations with the discontinuance of operations by Cross Creek Trucking and Triple C Transport.
Trucking Industry Background
Subsequent to the recession of 2008-2009, the trucking industry has staged a significant but difficult comeback. According to data from the American Trucking Associations Freight Tonnage Index and the Cass Information Systems Linehaul Rate Index (Supply Chain Digest, July 12, 2012), the decline in trucking volume and freight rates began with the recession in mid-2008. Total trucking shipment volume tracked with the recession by bottoming out in mid-2009 and recovering steadily through 2011 along with the economy. However, base freight rates, not including fuel surcharges or other adjustments, continued their downward slide until April 2010. Since that time, freight rates have recovered all of the ground lost during the recession and then some through the end of 2011--about 15%--from the bottom of the recession. It should be noted that the bulk of the freight demand and price rebound came in the last 2-3 months of 2011 which is believed to be attributable to end of year inventory and holiday shopping business.
In 2012 freight volumes were up approximately twenty percent through the end of May over the low point of the recession in mid-2009. However, according to the ATA Freight Index, both volume and rates were flat on a year-to- date basis. This reflects the generally consistent reports of another potential slowdown in the economy.
The effect and timing of the recession on the trucking industry was profound. In addition to the precipitous drop in freight volume, carriers had to contend with dramatically rising fuel prices which, unlike previous diesel price hikes, did not spike but remained at extraordinarily high levels. This was compounded further by new diesel engine emissions regulations promulgated by the U.S. Environmental Protection Agency that drove new truck prices to record high levels according to the ATA. Not surprisingly, thousands of motor carriers of all sizes, and in particular smaller carriers, ceased operations. Many carriers who did survive did so by laying off truck drivers, a practice that the chronically capacity-short industry had not seen in decades. Thousands of qualified truck drivers left the industry permanently.
We believe the aftermath of the recession and the subsequent, albeit slow, recovery has created a substantial opportunity. The capacity shortage has enabled carriers to increase market rates further while excess diesel costs are being offset by fuel surcharges. Access to debt and equity capital remains difficult; particularly for small to medium sized motor carriers. As a result, we believe that there are multiple small carriers serving defensible niche markets that would be a good strategic "fit" with our business model. In addition to healthy organic growth, we intend to acquire other motor carriers whose freight lanes and operational specialties, such as our present hazardous waste segment, are compatible and mutually supportable. We expect to be able to improve customer service and reduce operating costs by centralizing key administrative functions such as accounting, human resources, billing and collections. Additional savings will be realized through operating improvements as well as bulk purchasing practices related to fuel, tires, insurance, and maintenance. This strategy is highly dependent upon our ability to obtain suitable acquisition financing. We have experienced difficulty obtaining such financing and there is no assurance that we will be able to secure acquisition financing in the future.
6
Our Markets
Historically, we have operated in well-established geographic traffic lanes or routes. These lanes are defined by our customers’ distribution patterns. Our dry van and hazardous materials subsidiaries operate in well-defined regional areas and, as a result, have approximate lengths of haul typical of one to two days of travel. Although the subsidiaries have operations ranging from coast to coast, they each serve relatively dense, frequently traveled lanes. Although the bulk of our capacity is composed of employee drivers, both subsidiaries are able to expand their customer service offerings with independent contractor “surge” capacity.
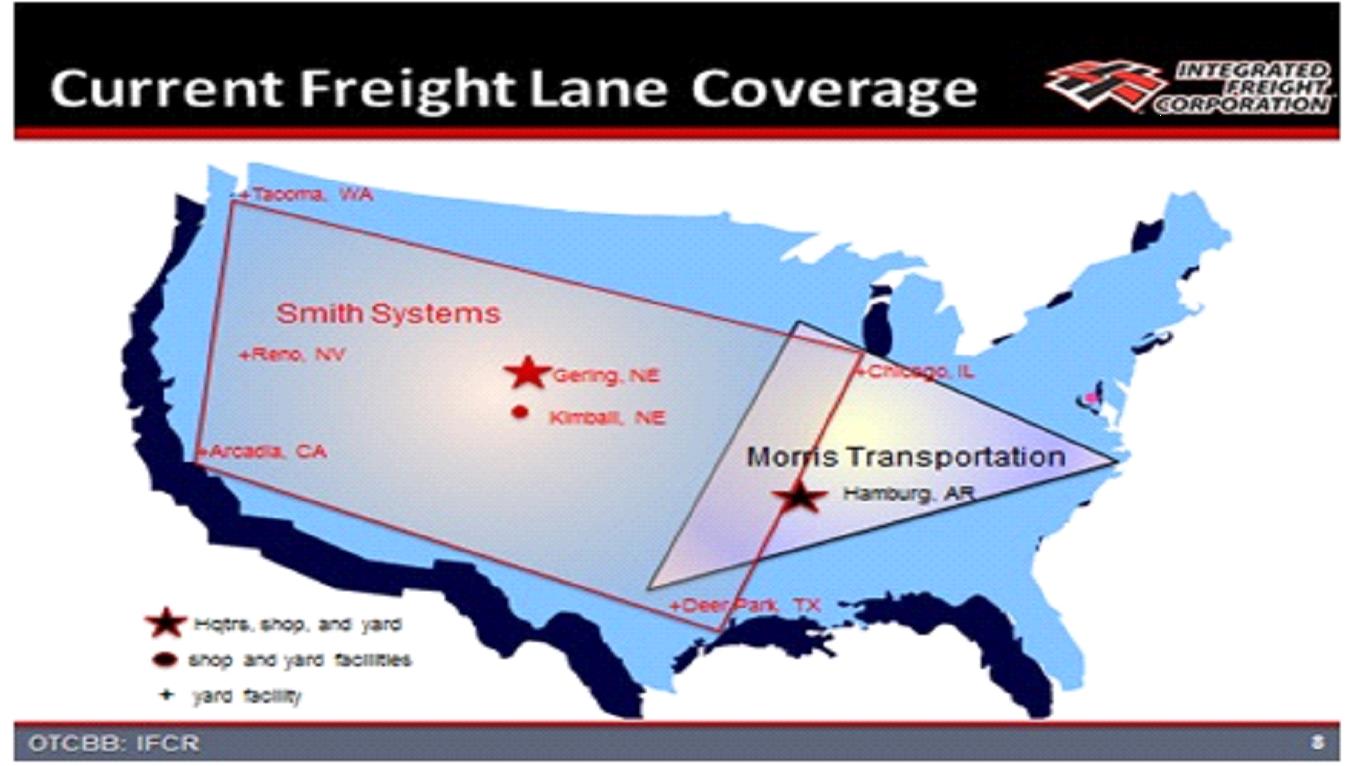
*A yard facility, or drop yard, is a temporary or semi-permanent location we rent to store trailers when not in use between pick-ups and deliveries. Typically, we rent yard facilities as needed in terminal facilities of other motor freight carriers, which provide security.
Our Customers and Marketing
We serve approximately 125 customers on a regular basis. Like most truckload carriers, we do not have contracts with any of these customers. Instead, we have long-standing relationships with most of them which include fixed pricing terms on a per mile or fixed point-to-point basis.
The following table presents information regarding the percentage-of-revenue concentration of the business with our customers.
|
Four customers
|
Up to 34%
|
|
All other customers
|
66% or more
|
The following table presents information regarding the average length of our trips.
|
Longest haul (overnight)
|
2,225 miles
|
|
Shortest haul
|
21 miles
|
|
Average haul
|
683 miles
|
7
All of the freight we hauled in fiscal year 2014 is dry van and hazmat freight. The following table presents information regarding the approximate percentage makeup of the freight we haul.
|
Forest and paper products
|
32%
|
|
Hazmat and hazwaste
|
45%
|
|
Non-Haz waste
|
3%
|
|
All other freight
|
20%
|
Marketing
Our sales and marketing force currently consists of two individuals. We have no formal marketing plan at the present time and, instead, have a direct sales process with selected shippers. We attend selected relevant trade shows and trade association meetings, and seek to maintain good relations with our existing customers.
Our People
We believe our employees are our most important asset. The table below presents information about our employees, other than drivers.
|
Fleet technicians
|
3
|
|
|
Dispatch
|
7
|
|
|
Sales
|
2
|
|
|
Office
|
6
|
|
|
Administrative and Executive
|
4
|
|
|
Total non-driver Employees
|
22
|
We also employ several persons in administrative and executive capacities on a part-time basis. None of our employees are represented by a collective bargaining unit. We consider relations with our employees to be good. We offer basic health insurance coverage to employees.
Our Drivers
The following table presents information about our drivers.
|
Drivers – company
|
81
|
|
Drivers – independent contractors
|
13
|
|
Total – all drivers
|
94
|
We believe that maintaining a safe and productive professional driver group is essential to providing excellent customer service and achieving profitability. All of our drivers must have three years of verifiable driving experience, a hazmat endorsement (if hauling hazmat), no major violations in the previous thirty-six months, and must comply with all requirements of employment by federal Department of Transportation and applicable state laws.
We select drivers, including independent contractors, using our specific guidelines for safety records, driving experience, and personal evaluations. We maintain stringent screening, training, and testing procedures for our drivers to reduce the potential for accidents and the corresponding costs of insurance and claims. We train new drivers in all phases of our policies and operations, as well as in safety techniques and fuel-efficient operation of the equipment. All new drivers also must pass DOT required tests prior to assignment to a vehicle.
We primarily pay company-employed drivers a fixed rate per mile. The rate increases based on length of service. Drivers also are eligible for bonuses based upon safe, efficient driving. We pay independent contractors on a fixed rate per mile. Independent contractors pay for their own fuel, insurance, maintenance, and repairs.
8
Competition in the trucking industry for qualified drivers is normally intense. Our operations have been impacted, and from time-to-time we have experienced under-utilization of equipment and increased expense, as a result of a shortage of qualified drivers. We place a high priority on the recruitment and retention of an adequate supply of qualified drivers. Our average annual turn-over rate is less than fifty percent compared to an industry average of over one ninety percent as published in The Journal of Commerce, April 1, 2015. Low driver turnover avoids costly repetitive recruiting and training efforts, promotes a culture of safety, and offers customers better overall service.
Our Operations
We currently conduct all of our freight transportation operations, including dispatch and accounting functions, from the facilities of our operating subsidiaries. During fiscal year 2014 we continued using the legacy information management systems and personnel that were employed when our operating subsidiaries were acquired. These arrangements produce overlaps and duplications in facilities, office systems and personnel. We believe that these operating arrangements provide less than optimal results and controls.
Our Revenue Equipment
The following table presents information regarding the mix of our revenue producing equipment.
|
Power units (tractors) – sleeper (83 company owned and 13 independent contractors)
|
96
|
|
|
|
|
|
|
Trailers
|
|
|
|
|
Flatbed
|
4
|
|
|
Dry van
|
230
|
|
|
Refrigerated
|
30
|
|
|
Other specialized
|
10
|
|
|
Tanker
|
4
|
|
Total – all types of trailers
|
278
|
|
The average age of our power units is approximately four years. Our power units include Mack, Freightliner and Volvo vehicles. Both subsidiaries also make use of full-service lease vehicles secured from a national vendor. This blend of equipment capacity offers the best overall equipment cost in terms of acquisition, operation, and maintenance costs. We plan to replace our power units at approximately four to five years of age. The average age of our trailers is approximately nine years. We maintain all of our revenue producing equipment in good order and repair. We believe we have an optimal tractor to trailer ratio based upon our current and anticipated customer activity.
Diesel Fuel Availability and Cost
Our operations are heavily dependent upon the use of diesel fuel. The price and availability of diesel fuel can vary and are subject to political, economic, and market factors that are beyond our control. Fuel prices have fluctuated dramatically and quickly at various times since early 2008. Prices remain high based on historical standards and can be expected to increase over the long term with increased demand for truck transportation in a recovering economy. We actively manage our fuel costs with volume purchasing arrangements with national fuel centers that allow our drivers to purchase fuel at a discount while in transit. Approximately eighty-five percent of our fuel purchases were made at contracted locations.
Among the greatest challenges presented by high and relatively unstable diesel fuel prices is monitoring and maintaining our fuel costs and insuring that the fuel surcharge levels are adequate to recapture incremental costs. We monitor the weekly U.S. Department of Energy regional and national diesel fuel pricing information and regulate our fuel surcharge levels accordingly. In addition, customer service representatives and operations personnel have been trained to take into account the cost of fuel (to include all empty miles) during the process of accepting and booking all shipments.
9
The federal fuel surcharge program cushions our exposure to increased fuel prices. This program has enabled us to pass through most long-term increases in fuel prices and related taxes to customers in the form of fuel surcharges. The fuel surcharge, which is adjusted weekly based upon US Energy Information Agency data, enables us to recover a substantial portion of fuel cost increases that occur from time to time above our base fuel cost. All fuel surcharges are based on US Department of Energy posted national averages. As of March 31, 2014 and, to date, we had no derivative financial instruments to reduce our exposure to fuel price fluctuations.
Our Competition and Industry
Trucks provide transportation services to virtually every industry operating in the United States and generally offer higher levels of reliability and faster transit times than other surface transportation options. Trucks hauled sixty-nine percent of all freight and took in eighty-one percent of all freight transportation revenue in 2013, according to American Trucking Association. The transportation industry is highly competitive on the basis of both price and service. The trucking industry is comprised principally of two types of motor carriers: truckload and less-than-truckload generally identified as LTL. Truckload carriers generally provide an entire trailer to one customer from origin to destination. LTL carriers pick up multiple shipments from multiple customers on a single truck and then route those shipments through service centers, where freight may be transferred to other trucks with similar delivery destinations. All of our business is truckload service.
The surface freight transportation market in which we operate is frequently referred to as highly fragmented and competitive. There are an estimated 172,000 transportation and warehousing companies in the US, according to the National Cooperative Freight Research Program’s 2011 report. Even the largest motor freight companies haul a small percentage of the total freight. The following table presents information regarding the estimated percentage of freight hauled by the largest trucking companies compared to all other trucking companies.
|
Ten largest trucking companies
|
10.7%
|
|
All other trucking companies
|
89.3%
|
|
*Transport Topics 2014 Top 100 Survey
|
According to the American Trucking Association’s June 2011 issue of Trucklines, “Trucking serves as a barometer of the U.S. economy, representing sixty-seven percent of tonnage carried by all modes of domestic freight transportation, including manufactured and retail goods. Trucks hauled nine billion tons of freight in 2010. Motor carriers collected $563.4 billion, or eighty-one percent of total revenue earned by all transport modes.”
Competition in the motor freight industry is based primarily on service (including on-time pickup and delivery), price, equipment availability and business relationships. We believe that we are able to compete effectively in our markets by providing high-quality and timely service at competitive prices. We believe our relationships with our customers are good. We compete with smaller and several larger transportation service providers. Some of the largest truckload carriers, including JB Hunt Transport Services, Inc., C.R. England, Inc. and Knight Transportation, Inc., may have more equipment, a broader coverage network and a wider range of services than we have. They also have greater financial resources and, in general, the ability to reduce prices to gain business, especially during times of reduced growth rates in the economy. This could potentially limit our ability to maintain or increase prices, and could also limit our growth in shipments and tonnage in the same markets. However, we will continue to execute our strategy of confining our primary sales and operations efforts to defensible, niche markets (hazardous waste, specialty papers, etc.) as opposed to generic, high volume freight segments.
We believe that we do not compete with transportation by air, train, barge or ship, which we believe are not options for our existing customers.
10
Regulation
Our operations as a for-hire motor freight carrier are subject to regulation by the U.S. Department of Transportation (USDOT) and its agency, the Federal Motor Carrier Safety Administration (FMCSA), and certain business is also subject to state rules and regulations. These agencies exercise broad powers over our business, generally governing such activities as authorization to engage in motor carrier operations, safety and insurance requirements. The FMCSA periodically conducts reviews and audits to ensure our compliance with all federal safety requirements, and we report certain accident and other information to the FMCSA.
Our company drivers and independent contractor drivers also must comply with the safety and fitness regulations promulgated by the FMCSA, including those relating to drug and alcohol testing and hours-of-service. Drivers may drive up to eleven hours within a fourteen-hour non-extendable window from the start of the workday, following at least ten consecutive hours off duty. Further, drivers may drive up to a total of seventy hours in any eight consecutive days. However, motor freight carriers and drivers may restart calculations of the seventy hour on-duty limit after the driver has at least thirty-four consecutive hours off duty.
We are also subject to various environmental laws and regulations dealing with the handling of hazardous materials, air emissions from our vehicles and facilities, engine idling, and discharge and retention of storm water. These regulations have not had a significant impact on our operations or financial results and we do not expect a negative impact in the future
ITEM 1A, RISK FACTORS.
We have recently experienced a change in our senior management, which limits your ability to judge our performance under new management.
On August 2, 2012, we entered into a consulting agreement with Fuselier Consulting LLC and employed David Fuselier, the principal of Fuselier Consulting, as our Chief Executive Officer. Mr. Fuselier also is one of our directors and serves as Chairman of the Board
Recent improvements in the motor freight industry may hinder or prevent our acquisition of additional trucking companies.
The motor freight industry, as a whole, has experienced an increased demand for trucks and an improvement in revenues, as our general economy appears to be recovering from the most recent recessionary period (American Trucking Associations and Cass Information, July 2014) While the growth in freight demand has been relatively flat from mid-2011 through 2013, freight tonnage was up over twenty percent relative to tonnages at the bottom of the recession in mid-2009. Although not as robust an economic recovery as many have hoped for, the economy seems to be slowly recovering. Through the first half of 2014 cargo volumes are trending upward. Moreover, because of the industry’s overall capacity constraint, prices have trended upward in early 2014, as well. If these trends continue, the financial viability of motor freight carriers who have survived the recession will likely improve and may decrease their interest in being acquired. Our acquisition and growth strategy has been based in part on depressed values for motor freight carriers and a desire to sell based on poorer than historical financial performance. Without these incentives, we may find it more difficult to locate trucking companies with an interest in being acquired, or if they have such an interest, being acquired for consideration that fits our financial model
Our recent experience with two acquisitions may hinder future acquisitions.
Subsequent to our acquisitions of Cross Creek Trucking and Triple C Transport, both ceased operations and have been sold. Our lack of success in maintaining and expanding the business of these two subsidiaries may discourage owners of desirable acquisition targets from considering a sale of their companies to us. Our growth will be hindered if we cannot make additional acquisitions.
11
We have experienced difficulty in combining and consolidating the management and operations of our acquired companies which has had a material adverse impact on our operations and financial performance, as well as on our future acquisitions, if any.
We have purchased our operating subsidiaries and expect any additional subsidiaries we purchase to be made from the founders and management of the acquired companies, all of whom have been responsible for their own businesses and methods of operations as independent business owners. While these individuals will continue to be responsible entirely or to a lesser degree for the continuing operations of our operating subsidiaries, we intend to centralize and standardize many areas of operations. We have had limited success in consolidating operating functions between our two subsidiaries. We may be able to develop a cohesive corporate culture in the future. Our inability to successfully combine and consolidate the policies, procedures and operations of our subsidiaries can be expected to have a material adverse effect on our business and prospects, financial and otherwise.
Our information management systems are diverse, may prove inadequate and may be difficult to integrate or replace.
We depend upon our information management systems for many aspects of our business. Each operating subsidiary and each company we acquire will have its own information management system with which its employees are acquainted. None of these systems are adequate to our consolidated operations and may not be compatible with a centralized information management system. We expect to require additional software to initially integrate existing systems or to ultimately replace these diverse systems. Switching to new information management systems is often difficult, resulting in disruption, delays and lost productivity, which could impact our dispatching, collections and other operations. Our business will be materially and adversely affected if our information management systems are disrupted or if we are unable to improve, upgrade, integrate, expand or replace our systems as we continue to execute our growth strategy. We anticipate a need to make substantial ongoing investments in our management information systems in order to properly and efficiently consolidate the operations of our acquired subsidiaries.
Our management information systems are subject to certain risks that we cannot control.
Our management information systems, including dispatching and accounting systems, are dependent upon third-party software, global communications providers, telephone systems and other aspects of technology and Internet infrastructure that are susceptible to failure. Our management information systems is susceptible to outages, computer viruses, break-ins and similar disruptions that may inhibit our ability to provide services to our customers and the ability of our customers to access our systems. This may result in the loss of customers or a reduction in demand for our services.
If we are unable to successfully execute our growth strategy, our business and future results of operations may suffer.
Our growth strategy includes the acquisition of additional motor freight companies to increase revenues, to selectively expand our geographic footprint and to broaden the scope of our service offerings. If we are unable to acquire additional motor freight companies at prices that meet our financial model, our growth will be limited to expanding sales and reducing expenses in our existing subsidiaries. In connection with our growth strategy, we may purchase additional equipment, expand and upgrade service centers, hire additional personnel and increase our sales and marketing efforts.
Our growth strategy exposes us to a number of risks, including the following:
|
·
|
Geographic expansion and acquisitions require start-up costs that could expose us to temporary losses;
|
|
·
|
Growth and geographic expansion is dependent on the availability of freight and customer needs. Shortages of suitable real estate that accommodates both customers’ and carriers’ needs may limit our geographic expansion and might cause congestion in our service center network, which could result in increased operating expenses;
|
|
·
|
Growth may strain our management, capital resources, information systems and customer service;
|
|
·
|
Hiring new employees may increase training costs and may result in temporary inefficiencies until those employees become proficient in their jobs;
|
12
|
·
|
Expanding our service offerings may require us to enter into new markets and encounter new competitive challenges;
|
|
·
|
Growth through acquisition could require us to temporarily match existing freight rates of the acquiree’s markets, which may be lower than the rates that we would typically charge for our services; and
|
|
·
|
We may be unable to obtain financing of the cash portion of an acquisition price or to provide a working capital infusion for an acquisition.
|
We have no assurance we will overcome the risks associated with our growth. If we fail to overcome these risks, we may not be able to make additional acquisitions, realize additional revenue or profits from our efforts, we may incur additional expenses and therefore our financial position and results of operations could be materially and adversely affected.
We operate in a highly competitive and fragmented industry, and our business will suffer if we are unable to adequately address potential downward pricing pressures and other factors that may adversely affect our operations and profitability.
We compete with many other truckload carriers of varying size that provide dry-van and temperature-sensitive service of varying sizes and, to a lesser extent, with less-than-truckload carriers, air freight, railroads and other transportation companies, many of which have more equipment, a wider range of services and greater capital resources than we do or have other competitive advantages. We expect to experience difficulty in competing with larger companies. Numerous other competitive factors could impair our ability to maintain our revenues and achieve profitability. These factors include, but are not limited to, the following:
|
·
|
We compete with many other transportation service providers of varying sizes, some of which may have more equipment, a broader coverage network, a wider range of services, greater capital resources or have other competitive advantages;
|
|
·
|
Some of our competitors periodically reduce their prices to gain business, especially during times of reduced growth rates in the economy, which may limit our ability to maintain or increase prices or maintain revenue growth;
|
|
·
|
Many customers reduce the number of carriers they use by selecting “core carriers,” as approved transportation service providers, and in some instances we may not be selected;
|
|
·
|
Many customers periodically accept bids from multiple carriers for their shipping needs, and this process may depress prices or result in the loss of some business to competitors;
|
|
·
|
The trend towards consolidation in the ground transportation industry may create other large carriers with greater financial resources and other competitive advantages relating to their size;
|
|
·
|
Advances in technology require increased investments to remain competitive, and our customers may not be willing to accept higher prices to cover the cost of these investments; and
|
|
·
|
Competition from non-asset-based logistics and freight brokerage companies may adversely affect our customer relationships and pricing policies.
|
If our employees were to unionize, our operating costs would increase and our ability to compete would be impaired.
None of our employees are currently represented under a collective bargaining agreement. From time to time there may be efforts to organize our employees. There is no assurance that our employees will not unionize in the future, particularly if legislation is passed that facilitates unionization, such as the Employee Free Choice Act. The unionization of our employees could have a material adverse effect on our business, financial condition and results of operations because:
|
· Some shippers have indicated that they intend to limit their use of unionized trucking companies because of the threat of strikes and other work stoppages;
|
|
· Restrictive work rules could hamper our efforts to improve and sustain operating efficiency;
|
|
· Restrictive work rules could impair our service reputation and limit our ability to provide next-day services;
|
|
· A strike or work stoppage would negatively impact our profitability and could damage customer and employee relationships; and
|
|
· An election and bargaining process could divert management’s time and attention from our overall objectives and impose significant expenses.
|
13
Insurance and claims expenses could significantly reduce our profitability.
We are exposed to claims related to cargo loss and damage, property, damage, personal injury, workers’ compensation, long-term disability and group health. We have insurance coverage with third-party insurance carriers, but retain or self-insure a portion of the risk associated with these claims. If the number or severity of claims increases, or we are required to accrue or pay additional amounts because the claims prove to be more severe than our original assessment, our operating results would be adversely affected. Insurance companies may require us to obtain letters of credit to collateralize our self-insured retention. If these requirements increase, our borrowing capacity could be adversely affected. Our future insurance and claims expense might exceed historical levels, which could reduce our earnings. We expect our growth strategy to require a periodic reassessment or our insurance strategy, including self-insurance of a greater portion of our claims exposure resulting from workers’ compensation, auto liability, general liability, cargo and property damage claims, as well as employees’ health insurance under pending federal legislation, which we are unable to predict. We may also become responsible for our legal expenses relating to such claims. With growth, we will be required to periodically evaluate and adjust our claims reserves to reflect our experience. However, ultimate results may differ from our estimates, which could result in losses over our reserved amounts. We maintain insurance above the amounts for which we self-insure with licensed insurance carriers. Although we believe the aggregate insurance limits should be sufficient to cover reasonably expected claims, it is possible that one or more claims could exceed our aggregate coverage limits. Insurance carriers have raised premiums for many businesses, including trucking companies. As a result, our insurance and claims expense could increase, or we could raise our self-insured retention when our policies are renewed. If these expenses increase, or if we experience a claim in excess of our coverage limits, or we experience a claim for which coverage is not provided, results of our operations and financial condition could be materially and adversely affected.
Our customers and suppliers’ business may be slow to recover from the most recent downturn in the world wide economy and disruption of financial markets. We cannot predict the impact on the national and worldwide economy of an economic downturn.
Our business is dependent on a number of general economic and business factors that may have a materially adverse effect on our results of operations, many of which are beyond our control, table terms, because of the disruptions to the capital and credit markets. These customers represent a greater potential for bad debt losses, which may require us to increase our reserve for bad debt. Economic conditions resulting in bankruptcies of one or more of our large customers could have a significant impact on our financial position, results of operations or liquidity in particular year or quarter. Our suppliers’ business levels have also been and may continue to be adversely affected by current economic conditions or financial constraints, which could lead to disruptions in the supply and availability of equipment, parts and services critical to our operations. A significant interruption in our normal supply chain could disrupt our operations, increase our costs and negatively impact our ability to serve our customers.
We may be adversely impacted by fluctuations in the price and availability of diesel fuel.
We require large amounts of diesel fuel to operate our tractors and to power the temperature-control units on our trailers. Fuel is one of our largest operating expenses. Fuel prices tend to fluctuate and prices and availability of all petroleum products are subject to political, economic and market factors that are beyond our control. We do not hedge against the risk of diesel fuel price increases. We depend primarily on fuel surcharges, auxiliary power units for our tractors, volume purchasing arrangements with truck stop chains and bulk purchases of fuel at our terminals to control and recover our fuel expenses. We have no assurance that we will be able to collect fuel surcharges or enter into volume purchase agreements in the future. An increase in diesel fuel prices or diesel fuel taxes, or any change in federal or state regulations that results in such an increase, could have a material adverse effect on our operating results, unless the increase is offset by increases in freight rates or fuel surcharges charged to our customers. Historically, we have been able to offset significant increases in diesel fuel prices through fuel surcharges to our customers, and we were able to minimize the negative impact on our profitability in fiscal 2011 through 2012 that resulted from the rapid and significant increase to the cost of diesel fuel. Depending on the base rate and fuel surcharge levels agreed upon by individual shippers, a rapid and significant decline in the cost of diesel fuel could also have a material adverse effect on our operating results. We continuously monitor the components of our pricing, including base freight rates and fuel surcharges, and address individual account profitability issues with our customers when necessary. While we have historically been able to adjust our pricing to offset changes to the cost of diesel fuel, through changes to base rates and/or fuel surcharges, we cannot be certain that we will be able to do so in the future. The absence of meaningful fuel price protection through these measures, fluctuations in fuel prices, or a shortage of diesel fuel, could materially and adversely affect our results of operations.
14
Our operations are subject to various environmental laws and regulations, the violation of which could result in substantial fines or penalties.
We are subject to various federal, state and local environmental laws and regulations dealing with the handling and transportation of hazardous materials (“hazmat”) and waste (“hazwaste”) (which accounts for approximately twenty percent of our current business). We operate in industrial areas, where truck terminals and other industrial activities are located, and where groundwater or other forms of environmental contamination have occurred. Our operations involve the risks of fuel spillage or seepage, environmental damage and hazardous waste disposal, among others. If a spill or other accident involving fuel, oil or hazardous substances occurs, or if we are found to be in violation of applicable laws or regulations, it could have a material adverse effect on our business and operating results. One of our subsidiaries specializes in transport of hazardous materials and waste. If we should fail to comply with applicable environmental laws and regulations, we could be subject to substantial fines or penalties, to civil and criminal liability and to loss of our licenses to transport the hazardous materials and waste. Under certain environmental laws, we could also be held responsible for any costs relating to contamination at our past facilities and at third-party waste disposal sites. Any of these consequences from violation of such laws and regulations could be expected to have a material adverse effect on our business and prospects, financial and otherwise.
Increased prices, reduced productivity, and restricted availability of new revenue equipment could cause our financial condition, results of operations and cash flows to suffer.
Prices for new tractors have increased over the past few years, primarily as a result of higher commodity prices, better pricing power among equipment manufacturers, and government regulations applicable to newly manufactured tractors and diesel engines. We expect to continue to pay increased prices for revenue equipment and incur additional expenses and related financing costs for the foreseeable future. Our business could be harmed if we are unable to continue to obtain an adequate supply of new tractors and trailers or if we have to pay increased prices for new revenue equipment. We face increasing prices for new power units.
Seasonality and the impact of weather can adversely affect our profitability.
Our tractor productivity generally decreases during the winter season because inclement weather impedes operations and some shippers reduce their shipments. At the same time, operating expenses generally increase with harsh weather creating higher accident frequency, increased claims and more equipment repairs. We can also suffer short-term impacts from weather-related events such as hurricanes, blizzards, ice-storms, and floods that could harm our results or make our results more volatile.
Increases in driver compensation, difficulty in attracting drivers and driver turn-over could affect our profitability and ability to grow.
We periodically experience difficulties in attracting and retaining qualified drivers, including independent contract drivers. With increased competition for drivers, we could experience greater difficulty in attracting sufficient numbers of qualified driers. Our competitors may offer better compensation plans, and thus increase the driver turnover we experience. Due to current economic conditions and regulatory changes which have recently increased the demand for drivers and the cost of fuel and insurance, the available pool of independent contractor drivers is smaller than it was during 2008 through 2010. Accordingly, we may and periodically do face difficulty in attracting and retaining drivers for all of our current tractors and for those we may add. We may face difficulty in increasing the number of our independent contractor drivers. In addition, our industry suffers from high turnover rates of drivers. Our turnover rate requires us to recruit a substantial number of drivers. Moreover, our turnover rate could increase. If we are unable to continue to attract drivers and contract with independent contractors, we could be required to continue adjusting our driver compensation package beyond the norm or let equipment sit idle. An increase in our expenses or in the number of power units without drivers could materially and adversely affect our growth and profitability. Our operations may be affected in other ways y a shortage of qualified drivers in the future, such as temporary under-utilization of our fleet, difficulty in meeting shipper demands and increases in compensation levels for our drivers. When we encounter difficulty in attracting or retaining qualified drivers, our ability to service our customers and increase our revenue could be adversely affected. A shortage of qualified drivers in the future could cause us to temporarily under-utilize our fleet, face difficulty in meeting shipper demands and increase our compensation levels for drivers.
15
Shrinkage in the pool of eligible drivers could affect our profitability and ability to grow.
The ongoing Comprehensive Safety Analysis, often referred to as CSA 2010, is projected to reduce the driver pool. Every driver receives a score based upon his or her individual performance in six categories, which are then combined into a single score, and this score is compared to the scores of all other drivers to determine how “safe” the driver is. Drivers with lower scores are less hirable or not hirable. (Fleet Owner, December 13, 2012) A shortage of qualified drivers from time to time could cause us to temporarily under-utilize our fleet, face difficulty in this seems aged a bit meeting shipper demands and increase our compensation levels for drivers.
We operate in a highly regulated industry and increased costs of compliance with, or liability for violation of, existing or future regulations could have a materially adverse effect on our business.
The USDOT and various state and local agencies exercise broad powers over our business, generally governing such activities as authorization to engage in motor carrier operations, safety and insurance requirements. Our company drivers and independent contractors also must comply with the safety and fitness regulations promulgated by the USDOT, including those relating to drug and alcohol testing and hours-of-service. We also may become subject to new or more restrictive regulations relating to fuel emissions, drivers’ hours-of-service, ergonomics, or other matters affecting safety or operating methods. Other agencies, such as the EPA and the Department of Homeland Security, or DHS, also regulate our equipment, operations, and drivers. Future laws and regulations may be more stringent and require changes in our operating practices, influence the demand for transportation services, or require us to incur significant additional costs. Higher costs incurred by us or by our suppliers who pass the costs onto us through higher prices could adversely affect our results of operations.
In the aftermath of the September 11, 2001 terrorist attacks, federal, state, and municipal authorities have implemented and continue to implement various security measures, including checkpoints and travel restrictions on large trucks. As a result, it is possible we may fail to meet the needs of our customers or may incur increased expenses to do so. These security measures could negatively impact our operating results.
Some states and municipalities have begun to restrict the locations and amount of time where diesel-powered tractors, such as ours, may idle, in order to reduce exhaust emissions. From time to time, various federal, state, or local taxes are increased, including taxes on fuels. We cannot predict whether, or in what form, any such increase applicable to us will be enacted, but such an increase could adversely affect our profitability.
Higher interest rates on borrowed funds would adversely impact our results of operations.
We rely on borrowings to finance our revenue equipment and receivables. We are subject to interest rate risk to the extent of our borrowings. Even though we attempt to manage our interest rate risk by managing the amount of debt we carry, our debt levels are not entirely within our control in the short term. An increase in the rates of interest we incur on borrowings and financing we cannot decrease in the short term without adversely impacting our level of service to our customers and expansion of our business will adversely affect our results of operations.
16
"Penny stock” rules may make buying and selling our common stock difficult.
Trading in our common stock is subject to the "penny stock" rules of the Securities and Exchange Commission. The penny stock rules require a broker-dealer, prior to a transaction in a penny stock to deliver a standardized risk disclosure document that provides information about penny stocks and the risks in the penny stock market. The broker-dealer must also provide the customer with current bid and offer quotations for the penny stock, the compensation of the broker-dealer and its salesperson in the transaction, and monthly account statements showing the market value of each penny stock held in the customer’s account. In addition, the penny stock rules generally require that prior to a transaction in a penny stock the broker-dealer make a special written determination that the penny stock is a suitable investment for the purchaser and receive the purchaser’s written agreement to the transaction. These disclosure requirements may have the effect of reducing the level of trading activity in the secondary market for a stock that becomes subject to the penny stock rules. Our securities are subject to the penny stock rules, and investors may find it more difficult to sell their securities.
We do not have controls and procedures in place as required by Section 404 of the Sarbanes-Oxley Act of 2002.
As noted above, the operational and financial control of our subsidiaries has remained under the management of the founders of and stockholders from whom we acquired the respective companies. We do not have controls and procedures in place from a parent company level or the subsidiary level to satisfy Section 404 of the Sarbanes-Oxley Act of 2002. While we expect to put controls and procedures in place for these purpose in the process of consolidating and centralizing overlapping and duplicative elements of these companies, doing so will require debt or equity funding you have no assurance we will be able to obtain. Until we are able to put these controls and procedures in place, we expect to devote additional management time to confirming the accuracy and timeliness of our reports.
We will incur significant expense in complying with Section 404 of the Sarbanes-Oxley Act of 2002 on a timely basis.
The SEC, as directed by Section 404 of the Sarbanes-Oxley Act, adopted rules generally requiring each public company to include a report of management on the company's internal controls over financial reporting in its annual report on Form 10-K that contains an assessment by management of the effectiveness of the company's internal controls over financial reporting. We expect that we may need to hire and/or engage additional personnel and incur incremental costs in order to complete the work as required by Section 404. We have initially concluded that our internal controls are not effective; in the event that in the future we conclude that our internal controls are effective, our independent accountants may disagree with our assessment and may issue a report that is qualified. Any failure to implement required new or improved controls, or difficulties encountered in their implementation, could harm our operating results or cause us to fail to meet our reporting obligations.
ITEM 1B. UNRESOLVED STAFF COMMENTS.
We are not an accelerated filer or a large accelerated filer, as defined in Rule 12b-2 of the Exchange Act (§240.12b-2 of this chapter), or a well-known seasoned issuer as defined in Rule 405 of the Securities Act (§230.405 of this chapter); and, we are not subject to this item. Nevertheless, we do not have any unresolved comments from the SEC staff.
ITEM 2. PROPERTIES.
During this initial restructuring management elected to eliminate as much corporate overhead as possible to include its corporate headquarters office. Our senior management during this period provides services using a virtual office from their respective homes and home offices without charge to us. Our corporate office in Southbury, Connecticut refers to a virtual office of our Chief Executive Officer. Under new management, we anticipate that we will establish a corporate headquarters, but you have no assurance as to when or if we will do so.
17
The headquarters of our operating subsidiaries are located in Hamburg, Arkansas and Scotts Bluff, Nebraska. The following table presents information regarding these facilities.
|
Location
|
Acres
|
Under Roof*
|
Office*
|
Warehouse*
|
Service*
|
Trucks Accommodated
|
|||||||||||||||
|
|
|
||||||||||||||||||||
|
Hamburg facility (Morris)
|
10
|
15,000
|
3,000
|
none
|
12,000
|
170 trucks
|
|||||||||||||||
|
Scotts Bluff facility (Smith)
|
10
|
36,500
|
3,000
|
30,000
|
3,500
|
400 trucks
|
|||||||||||||||
_____________
*Number indicates square feet.
We lease both of these facilities. Terms of the leases are described in the following table:
|
Location
|
|
Lessor
|
|
|
Lease ends
|
|
|
Annual rental
|
|
|
Annual adjustment
|
|
|
|
|
|
|
|
|
|
|
|
|
|
|
Hamburg facility (Morris)
|
|
T. Mark Morris
|
|
|
(1)
|
(1)
|
|
|
none
|
||
|
|
|
|
|
|
|
|
|
||||
|
Scotts Bluff facility (Smith)
|
|
Colorado Holdings
|
|
|
(2)
|
(2)
|
|
|
none
|
|
(1)
|
We have been paying the mortgage payments to an unrelated lender on behalf of an entity controlled by Mr. Morris as rent without a formal lease and intend to purchase the property at fair market value, as determined by appraisal, which may require us to refinance the mortgage.
|
|
(2)
|
The facility is owned by Colorado Holdings, a company controlled by Mr. Smith, Annual rental rate is $48,000, which we accrue but are not being required to pay until Smith Systems Transportation’s cash flow is adequate.
|
We also have a rented terminal operation in Arcadia, California principally to serve the Smith Systems Transportation eastbound shipments. We also rent yard facilities or drop yards on a short term basis as the seasonal and operational needs of our customers require. These yard facilities are routinely located in Kimball, Nebraska, Denver, Colorado, Las Vegas, Nevada, Tulsa, Oklahoma, Indianapolis, Indiana, and Houston, Texas. In most cases yard facilities are limited to leasing a specific number of secure (fenced) trailer parking places. Typically we rent on an as-needed basis in terminal facilities of other trucking companies.
We believe all of these facilities are adequate for our operations for the foreseeable future. We expect to acquire additional facilities for operations when we make future acquisitions, of which you have no assurance.
ITEM 3. LEGAL PROCEEDINGS
Our ability to aggressively defend and to prosecute the litigation described under this item depends significantly on our ability to fund legal fees and related costs of litigation.
Active litigation:
As a lender to the Company and its subsidiaries, Hillair Capital Investments, LP partially funded the Company’s acquisition of Cross Creek and a portion of the Company’s working capital requirements in 2011 via two notes totaling $339,660. Hillair initially sought $1,200,000 in unspecified damages in New York State. In 2014, the Company settled with Hillair for $400,000 payable $100,000 down and $300,000 paid pro rata over the following three year period. Under the court order the Company became in default of the agreement by its terms. In the event of a default, Hillair’s recovery is limited to $450,000. The Company continues to discuss with Hillair an economic resolution of the matter and has booked the full defaulted amount.
As a lender to the Company, Luberski, Inc. loaned the Company $400,000, via two Notes in 2011. The Company defaulted on both loans and Luberski ultimately received a judgment against one of Company’s two subsidiaries. In 2015, the Company and Luberski were actively negotiating the settlement of the outstanding balance. The Company has booked reserves equivalent to the debt outstanding plus interest and fees that may become due.
18
In 2012, Chapman and Associates sued the Company for fees related to their role as a broker of two acquired subsidiaries of the Company and received a judgment for the full amount of the suit. The Company had reserved approximately $900,000 relating to this debt and in March 2015 settled this judgment for $170,000 in cash and stock.
The Nutmeg/Fortuna Fund litigation relates to the collection on a 2008 promissory note wherein Nutmeg had received a judgment for $175,000 against the Company. In April 2015 the parties settled the judgment balance for $100,000 payable over six months.
Other litigation:
In April 2012, the Company entered into a forbearance agreement with Michael S. DeSimone, former owner of Cross Creek Trucking, Inc. As part of the agreement we issued a confession of judgment to Mr. DeSimone in the amount of $3,745,415 plus accrued interest. We agreed to pay $5,000 per month commencing September 1, 2012 but are not currently in compliance with the agreement and are in negotiations to restructure the terms of the original agreement.
In January 2013 Robins Consulting, Inc. filed suit against us and our former CEO Paul Henley for $572,000 in broker fees related to the acquisition of Cross Creek Trucking, and in December 2014, received a judgment in the amount of $991,000. The Company has filed counter claims, and a bill of review to overturn the judgment. In addition, the Company has filed suit against Robins for its role in the acquisition of Cross Creek Trucking. The amount of $572,500 is included in notes payable at March 31, 2014.
Litigation in the normal course of business
We expect to be engaged in litigation from time to time in the normal course of our business as a motor freight carrier. Claims for worker’s compensation, auto accident, general liability and cargo and property damage are routine occurrences in the motor transportation industry. We have programs and policies which are designed to minimize the events that result in such claims. We maintain insurance against workers’ compensation, auto liability, general liability, cargo and property damage claims. We are responsible for deductible amounts up to $3,000 per accident. We periodically evaluate and adjust our insurance and claims reserves to reflect our experience. Our workers’ compensation claims are entirely covered by our insurance. Insurance carriers have raised premiums for many businesses, including truck transportation companies. As a result, our insurance and claims expense could increase, or we could raise our deductible when our policies are renewed. We believe that our policy of self-insuring up to set limits, together with our safety and loss prevention programs, are effective means of managing insurable costs.
ITEM 4. MINE SAFETY DISCLOSURES.
Not applicable.
19
PART II
ITEM 5. MARKET FOR REGISTRANT’S COMMON EQUITY, RELATED STOCKHOLDER MATTERS AND ISSUER PURCHASES OF EQUITY SECURITIES.
Market information. Our common stock trades on OTC Bulletin Board under the symbol, IFCR. The following quotations reflect inter–dealer prices without retail markup, markdown, or commission, and may not necessarily represent actual transactions. The quarterly ranges of high and low sales prices per share for the past two fiscal years have been as follows:
|
|
Sales Price
|
|||||||
|
Quarters Ended
|
High
|
Low
|
||||||
|
|
||||||||
|
June 30, 2012
|
$
|
.05
|
$
|
.001
|
||||
|
September 30, 2012
|
.02
|
.001
|
||||||
|
December 31, 2012
|
.05
|
.002
|
||||||
|
March 31, 2013
|
.04
|
.01
|
||||||
|
June 30, 2013
|
$
|
.03
|
$
|
.003
|
||||
|
September 30, 2013
|
.035
|
.001
|
||||||
|
December 31, 2013
|
.02
|
.001
|
||||||
|
March 31, 2014
|
.02
|
.005
|
||||||
On April 24, 2015, the last reported sales price of our common stock was $.0023.
Dividends. We have never declared or paid any dividends on our common stock. Because we currently intend to retain any future earnings to finance operations and growth, we do not anticipate paying any cash dividends in the foreseeable.
Transfer Agent. We have engaged Direct Transfer LLC, 500 Perimeter Park Drive, Suite D, Morrisville, NC, 27560 as our transfer agent. The telephone number of our transfer agent is 919-481-4000.
Recent Sales of Unregistered Securities. All sales of equity securities during our fiscal year ended March 31, 2012 have been reported on Form 8-K and Form 10-Q. The following is a listing of all equity securities issued since that date through the date of this report;
In April, 2012, the Company issued 1,444,473 common shares in satisfaction of convertible debt
In April, 2012, the Company issued 649,996 common shares for services
In May, 2012, the Company issued 3,445,614 common shares in satisfaction of convertible debt
In June, 2012, the Company issued 1,857,143 common shares in satisfaction of convertible debt
On June 30, 2012, the Company issued 20,000,000 common shares in conjunction with the sale of all of its interest in the discontinued operations of Triple C Transport, Cross Creek Trucking and Integrated Freight Services
20
On August 3, 2012, the Company issued 10,000,000 common shares to Fuselier Consulting in accordance with the terms of a consulting contract. The stock was valued at $.002, its fair market value at the date of issuance
In August, 2012, the Company issued 5,000,000 common shares to Jackson Morris for services. The stock was valued at $.002 per share, its fair market value at the date of issuance
In October, 2012, the Company issued 30,247,500 common shares for services. The stock was valued at $.005 per share, its fair market value at the date of issuance
In August, 2013, the Company issued 5,000,000 common shares for services.
In October, 2013, the Company issued 5,606,061 common shares for services
In December, 2013, the Company issued 60,000,000 common shares for accrued compensation to Officers of the Company. The shares were valued using a volume weighted average price of $.004 per share
In February, 2014, the Company issued 73,407,828 common shares for accrued compensation to Officers of the Company. The shares were valued using a volume weighted average price of $.007 per share
In October, 2014, the Company issued 10,000,000 common shares for services.
In October, 2014, the Company issued 20,000,000 common shares to Fuselier Consulting in accordance with the terms of a consulting contract. The stock was valued at $.0071 per share, its fair market value at the date of issuance
In November, 2014, the Company issued 13,500,000 common shares for services. The stock was valued at $.0072 per share, its fair market value at the date of issuance
In November, 2014, the Company issued 8,278,265 common shares for accrued compensation to Officers of the Company. The shares were valued using a volume weighted average price of $.017 per share
In January, 2015, the Company issued 35,219,711 common shares in satisfaction of convertible debt
In February, 2015, the Company issued 875,000 common shares as part of a negotiated settlement on debt
In February, 2015, the Company issued 9,198,529 common shares for services.
In February, 2015, the Company issued 36,310,721 common shares in satisfaction of convertible debt
In March, 2015, the Company issued 40,223,804 common shares in satisfaction of convertible debt
These shares were issued in transactions deemed exempt from the registration requirements of the Securities Act, in reliance of either or both Regulation D or Section 4(2) of the Securities Act as a transaction by an issuer not involving a public offering.
ITEM 6. SELECTED FINANCIAL DATA
As a Smaller Reporting Company, we are not required to include the disclosure under this Item 6 Selected Financial Data.
21
ITEM 7. MANAGEMENT’S DISCUSSION AND ANALYSIS OR PLAN OF OPERATION
You should read the following information in conjunction with our financial statements and related notes contained elsewhere in this report. You should consider the risks and difficulties frequently encountered by early-stage companies, particularly those engaged in new and rapidly evolving markets and technologies. Our limited operating history provides only a limited historical basis to assess the impact that critical accounting policies may have on our business and our financial performance.
Overview
The main factors that affect our results of operations are the number of tractors we operate, our revenue per tractor (which includes primarily our revenue per total mile and our number of miles per tractor), and our ability to control our costs.
Over the course of the last year, market prices for diesel fuel have been substantially more stable than 2011-2012. As a result, fuel surcharges have tended to more adequately reflect the recapture of continued high fuel costs. Management routinely compares market fuel price fluctuations relative to the Company base fuel price in an effort to insure that its fuel surcharge level is adequate and that it is properly applied to all freight invoices.
Operating Results
The following table presents and compares the results of our operations for the fiscal years ended March 31, 2014 and 2013.
|
2014
|
2013
|
$ change
|
% change
|
|||||||||||||
|
Revenue
|
20,166,312
|
20,102,263
|
64,049
|
0.3
|
%
|
|||||||||||
|
Operating Expenses
|
||||||||||||||||
|
Rents and transportation
|
5,272,372
|
4,346,988
|
925,384
|
21.3
|
%
|
|||||||||||
|
Wages, salaries and benefits
|
5,401,424
|
4,982,068
|
419,356
|
8.4
|
%
|
|||||||||||
|
Fuel and fuel taxes
|
5,915,747
|
6,529,886
|
(614,139
|
)
|
-9.4
|
%
|
||||||||||
|
Insurance and claims
|
1,409,471
|
1,297,450
|
112,021
|
8.6
|
%
|
|||||||||||
|
Operating taxes and licenses
|
251,219
|
345,282
|
(94,063
|
)
|
-27.2
|
%
|
||||||||||
|
Stock based compensation
|
121,924
|
187,878
|
(65,954
|
)
|
-35.1
|
%
|
||||||||||
|
General and administrative
|
1,297,183
|
924,669
|
372,514
|
40.3
|
%
|
|||||||||||
|
Depreciation and amortization
|
926,622
|
1,137,323
|
(210,701
|
)
|
-18.5
|
%
|
||||||||||
|
Total Operating Expenses
|
20,595,962
|
19,751,544
|
844,418
|
4.3
|
%
|
|||||||||||
|
Income(Loss) from operations
|
(429,650
|
)
|
350,719
|
(780,369
|
)
|
-222.5
|
%
|
|||||||||
|
Other Income (Expense)
|
||||||||||||||||
|
Derivative Gain (Loss)
|
20,706
|
36,071
|
(15,365
|
)
|
-42.6
|
%
|
||||||||||
|
Interest expense
|
(1,380,289
|
)
|
(991,833
|
)
|
(388,456
|
)
|
39.2
|
%
|
||||||||
|
Other income (expense)
|
286,943
|
391,752
|
(104,809
|
)
|
-26.8
|
%
|
||||||||||
|
Gain on debt settlements
|
69,334
|
664,860
|
(595,526
|
)
|
-
|
|||||||||||
|
Total Other Income (Expense)
|
(1,003,306
|
)
|
100,850
|
(1,104,156
|
)
|
-1094.8
|
%
|
|||||||||
|
Non-controlling interest - income (loss)
|
-
|
-
|
-
|
-
|
||||||||||||
|
Income (loss) from continuing operations
|
(1,432,956
|
)
|
451,569
|
(1,884,525
|
)
|
-417.3
|
%
|
|||||||||
|
Income (loss) from discontinued operations
|
-
|
4,360,889
|
(4,360,889
|
)
|
-100.0
|
%
|
||||||||||
|
Net Income (Loss)
|
(1,432,956
|
)
|
4,812,458
|
(6,245,414
|
)
|
-129.8
|
%
|
|||||||||
Our largest expenses, for example truck lease and financing costs, tend to be fixed. These expenses represent a significant use of cash flow. Our driver payroll fluctuates with the freight shipped; however, we do have fixed payroll expenses for the office, management and the shop that do not vary in relation to freight revenues. The Company achieved substantial reductions in both general and administrative expenses as well as other areas of fixed overhead expense. The operating companies have focused much attention on revenue quality, that is, improving the per mile yield. With the improving economy, the companies have been able to take selective rate increases and discontinue business that did not meet minimum per mile yield standards. For the full year the operating companies also improved fuel expense through improved buying and better miles per gallon.
22
Seasonality
Typically, revenue generally decreases as customers reduce shipments during the winter holiday season and as inclement weather impedes operations. At the same time, operating expenses generally increase, with fuel efficiency declining because of engine idling and weather, creating more equipment repairs. For the reasons stated, our fiscal fourth quarter results have historically has been lower than results in each of the other three quarters of the fiscal year excluding charges. Our equipment utilization typically improves substantially in the first and second fiscal quarters of each fiscal year because of the trucking industry's seasonal shortage of equipment. It is during these periods that most U.S. manufacturing firms conduct the heaviest shipment volumes of the year. Moreover, industry capacity is further stretched during these periods by agriculture-related seasonal demand for trucking services.
Results of Continuing Operations
Revenues
For the fiscal year ended March 31, 2014, we reported revenues of $20,166,312 as compared to revenues of $20,102,263 for the fiscal year ended March 31, 2013, an increase of $64,049 or .3%. This increase is small due to the combination of an unusually difficult winter weather season and the continuing shortage of qualified truck drivers.
Operating Expenses
Our total operating expenses increased 4.3% to $20,595,962 for the fiscal year ended March 31, 2014, as compared to $19,751,544 for the fiscal year ended March 31, 2013. These changes include:
Rents and Transportation. For the fiscal year ended March 31, 2014, rents and transportation costs were $5,272,372 as compared to $4,346,988 for the fiscal year ended March 31, 2013, an increase of $925,384 or 21.3%. The increase was primarily a result of greater reliance on full service truck leases because of a shortage of growth capital available for tractor purchases.
Wages, salaries and benefits. For the fiscal year ended March 31, 2014, wages, salaries and benefits costs were $5,401,424 as compared to $4,982,068 for the fiscal year ended March 31, 2013, an increase of $419,356 or 8.4%.
Fuel and fuel taxes. For the fiscal year ended March 31, 2014, the cost of fuel and fuel taxes were $5,915,747 as compared to $6,529,886 for the fiscal year ended March 31, 2013, a decrease of $614,139 or 9.4%. The decrease in fuel expense is a result of slightly lower revenue miles and improved fuel mileage from the newer leased tractors in the fleet.
Insurance and claims. For the fiscal year ended March 31, 2014, insurance and claims costs were $1,409,471 as compared to $1,297,450 for the fiscal year ended March 31, 2013, an increase in of $112,021 or 8.6.9%, which we believe is in line with industry-wide insurance rate increases for the period.
Operating taxes and licenses For the fiscal year ended March 31, 2014, operating taxes and licenses costs were $251,219 as compared to $345,282 for the fiscal year ended March 30, 2013, a decrease of $94,063 or 27.2%.
Stock based compensation For the fiscal year ended March 31, 2014, stock based compensation was $121,924 as compared to 187,878 for the fiscal year ended March 31, 2013, a decrease of $65,954 or 35.1%.
General and administrative expenses. General and administrative expenses are the expenses of operating the business on a daily basis that are not related directly to cost of services and include managerial salaries, legal fees and rent and utilities. General and Administrative expenses were $1,297,183 for the fiscal year ended March 31, 2014 as compared to fiscal year ended March 31, 2013, when general and administrative expenses costs were $924,669, an increase of $372,514 or 40.3%. This comparative increase is a direct result of management’s restructuring and turnaround plan initially implemented during 2013. In this plan, corporate overhead was severely reduced or eliminated and no resources were expended for G&A in 2013 other than those deemed by the board and management as mission critical.
23
Depreciation and amortization. For the fiscal year ended March 31, 2014, depreciation and amortization costs were $926,622 as compared to $1,137,323 for the fiscal year ended March 31, 2013, a decrease of $210,701 or 18.5%. This decrease is due to the subsidiary companies converting to full service tractor leases, and intangible assets being fully amortized.
Income (Loss) from Operations We reported a loss from operations of $429,650 for the fiscal year ended March 31, 2014 as compared to an income from operations of $350,719 for the fiscal year ended March 31, 2013, a decrease of $780,369 or 222.5%.
Other Income (Expense)
We reported total other income (expense) of $(1,003,306) for the fiscal year ended March 31, 2014 as compared to $100,850 for the fiscal year ended March 31, 2013, a decrease of $1,003,306. This large decrease is the cumulative effect of the changes in each of the following components of other income (expense);
We had a gain on derivatives of $20,706 for the fiscal year ended March 31, 2014 as compared to a derivative gain of $36,071 for the fiscal year ended March 31, 2013.
Interest expense for the fiscal year ended March 31, 2014 was $1,380,289 compared to $991,833 for the fiscal year ended March 31, 2013, an increase of $388,456 or 39.2%.
Other income (expense) for the fiscal year ended March 31, 2014 was $286,943 compared to $391,752 for the fiscal year ended March 31, 2013, a decrease of $104,809 or 26.8%.
We had gain on debt settlements of $69,334 for the fiscal year ended March 31, 2014 as compared to $664,860 for the fiscal year ended March 31, 2013. These gains were a result of management executing its business plan to restructure its balance sheet and eliminate debt.
Non-Controlling Interest
We acquired the non-controlling interest for the fiscal year ended March 31, 2013, and consequently no longer have an allocation of results of operation to any outside parties.
Income (Loss) from Continuing Operations
The Company had a Loss from Continuing Operations of $1,432,956 for the fiscal year ended March 31, 2014 as compared to an Income from Continuing Operations of $451,569 for the fiscal year ended March 31, 2013, a decrease of $1,884,525.
Results of Discontinued Operations
On June 30, 2012, we successfully sold the discontinued operations as detailed below. The completion of this sale resulted in a gain of $4,360,889 for the fiscal year ended March 31, 2013. There is no income of loss associated with discontinued operations for the fiscal year ended March 31, 2014.
24
Triple C Transport
As more fully discussed in Note 2 to our financial statements, we shut down Triple C Transport’s operations due to the loss of the tractor and trailer fleet it was leasing from the former owners. As was our practice with previous acquisitions, the former owners continued to manage the day to day operations of Triple C Transport and it leased approximately ninety-one power units and ninety-nine trailers from companies owned by the former owners for payments equal to the payment those companies were making under their financing agreements for that equipment, which was approximately $300,000 a month. During the latter part of October 2010, the former owners of Triple C Transport notified us in writing that entities controlled by them and receiving lease payments from Triple C Transport were having difficulty servicing the debt of the related entities. Two of those entities White Farms Trucking, Inc. (“WFT”) and Craig Carrier Corporation, LLC (“CCC”) ultimately filed Chapter 11 bankruptcy in the United States Bankruptcy Court for the District of Nebraska, on December 21, 2010, which was assigned case numbers 10-43797 and 10-43798.
On June 30, 2012, we sold 100% of the issued and outstanding shares of common stock of each of Triple C Transport, Cross Creek Trucking of Central Point, OR and Integrated Freight Services of Sarasota, FL to Deep South Capital, LLC. Under the terms of the purchase agreement, Deep South received all right, title, and interest to the shares of each company for a total purchase price each of $1.00 and the issuance to Deep South of an aggregate of 10,000,000 shares of our common stock.
Integrated Freight Services
In February 2011, we formed Integrated Freight Services ("IFS") in Sarasota, Florida. IFS was a startup company whose initial mission was to function as a freight broker that could serve the needs of all our subsidiary companies. Shortly after IFS commenced freight operations, Triple C Transport began the wind down of its operations (above) and IFS was forced to change its mission to brokering the refrigerated cargo previously hauled by Triple C. IFS ceased all operations when Cross Creek Trucking (below) ceased operations.
On June 30, 2012, we sold 100% of the issued and outstanding shares of common stock of each of Triple C Transport, Cross Creek Trucking of Central Point, OR and Integrated Freight Services of Sarasota, FL to Deep South Capital, LLC. Under the terms of the Cross Creek purchase agreement, Deep South received all right, title, and interest to the shares of Integrated Freight Services as well.
Cross Creek Trucking
On April 1, 2011 we acquired Cross Creek Trucking of Central Point, Oregon. At the date of acquisition, Cross Creek had marginal cash flow due to its extremely aggressive equipment financing terms. During that same period, market fuel prices spiked upward sharply and remained high. Although Cross Creek employed a fuel surcharge program, it was unable to recover the increased fuel costs from its customers resulting in insufficient cash flow. Portions of the Cross Creek fleet were redeployed to Nebraska to haul IFS cargo in order to maintain those customer relationships and to recapture a higher level of fuel surcharge. In December 2011 we discontinued operations at Cross Creek and IFS.
On June 30, 2012, we sold 100% of the issued and outstanding shares of common stock of each of Triple C Transport, Cross Creek Trucking of Central Point, OR and Integrated Freight Services of Sarasota, FL to Deep South Capital, LLC. Under the terms of the purchase agreement, Deep South received all right, title, and interest to the shares of each company for a total purchase price each of $1.00 and the issuance to Deep South of an aggregate of 10,000,000 shares of our common stock.
Net Income (Loss)
We reported a net loss of $1,432,956 for the fiscal year ended March 31, 2014 as compared to a net income of $4,812,458 for the fiscal year ended March 31, 2013, a decrease of $6,245,414.
25
Results by Operational Subsidiary
Morris Transportation
For the fiscal year ended March 31, 2014, Morris Transportation had revenues of $9,501,416 compared with revenues of $9,759,373 for the fiscal year ended March 31, 2013, a decrease of $257,957 or 2.6%. This decrease is primarily due to generally weaker demand in the paper markets and intense competition in the driver recruiting and retention markets. As a result, the company experienced several unmanned power units much of the year.
For the fiscal year ended March 31, 2014, Morris Transportation had a net loss of $241,200 compared with a net loss of $305,755 for the fiscal year ended March 31, 2013, a decrease of $64,555.
Morris Transportation total assets at March 31, 2014, were $2,587,833, as compared to total assets of $3,207,821 as of March 31, 2013, a decrease of $619,988. This decrease is primarily due to the company’s ongoing conversion from owned to leased power units.
Smith Systems Transportation
For the fiscal year ended March 31, 2014, Smith Systems Transportation had revenues of $10,664,895 compared with revenues of $10,342,890 for the fiscal year ended March 31, 2013, an increase of $322,005 or 3.1%. This increase is primarily due to increased petroleum charges, general improvement in the trucking demand in the Central and Mountain markets of the United States and, specifically, to much stronger demand in the hazardous waste market. Smith was able to service this significant increase in demand by expanding its capacity with both company and independent contractor drivers.
Smith Systems Transportation had a net loss of $224,928 for the fiscal year ended March 31, 2014 compared with a net income of $133,862 for the fiscal year ended March 31, 2013, a decrease of $358,790. This decrease is primarily a result of strong demand in the hazardous waste markets to include the expanding hydraulic fracturing water recovery market.
Smith Systems total assets were $1,909,203 at March 31, 2014 as compared to total assets of $2,834,075 at March 31, 2013, a decrease of $924,872.
Liquidity and Capital Resources
Liquidity is the ability of a company to generate funds to support its current and future operations, satisfy its obligations and otherwise operate on an ongoing basis. The following table provides an overview of certain selected balance sheet comparisons related to continuing operations at March 31, 2014 and 2013.
|
March 31, 2014
|
March 31, 2013
|
$ change
|
% change
|
|||||||||||||
|
Working Capital
|
(13,205,745
|
)
|
(12,895,289
|
)
|
(310,456
|
)
|
2.4
|
%
|
||||||||
|
Cash
|
35,818
|
81,429
|
(45,611
|
)
|
-56.0
|
%
|
||||||||||
|
Accounts receivable, net
|
2,426,976
|
3,039,276
|
(612,300
|
)
|
-20.1
|
%
|
||||||||||
|
Prepaid expenses and other assets
|
360,052
|
351,853
|
8,199
|
2.3
|
%
|
|||||||||||
|
Property and equipment, net
|
1,962,039
|
2,857,195
|
(895,156
|
)
|
-31.3
|
%
|
||||||||||
|
Bank overdraft
|
266,042
|
304,656
|
(38,614
|
)
|
-12.7
|
%
|
||||||||||
|
Accounts payable
|
1,417,189
|
1,296,405
|
120,784
|
9.3
|
%
|
|||||||||||
|
Accrued expenses and other liabilities
|
2,173,662
|
2,572,199
|
(398,537
|
)
|
-15.5
|
%
|
||||||||||
|
Other liabilities
|
721,130
|
790,464
|
(69,334
|
)
|
-8.8
|
%
|
||||||||||
|
Line of credit
|
708,108
|
611,356
|
96,752
|
15.8
|
%
|
|||||||||||
|
Notes payable
|
12,394,292
|
13,102,473
|
(708,181
|
)
|
-5.4
|
%
|
||||||||||
|
Derivative liability
|
8,874
|
29,580
|
(20,706
|
)
|
-70.0
|
%
|
||||||||||
|
Common stock
|
260,524
|
116,510
|
144,014
|
123.6
|
%
|
|||||||||||
|
Additional paid-in capital
|
9,925,421
|
9,163,511
|
761,910
|
8.3
|
%
|
|||||||||||
26
Cash Flows and Working Capital
Our cash flow from operations is insufficient to meet current obligations. In fiscal year 2014 and 2013, we relied upon additional investment through sales of common stock and debentures in order to fund our operations. We anticipate the need to raise significant amounts of capital in order to fund operations in the next fiscal year.
As a result of losses we have incurred to date, we have financed our operations primarily through equity and debentures. At March 31, 2014, we had $35,818 in cash and cash equivalents. We had receivables, net of allowances, of $2,426,976 and our current liabilities were $16,028,591.
Our sales cycle can be several weeks or longer, followed by a period of time in which to collect our receivables, with some costs incurred immediately, making our business working-capital intensive. We do not anticipate a profitability level that would resolve its cash flow issues in the foreseeable future and expects to rely upon acquisitions and capital contributed by investors to fund its operations.
We have significant capital expenditures, although leasing can reduce our equipment cost when justified by the level of sales.
Operating Activities
Net cash provided by operating activities for the fiscal year ended March 31, 2014 totaled $364,544 as compared to $1,079,296 used by operating activities for the fiscal year ended March 31, 2013, a decrease of $714,752. For the fiscal year ended March 31, 2014, we had a net loss of $1,432,956. Non-cash items included depreciation and amortization expense of $926,622 and stock based compensation of $121,924. During the fiscal year ended March 31, 2013, we experienced a net income of $4,812,458, which included a large gain on the sale of the discontinued operations of $4,360,889; along with non-cash items such as depreciation and amortization expense $1,137,323.
Investing Activities
Net cash provided by investing activities for the fiscal year ended March 31, 2014 was $538,428, which included $592,343 from sale of assets, as compared to net cash used in investing activities of $283,385 (for equipment) for the fiscal year ended March 31, 2013.
Financing Activities
Net cash used in financing activities for the fiscal year ended March 31, 2014, was $948,583 as compared to net cash used of $797,634 for the fiscal year ended March 31, 2013. For the fiscal year ended March 31, 2014, net cash provided by financing activities related to proceeds received from notes payable of $104,999 which were funds received from various lenders, and repayments of $1,053,582 which were to pay down the balances on various notes related to the trucks and trailers. During the years ended March 31, 2014 and 2013, the Company used cash to reduce its indebtedness significantly.
27
Cash Requirements
The Company continues to maintain nominal balances in cash and cash equivalents. As discussed below, this amount and our current accounts receivable collections may be adequate to maintain our current level of operations for 30 to 60 days, after which we would need additional capital or face a significant curtailment of operations.
Critical Accounting Policies and Estimates
The preparation of financial statements in accordance with United States Generally Accepted Accounting Principles ("GAAP") requires that management make a number of assumptions and estimates that affect the reported amounts of assets, liabilities, revenue, and expenses in our consolidated financial statements and accompanying notes. Our management evaluates these estimates and assumptions on an ongoing basis, utilizing historical experience, consulting with experts, and using other methods considered reasonable in the particular circumstances. Nevertheless, actual results may differ significantly from our estimates and assumptions, and it is possible that materially different amounts would be reported using differing estimates or assumptions. We consider our critical accounting policies to be those that are both important to the portrayal of our financial condition and results of operations and that require significant judgment or use of complex estimates. A summary of the significant accounting policies followed in preparation of the financial statements is contained in Note 1 to our consolidated financial statements.
Property and Equipment
Property and equipment are entered at acquisition cost and depreciated on a straight-line basis over their anticipated life. We estimate the salvage value of our equipment to be fifteen to twenty percent for tractors and trailers, if the equipment is kept in service for its entire useful life. This life expectancy is based upon our management’s past experience of operations. The useful life of a typical tractor is seven fiscal years and a typical trailer is nine fiscal years. Our structures are forty fiscal years and leasehold improvements are the lesser of the economic life of the leasehold improvements or the remaining life of the lease.
Our ability to utilize net operating loss carry forwards may be limited
As of March 31, 2014, the Company had net operating loss carry forwards (NOLs) of approximately $20 million for federal income tax purposes that will begin to expire between the years of 2020 and 2034. These NOLs may be used to offset future taxable income, to the extent we generate any taxable income, and thereby reduce or eliminate our future federal income taxes otherwise payable. Section 382 of the Internal Revenue Code imposes limitations on a corporation's ability to utilize NOLs if it experiences an ownership change as defined in Section 382. In general terms, an ownership change may result from transactions increasing the ownership of certain stockholders in the stock of a corporation by more than 50 percent over a three-year period. In the event that an ownership change has occurred, or were to occur, utilization of our NOLs would be subject to an annual limitation under Section 382 determined by multiplying the value of our stock at the time of the ownership change by the applicable long-term tax-exempt rate as defined in the Internal Revenue Code. Any unused annual limitation may be carried over to later years. We may be found to have experienced an ownership change under Section 382 as a result of events in the past or the issuance of shares of common stock upon a conversion of notes, or a combination thereof. If so, the use of our NOLs, or a portion thereof, against our future taxable income may be subject to an annual limitation under Section 382, which may result in expiration of a portion of our NOLs before utilization.
28
Going Concern
We have suffered recurring losses from operations and are dependent on additional capital to execute our business plan.
With our present cash and cash equivalents, management expects to be able to continue some of our operations for at least the next twelve months. However, we have suffered losses from operations. Our continuation is dependent upon attaining and maintaining profitable operations and raising additional capital as needed. In this regard, we have raised additional capital through the debt and equity offerings noted above. We do, however, require additional cash due to changing business conditions or other future developments, including any investments or acquisitions we may decide to pursue. We plan to sell additional equity securities, debt securities or borrow from lending institutions. We cannot assure you that financing will be available in the amounts we need or on terms acceptable to us, if at all. The issuance of additional equity securities, including convertible debt securities, by us could result in a significant dilution in the equity interests of our current stockholders. The incurrence of debt would divert cash for working capital and capital expenditures to service debt obligations and could result in operating and financial covenants that restrict our operations and our ability to pay dividends to our shareholders. If we are unable to obtain additional equity or debt financing as required, our business operations and prospects may suffer. In such event, we will be forced to scale down or perhaps even cease our operations.
We have undertaken steps as part of a plan to improve operating results with the goal of sustaining our operations for the next twelve months and beyond. These steps include (a) raising additional capital and/or obtaining financing; (b) increasing our revenues and gross profits; and (c) reducing expenses. Additionally, we are implementing a four part strategy to bring us to financial stability, which is as follows:
|
●
|
A significant portion of our short term debt is in the hands of our subsidiary managers who, under the right circumstances, we believe may be willing to rework terms and to lengthen the maturity dates, as they have in the past, if that becomes necessary, lessening the short term debt on our balance sheet.
|
|
●
|
A significant amount of short term debt on our balance sheet is convertible into common shares and we are optimistic a meaningful amount of this debt will ultimately be reduced with capital formation, conversion to common or preferred shares, thus eliminating a meaningful amount of debt from our balance sheet.
|
|
●
|
We expect to continue to grow through acquisitions involving stock payments in lieu of cash. We expect this larger business base will give us an ever larger “platform” in order to more easily offset the corporate overhead and costs of being public.
|
|
●
|
In early 2012 as management pursued turnaround strategies we were introduced to Fuselier and Co. Inc., a Connecticut-based company specializing in troubled companies. On August 2, 2012 the IFCR board approved two actions: 1) an employment agreement in which David Fuselier became Chairman and CEO of our Company and 2) a three-year consulting engagement agreement with Fuselier Consulting, LLC. As a result of these agreements, the board approved a change of management of the Company. Management believes that these actions were necessary to enable us to raise necessary working capital and achieve long-term viability.
|
You have no assurance that we will successfully accomplish these steps and it is uncertain whether we will achieve a profitable level of operations and/or obtain additional financing. You have no assurance that any additional financings will be available to us on satisfactory terms and conditions, if at all.
Our consolidated financial statements do not give effect to any adjustments which would be necessary should we be unable to continue as a going concern and therefore be required to realize our assets and discharge our liabilities in other than the normal course of business and at amounts different from those reflected in the accompanying consolidated financial statements.
29
Recent Accounting Pronouncements
See Consolidated Financial Statements beginning on page F-1.
Off-Balance Sheet Arrangements
We do not currently have any off-balance sheet arrangements that have or are reasonably likely to have a current or future effect on our financial condition, changes in financial condition, revenues or expenses, results of operations, liquidity, capital expenditures or capital resources that are material to our stockholders.
We have not entered into any transaction, agreement or other contractual arrangement with an entity unconsolidated with us under which we have:
| · | An obligation under a guaranty contract, although we do have obligations under certain sales arrangements including purchase obligations to vendors, |
| · | A retained or contingent interest in assets transferred to the unconsolidated entity or similar arrangement that serves as credit, liquidity or market risk support to such entity for such assets, |
| · | Any obligation, including a contingent obligation, under a contract that would be accounted for as a derivative instrument or, |
| · | Any obligation, including a contingent obligation, arising out of a variable interest in an unconsolidated entity that is held by us and material to us where such entity provides financing, liquidity, market risk or credit risk support to, or engages in leasing, hedging or research and development services with us. |
Effect of Changes in Prices
Changes in prices in the past few fiscal years have not been a significant factor in the trucking industry. Prices to the end customer do vary with fuel prices, which are affected by means of a fuel surcharge that is set by the U S. Department of Energy and is common to all companies in the industry. The surcharge may affect the industry and the economy as a whole but does not differentiate between companies.
ITEM 7A. QUANTITATIVE AND QUALITATIVE DISCLOSURES ABOUT MARKET RISK.
We are not required to provide information under this item.
ITEM 8. FINANCIAL STATEMENTS AND SUPPLEMENTARY DATA.
The financial statements required by this item, including an index to the financial statements, begin on page F–1 of this annual report.
ITEM 9. CHANGES IN AND DISAGREEMENTS WITH ACCOUNTANTS ON ACCOUNTING AND FINANCIAL DISCLOSURE.
In May 2013 we engaged DKM Certified Public Accountants, a Registered Public Accounting Firm, and have had no disagreements on accounting and financial disclosures.
30
ITEM 9A. CONTROLS AND PROCEDURES.
Evaluation of Disclosure Controls and Procedures
As required by Rule 13a-15 under the Securities Exchange Act of 1934, as amended (the “Exchange Act”), the Company carried out an evaluation of the effectiveness of the design and operation of the Company’s disclosure controls and procedures as of the end of the period covered by this report. This evaluation was carried out under the supervision and with the participation of the Company’s management, including the Company’s principal executive officer and acting principal financial officer, who is the same person.
Based upon that evaluation, the principal executive officer and the principal financial officer concluded that the Company’s disclosure controls and procedures were not effective at March 31, 2013 to ensure that information required to be disclosed by the Company in reports that it files or submits under the Exchange Act is recorded, processed, summarized and reported within the time periods specified in the Securities and Exchange Commission rules and forms. The Company’s disclosure controls and procedures include controls and procedures designed to ensure that information required to be disclosed by the Company in the reports that it files or submits under the Act is accumulated and communicated to the Company’s management, including its principal executive and principal financial officers as appropriate to allow timely decisions regarding required disclosure.
Internal Control over Financial Reporting
Management’s Report on Internal Control over Financial Reporting
Our management is responsible for establishing and maintaining adequate internal control over financial reporting, as such term is defined in Rules 13a-15(f) and 15d-15(f) under the Exchange Act.
Internal control over financial reporting includes those policies and procedures that: (1) pertain to the maintenance of records that, in reasonable detail, accurately and fairly reflect the transactions and dispositions of our assets; (2) provide reasonable assurance that transactions are recorded as necessary to permit preparation of financial statements in accordance with generally accepted accounting principles, and that our receipts and expenditures are being made only in accordance with authorizations of its management and directors; and (3) provide reasonable assurance regarding prevention or timely detection of unauthorized acquisition, use or disposition of our assets that could have a material effect on the financial statements.
Management recognizes that there are inherent limitations in the effectiveness of any system of internal control, and accordingly, even effective internal control can provide only reasonable assurance with respect to financial statement preparation and may not prevent or detect material misstatements. In addition, effective internal control at a point in time may become ineffective in future periods because of changes in conditions or due to deterioration in the degree of compliance with our established policies and procedures.
Under the supervision and with the participation of our management, including our principal executive officer and acting principal financial officer, who is the same person, we conducted an evaluation of the effectiveness of our internal control over financial reporting using the Internal Control – Integrated Framework developed by the Committee of Sponsoring Organizations of the Treadway Commission. Based on this evaluation, our management, with the participation of our principal executive and acting principal financial officer, concluded that our internal control over financial reporting was not effective.
31
Management has identified the following material weakness in our internal control over financial reporting:
|
●
|
Until we can consolidate our accounting and banking functions, our ability to implement internal controls over financial reporting will be limited.
|
|
●
|
We do not have adequate software systems, personnel and other resources to assure that significant transactions are timely analyzed and reviewed.
|
|
●
|
We do not have adequate personnel and financial resources available to plan, develop, and implement disclosure and procedure controls and other procedures that are designed to ensure that information required to be disclosed in our periodic reports filed or submitted under the Exchange Act is recorded, processed, summarized and reported, within the time periods specified in the Securities and Exchange Commission's rules and forms.
|
|
●
|
Our limited financial resources restrict our employment of adequate personnel needed and desirable to separate the various receiving, recording, reviewing and oversight functions for the exercise of effective control over financial reporting.
|
|
●
|
Our limited resources restrict our ability to ensure that information required to be disclosed in our periodic reports filed under the Exchange Act is accumulated and communicated to management to allow timely decisions regarding required disclosure.
|
Changes in Internal Control over Financial Reporting
Management is in the process of establishing the necessary controls over financial reporting to address the above material weaknesses. There were no other changes in our internal control over financial reporting that occurred during the last fiscal quarter for our fiscal year ended March 31, 2014, that have materially affected, or are reasonably likely to materially affect, our internal control over financial reporting.
PART III
ITEM 10. DIRECTORS, EXECUTIVE OFFICERS AND CORPORATE GOVERNANCE.
The following table and biographical information following the table provide information about our directors and executive officers as of March 31 2014
|
NAME
|
|
AGE
|
|
POSITION
|
|
DIRECTOR SINCE
|
|
|
|
|
|
|
|
|
|
David N. Fuselier
|
|
54
|
|
Director, Chairman and Chief Executive Officer
|
|
2012
|
|
Henry P. Hoffman
|
|
64
|
|
Director, President and Chief Operating Officer
|
|
2008
|
|
Jackson L. Morris
|
|
70
|
|
Corporation Secretary
|
|
n/a
|
| Joseph Sikora | 49 | Director | July 2013 |
Our stockholders elect our directors. Our directors serve terms of one year and are generally elected at each annual stockholders meeting; provided, that there is no assurance we will hold a stockholders’ meeting annually. Mr. Sikora is our independent director using the definition of independence contained in the NASDAQ listing rules. Our executive officers are elected by the board of directors and their terms of office are at the discretion of the board of directors, subject to terms and conditions of their respective employment agreements which we expect to enter into after the registration of which this prospectus is a part is effective. We have the authority under Florida law and our bylaws to indemnify our directors and officers against certain liabilities.
Biographical Information About Our Directors And Executive Officers
David N. Fuselier has been elected as a director and chairman and been appointed to fill the vacancy in the position of Chief Executive Officer. We expect Mr. Fuselier to devote a substantial portion of his working time to our business and affairs. For the last fifteen years, Mr. Fuselier has been the principal of Fuselier and Co., a private merchant banking firm engaged in corporate turnarounds. He is Chairman and Chief Executive Officer on a part-time basis of New Leaf Brands, Inc., a publicly traded company, beginning February 15, 2012. He is a graduate of Louisiana State University (MSJ) and Louisiana College (BA).
32
Henry P. (“Hank”) Hoffman serves as our director, president and chief operating officer and has over twenty-five years of executive management experience in the transportation industry. Prior to joining IFCR, he was founder and President of SeaBridge Freight, a short sea intermodal barge business. Before joining SeaBridge, he was founder and Chairman of SiriCOMM, Inc., a wireless networking and applications service provider dedicated to the commercial trucking industry. He served as an officer in the United States Army for six years where he completed two successful command assignments. He earned a Bachelor of Science degree from the United States Military Academy, West Point, NY and an MBA from the University of Wisconsin, Oshkosh, WI.
Jackson L. Morris fills the statutory position of corporation secretary as a courtesy and incidental to his services as our independent corporate and securities counsel. He has served in these capacities with Integrated Freight since inception. Mr. Morris has been engaged in the private practice of law since 1982, maintaining his own practice in the Tampa Bay area since 1993. Mr. Morris focuses his practice in corporate, securities and business transaction law. Mr. Morris earned a B.A. degree in economics from Emory University in 1966, a J.D. degree from Emory University Law School in 1969 and an L.L.M. from Georgetown Law School in 1974.
Joseph Sikora serves as an outside director for the Company. Mr. Sikora is the long-time president of PIT Consulting, Inc., specializing in the power generation industry's engineering solutions. He is an engineer with over fifteen years of executive management experience in the power generation industry and has previous public company experience where he has a strong record for quality improvement and business growth. Sikora graduated from New York Maritime College with a Bachelors of Engineering in Marine Engineering with a Nuclear Power concentration. He will be appointed chairman of the Board's Compensation Committee.
Audit Committee/Audit Committee Financial Expert
The functions of an audit committee are currently carried out by our Board of Directors. Our Board of Directors has determined that we do not have an audit committee financial expert on our Board of Directors. As we do not currently compensate our Directors, we have been unable to attract a person who qualifies as a financial expert to serve on our Board of Directors. We do not have an audit committee or an audit committee financial expert.
Section 16(a) Beneficial Ownership Reporting Compliance
We believe that none of our directors, officers and beneficial owners of more than ten percent of our common stock has filed any reports required by Section 16(a) of the Exchange Act
Code of Ethics
Although our former board of directors approved a code of ethics for senior financial officers on October 7, 2002, as filed with our September 30, 2002 report on Form 10–KSB as Exhibit 99.3, our current board of directors has neither rescinded nor confirmed that code of ethics. The chairman has identified this matter as an action item for the next meeting of the directors.
33
ITEM 11. EXECUTIVE COMPENSATION.
Summary Compensation Table
The following table presents information about compensation we paid to our chief executive officer and each of our highest paid executive officers who have compensation exceeding $100,000 per year, and list all capacities in which cash compensation was paid. The amounts in the table include compensation paid by PGI-MD, Integrated Freight and each of our subsidiaries we acquired in the merger with Integrated Freight, both before and after the respective acquisitions, as the case may be.
|
Name and principal position
|
|
Year
|
|
|
Salary
|
|
|
Bonus
|
|
|
Total
|
|
||||
|
|
|
|
|
|
|
|
|
|
|
|
|
|
|
|
|
|
|
David N. Fuselier, Chief Executive Officer (1,2)
|
|
|
2014
|
|
|
$
|
150,000
|
|
|
97,500
|
|
|
$
|
247,500
|
|
|
|
2013
|
150,000
|
none
|
150,000
|
|||||||||||||
|
|
|
|
|
|
|
|
|
|
|
|
|
|
|
|
|
|
|
Henry P. Hoffman, President and Chief Operating Officer(2)
|
|
|
2014
|
|
|
$
|
125,000
|
|
|
87,750
|
|
|
$
|
212,750
|
|
|
|
2013
|
125,000
|
none
|
125,000
|
|||||||||||||
|
|
|
|
|
|
|
|
|
|
|
|
|
|
|
|
|
|
|
T. Mark Morris, General Manager of Morris Transportation (1,3)
|
|
|
2014
|
|
|
$
|
110,000
|
|
|
none
|
|
|
$
|
110,000
|
|
|
|
2013
|
110,000
|
none
|
110,000
|
|||||||||||||
|
|
|
|
|
|
|
|
|
|
|
|
|
|
|
|
|
|
|
Monte W. Smith, General Manager of Smith Systems Transportation (1,3)
|
|
|
2014
|
|
|
$
|
110,000
|
|
|
none
|
|
|
$
|
110,000
|
|
|
|
2013
|
110,000
|
none
|
110,000
|
|||||||||||||
| (1) | Mr. Fuselier was appointed CEO and Chairman effective August, 2012. Messrs. Smith and Morris resigned from our board of directors in August 2012 but continue to serve as officers of their respective employing subsidiary companies. |
| (2) | Neither Mr. Fuselier nor Mr. Hoffman received cash compensation in accordance with their employment agreements during FY2014. These amounts were accrued and a portion was paid in stock. |
| (3) | The salaries of Messrs. Morris and Smith were paid by their respective employing subsidiary companies. |
Employment Agreements
We have employment agreements with the named executive officers identified in the following table.
|
Name
|
Began
|
Ends (1)
|
Annual
Salary
|
Annual
Increase
|
Bonus (2)
|
Other
|
|||||||||||||
|
|
|
|
|||||||||||||||||
|
David N. Fuselier
|
August 2, 2012
|
August 2017
|
$
|
150,000
|
5%
|
|
–
|
–
|
|||||||||||
|
Henry P. Hoffman
|
July 3, 2012
|
July, 2014
|
$
|
125,000
|
5%
|
|
–
|
–
|
|||||||||||
|
T. Mark Morris
|
September 1, 2008
|
August 31, 2012
|
$
|
110,000
|
–
|
$
|
25,000
|
–
|
|||||||||||
|
Monte W. Smith
|
September 1, 2008
|
August 31, 2012
|
$
|
110,000
|
–
|
–
|
–
|
||||||||||||
________________
(1) Subject to subsequent automatic annual renewals.
(2) Eligible for discretionary bonuses, upon board review and approval. Annual bonus award based on the achievement of established financial goals as set forth annually by the Board. Our Board will research and establish an executive option pool, under which executives will be awarded a number of options to be determined to purchase shares of our common stock at an exercise price equal to the current market price (as defined) on the date of grant. The options will vest twenty percent on the date of grant and twenty percent on each subsequent anniversary date
Each employment agreement provides for payment of benefits, an automobile allowance, and an opportunity to earn a performance bonus.
34
On August 2, 2012, in connection with our employment of Mr. Fuselier, our board of directors approved a three-year consulting agreement with Fuselier Consulting LLC renewable for one year, to advise us and to execute on a corporate turnaround strategy. The compensation arrangement gives Fuselier the right to earn up to 13,330,000 shares of our common stock in 2012 and ten million shares thereafter annually through the term of the agreement. Under the terms of the consulting agreement, management of the two currently operating subsidiaries have full decision-making authority and operational control until such time as the personal guaranties by their respective management of their respective equipment financing are eliminated, which we have an obligation to accomplish as quickly as may be reasonable. On May 22, 2014, our Board voted unanimously to terminate the Fuselier Consulting agreement.
We have entered into a five-year employment agreement with Mr. Fuselier, which provides an initial annual base salary of $150,000 with five percent annual increases, as reported on Form 8-K for the event date of August 2, 2012
We have entered into a five-year employment agreement with Mr. Hoffman, which provides an initial annual base salary of $125,000 with five percent annual increases.
Director Compensation
There was one outside director during this period and no director compensation was paid other than the issuance of two million shares of common stock. Directors who are also executive officers were not paid any compensation other than their executive salary compensation pursuant to their employment agreements.
Compensation and Nominating Committees
We do not have compensation and nominating committees. These functions are provided by our full board of directors.
Shareholder communications.
We do not have a process for security holders to send communications to our board of directors and, we have not made a determination that it is appropriate for us not to have such a process. Any shareholder communications addressed to the board or any director will be provided to all directors for consideration.
ITEM 12. SECURITY OWNERSHIP OF CERTAIN BENEFICIAL OWNERS AND MANAGEMENT AND RELATED STOCKHOLDER MATTERS.
Beneficial Ownership of Common Stock of Principal Stockholders, Directors and Management
The principal holders of our common stock are set forth in the following table. These principal stockholders include:
|
●
|
each of our directors and executive officers,
|
|
●
|
our directors and executive officers as a group, and
|
|
●
|
others who we know own more than five percent of our issued and outstanding common stock.
|
We believe each of these persons has sole voting and investment power over the shares they own, unless otherwise noted. The address of our directors and executive officers is our address.
|
NAME OF BENEFICIAL OWNER
|
NUMBER OF
SHARES OWNED (1)
|
PERCENTAGE OF CLASS (2)
|
||||||
|
|
||||||||
|
David N. Fuselier (1)
|
30,543,542
|
15.040
|
%
|
|||||
|
Henry P. Hoffman
|
23,127,122
|
12.242
|
%
|
|||||
|
Jackson L. Morris
|
13,271,771
|
6.618
|
%
|
|||||
|
T. Mark. Morris (2,4)
|
5,431,458
|
6.535
|
%
|
|||||
|
Matthew A. Veal (4)
|
11,860,322
|
6.016
|
%
|
|||||
|
Monte W. Smith (3,4)
|
930,000
|
1.119
|
%
|
|||||
|
All Officers and Directors As a Group (6 persons) (2,3,4)
|
85,164,215
|
47.57
|
%
|
|||||
|
Robert W. Papiri (4)
|
3,208,674
|
3.861
|
%
|
|||||
[Note that all of the above use the Company’s address except Mr. Papiri whose address is 402 South Broadway, Suite 400 San Diego, CA 92101.]
(1) Includes 12,500,000 shares issued to Fuselier Consulting LLC, which is wholly owned by Mr. Fuselier.
(2) Does not include the number of common shares into which 40,000,000 shares of our preferred stock because the terms of such preferred have yet to be established.
(3) Does not include the number of common shares into which 50,000,000 shares of our preferred stock because the terms of such preferred have yet to be established.
(4) This person is no longer an officer or a director of the company.
35
ITEM 13. CERTAIN RELATIONSHIPS AND RELATED TRANSACTIONS, AND DIRECTOR INDEPENDENCE.
During the 2014 fiscal year, we did not enter into any transactions with our directors, executive officers and persons who own more than five percent of our common stock, or with their relatives and entities they control.
We do not anticipate entering into any future transactions with our directors, officers and affiliates apart from normal employment transactions.
Jackson L. Morris and T. Mark Morris are not related.
We had one independent director, Joseph Sikora, during the period
ITEM 14. PRINCIPAL ACCOUNTING FEES AND SERVICES.
Aggregate fees billed by our principal independent registered public accounting firm for audits of the financial statements for the fiscal years indicated:
|
|
2014
|
2013
|
||||||
|
Audit Fees
|
$
|
35,000
|
$
|
45,000
|
||||
|
Audit–Related Fees(1)
|
-
|
-
|
||||||
|
Tax Fees
|
–
|
-
|
||||||
|
All Other Fees
|
-
|
-
|
||||||
|
Total
|
$
|
35,000
|
$
|
45,000
|
||||
36
PART IV
ITEM 15. EXHIBITS, FINANCIAL STATEMENT SCHEDULES.
|
Exhibit Number
|
Description of Exhibit
|
|
|
3.1
|
Articles of Domestication*
|
|
|
3.2
|
Articles of Incorporation*
|
|
|
3.3
|
Amended and Restated Bylaws*
|
|
|
4.1
|
Specimen Stock Certificate (not filed)
|
|
|
21
|
List of Subsidiaries*
|
|
|
10.1
|
Stock Purchase Agreement between Integrated Freight Corporation and Deep South Capital LLC, for the sale of 100% of the issued and outstanding shares of common stock of Triple C Transport – dated June 30, 2012*
|
|
|
10.2
|
Stock Purchase Agreement between Integrated Freight Corporation and Deep South Capital LLC, for the sale of 100% of the issued and outstanding shares of common stock of Cross Creek Trucking – dated June 30, 2012*
|
|
|
31.1
|
|
Rule 13a-14(a) Certification of Principal Executive Officer
|
|
31.2
|
|
Rule 13a-14(a) Certification of Principal Financial and Accounting Officer
|
|
32.1
|
|
Certification of Principal Executive Officer pursuant to 18 U.S.C. Section 1350 as adopted pursuant to Section 906 of the Sarbanes-Oxley Act of 2002
|
|
32.2
|
|
Certification of Principal Financial and Accounting Officer pursuant to 18 U.S.C. Section 1350 as adopted pursuant to Section 906 of the Sarbanes-Oxley Act of 2002
|
| 101 | Interactive Data Files ** |
* Previously Filed
** To be filed by amendment
37
SIGNATURES
Pursuant to the requirements of Section 13 or 15(d) of the Securities Exchange Act of 1934, the registrant has duly caused this report to be signed on its behalf by the undersigned, thereunto duly authorized.
|
|
Integrated Freight Corporation
|
|
|
|
|
|
|
|
|
Date: April 30, 2015
|
By:
|
/s/ David N. Fuselier
|
|
|
|
|
David N. Fuselier
|
|
|
|
|
Principal Executive Officer and Principal Financial and Accounting Officer
|
|
|
|
|
|
|
|
Signature and Name:
|
|
Capacity in which signed:
|
|
Date:
|
|
|
|
|
|
|
|
/s/ David N. Fuselier
|
|
Director, Chairman, Chief Executive Officer
|
|
April 30, 2015
|
|
David N. Fuselier
|
|
and Principal Accounting Officer
|
|
|
|
|
|
|
|
|
|
/s/ Henry P. Hoffman
|
|
Director, President and Chief Operating Officer
|
|
April 30, 2015
|
|
Henry P. Hoffman
|
|
|
|
|
38
CONSOLIDATED FINANCIAL STATEMENTS OF
INTEGRATED FREIGHT CORPORATION
|
|
|
Page
|
|
|
|
|
|
|
|
|
|
Independent Registered Accountants Reports
|
|
|
F-2
|
|
|
|
|
|
|
|
|
Consolidated Balance Sheets as of March 31, 2014 and 2013
|
|
|
F-3
|
|
|
|
|
|
|
|
|
Consolidated Statements of Operations For Years ended March 31, 2014 and 2013
|
|
|
F-4
|
|
|
|
|
|
|
|
|
Consolidated Statement of Changes in Stockholders' Deficit for the Years ended March 31, 2014 and 2013
|
|
|
F-5
|
|
|
|
|
|
|
|
|
Consolidated Statements of Cash Flows for the Years ended March 31, 2014 and 2013
|
|
|
F-8
|
|
|
|
|
|
|
|
|
Notes to Consolidated Financial Statements
|
|
|
F-10
|
|
F-1
 |
2451 N. McMullen Booth Road
Suite.308
Clearwater, FL 33759
Toll fee: 855.334.0934
Fax: 800.581.1908
|
REPORT OF INDEPENDENT REGISTERED PUBLIC ACCOUNTING FIRM
The Board of Directors and Stockholders
Integrated Freight Corporation.
We have audited the accompanying consolidated balance sheets of Integrated Freight Corporation as of March 31, 2014 and 2013, and the related consolidated statements of operations, changes in stockholders’ deficit, and cash flows for the years then ended. These financial statements are the responsibility of the Company’s management. Our responsibility is to express an opinion on these financial statements based on our audits.
We conducted our audits in accordance with the standards of the Public Company Accounting Oversight Board (United States). Those standards require that we plan and perform the audits to obtain reasonable assurance about whether the financial statements are free of material misstatement. The Company is not required to have, nor were we engaged to perform, an audit of its internal control over financial reporting. Our audits included consideration of internal control over financial reporting as a basis for designing audit procedures that are appropriate in the circumstances, but not for the purpose of expressing an opinion on the effectiveness of the Company’s internal control over financial reporting. Accordingly, we express no such opinion. An audit includes examining, on a test basis, evidence supporting the amounts and disclosures in the financial statements, assessing the accounting principles used and significant estimates made by management, as well as evaluating the overall financial statement presentation. We believe that our audits provide a reasonable basis for our opinion.
In our opinion, the consolidated financial statements referred to above present fairly, in all material respects, the financial position of Integrated Freight Corporation as of March 31, 2014 and 2013, and the results of its operations and its cash flows for the years then ended in conformity with accounting principles generally accepted in the United States of America.
The accompanying consolidated financial statements have been prepared assuming that the Company will continue as a going concern. As shown in the accompanying consolidated financial statements, the Company has significant net losses and cash flow deficiencies. Those conditions raise substantial doubt about the Company’s ability to continue as a going concern. Management’s plans regarding those matters are described in Note 1. The consolidated financial statements do not include any adjustments that might result from the outcome of this uncertainty.
/s/ DKM Certified Public Accountants
DKM Certified Public Accountants
Clearwater, Florida
April 27, 2015
F-2
INTEGRATED FREIGHT CORPORATION
Consolidated Balance Sheets
|
|
March 31, 2014
|
March 31, 2013
|
||||||
|
Assets
|
||||||||
|
Current assets:
|
||||||||
|
Cash
|
$
|
35,818
|
$
|
81,429
|
||||
|
Accounts receivables, net of allowance for doubtful accounts of $50,000
|
2,426,976
|
3,039,276
|
||||||
|
Prepaid expenses and other assets
|
360,052
|
351,853
|
||||||
|
Total current assets
|
2,822,846
|
3,472,558
|
||||||
|
|
||||||||
|
Property and equipment, net of accumulated depreciation
|
1,962,039
|
2,857,195
|
||||||
|
Intangible assets, net of accumulated amortization
|
-
|
-
|
||||||
|
Assets of discontinued operations
|
-
|
-
|
||||||
|
Total assets
|
$
|
4,784,885
|
$
|
6,329,753
|
||||
|
|
||||||||
|
Liabilities and Stockholders’ Deficit
|
||||||||
|
Current liabilities:
|
||||||||
|
Bank overdraft
|
$
|
266,042
|
$
|
304,656
|
||||
|
Accounts payable
|
1,417,189
|
1,296,405
|
||||||
|
Accrued expenses and other liabilities
|
2,173,662
|
2,572,199
|
||||||
|
Other Liabilities
|
721,130
|
790,464
|
||||||
|
Line of credit
|
708,108
|
611,356
|
||||||
|
Notes payable - related parties
|
5,187,084
|
5,222,151
|
||||||
|
Current portion of notes payable
|
5,555,376
|
5,570,616
|
||||||
|
Total current liabilities
|
16,028,591
|
16,367,847
|
||||||
|
|
||||||||
|
Derivative liability
|
8,874
|
29,580
|
||||||
|
Notes payable - related parties
|
-
|
-
|
||||||
|
Notes payable, net of current portion and debt discount
|
1,651,832
|
2,309,706
|
||||||
|
Liabilities of discontinued operations
|
-
|
-
|
||||||
|
Total long-term liabilities
|
1,660,706
|
2,339,286
|
||||||
|
|
||||||||
|
Total liabilities
|
17,689,297
|
18,707,133
|
||||||
|
|
||||||||
|
Stockholders’ deficit:
|
||||||||
|
Common stock, $0.001 par value, 2,000,000,000 shares authorized,
|
||||||||
|
260,524,221 and 116,510,332 shares issued and outstanding
at March 31, 2014 and 2013 respectively
|
260,524
|
116,510
|
||||||
|
Additional paid-in capital
|
9,925,421
|
9,163,511
|
||||||
|
Accumulated deficit
|
(23,090,357
|
)
|
(21,657,401
|
)
|
||||
|
Total Integrated Freight Corporation stockholders’ deficit
|
(12,904,412
|
)
|
(12,377,380
|
)
|
||||
|
Non-controlling interest
|
-
|
-
|
||||||
|
Total stockholders’ deficit
|
(12,904,412
|
)
|
(12,377,380
|
)
|
||||
|
|
||||||||
|
Total liabilities and stockholders’ deficit
|
$
|
4,784,885
|
$
|
6,329,753
|
||||
See notes to consolidated financial statements
F-3
INTEGRATED FREIGHT CORPORATION
Consolidated Statements of Operations
|
|
Year Ended March 31,
|
|||||||
|
|
2014
|
2013
|
||||||
|
|
||||||||
|
Revenue
|
$
|
20,166,312
|
$
|
20,102,263
|
||||
|
|
||||||||
|
Operating Expenses
|
||||||||
|
Rents and transportation
|
5,272,372
|
4,346,988
|
||||||
|
Wages, salaries and benefits
|
5,401,424
|
4,982,068
|
||||||
|
Fuel and fuel taxes
|
5,915,747
|
6,529,886
|
||||||
|
Insurance and claims
|
1,409,471
|
1,297,450
|
||||||
|
Operating taxes and licenses
|
251,219
|
345,282
|
||||||
|
Stock based compensation
|
121,924
|
187,878
|
||||||
|
General and administrative
|
1,297,183
|
924,669
|
||||||
|
Depreciation and amortization
|
926,622
|
1,137,323
|
||||||
|
Total Operating Expenses
|
20,595,962
|
19,751,544
|
||||||
|
|
||||||||
|
Income (Loss) from operations
|
(429,650
|
)
|
350,719
|
|||||
|
|
||||||||
|
Other Income (Expense)
|
||||||||
|
Gain/(loss) on change of fair value of derivative liability
|
20,706
|
36,071
|
||||||
|
Interest
|
(1,380,289
|
)
|
(991,833
|
)
|
||||
|
Other income (expense)
|
286,943
|
391,752
|
||||||
|
Gain on debt settlements
|
69,334
|
664,860
|
||||||
|
Total Other Income (Expense)
|
(1,003,306
|
)
|
100,850
|
|||||
|
Income (loss) from continuing operations, before income tax
and non-controlling interest
|
(1,432,956
|
)
|
451,569
|
|||||
|
Income tax expense
|
-
|
-
|
||||||
|
Income (loss) from continuing operations, before non-controlling interest
|
(1,432,956
|
)
|
451,569
|
|||||
|
Non-controlling interest share of subsidiary net income (loss)
|
-
|
-
|
||||||
|
Income (loss) from continuing operations
|
(1,432,956
|
)
|
451,569
|
|||||
|
Income (loss) from discontinued operations
|
-
|
4,360,889
|
||||||
|
Net Income (loss)
|
$
|
(1,432,956
|
)
|
$
|
4,812,458
|
|||
|
Basic net income (loss) per share
|
||||||||
|
Income (loss) from continuing operations
|
$
|
(0,01
|
)
|
$
|
0.005
|
|||
|
Income (loss) from discontinued operations
|
-
|
0.049
|
||||||
|
Net income (loss) per share
|
$
|
(0.01
|
)
|
$
|
0.054
|
|||
|
|
||||||||
|
Diluted net income (loss) per share
|
||||||||
|
Income (loss) from continuing operations
|
$
|
(0.01
|
)
|
$
|
0.004
|
|||
|
Income (loss) from discontinued operations
|
-
|
0.039
|
||||||
|
Net income (loss) per share
|
$
|
(0.01
|
)
|
$
|
0.044
|
|||
|
Weighted average shares outstanding
|
||||||||
|
Basic
|
145,469,717
|
89,615,314
|
||||||
|
Diluted
|
145,469,717
|
111,922,111
|
||||||
See notes to consolidated financial statements.
F-4
INTEGRATED FREIGHT CORPORATION
Consolidated Statement of Changes in Stockholders’ Deficit
For the Year Ended March 31, 2014 and 2013
|
|
||||||||||||||||||||||||
|
Common Stock
|
Additional
Paid-in |
Accumulated
|
Noncontrolling
|
|||||||||||||||||||||
|
Shares
|
Amount
|
Capital
|
Deficit
|
Interest
|
Total
|
|||||||||||||||||||
|
Balance - March 31, 2012
|
43,865,606
|
$
|
43,868
|
$
|
8,948,878
|
$
|
(26,803,706
|
)
|
$
|
333,841
|
$
|
(17,477,119
|
)
|
|||||||||||
|
|
||||||||||||||||||||||||
|
Common stock issued in conjunction with sale of Discontinued Operations
|
20,000,000
|
20,000
|
34,000
|
-
|
-
|
54,000
|
||||||||||||||||||
|
Common stock issued for conversion of debt
|
6,747,230
|
6,747
|
28,653
|
-
|
-
|
35,400
|
||||||||||||||||||
|
Common stock issued for services
|
40,897,496
|
40,898
|
146,980
|
-
|
-
|
187,878
|
||||||||||||||||||
|
Common stock issued as part of debt settlement
|
5,000,000
|
5,000
|
5,000
|
10,000
|
||||||||||||||||||||
|
Rounding
|
(3
|
)
|
6
|
3
|
||||||||||||||||||||
|
Acquisition of Non-controlling interest
|
-
|
-
|
-
|
333,841
|
(333,841
|
)
|
-
|
|||||||||||||||||
|
Net Income for the year ended March 31, 2013
|
-
|
-
|
-
|
4,812,458
|
-
|
4,812,458
|
||||||||||||||||||
|
Balances – March 31, 2013
|
116,510,332
|
$
|
116,510
|
$
|
9,163,511
|
$
|
(21,657,401
|
)
|
$
|
-
|
$
|
(12,377,380
|
)
|
|||||||||||
|
Common stock issued for services
|
10,606,061
|
10,606
|
111,318
|
121,924
|
||||||||||||||||||||
|
Common stock issued for accrued compensation
|
133,407,828
|
133,408
|
650,592
|
784,000
|
||||||||||||||||||||
|
Net loss for the year ended March 31, 2014
|
(1,432,956
|
)
|
(1,432,956
|
)
|
||||||||||||||||||||
|
Balances – March 31, 2014
|
260,524,221
|
$
|
260,524
|
$
|
9,925,421
|
$
|
(23,090,357
|
)
|
$
|
-
|
$
|
(12,904,412
|
)
|
|||||||||||
See notes to consolidated financial statements
F-5
INTEGRATED FREIGHT CORPORATION
Consolidated Statements of Cash Flows
|
|
||||||||
|
|
Year Ended
|
|||||||
|
|
March 31,
|
|||||||
|
Cash flows from operating activities:
|
2014
|
2013
|
||||||
|
Income (loss) from continuing operations
|
$
|
(1,432,956
|
)
|
$
|
451,569
|
|||
|
Income (loss) from discontinued operations
|
-
|
4,360,889
|
||||||
|
Net Income (loss)
|
(1,432,956
|
)
|
4,812,458
|
|||||
|
Adjustments to reconcile net loss to net cash provided by (used in) operating activities:
|
||||||||
|
Depreciation and amortization
|
926,622
|
1,137,323
|
||||||
|
Derivative (gain) loss
|
(20,706
|
)
|
(36,071
|
)
|
||||
|
(Gain) on debt settlements
|
(69,334
|
)
|
(664,860
|
)
|
||||
|
(Gain) on sale of assets
|
(232,740
|
)
|
(283,059
|
)
|
||||
|
Minority interest in earnings of subsidiary
|
-
|
-
|
||||||
|
Stock based compensation
|
121,924
|
187,878
|
||||||
|
(Gain) Loss from discontinued operations
|
-
|
(4,360,889
|
)
|
|||||
|
Increases/decreases in operating assets and liabilities
|
||||||||
|
Accounts receivable
|
612,300
|
140,575
|
||||||
|
Prepaid expenses and other assets
|
(8,199
|
)
|
20,801
|
|||||
|
Accounts payable and accrued expense
|
467,633
|
125,140
|
||||||
|
Net cash (used) in/provided by operating activities
|
364,544
|
1,079,296
|
||||||
|
|
||||||||
|
Cash flows from investing activities:
|
||||||||
|
Purchase of property and equipment
|
(53,915
|
)
|
(674,198
|
)
|
||||
|
Proceeds from sale of assets
|
592,343
|
390,813
|
||||||
|
Net cash (used) in/provided by investing activities
|
538,428
|
(283,385
|
)
|
|||||
|
|
||||||||
|
Cash flows from financing activities:
|
||||||||
|
Repayments of notes payable
|
(1,053,582
|
)
|
(1,498,839
|
)
|
||||
|
Proceeds from long term debt
|
104,999
|
701,205
|
||||||
|
Net cash (used) in/provided by financing activities
|
(948,583
|
)
|
(797,634
|
)
|
||||
|
Net change in cash
|
(45,611
|
)
|
(1,723
|
)
|
||||
|
Cash, beginning of period
|
81,429
|
83,152
|
||||||
|
Cash, end of period
|
$
|
35,818
|
$
|
81,429
|
||||
|
|
||||||||
See notes to consolidated financial statements.
F-6
|
INTEGRATED FREIGHT CORPORATION
|
|
|
|
Consolidated Statement of Cash Flows – (Continued)
|
|
|
Year Ended
|
Year Ended
|
||||||
|
|
March 31, 2014
|
March 31, 2013
|
||||||
|
Supplemental disclosure of cash flow information:
|
||||||||
|
Cash paid during the period for:
|
||||||||
|
Income taxes
|
$
|
-
|
$
|
-
|
||||
|
Interest
|
$
|
599,688
|
$
|
793,818
|
||||
|
Schedule of noncash investing and financing transactions:
|
||||||||
|
Common stock issued for accrued compensation
|
$
|
784,000
|
$
|
-
|
||||
|
Assets acquired through new debt
|
$
|
337,154
|
$
|
-
|
||||
|
Common stock issued for settlement of discontinued operations
|
$
|
-
|
$
|
54,000
|
||||
|
Common stock issued for conversion of debt
|
$
|
-
|
$
|
35,400
|
||||
|
Common stock issued for settlement of debt
|
$
|
-
|
$
|
10,000
|
||||
See notes to consolidated financial statements
F-7
INTEGRATED FREIGHT CORPORATION
Notes to Consolidated Financial Statements
Note 1 Nature of Operations and Summary of Significant Accounting Policies
Nature of Business
Integrated Freight Corporation (a Florida corporation) [formerly PlanGraphics, Inc. (a Colorado corporation)] and subsidiaries (the “Company”) is a short to medium-haul truckload carrier of general commodities with corporate headquarters in Southbury, Connecticut. We have two operating subsidiaries; one located in Hamburg, Arkansas and the other located in Scotts Bluff, Nebraska. Through our two operating motor freight carriers, we provide truck load service throughout the forty-eight contiguous United States. We do not specialize in any specific types of freight or commodities. We carry dry freight and certain hazardous materials (“hazmat”) including hazardous waste. We provide long-haul, regional and local service to our customers. The Company is subject to regulation by the Department of Transportation and various state regulatory authorities.
Pursuant to an agreement in connection with Integrated Freight Corporation’s (“Original IFC”) acquisition of control of the Company on May 1, 2009, the Company completed the sale of its historic operations to its former director and chief executive officer. This transaction closed on December 27, 2009. As part of the acquisition, the Company executed a 244.8598 for 1 reverse split in August, 2010, and all amounts have been presented on a post-split basis. Since the Company had, due to the sale of its historical operations, minimal assets and limited operations, the recapitalization has been accounted for as the sale of 404,961 shares of Original IFC common stock for the net liabilities of the Company. Therefore, the historical financial information prior to the date of the recapitalization is the financial information of IFC. Costs of the transaction have been charged to the period in which they are incurred.
Principles of Consolidation
The consolidated financial statements include the financial statements of the Company, and its wholly owned subsidiaries as of March 31, 2014 and 2013. All material intercompany transactions have been eliminated.
We have and have had the following wholly owned subsidiaries, during the periods indicated:
|
·
|
Morris Transportation, Inc., an Arkansas corporation, beginning September 1, 2008, when we acquired a controlling interest in Original IFC. Original IFC purchased all of Morris Transportation’s common stock as of September 1, 2008.
|
|
·
|
Smith Systems Transportation, Inc., a Nebraska corporation, beginning September 1, 2008, when we acquired a controlling interest in Original IFC. Original IFC purchased all of Smith System’s common stock as of September 1, 2008.
|
|
·
|
Triple C Transport, Inc., a Nebraska corporation, beginning as of May 5, 2010, when we purchased all of its common stock, and June 30, 2012 when we sold Triple C Transport.
|
|
·
|
Cross Creek Trucking, Inc., an Oregon corporation, beginning April 1, 2011, when we purchased all of its common stock, and June 30, 2012 when we sold Cross Creek Trucking.
|
|
·
|
Integrated Freight Services, a Florida corporation, beginning April 1, 2011, when we formed the Company and began operations, and June 30, 2012 when we sold Integrated Freight Services.
|
In the opinion of management, the accompanying consolidated financial statements contain all adjustments (consisting solely of normal recurring adjustments) necessary to present fairly the financial position as of March 31, 2014 and 2013, and the results of operations and cash flows for the years ended March 31, 2014 and 2013.
Subsequent Events
The Company has evaluated subsequent events through April 24, 2015 to assess the need for potential recognition or disclosure in this report. Based upon this evaluation, management determined that all subsequent events that require recognition in the financial statements have been included.
F-8
INTEGRATED FREIGHT CORPORATION
Notes to Consolidated Financial Statements
Use of Estimates
The preparation of the Company's financial statements in conformity with generally accepted accounting principles requires management to make estimates and assumptions that affect the amounts reported in these financial statements and accompanying notes. Actual results could differ from those estimates.
Cash and Cash Equivalents
The Company considers all highly liquid investments purchased with original maturities of three months or less to be cash equivalents. The Company had cash and cash equivalents of $35,818 and $81,429 at March 31, 2014 and 2013 respectively.
Accounts Receivable
Accounts receivable represent amounts due from customers in the ordinary course of business from sales. The Company uses the allowance method for recognizing bad debts. The Company specifically analyzes accounts receivable and historical bad debts, client credit-worthiness, current economic trends, and changes in our client payment terms and collection trends when evaluating the adequacy of an allowance for doubtful accounts. Any change in the assumptions used in analyzing a specific account receivable may result in additional allowance for doubtful accounts being recognized in the period in which the change occurs. When an account is deemed uncollectible, it is written off against the allowance. Accordingly, the Company has provided a $50,000 allowance for uncollectible accounts as of March 31, 2014 and 2013.
The Company uses factoring agents with recourse. The accounts are maintained on the balance sheet until collected and an offsetting liability is recorded for monies received in advance of collections.
Property and Equipment
Property and equipment are stated at cost less accumulated depreciation, including any write-up in value measured at the time of acquisition of operating subsidiaries. Depreciation of property and equipment is calculated on the straight-line method over the following estimated useful lives:
|
|
|
Years
|
|
|
|
Buildings / improvements
|
|
|
20 – 40
|
|
|
Furniture and fixtures
|
|
|
3 – 5
|
|
|
Shop and service equipment
|
|
|
2 – 5
|
|
|
Tractors and trailers
|
|
|
5 – 9
|
|
|
Leasehold improvements
|
|
|
1 – 5
|
|
The Company expenses repairs and maintenance as incurred. The Company periodically reviews the reasonableness of its estimates regarding useful lives and salvage values for revenue equipment and other long-lived assets based upon, among other things, the Company's experience with similar assets, conditions in the used revenue equipment market, and prevailing industry practice. Salvage values are typically 15% to 20% for tractors and trailer equipment and consider any agreements with tractor suppliers for residual or trade-in values for certain new equipment. The Company capitalizes tires placed in service on new revenue equipment as a part of the equipment cost. Replacement tires and costs for recapping tires are expensed at the time the tires are placed in service. Gains and losses on the sale or other disposition of equipment are recognized at the time of the disposition.
Intangible Assets
The Company accounts for business combinations in accordance with Accounting Standards Codification (“ASC”) 805, Business Combinations, which requires that the purchase method of accounting be used for all business combinations. ASC 805 requires intangible assets acquired in a business combination to be recognized and reported separately from goodwill.
F-9
INTEGRATED FREIGHT CORPORATION
Notes to Consolidated Financial Statements
Goodwill represents the cost of the acquired businesses in excess of the fair value of identifiable tangible and intangible net assets purchased. The Company assigns all the assets and liabilities of the acquired business, including goodwill, to reporting units in accordance with ASC 350, Intangible – Goodwill and Other. Our business combinations did not result in any goodwill as of March 31, 2014 and March 31, 2013.
The Company evaluates intangible assets for recoverability whenever events or changes in circumstances indicate that their carrying amounts may not be recoverable. Recoverability of assets to be held and used is measured by a comparison of the carrying amount of an asset to the future undiscounted net cash flows expected to be generated by the asset. If these assets are considered to be impaired, the impairment to be recognized is measured by the amount by which the carrying value of the assets exceeds the fair value of the assets.
Furthermore, ASC 350 requires purchased intangible assets other than goodwill to be amortized over their useful lives unless these lives are determined to be indefinite. Purchased intangible assets are carried at cost less accumulated amortization. See Notes 2, 10, and 11 for the treatment of intangibles related to Triple C. No other impairment of intangibles has been identified as of March 31, 2011. However the Company wrote off as impaired its entire remaining investment of $6,015,000, including $1,410,112 of intangible costs, in Cross Creek Trucking, Inc. at March 31, 2012, due to the ceasing of its operations.
Impairment of Long-lived Assets
The Company evaluates the carrying value of its long-lived assets at least annually. Impairment losses are recorded on long-lived assets used in operations when indicators of impairment are present and the undiscounted future cash flows estimated to be generated by those assets are less than the assets’ carrying amount. If such assets are impaired, the impairment to be recognized is measured by the amount by which the carrying amount of the assets exceeds the fair value of the assets. Assets to be disposed of are reported at the lower of the carrying value or fair value, less costs to sell. There has been no impairment as of March 31, 2014 and 2013 other than discontinued operations.
Revenue Recognition
The Company recognizes revenues on the date the shipments are delivered to the customer. Revenue includes transportation revenue, fuel surcharges, loading and unloading activities, equipment detention, and other accessorial services. Revenue is recorded on a gross basis, without deducting third party purchased transportation costs, as the Company acts as a principal with substantial risks as primary obligor.
Advertising Costs
The Company charges advertising costs to expense as incurred. During the years ended March 31, 2014 and 2013, advertising expense was $3,707 and $3,707, respectively.
Derivative Liability
The Company issued warrants to purchase the Company’s common stock in connection with the issuance of common stock and convertible debt, which contain certain ratchet provisions that reduce the exercise price of the warrants or the conversion price in certain circumstances. Upon the Company’s adoption of the Derivative and Hedging Topic of the FASB Accounting Standards Codification (“ASC 815”) on January 1, 2009, the Company determined that the warrants and/or the conversion features with provisions that reduce the exercise price of the warrants did not qualify for a scope exception under ASC 815 as they were determined not to be indexed to the Company’s stock as prescribed by ASC 815.
Derivatives are required to be recorded on the balance sheet at fair value (see Note 6). These derivatives, including embedded derivatives in the Company’s structured borrowings, are separately valued and accounted for on the Company’s balance sheet. Fair values for exchange traded securities and derivatives are based on quoted market prices. Where market prices are not readily available, fair values are determined using market based pricing models incorporating readily observable market data and requiring judgment and estimates. In addition, additional disclosures is required about (a) how and why an entity uses derivative instruments, (b) how derivative instruments and related hedged items are accounted for and (c) how derivative instruments and related hedged items affect an entity’s financial position, financial performance, and cash flows.
F-10
INTEGRATED FREIGHT CORPORATION
Notes to Consolidated Financial Statements
Fair Value Measurements
Fair value is defined as the exchange price that would be received for an asset or paid to transfer a liability (an exit price) in the principal or most advantageous market for the asset or liability in an orderly transaction between market participants on the measurement date. The established fair value hierarchy requires an entity to maximize the use of observable inputs and minimize the use of unobservable inputs when measuring fair value. The standard describes three levels of inputs that may be used to measure fair value:
Level 1: Observable inputs such as quoted prices (unadjusted) in active markets for identical assets or liabilities.
Level 2: Inputs other than quoted prices that are observable for the asset or liability, either directly or indirectly. These include quoted prices for similar assets or liabilities in active markets; quoted prices for identical or similar assets or liabilities that are not active; and model-driven valuations whose inputs are observable or whose significant value drivers are observable. Valuations may be obtained from, or corroborated by, third-party pricing services.
Level 3: Unobservable inputs to measure fair value of assets and liabilities for which there is little, if any market activity at the measurement date, using reasonable inputs and assumptions based upon the best information at the time, to the extent that inputs are available without undue cost and effort.
Fair Value of Financial Instruments
The Company’s financial instruments, including cash and cash equivalents, receivables, accounts payable and accrued liabilities and notes payable are carried at cost, which approximates their fair value, due to the relatively short maturity of these instruments.
The carrying value of the Company’s long-term debt approximates fair value based on borrowing rates currently available to the Company for loans with similar terms.
Our derivative financial instruments, consisting of embedded conversion features in our convertible debt, which are required to be measured at fair value on a recurring basis under FASB ASC 815-15-25 or FASB ASC 815 as of March 31, 2014 and March 31, 2013, are all measured at fair value, using a Black-Scholes valuation model which approximates a binomial lattice valuation methodology utilizing Level 3 inputs. Level 3 inputs are unobservable inputs that are supported by little or no market activity and that are significant to the fair value of the assets or liabilities (see Note 6). Significant assumptions used in this model as of March 31, 2014 included a remaining expected life of 1 year, an expected dividend yield of zero, estimated volatility of 449%, and risk-free rates of return of approximately .72%. For the risk-free rates of return, we use the published yields on zero-coupon Treasury Securities with maturities consistent with the remaining term of the feature and volatility is based on a trucking company with characteristics comparable to our own.
The carrying amounts of cash, accounts receivable and accounts payable approximate fair value because of their short maturities. At March 31, 2014 and March 31, 2013, the Company had $708,108 and $611,356 outstanding under its revolving credit agreement, and $13,102,473 and $13,102,473, including $5,222,151 and $5,222,151 with related parties, outstanding under promissory notes with various lenders. The carrying amount of the revolving credit agreement approximates fair value as the rate of interest on the revolving credit facility approximate current market rates of interest for similar instruments with comparable maturities, and the interest rate is variable. The fair value of notes payable to various lenders is based on current rates at which the Company could borrow funds with similar remaining maturities.
F-11
INTEGRATED FREIGHT CORPORATION
Notes to Consolidated Financial Statements
Income Taxes
The Company accounts for income taxes under the asset and liability method, which requires the recognition of deferred tax assets and liabilities for the expected future tax consequences of events that have been included in the consolidated financial statements. Under this method, deferred tax assets and liabilities are determined based on the differences between the financial statements and tax basis of assets and liabilities using enacted tax rates in effect for the year in which the differences are expected to reverse. The effect of a change in tax rates on deferred tax assets and liabilities is recognized in income in the period that includes the enactment date.
The Company records net deferred tax assets to the extent it believes these assets will more likely than not be realized. In making such determination, the Company considers all available positive and negative evidence, including scheduled reversals of deferred tax liabilities, projected future taxable income, tax planning strategies and recent financial operations.
The Company recognizes a tax benefit from an uncertain tax position when it is more likely than not that the position will be sustained upon examination, including resolutions of any related appeals or litigation processes, based on the technical merits.
Stock-based Compensation
The Company has adopted the fair value recognition provisions of ASC 505, Equity and ASC 718, Compensation – Stock Compensation, using the modified prospective application method. Stock-based compensation expense is measured at the grant date based on the value of the option or restricted stock and is recognized as expense, less expected forfeitures, over the requisite service period.
Concentrations of Credit Risk
Financial instruments with significant credit risk include cash. The Company deposits its cash with high quality financial institutions in amounts less than the federal insurance limit of $250,000 in order to limit credit risk. As of March 31, 2014 and March 31, 2013, the Company's bank deposits did not exceed insured limits
Claims Accruals
Losses resulting from personal liability, physical damage, workers' compensation, and cargo loss and damage are covered by insurance subject to deductible, per occurrence. Losses resulting from uninsured claims are recognized when such losses are known and can be estimated. We estimate and accrue a liability for our share of ultimate settlements using all available information. We accrue for claims reported, as well as for claims incurred but not reported, based upon our past experience. Expenses depend on actual loss experience and changes in estimates of settlement amounts for open claims which have not been fully resolved. These accruals are based on our evaluation of the nature and severity of the claim and estimates of future claims development based on historical trends. Insurance and claims expense will vary based on the frequency and severity of claims and the premium expense. At March 31, 2014 and March 31, 2013, management estimated $0 in claims accrual above insurance deductibles.
However, from time to time the various business units are subject to premium audits on workers compensation. When the results of these audits are available, the various business units record the additional premiums due when they are advised by the respective carriers. Such amounts are generally amortized over the following 12 months.
Going Concern
We have suffered recurring losses from operations and are dependent on additional capital to execute our business plan.
F-12
INTEGRATED FREIGHT CORPORATION
Notes to Consolidated Financial Statements
With our present cash and cash equivalents, management expects to be able to continue some of our operations for at least the next twelve months. However, we have suffered losses from operations. Our continuation is dependent upon attaining and maintaining profitable operations and raising additional capital as needed. In this regard, we have raised additional capital through the debt and equity offerings noted above. We do, however, require additional cash due to changing business conditions or other future developments, including any investments or acquisitions we may decide to pursue. We plan to sell additional equity securities, debt securities or borrow from lending institutions. We cannot assure you that financing will be available in the amounts we need or on terms acceptable to us, if at all. The issuance of additional equity securities, including convertible debt securities, by us could result in a significant dilution in the equity interests of our current stockholders. The incurrence of debt would divert cash for working capital and capital expenditures to service debt obligations and could result in operating and financial covenants that restrict our operations and our ability to pay dividends to our shareholders. If we are unable to obtain additional equity or debt financing as required, our business operations and prospects may suffer. In such event, we will be forced to scale down or perhaps even cease our operations.
We have undertaken steps as part of a plan to improve operating results with the goal of sustaining our operations for the next twelve months and beyond. These steps include (a) raising additional capital and/or obtaining financing; (b) increasing our revenues and gross profits; and (c) reducing expenses. Additionally, we are implementing a four part strategy to bring us to financial stability, which is as follows:
|
●
|
A significant portion of our short term debt is in the hands of our subsidiary managers who, under the right circumstances, we believe may be willing to rework terms and to lengthen the maturity dates, as they have in the past, if that becomes necessary, lessening the short term debt on our balance sheet.
|
|
●
|
A significant amount of short term debt on our balance sheet is convertible into common shares and we are optimistic a meaningful amount of this debt will ultimately be converted, thus eliminating a meaningful amount of debt from our balance sheet.
|
|
●
|
We expect to continue to grow through acquisitions involving stock payments in lieu of cash. We expect this larger business base will give us an ever larger “platform” in order to more easily offset the corporate overhead and costs of being public.
|
You have no assurance that we will successfully accomplish these steps and it is uncertain whether we will achieve a profitable level of operations and/or obtain additional financing. You have no assurance that any additional financings will be available to us on satisfactory terms and conditions, if at all.
Our consolidated financial statements do not give effect to any adjustments which would be necessary should we be unable to continue as a going concern and therefore be required to realize our assets and discharge our current and potential liabilities in other than the normal course of business and at amounts different from those reflected in the accompanying consolidated financial statements.
Income (Loss) per Common Share
Basic net loss per share excludes the impact of common stock equivalents. Diluted net income (loss) per share utilizes the average market price per share when applying the treasury stock method in determining common stock equivalents. As of March 31, 2014, there were 12,947,390 warrants outstanding, of which none were included in the calculation of net income (loss) per share-diluted because they were anti-dilutive. In addition, the Company had convertible promissory notes that were also not included because they were anti-dilutive.
Effect of Recent Accounting Pronouncements
The Company reviews new accounting standards as issued. No new standards had any material effect on these financial statements. The accounting pronouncements issued subsequent to the date of these financial statements that were considered significant by management were evaluated for the potential effect on these consolidated financial statements. Management does not believe any of the subsequent pronouncements will have a material effect on these consolidated financial statements as presented and does not anticipate the need for any future restatement of these consolidated financial statements because of the retro-active application of any accounting pronouncements issued subsequent to March 31, 2014 through the date these financial statements were issued.
F-13
INTEGRATED FREIGHT CORPORATION
Notes to Consolidated Financial Statements
Note 2. Discontinued Operations
On June 30, 2012, the Company sold 100% of the stock of Triple C Transport, Inc., Cross Creek Trucking, Inc., and Integrated Freight Services.
Triple C Transport Inc. a motorized freight carrier, was acquired in May of 2010 through a stock purchase agreement. In October 2010, Triple C began to experience financial and operational difficulties that appeared too great to overcome. The Company attempted to rescind the stock purchase agreement, and consequently determined to dispose of this entity. As a result of the decision to sell Triple C, the Company has identified the assets and liabilities of Triple C Transport, Inc. as pertaining to discontinued operations, and has segregated its operating results and presented them separately as a discontinued operation for all periods presented.
Cross Creek Trucking Inc., a motorized freight carrier, was acquired in April 2011 through a stock purchase agreement. Due to the financial and operational difficulties experienced with this business, the Company determined to cease its operations in December 2011. As a result of the decision to sell Cross Creek, the Company has identified the assets and liabilities of Cross Creek Trucking, Inc. as pertaining to discontinued operations, and has segregated its operating results and presented them separately as a discontinued operation for all periods presented.
Integrated Freight Services was formed as a wholly owned subsidiary in February 2011 for the purpose of providing brokerage services to the various subsidiaries of the Company. With the decision to dispose of Triple C and Cross Creek, the Company determined to cease activities of this subsidiary and dispose of it as well. As a result of the decision to sell Integrated Freight Services, the Company has identified the assets and liabilities of Integrated Freight Services as pertaining to discontinued operations for all period’s presented
As a consequence of the sale on June 30, 2012 of 100% of the stock of these three entities, there are no longer any assets or liabilities to be accounted for as discontinued operations after this fiscal year ended March 31, 2013.
|
Summarized operating results for discontinued operations is as follows:
|
||||||||
|
|
||||||||
|
|
Year
|
Year
|
||||||
|
|
Ending
|
Ending
|
||||||
|
|
March 31,
|
March 31,
|
||||||
|
|
2014
|
2013
|
||||||
|
Revenue
|
$
|
-
|
$
|
-
|
||||
|
Operating Expenses
|
-
|
-
|
||||||
|
Operating Income (Loss)
|
-
|
-
|
||||||
|
|
||||||||
|
Other Income (Expense)
|
-
|
4,360,889
|
||||||
|
Income (Loss) from operations
|
-
|
4,360,889
|
||||||
|
Income tax benefit
|
||||||||
|
Gain (loss) to be recognized from discontinued operations, net of tax
|
$
|
-
|
$
|
4,360,889
|
||||
The gain (loss) from discontinued operations above do not include any income tax effect as the Company was not in a taxable position due to its continued losses and a full valuation allowance.
The Company had no remaining assets or liabilities associated with discontinued operations as of March 31, 2014 and 2013.
F-14
INTEGRATED FREIGHT CORPORATION
Notes to Consolidated Financial Statements
Note 3. Property and Equipment
Property and equipment consist of the following at March 31, 2014:
|
|
IFC
|
Morris
|
Smith
|
Total
|
||||||||||||
|
|
||||||||||||||||
|
Land, Buildings and Improvements
|
$
|
-
|
$
|
1,969
|
$
|
15,797
|
$
|
17,766
|
||||||||
|
Tractors and Trailers
|
-
|
3,274,557
|
2,887,513
|
6,162,070
|
||||||||||||
|
Vehicles
|
-
|
29,934
|
106,407
|
136,341
|
||||||||||||
|
Furniture, Fixtures and Equipment
|
-
|
221,828
|
284,625
|
509,453
|
||||||||||||
|
Less: accumulated depreciation
|
-
|
(1,742,790
|
)
|
(3,117,801
|
)
|
(4,860,591
|
)
|
|||||||||
|
Total
|
$
|
-
|
$
|
1,785,498
|
$
|
176,541
|
$
|
1,962,039
|
||||||||
Depreciation expense totaled $926,622 for the year ended March 31, 2014.
Property and equipment consist of the following at March 31, 2013:
|
|
IFC
|
Morris
|
Smith
|
Total
|
||||||||||||
|
|
||||||||||||||||
|
Land, Buildings and Improvements
|
$
|
-
|
$
|
1,969
|
$
|
15,797
|
$
|
17,766
|
||||||||
|
Tractors and Trailers
|
-
|
4,366,574
|
2,913,883
|
7,280,457
|
||||||||||||
|
Vehicles
|
-
|
29,934
|
106,407
|
136,341
|
||||||||||||
|
Furniture, Fixtures and Equipment
|
-
|
221,828
|
277,079
|
498,907
|
||||||||||||
|
Less: accumulated depreciation
|
-
|
(2,078,677
|
)
|
(2,997,599
|
)
|
(5,076,276
|
)
|
|||||||||
|
Total
|
$
|
-
|
$
|
2,541,628
|
$
|
315,567
|
$
|
2,857,195
|
||||||||
Depreciation expense totaled $1,137,323 for the year ended March 31, 2013.
Note 4. Intangible Assets
The Company purchased the stock of Morris and Smith in 2008, which resulted in the recognition of intangible assets. These intangible assets include the “employment and non-compete agreements” which are critical to the Company because of the management team’s business intelligence and customer relationship value which is required to execute the Company’s business plan. The intangibles also include their “company operating authority” and “customer lists.”
The Company operating authorities are tied to their motor carrier numbers that are issued and monitored by the U.S. Department of Transportation (USDOT). The USDOT issues a rating to each company which has a direct impact on that company’s ability to attract and maintain a stable customer base as well as reduce the Company’s insurance costs, one of the most significant expenditures for freight companies. Morris and Smith have the DOT’s highest rating, “Satisfactory,” which provides the Company with significant value. The customer lists adds value to the Company by providing an established cliental with established rates as well as predictable freight volume.
These intangible are as follows:
|
|
March 31,
|
March 31,
|
||||||
|
|
2014
|
2013
|
||||||
|
Employment and non-compete agreements
|
$
|
1,043,293
|
$
|
1,043,293
|
||||
|
Company operating authority and customer lists
|
891,958
|
891,958
|
||||||
|
|
||||||||
|
Total intangible assets
|
1,935,251
|
1,935,251
|
||||||
|
Less: accumulated amortization
|
(1,935,251
|
)
|
(1,935,251
|
)
|
||||
|
Intangible assets, net
|
$
|
-
|
$
|
-
|
||||
Amortization expense for the years ended March 31, 2014 and 2013 was $0 and $0 respectively.
F-15
INTEGRATED FREIGHT CORPORATION
Notes to Consolidated Financial Statements
Note 5. Line of Credit
Morris Revolving Credit
At March 31, 2014 and March 31, 2013, Morris has $ 708,108 and $611,356 outstanding under a revolving credit line agreement that allows it to borrow up to a total of $1,200,000. The line of credit is secured by accounts receivable, guaranteed by a previous owner and is due August 27, 2012. The applicable interest rate under this agreement is based on the Prime Rate, plus 3.5% with a floor of 4.00%.
Note 6. Notes Payable
Notes Payable owed by Morris consisted of the following:
|
|
March 31, 2014
|
March 31, 2013
|
||||||
|
|
||||||||
|
Notes payable to Daimler Truck Financial, payable in monthly installments ranging from $569 to $5,687 including interest, through May 2013, with interest rates ranging from 5.34% to 8.07%, secured by equipment
|
$
|
-
|
$
|
19,953
|
||||
|
|
||||||||
|
Notes payable to GE Financial, payable in monthly installments ranging from $2,999 to $7,535 including interest, through April 2013, with interest rates ranging from 6.69% to 8.53%, secured by equipment
|
149,364
|
487,729
|
||||||
|
|
||||||||
|
Notes payable to Wells Fargo Bank, payable in monthly installments ranging from $569 to $5,687 including interest, through March 2017, with interest rates ranging from 7.00% to 7.25%, secured by equipment
|
574,547
|
367,652
|
||||||
|
|
||||||||
|
Note payable to Mack Financial Services, payable in monthly installments of $8,359 including interest, through May 2016, with interest at 7.19% secured by equipment.
|
203,348
|
287,223
|
||||||
|
|
||||||||
|
Note payable to Mack Financial Services, payable in monthly installments of $2,105 including interest, through May 2016, with interest at 7.19% secured by equipment.
|
59,096
|
76,309
|
||||||
|
|
||||||||
|
Notes payable to Volvo Financial Services, payable in monthly installments ranging from $1,884 to $6,408 including interest, through October 2016, with interest rates ranging from 7.00% to 7.50%, secured by equipment
|
859,337
|
1,122,166
|
||||||
|
|
||||||||
|
Totals
|
$
|
1,845,692
|
$
|
2,361,032
|
||||
F-16
INTEGRATED FREIGHT CORPORATION
Notes to Consolidated Financial Statements
Notes payable owed by Smith consisted of the following:
|
|
March 31, 2014
|
March 31, 2013
|
||||||
|
|
||||||||
|
Notes payable to bank, payable in monthly installments of $60,000 including interest, through December 2012, with interest at 9%, collateralized by substantially all of Smith assets
|
$
|
977,484
|
$
|
1,015,298
|
||||
|
|
||||||||
|
Notes payable to bank, payable in monthly installments including interest, through June 2011, with interest at 6.5%, collateralized by substantially all of Smith assets
|
1,447,753
|
1,513,705
|
||||||
|
|
||||||||
|
Note payable to Floyds, payable in monthly installments of $2,084, through November 2012, with interest at 8%, secured by a vehicle.
|
-
|
36,683
|
||||||
|
|
||||||||
|
Note payable to Ally, payable in monthly installments of $599 including interest, through December 2015, with interest at 6%, secured by a vehicle.
|
11,503
|
18,019
|
||||||
|
|
||||||||
|
Notes payable to John Deere, payable monthly including interest, secured by equipment
|
5,135
|
15,944
|
||||||
|
Unsecured, non-interest bearing note payable to Colorado Holdings Valley Bank, payable in monthly installments of $5,000, through 2023.
|
701,570
|
701,570
|
||||||
|
|
||||||||
|
Total
|
$
|
3,143,445
|
$
|
3,301,219
|
||||
Notes payable owed by Integrated Freight Corporation consisted of the following:
|
|
March 31, 2014
|
March 31, 2013
|
||||||
|
|
||||||||
|
Various notes payable with maturity dates ranging from 05/10/10 to 12/28/11. Interest rates ranging from 4.0% to 18%. Various warrants issued with an exercise price ranging between $0.10 and $0.50 per share. Various notes contain a conversion feature allowing the holder to convert the debt into shares of common stock at a strike price between $0.30 and $0.50 per share.
|
$
|
1,083,101
|
$
|
1,083,101
|
||||
|
|
||||||||
|
Note payable to a former related party, with interest at 12.00%, a default judgment has been awarded to the holder, the Company intends to comply with the judgment when funds are available.
|
45,115
|
45,115
|
||||||
|
|
||||||||
|
Note payable to Robins Consulting, payable in quarterly installments of $60,000, through March 2012 and a final payment of $222,640 on June 30, 2012, with interest at 7.50%, secured by 1,056,300 shares of Integrated Freight Corporation stock
|
572,500
|
572,500
|
||||||
|
|
||||||||
|
Convertible promissory notes with an investment firm, simple interest
|
||||||||
|
of 8%, due in May 2012, convertible at the option of the holder at
|
||||||||
|
prices as defined.
|
151,155
|
151,155
|
||||||
|
|
||||||||
|
Original Issue Discount Senior Debenture with an investment firm, due
|
||||||||
|
April 2012, secured by Equipment.
|
343,200
|
343,200
|
||||||
|
|
||||||||
|
Convertible note payable to Wall Street Angel Partners LLC dated August 16, 2012, bearing interest at 8%, with a maturity date of December 31, 2012.
|
23,000
|
23,000
|
||||||
|
|
||||||||
|
Less: unamortized discount on notes payable
|
-
|
|||||||
|
|
||||||||
|
Totals
|
$
|
2,218,071
|
$
|
2,218,071
|
||||
F-17
INTEGRATED FREIGHT CORPORATION
Notes to Consolidated Financial Statements
Summary
|
|
IFC
|
Morris
|
Smith
|
Total
|
||||||||||||
|
|
||||||||||||||||
|
Current portion of notes payable & other
|
$
|
2,218,071
|
$
|
688,854
|
$
|
2,648,451
|
$
|
5,555,376
|
||||||||
|
|
||||||||||||||||
|
Notes payable, net of current portion
|
-
|
1,156,838
|
494,994
|
1,651,832
|
||||||||||||
|
|
||||||||||||||||
|
|
||||||||||||||||
|
Total as of March 31, 2014
|
$
|
2,218,071
|
$
|
1,845,692
|
$
|
3,143,445
|
$
|
7,207,208
|
||||||||
|
|
|
||||
|
|
|
||||
|
Principal maturities of long term debt for the next five years are as follows
|
Year Ending
|
||||
|
March 31,
|
Total
|
||||
|
2014
|
$
|
5,555,376
|
|||
|
2015
|
1,079,110
|
||||
|
2016
|
425,736
|
||||
|
2017
|
117,686
|
||||
|
2018
|
29,300
|
||||
|
Thereafter
|
-
|
||||
|
7,207,208
|
|||||
The Company valued the Notes Payable at their face value and calculated the beneficial conversion feature of the warrants using Black Scholes in deriving a discount that is being amortized over the term of the Notes as interest expense using a straight line method.
While there are no defaults of any obligations at the Company’s two subsidiaries, the Company’s parent company has a significant amount of its long-term obligations that are in default. The Company is currently in negotiation with these debt holders and intends to extend the terms of the maturity dates or convert the debt into equity. See Note 10 -Subsequent Events – for an overview of the results of such negotiations since March 31, 2014.
During the year ended March 31, 2011, the Company entered into convertible notes (the “Agreements”) with an investor (the “Investor”) pursuant to which the Investor purchased an aggregate principal amount of $189,000 (the “Convertible notes”). The convertible notes bear interest at 15% and maturity dates of one year from the date of issuance. The convertible notes, along with other notes from the same investor in previous years are convertible at the option of the holder at any time into shares of common stock, at a conversion price equal to $0.30, which would be approximately 3.3 million shares at March 31, 2014.
During the year ended March 31, 2012, the Company entered into convertible notes with an investor pursuant to which the Investor purchased an aggregate principal amount of $184,000 (the “Convertible notes”). These convertible notes bear interest at 8% (effective rate of 13%) and maturity dates six months from the dates of issuance. The convertible notes are convertible at the option of the holder at any time into shares of common stock, at a conversion price equal to an average of 53% of market. As of March 31, 2014, these notes had a balance of $151,155 and were convertible into approximately 14 million shares as of that date.
The conversion price of the convertible note is subject to full ratchet and anti-dilution adjustment for subsequent lower price issuances by the Company, as well as customary adjustments provisions for stock splits, stock dividends, recapitalizations and the like.
As a result of the convertible note, the Company has determined that the conversion feature of the convertible notes and the warrants issued with the convertible debentures are embedded derivative instruments pursuant to ASC 815-40-05 “Derivatives and Hedging-Contracts in Entity’s Own Equity” and ASC 815-10-05 “Derivatives and Hedging – Overall,” the accounting treatment of these derivative financial instruments requires that the Company record the derivatives at their fair values as of the inception date of the note agreements and at fair value as of each subsequent balance sheet date as a liability. Any change in fair value is recorded as non-operating, non-cash income or expense at each balance sheet date.
The fair value of the derivative liability at March 31, 2014 and March 31, 2013 was $8,874 and $29,580, respectively and are reflected on the Consolidated Balance Sheets.
F-18
INTEGRATED FREIGHT CORPORATION
Notes to Consolidated Financial Statements
Note 7. Related Party Notes Payable
Notes payable owed by the Company to related parties are as follows:
|
|
March 31, 2014
|
March 31, 2013
|
||||||
|
|
||||||||
|
Various notes payable with maturity dates ranging from 05/10/10 to 12/28/11. Interest rates ranging from 4.0% to 18%. Various warrants issued with an exercise price ranging between $0.10 and $0.50 per share. Various notes contain a conversion feature allowing the holder to convert the debt into shares of common stock at a strike price between $0.30 and $0.50 per share.
|
$
|
130,704
|
$
|
130,704
|
||||
|
|
||||||||
|
Collateralized Notes Payable due October 2012, with
|
||||||||
|
interest of 9.9%, collateralized by equipment as defined.
|
645,276
|
645,276
|
||||||
|
|
||||||||
|
Notes payable to related party, from acquisition described in note 11, to previous owners of Smith, with interest of 8%, secured by all shares of Smith common stock, principal and interest due May 15, 2011.
|
210,000
|
210,000
|
||||||
|
|
||||||||
|
Notes payable to related party, from acquisition described in note 11, to previous owners of Morris, with interest of 8%, secured by all shares of Morris common stock, principal and interest due May 15, 2011.
|
195,000
|
195,000
|
||||||
|
|
||||||||
|
Amounts payable to related party, from acquisition described in note 11, to previous owners of Triple C, payment due November 10, 2010. The Company is currently in litigation and The Company has rescinded this aquisition to extend maturity.
|
-
|
-
|
||||||
|
|
||||||||
|
Note payable to shareholder, with interest at 8.5%, due on demand.
|
171,563
|
206,718
|
||||||
|
|
||||||||
|
Note payable to shareholder, with interest at 8.0%, due on demand.
|
40,176
|
40,088
|
||||||
|
|
||||||||
|
Note payable to shareholder, with interest at 5.0%, due on demand.
|
48,750
|
48,750
|
||||||
|
|
||||||||
|
Note payable to related party, from acquisition described in note 11, to previous owners of Cross Creek, with interest at 5.0%, principal and interest due on March 31, 2019.
|
3,745,615
|
3,745,615
|
||||||
|
|
||||||||
|
Total
|
$
|
5,187,084
|
$
|
5,222,151
|
||||
Note 8. Income Taxes
A reconciliation of U.S. statutory federal income tax rate to the effective rate follows:
|
|
March 31, 2014
|
March 31, 2013
|
||||||
|
U.S. statutory federal rate, graduated
|
34.00
|
%
|
34.00
|
%
|
||||
|
State income tax rate, net of Federal
|
3.6
|
%
|
3.6
|
%
|
||||
|
Permanent book-tax differences
|
0
|
%
|
0
|
%
|
||||
|
Net operating loss (NOL) for which no tax benefit was available.
|
-37.6
|
%
|
-37.6
|
%
|
||||
|
Net tax rate
|
0.00
|
%
|
0.00
|
%
|
||||
F-19
INTEGRATED FREIGHT CORPORATION
Notes to Consolidated Financial Statements
At March 31, 2014, deferred tax assets consisted of a net tax asset of approximately $7,520,000, due to operating loss carry forwards of approximately $20,000,000, which was fully allowed for, in the valuation allowance of $7,520,000. The valuation allowance offsets the net deferred tax asset for which it was more likely than not that the deferred tax assets will not be realized. The change in the valuation allowance for the year ended March 31, 2014 as compared to March 31, 2013 totaled approximately $564,000. The net operating loss carry forwards expire through the year 2034.
The valuation allowance will be evaluated at the end of each year, considering positive and negative evidence about whether the deferred tax asset will be realized. At that time, the allowance will either be increased or reduced; reduction could result in the complete elimination of the allowance if positive evidence indicates that the value of the deferred tax assets was no longer impaired and the allowance was no longer required.
Note 9. Shareholders’ Deficit
Common Stock
Year Ended March 31, 2013
In April, 2012, the Company issued 1,444,473 common shares in satisfaction of convertible debt.
In April, 2012, the Company issued 649,996 common shares for services.
In May, 2012, the Company issued 3,445,614 common shares in satisfaction of convertible debt.
In June, 2012, the Company issued 1,857,143 common shares in satisfaction of convertible debt.
On June 30, 2012, the Company issued 20,000,000 common shares in conjunction with the sale of all of its interest in the discontinued operations of Triple C Transport, Cross Creek Trucking and Integrated Freight Services.
On August 3, 2012, the Company issued 10,000,000 common shares to Fuselier Consulting in accordance with the terms of a consulting contract. The stock was valued at $.002, its fair market value at the date of issuance.
In August, 2012, the Company issued 5,000,000 common shares to Jackson Morris for services. The stock was valued at $.002 per share, its fair market value at the date of issuance.
In October, 2012, the Company issued 30,247,500 common shares for services. The stock was valued at $.005 per share, its fair market value at the date of issuance.
Year Ended March 31, 2014
In August, 2013, the Company issued 5,000,000 common shares for services at $0.0199 per share.
In October, 2013, the Company issued 5,606,061 common shares for services at $0.004 per share.
In December, 2013, the Company issued 60,000,000 common shares for accrued compensation to Officers of the Company. The shares were valued using a volume weighted average price of $.0039 per share.
In February, 2014, the Company issued 73,407,828 common shares for accrued compensation to Officers of the Company. The shares were valued using a volume weighted average price of $.0075 per share.
F-20
INTEGRATED FREIGHT CORPORATION
Notes to Consolidated Financial Statements
Warrants to Purchase Common Stock
The Company did not issue any new warrants to purchase Common Stock during the fiscal years ended March 31, 2014 and 2013.
The fair value for the warrants was estimated at the date of valuation using the Black-Scholes option-pricing model with the following assumptions:
|
Risk-free interest rate
|
1.27- 2.19
|
%
|
||
|
Dividend yield
|
0.00
|
%
|
||
|
Volatility factor
|
172
|
%
|
||
|
Expected life
|
3-5 years
|
|||
The relative fair value of warrants issued is calculated in accordance with ASC 470-20, Debt with Conversion and Other Options.
A summary of the warrant balances outstanding for the year ended March 31, 2014 and 2013 is presented below:
|
|
|
Stock Awards
|
|
|
Average
|
|
|
Remaining
|
|
|||
|
|
|
Outstanding
|
|
|
Exercise
|
|
|
Contractual
|
|
|||
|
|
|
& Exercisable
|
|
|
Price
|
|
|
Term
|
|
|||
|
Balance, April 1, 2012
|
|
|
14,394,890
|
|
|
$
|
0.23
|
|
|
2 years
|
|
|
|
Granted
|
|
|
-
|
|
|
|
0.00
|
|
|
|
||
|
Exercised
|
|
|
-
|
|
|
0.0
|
|
|
|
|||
|
Expired/Cancelled
|
|
|
1,087,500
|
|
|
0.0
|
|
|
|
N/A
|
|
|
|
|
|
|
|
|
|
|
|
|
|
|
|
|
|
Balance, March 31, 2013
|
|
|
13,307,390
|
|
|
$
|
0.23
|
|
|
2 years
|
|
|
|
Granted
|
|
|
-
|
|
|
|
0.0
|
|
|
-
|
|
|
|
Exercised
|
|
|
-
|
|
|
0.0
|
|
|
-
|
|
||
|
Expired/Cancelled
|
|
|
360,000
|
|
|
|
0
|
|
|
|
N/A
|
|
|
|
|
|
|
|
|
|
|
|
|
|
|
|
|
Balance, March 31, 2014
|
|
|
12,947,390
|
|
|
$
|
0.23
|
|
|
2 years
|
|
|
As of March 31, 2014 and 2013, the number of warrants that were currently vested and expected to become vested was 12,947,390 and 13,307,390, respectively.
Note 10. Commitments and Contingencies
Operating Leases
At March 31, 2014 the Company operated a virtual corporate office by utilizing the virtual office of the Chief Executive Officer in Southbury, Connecticut at the corporate offices of Fuselier and Co. in Danbury, Connecticut at no charge to the Company. The value of this accommodation is deemed to be immaterial.
The Company leases approximately 15,000 square feet of office, and truck service space in Hamburg, Arkansas for the operations of Morris Transportation, Inc. by paying the mortgage payment on the property on a month to month basis.
The Company leases approximately 36,500 square feet of office, warehouse, and truck service space in Scotts Bluff, Nebraska from Colorado Holdings, a company controlled by Mr. Smith at a monthly rental of $4,000 per month.
The Company has multiple leases for trucks and trailers at various rental rates. These leases are generally no longer than 5 years.
Total rent expense for the year ended March 31, 2014 was approximately $790,000.
F-21
INTEGRATED FREIGHT CORPORATION
Notes to Consolidated Financial Statements
The Company’s commitments for minimum lease payments under these operating leases for the next five years as of March 31, 2014 are as follows:
|
|
||||
|
Period ended March 31,
|
||||
|
2014
|
$931,344
|
|||
|
2015
|
931,344
|
|||
|
2016
|
924,498
|
|||
|
2017
|
794,544
|
|||
|
2018
|
646,313
|
|||
Employment Agreements
From time to time since 2008, the Company has entered into several five year employment agreements with executives of the Company. In 2013, we committed to pay executives a total of $275,000 per year, plus usual and customary benefits. The agreements also call for bonuses if the executives meet certain goals which are to be set by the board of directors annually.
Consulting Agreements
On August 3, 2012 our Board of Directors voted to engage Fuselier Consulting of Southbury, CT, as its strategic business consultant. Under terms of the agreement, Fuselier will consult with our management regarding the execution of our restructuring, Fuselier will be compensated with the issuance of our stock. The Board directed the Company to issue to Fuselier ten million shares of stock at signing and an additional two and a half million shares per quarter through the term of the agreement
Purchase Commitments
The Company’s purchase commitments for revenue equipment are always under negotiation and review. Upon execution of the purchase commitments, the Company anticipates that purchase commitments under contract will have a net purchase price of approximately $1,000,000 to $3,000,000 and are expected to be financed over an average of 4 to 7 years.
Active litigation:
As a lender to the Company and its subsidiaries, Hillair Capital Investments, LP partially funded the Company’s acquisition of Cross Creek and a portion of the Company’s working capital requirements in 2011 via two notes totaling $339,660. Hillair initially sought $1,200,000 in unspecified damages in New York State. In 2014, the Company settled with Hillair for $400,000 payable $100,000 down and $300,000 paid pro rata over the following three year period. Under the court order the Company became in default of the agreement by its terms. In the event of a default, Hillair’s recovery is limited to $450,000. The Company continues to discuss with Hillair an economic resolution of the matter and has booked the full defaulted amount. .
As a lender to the Company, Luberski, Inc., loaned the Company, via two Notes, $400,000 in 2011. The Company defaulted on both loans and Luberski received a judgment against one of Company’s two subsidiaries. In 2015, the Company and Luberski were actively negotiating the settlement of the outstanding balance. The Company has booked reserves equivalent to the debt outstanding plus interest and fees that may become due.
F-22
INTEGRATED FREIGHT CORPORATION
Notes to Consolidated Financial Statements
In 2012, Chapman and Associates sued the Company for fees related to their introduction of two acquired subsidiaries of the Company and received a judgment for the full amount of the suit.. The Company has reserved $900,000 relating to this debt and in 2015 participated in negotiations with Chapman to settle.
The Nutmeg/Fortuna Fund litigation relates to the collection on a 2008 promissory note. The Company has reserved $175,000 relating to this matter. In 2015 we continued to participate in negotiations with Nutmeg to settle.
Other litigation:
On April 16, 2012, the Company entered into a forbearance agreement with Michael S. DeSimone, former owner of Cross Creek Trucking, Inc. As part of the agreement we issued a confession of judgment to Mr. DeSimone in the amount of $3,745,415 plus accrued interest. We agreed to pay $5,000 per month commencing September 1, 2012 but are not currently in compliance with the agreement and are in negotiations to restructure the terms of the original agreement.
In January 2013 Robins Consulting, Inc. filed suit against us and our former CEO Paul Henley for $572,000 in broker fees related to the acquisition of Cross Creek Trucking. We believe that Robins Consulting misrepresented the condition of Cross Creek in a material manner. The Company is aggressively defending this case, has filed counterclaims, and has prepared a lawsuit against Robins for damages in excess of one million dollars.
Litigation in the normal course of business
We expect to be engaged in litigation from time to time in the normal course of our business as a motor freight carrier. Claims for worker’s compensation, auto accident, general liability and cargo and property damage are routine occurrences in the motor transportation industry. We have programs and policies which are designed to minimize the events that result in such claims. We maintain insurance against workers’ compensation, auto liability, general liability, cargo and property damage claims. We are responsible for deductible amounts up to $3,000 per accident. We periodically evaluate and adjust our insurance and claims reserves to reflect our experience. Our workers’ compensation claims are entirely covered by our insurance. Insurance carriers have raised premiums for many businesses, including truck transportation companies. As a result, our insurance and claims expense could increase, or we could raise our deductible when our policies are renewed. We believe that our policy of self-insuring up to set limits, together with our safety and loss prevention programs, are effective means of managing insurable costs.
Claims and Assessments
The Company is involved in certain claims and pending litigation arising from the normal conduct of business. Based on the present knowledge of the facts and, in certain cases, opinions of outside counsel, the Company believes the resolution of these claims and pending litigation will not have a material adverse effect on our financial condition, our results of operations or our liquidity.
Note 11. Related Party Transactions
We have been paying the mortgage payments for Morris Transportation, Inc. to an unrelated lender on behalf of an entity controlled by Mr. Morris as rent without a formal lease and intend to purchase the property at fair market value, as determined by appraisal, which may require us to refinance the mortgage.
The Company rents a facility owned by Colorado Holdings, a company controlled by Mr. Smith. The annual rental rate is $48,000. As of March 31, 2014, there is an accrued balance of approximately $25,000 outstanding.
F-23
INTEGRATED FREIGHT CORPORATION
Notes to Consolidated Financial Statements
Note 12. Subsequent Events
On various dates since the fiscal year end, the Company has reached full and complete settlements with employees, creditors and/or note holders. These settlements include:
|
· Officer and employee payments of $827,000 settled for $36,500 cash plus common shares;
|
|
· Former subsidiary owners payments of $467,000 settled for $17,000 cash plus convertible preferred shares;
|
|
· Note holder payments of $357,000 settled for future cash payments of $135,000 plus convertible preferred shares.
|
In October, 2014, the Company issued 10,000,000 common shares for services.
In October, 2014, the Company issued 20,000,000 common shares to Fuselier Consulting in accordance with the terms of a consulting contract. The stock was valued at $.0071 per share, its fair market value at the date of issuance
In November, 2014, the Company issued 13,500,000 common shares for services. The stock was valued at $.0072 per share, its fair market value at the date of issuance
In November, 2014, the Company issued 8,278,265 common shares for accrued compensation to Officers of the Company. The shares were valued using a volume weighted average price of $.017 per share
In January, 2015, the Company issued 35,219,711 common shares in satisfaction of convertible debt
In February, 2015, the Company issued 14,925,926 common shares in satisfaction of convertible debt
In February, 2015, the Company issued 875,000 common shares as part of a negotiated settlement on debt
In February, 2015, the Company issued 9,198,529 common shares for services.
In February, 2015, the Company issued 6,666,667 common shares in satisfaction of convertible debt
In February, 2015, the Company issued 7,163,128 common shares in satisfaction of convertible debt
In February, 2015, the Company issued 7,555,000 common shares in satisfaction of convertible debt
In March, 2015, the Company issued 12,646,271 common shares in satisfaction of convertible debt
In March, 2015, the Company issued 11,443,366 common shares in satisfaction of convertible debt
In March, 2015, the Company issued 16,134,167 common shares in satisfaction of convertible debt
F-24