Attached files
| file | filename |
|---|---|
| EX-99.1 - EX-99.1 - ACI WORLDWIDE, INC. | d918746dex991.htm |
| 8-K - 8-K - ACI WORLDWIDE, INC. | d918746d8k.htm |
Exhibit 99.2
|
|

Quarterly Results
March 31, 2015
ACI Worldwide
April 30, 2015
|
|
Private Securities Litigation Reform Act of 1995 Safe Harbor For Forward-Looking Statements
This presentation contains forward-looking statements based on current expectations that involve a number of risks and uncertainties. The forward-looking statements are made pursuant to safe harbor provisions of the Private Securities Litigation Reform Act of 1995. A discussion of these forward-looking statements and risk factors that may affect them is set forth at the end of this presentation. The Company assumes no obligation to update any forward-looking statement in this presentation, except as required by law.
MEETS THE CHALLENGE OF CHANGE
Universal Payments 2
|
|
QUARTERLY OVERVIEW
Phil Heasley
Chief Executive Officer
Universal Payments
|
|
Strong market interest in Universal Payments validates strategy
Signed large new customer in transportation sector
Non-GAAP Revenue up 5%
Adjusted EBITDA up 16%
Non-GAAP operating income up 45%
Operating free cash flow up 159%
Reiterating 2015 guidance (adjusted for FX)
Q1 2015 in Review
MEETS THE CHALLENGE OF CHANGE
Universal Payments 4
|
|
Universal Payments
FINANCIAL REVIEW
Scott Behrens
Chief Financial Officer
|
|
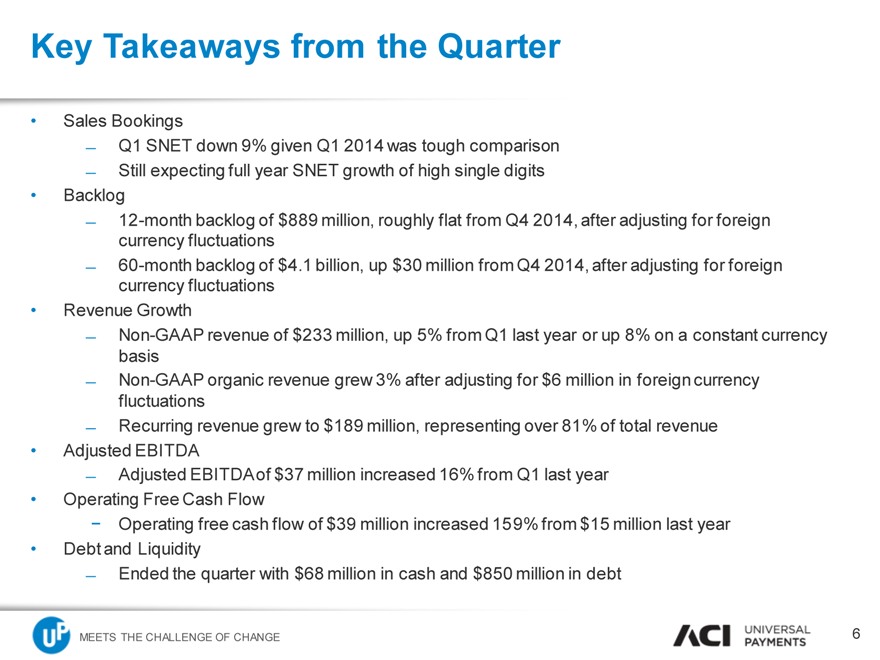
Key Takeaways from the Quarter
• Sales Bookings
Q1 SNET down 9% given Q1 2014 was tough comparison
Still expecting full year SNET growth of high single digits
• Backlog
12-month backlog of $889 million, roughly flat from Q4 2014, after adjusting for foreign currency fluctuations
60-month backlog of $4.1 billion, up $30 million from Q4 2014, after adjusting for foreign currency fluctuations
• Revenue Growth
Non-GAAP revenue of $233 million, up 5% from Q1 last year or up 8% on a constant currency basis
Non-GAAP organic revenue grew 3% after adjusting for $6 million in foreign currency fluctuations
Recurring revenue grew to $189 million, representing over 81% of total revenue
• Adjusted EBITDA
Adjusted EBITDA of $37 million increased 16% from Q1 last year
• Operating Free Cash Flow
- Operating free cash flow of $39 million increased 159% from $15 million last year
• Debt and Liquidity
Ended the quarter with $68 million in cash and $850 million in debt
• 6
|
|
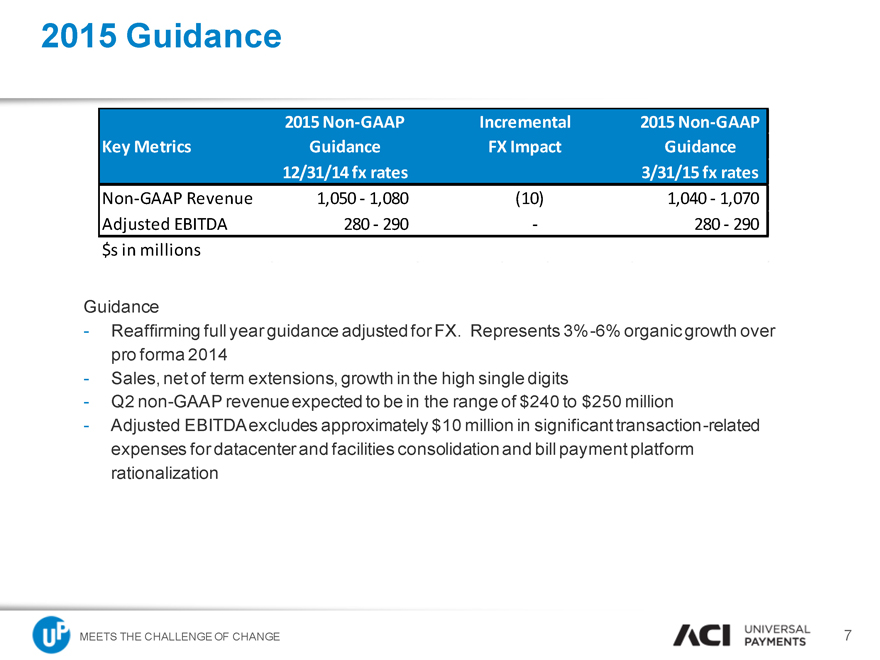
2015 Guidance
2015 Non-GAAP Incremental 2015 Non-GAAP
Key Metrics Guidance FX Impact Guidance
12/31/14 fx rates 3/31/15 fx rates
Non-GAAP Revenue 1,050 - 1,080(10) 1,040 - 1,070
Adjusted EBITDA 280 - 290 - 280 - 290
$s in millions
Guidance
Reaffirming full year guidance adjusted for FX. Represents 3%-6% organic growth over pro forma 2014
Sales, net of term extensions, growth in the high single digits
Q2 non-GAAP revenue expected to be in the range of $240 to $250 million
Q2 2014 revenue was $240 million on a constant currency basis
Adjusted EBITDA excludes approximately $10 million in significant transaction-related expenses for datacenter and facilities consolidation and bill payment platform rationalization
MEETS THE CHALLENGE OF CHANGE
Universal Payments 7
|
|
Universal Payments
APPENDIX
|
|
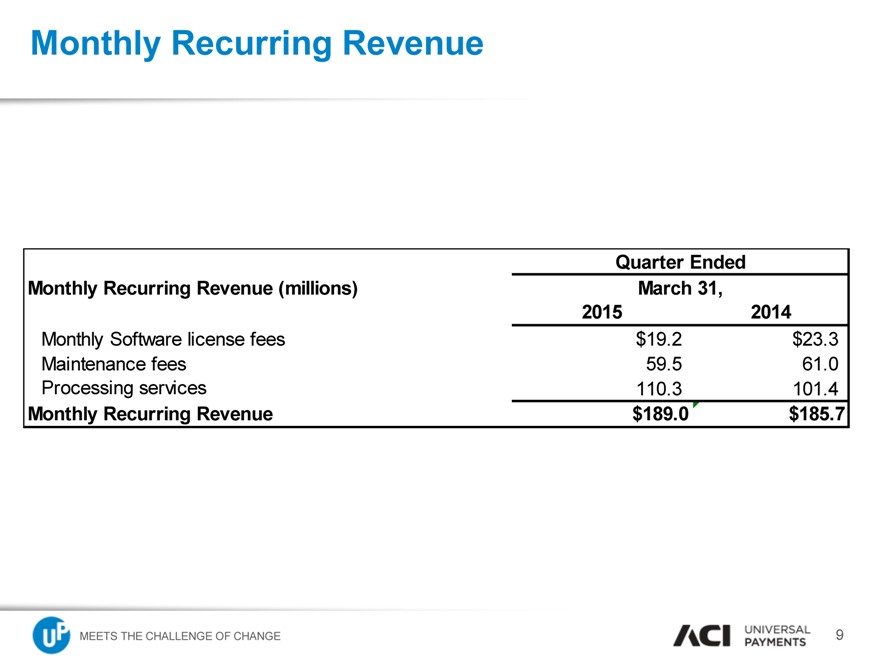
Monthly Recurring Revenue
Quarter Ended
Monthly Recurring Revenue (millions) March 31,
2015 2014
Monthly Software license fees $19.2 $23.3
Maintenance fees 59.5 61.0
Processing services 110.3 101.4
Monthly Recurring Revenue $189.0 $185.7
MEETS THE CHALLENGE OF CHANGE
Universal Payments 9
|
|
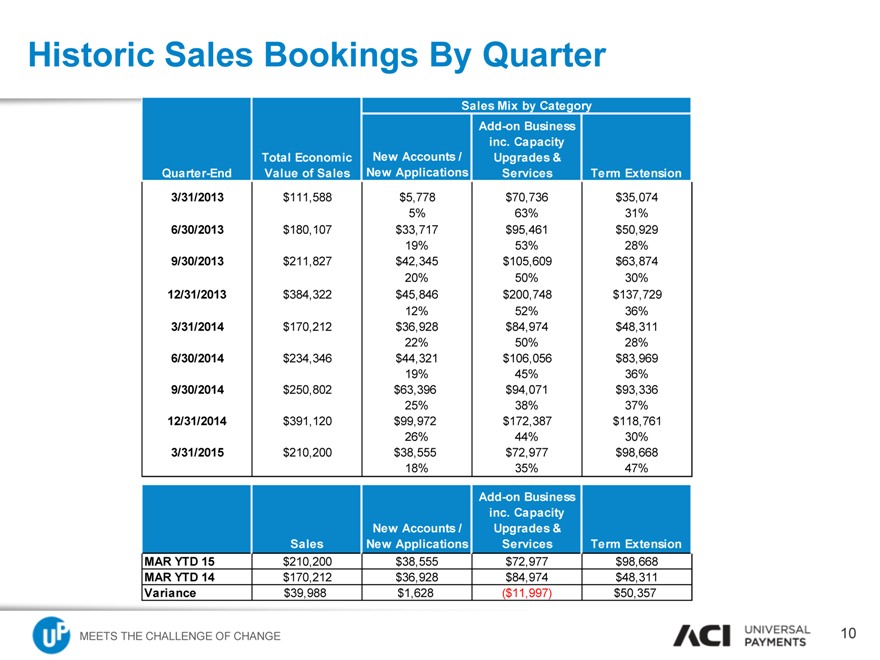
Historic Sales Bookings By Quarter
Sales Mix by Category
Add-on Business
inc. Capacity
Total Economic New Accounts / Upgrades &
Quarter-End Value of Sales New Applications Services Term Extension
3/31/2013 $ 111,588 $5,778 $70,736 $35,074
5% 63% 31%
6/30/2013 $ 180,107 $33,717 $95,461 $50,929
19% 53% 28%
9/30/2013 $ 211,827 $42,345 $105,609 $63,874
20% 50% 30%
12/31/2013 $ 384,322 $45,846 $200,748 $137,729
12% 52% 36%
3/31/2014 $ 170,212 $36,928 $84,974 $48,311
22% 50% 28%
6/30/2014 $ 234,346 $44,321 $106,056 $83,969
19% 45% 36%
9/30/2014 $ 250,802 $63,396 $94,071 $93,336
25% 38% 37%
12/31/2014 $ 391,120 $99,972 $172,387 $118,761
26% 44% 30%
3/31/2015 $ 210,200 $38,555 $72,977 $98,668
18% 35% 47%
Add-on Business
inc. Capacity
New Accounts / Upgrades &
Sales New Applications Services Term Extension
MAR YTD 15 $ 210,200 $38,555 $72,977 $98,668
MAR YTD 14 $ 170,212 $36,928 $84,974 $48,311
Variance $39,988 $1,628($11,997) $50,357
MEETS THE CHALLENGE OF CHANGE
Universal Payments 10
|
|
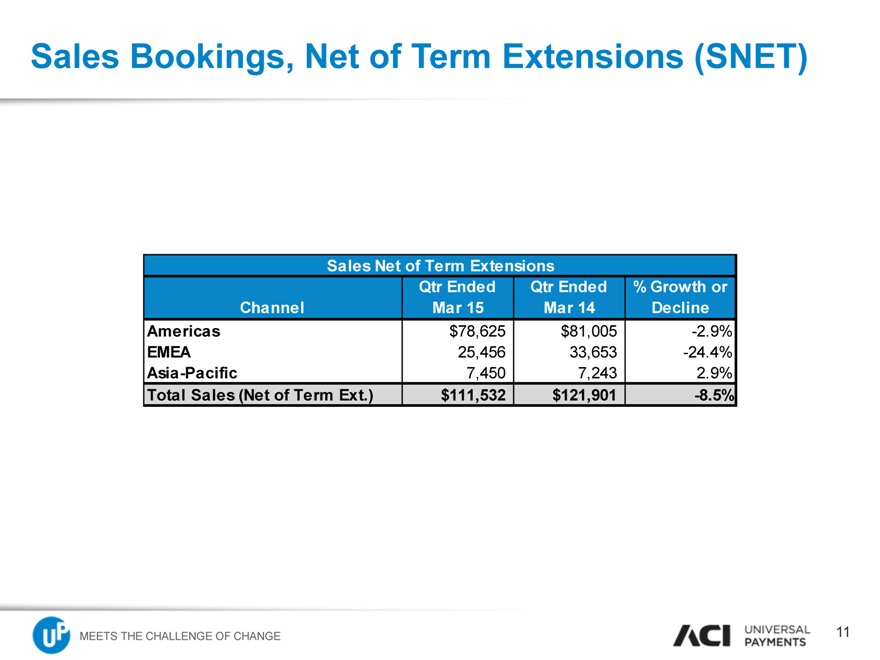
Sales Bookings, Net of Term Extensions (SNET)
Sales Net of Term Extensions
Qtr Ended Qtr Ended% Growth or
Channel Mar 15 Mar 14 Decline
Americas $78,625 $81,005 -2.9%
EMEA 25,456 33,653 -24.4%
Asia -Pacific 7,450 7,243 2.9%
Total Sales (Net of Term Ext.) $111,532 $121,901 -8.5%
MEETS THE CHALLENGE OF CHANGE
Universal Payments 11
|
|
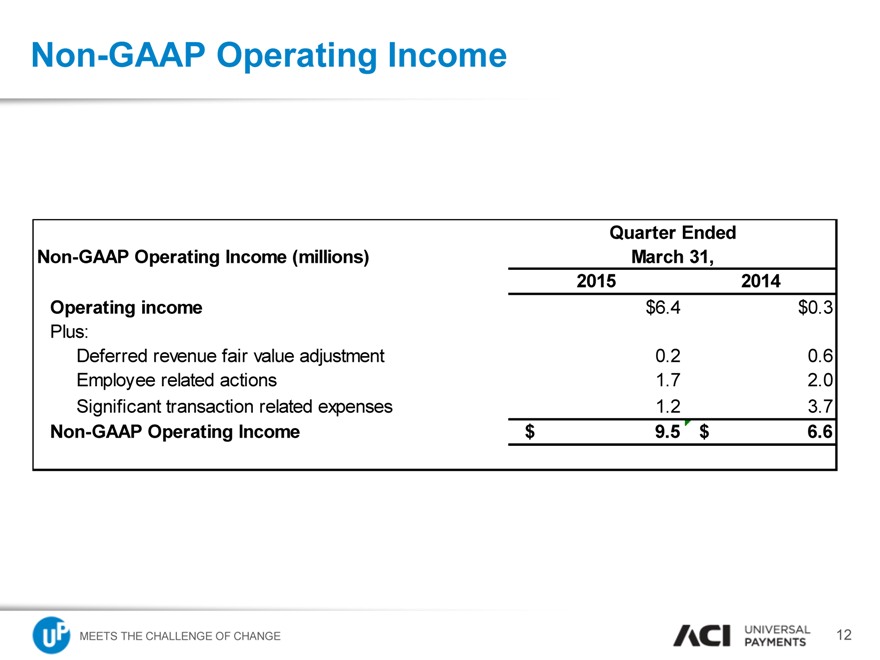
Non-GAAP Operating Income
Quarter Ended
Non-GAAP Operating Income (millions) March 31,
2015 2014
Operating income $6.4 $0.3
Plus:
Deferred revenue fair value adjustment 0.2 0.6
Employee related actions 1.7 2.0
Significant transaction related expenses 1.2 3.7
Non-GAAP Operating Income $ 9.5 $ 6.6
MEETS THE CHALLENGE OF CHANGE
Universal Payments 12
|
|
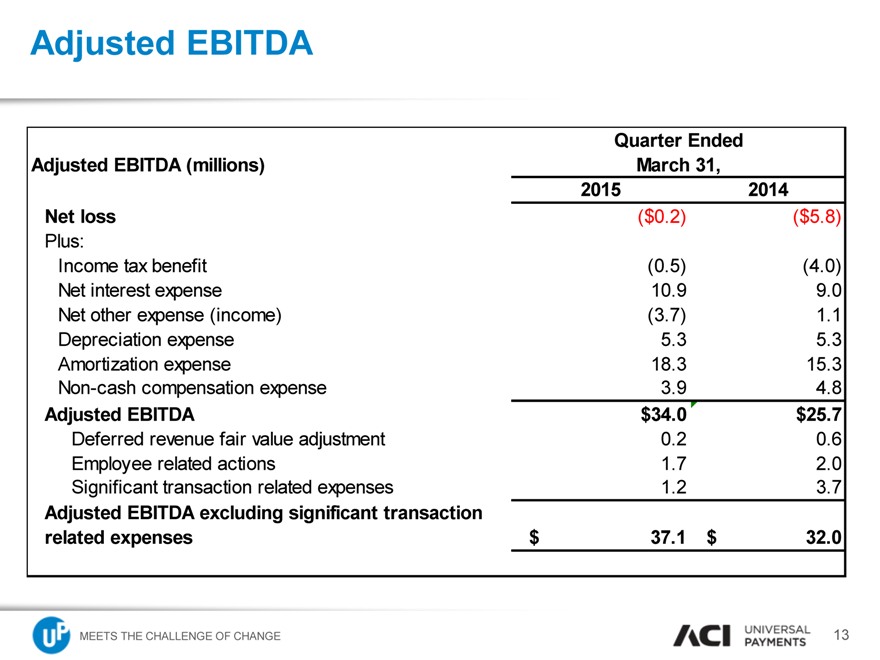
Adjusted EBITDA
Quarter Ended
Adjusted EBITDA (millions) March 31,
2015 2014
Net loss ($0.2) ($5.8)
Plus:
Income tax benefit (0.5) (4.0)
Net interest expense 10.9 9.0
Net other expense (income) (3.7) 1.1
Depreciation expense 5.3 5.3
Amortization expense 18.3 15.3
Non-cash compensation expense 3.9 4.8
Adjusted EBITDA $34.0 $25.7
Deferred revenue fair value adjustment 0.2 0.6
Employee related actions 1.7 2.0
Significant transaction related expenses 1.2 3.7
Adjusted EBITDA excluding significant transaction
related expenses $ 37.1 $ 32.0
MEETS THE CHALLENGE OF CHANGE
Universal Payments 13
|
|
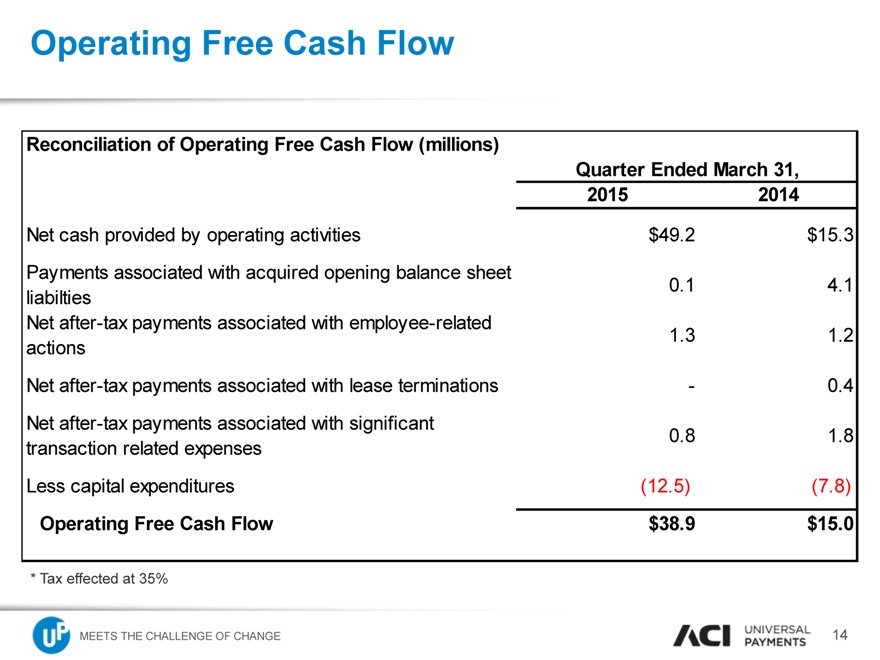
Operating Free Cash Flow
Reconciliation of Operating Free Cash Flow (millions)
Quarter Ended March 31,
2015 2014
Net cash provided by operating activities $49.2 $15.3
Payments associated with acquired opening balance sheet 0.1 4.1
liabilties
Net after-tax payments associated with employee-related 1.3 1.2
actions
Net after-tax payments associated with lease terminations—0.4
Net after-tax payments associated with significant 0.8 1.8
transaction related expenses
Less capital expenditures (12.5) (7.8)
Operating Free Cash Flow $38.9 $15.0
* Tax effected at 35%
MEETS THE CHALLENGE OF CHANGE
Universal Payments 14
|
|
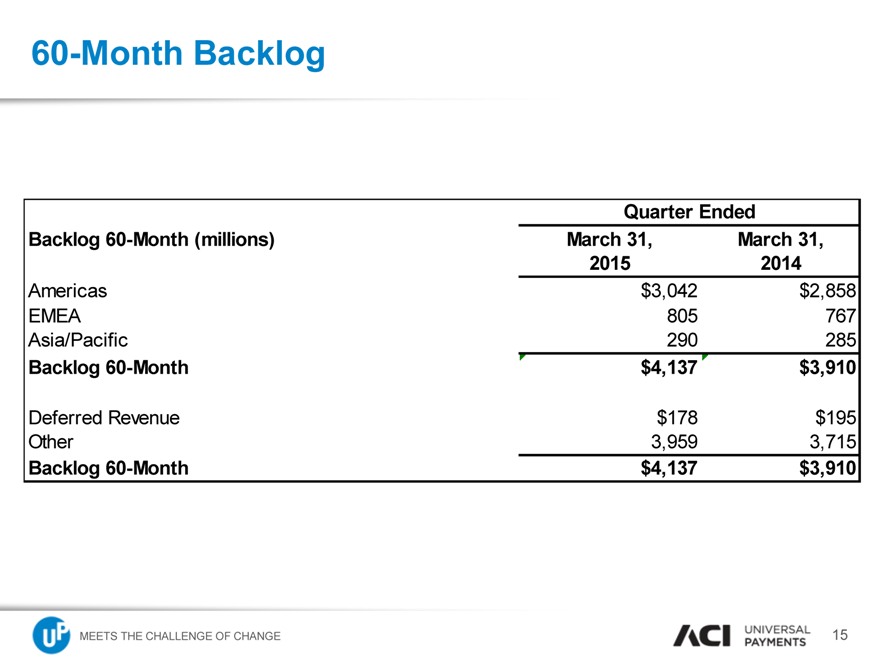
60-Month Backlog
Quarter Ended Backlog 60-Month (millions) March 31, March 31, 2015 2014
Americas $3,042 $2,858 EMEA 805 767 Asia/Pacific 290 285
Backlog 60-Month $4,137 $3,910
Deferred Revenue $178 $195 Other 3,959 3,715
Backlog 60-Month $4,137 $3,910
MEETS THE CHALLENGE OF CHANGE
Universal Payments 15
|
|
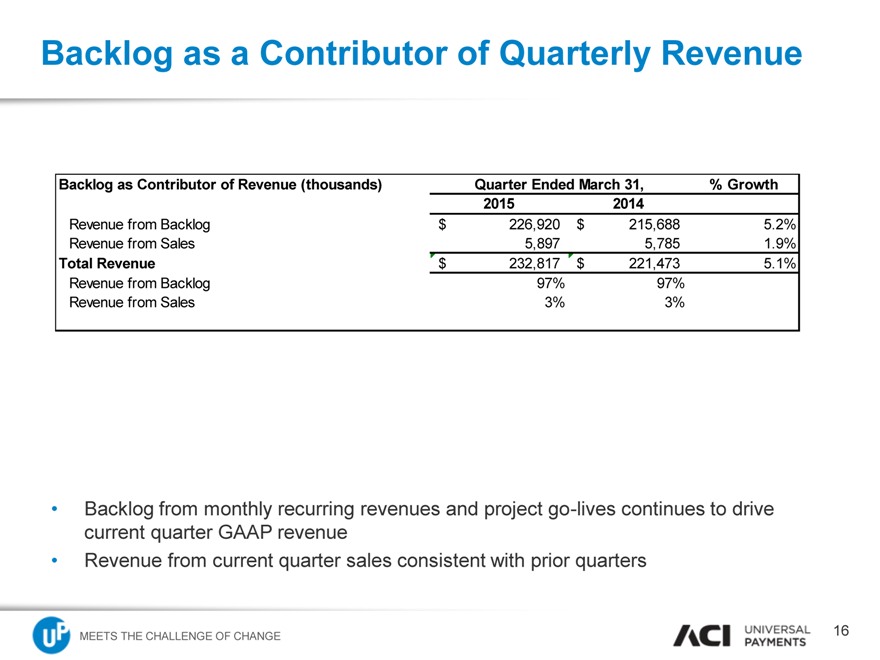
Backlog as a Contributor of Quarterly Revenue
Backlog as Contributor of Revenue (thousands) Quarter Ended March 31, % Growth
2015 2014
Revenue from Backlog $ 226,920 $ 215,688 5.2%
Revenue from Sales 5,897 5,785 1.9%
Total Revenue $ 232,817 $ 221,473 5.1%
Revenue from Backlog 97% 97%
Revenue from Sales 3% 3%
Backlog from monthly recurring revenues and project go-lives continues to drive current quarter GAAP revenue Revenue from current quarter sales consistent with prior quarters
MEETS THE CHALLENGE OF CHANGE
Universal Payments 16
|
|
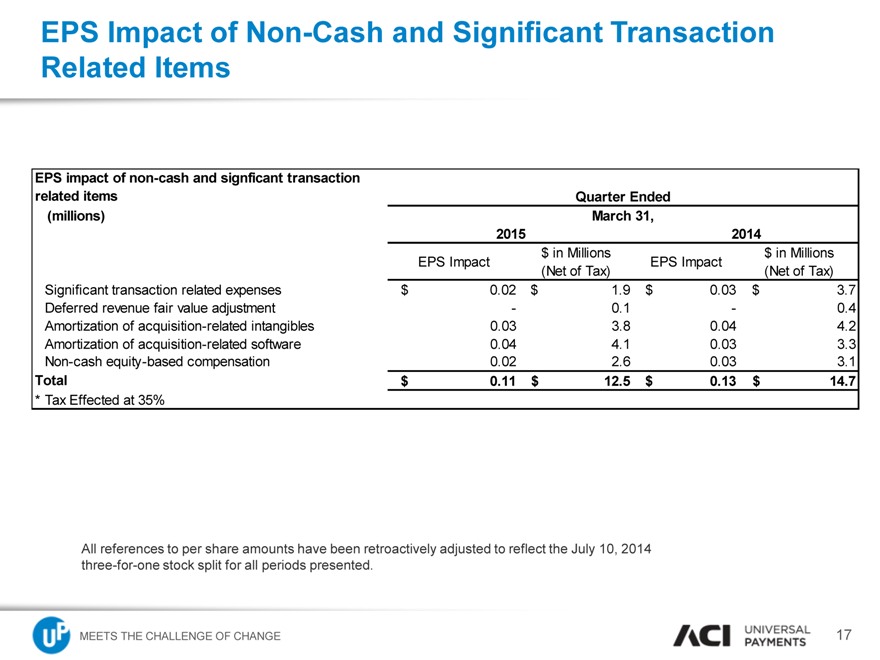
EPS Impact of Non-Cash and Significant Transaction Related Items
EPS impact of non-cash and significant transaction
related items Quarter Ended
(millions) March 31,
2015 2014
$ in Millions $ in Millions
EPS Impact EPS Impact
(Net of Tax) (Net of Tax)
Significant transaction related expenses $ 0.02 $ 1.9 $ 0.03 $ 3.7
Deferred revenue fair value adjustment - 0.1 - 0.4
Amortization of acquisition-related intangibles 0.03 3.8 0.04 4.2
Amortization of acquisition-related software 0.04 4.1 0.03 3.3
Non-cash equity-based compensation 0.02 2.6 0.03 3.1
Total $ 0.11 $ 12.5 $ 0.13 $ 14.7
* Tax Effected at 35%
All references to per share amounts have been retroactively adjusted to reflect the July 10, 2014 three-for-one stock split for all periods presented.
MEETS THE CHALLENGE OF CHANGE
Universal Payments 17
|
|
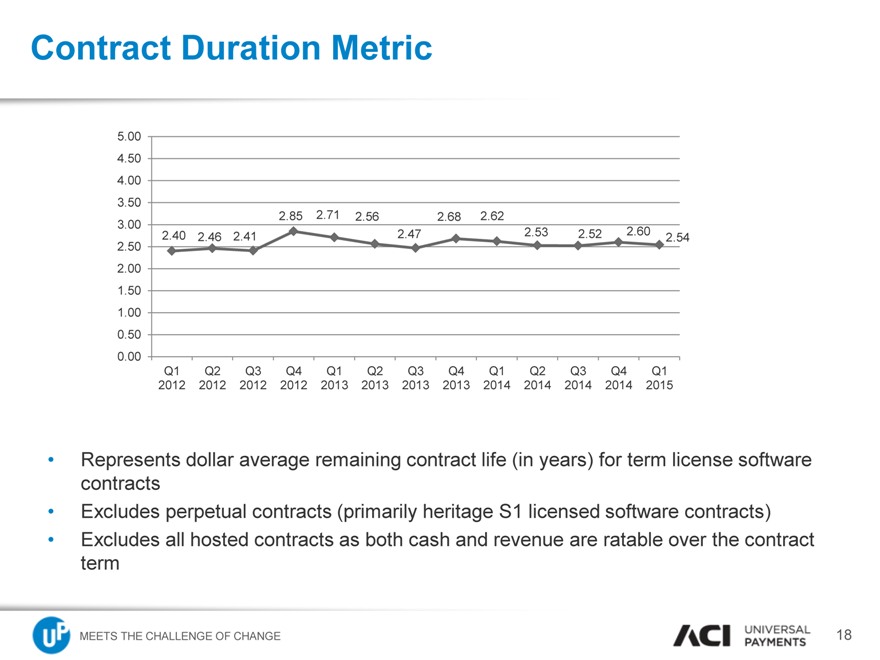
Contract Duration Metric
Represents dollar average remaining contract life (in years) for term license software contracts Excludes perpetual contracts (primarily heritage S1 licensed software contracts) Excludes all hosted contracts as both cash and revenue are ratable over the contract term
5.00
4.50
4.00
3.50
2.85 2.71 2.56 2.68 2.62
3.00
2.40 2.41 2.47 2.53 2.52 2.60
2.46 2.54
2.50
2.00
1.50
1.00
0.50
0.00
Q1 Q2 Q3 Q4 Q1 Q2 Q3 Q4 Q1 Q2 Q3 Q4 Q1 2012 2012 2012 2012 2013 2013 2013 2013 2014 2014 2014 2014 2015
MEETS THE CHALLENGE OF CHANGE
Universal Payments 18
|
|
Non-GAAP Financial Measures
To supplement our financial results presented on a GAAP basis, we use the non-GAAP measures indicated in the tables, which exclude certain business combination accounting entries related to the acquisition of Online Resources Corporation and significant transaction related expenses, as well as other significant non-cash expenses such as depreciation, amortization, and share-based compensation, that we believe are helpful in understanding our past financial performance and our future results. The presentation of these non-GAAP financial measures should be considered in addition to our GAAP results and are not intended to be considered in isolation or as a substitute for the financial information prepared and presented in accordance with GAAP. Management generally compensates for limitations in the use of non-GAAP financial measures by relying on comparable GAAP financial measures and providing investors with a reconciliation of non-GAAP financial measures only in addition to and in conjunction with results presented in accordance with GAAP. We believe that these non-GAAP financial measures reflect an additional way to view aspects of our operations that, when viewed with our GAAP results, provide a more complete understanding of factors and trends affecting our business. Certain non-GAAP measures include:
Non-GAAP revenue: revenue plus deferred revenue that would have been recognized in the normal course of business by Online Resources if not for GAAP purchase accounting requirements. Non-GAAP revenue should be considered in addition to, rather than as a substitute for, revenue.
Non-GAAP operating income: operating income plus deferred revenue that would have been recognized in the normal course of business by Online Resources if not for GAAP purchase accounting requirements and significant transaction related expenses. Non-GAAP operating income should be considered in addition to, rather than as a substitute for, operating income.
Adjusted EBITDA: net income plus income tax expense, net interest income (expense), net other income (expense), depreciation, amortization, and non-cash compensation, as well as deferred revenue that would have been recognized in the normal course of business by Online Resources if not for GAAP purchase accounting requirements and significant transaction related expenses. Adjusted EBITDA should be considered in addition to, rather than as a substitute for, operating income.
MEETS THE CHALLENGE OF CHANGE
Universal Payments 19
|
|
Non-GAAP Financial Measures
ACI is also presenting operating free cash flow, which is defined as net cash provided by operating activities, plus payments associated with acquired opening balance sheet liabilities, net after-tax payments associated with employee-related actions and facility closures, net after-tax payments associated with significant transaction related expenses and less capital expenditures. Operating free cash flow is considered a non-GAAP financial measure as defined by SEC Regulation G. We utilize this non-GAAP financial measure, and believe it is useful to investors, as an indicator of cash flow available for debt repayment and other investing activities, such as capital investments and acquisitions. We utilize operating free cash flow as a further indicator of operating performance and for planning investing activities. Operating free cash flow should be considered in addition to, rather than as a substitute for, net cash provided by operating activities. A limitation of operating free cash flow is that it does not represent the total increase or decrease in the cash balance for the period. This measure also does not exclude mandatory debt service obligations and, therefore, does not represent the residual cash flow available for discretionary expenditures. We believe that operating free cash flow is useful to investors to provide disclosures of our operating results on the same basis as that used by our management.
ACI also includes backlog estimates, which include all software license fees, maintenance fees and service fees specified in executed contracts, as well as revenues from assumed contract renewals to the extent that we believe recognition of the related revenue will occur within the corresponding backlog period. We have historically included assumed renewals in backlog estimates based upon automatic renewal provisions in the executed contract and our historic experience with customer renewal rates.
MEETS THE CHALLENGE OF CHANGE
Universal Payments 20
|
|
Non-GAAP Financial Measures
Backlog is considered a non-GAAP financial measure as defined by SEC Regulation G. Our 60-month backlog estimate represents expected revenues from existing customers using the following key assumptions:
Maintenance fees are assumed to exist for the duration of the license term for those contracts in which the committed maintenance term is less than the committed license term.
License, facilities management, and software hosting arrangements are assumed to renew at the end of their committed term at a rate consistent with our historical experiences.
Non-recurring license arrangements are assumed to renew as recurring revenue streams.
Foreign currency exchange rates are assumed to remain constant over the 60-month backlog period for those contracts stated in currencies other than the U.S. dollar.
Our pricing policies and practices are assumed to remain constant over the 60-month backlog period.
Estimates of future financial results are inherently unreliable. Our backlog estimates require substantial judgment and are based on a number of assumptions as described above. These assumptions may turn out to be inaccurate or wrong, including, but not limited to, reasons outside of management’s control. For example, our customers may attempt to renegotiate or terminate their contracts for a number of reasons, including mergers, changes in their financial condition, or general changes in economic conditions in the customer’s industry or geographic location, or we may experience delays in the development or delivery of products or services specified in customer contracts which may cause the actual renewal rates and amounts to differ from historical experiences. Changes in foreign currency exchange rates may also impact the amount of revenue actually recognized in future periods. Accordingly, there can be no assurance that contracts included in backlog estimates will actually generate the specified revenues or that the actual revenues will be generated within the corresponding 60-month period.
Backlog should be considered in addition to, rather than as a substitute for, reported revenue and deferred revenue.
MEETS THE CHALLENGE OF CHANGE
Universal Payments 21
|
|
Forward-Looking Statements
This presentation contains forward-looking statements based on current expectations that involve a number of risks and uncertainties. Generally, forward-looking statements do not relate strictly to historical or current facts and may include words or phrases such as “believes,” “will,” “expects,” “anticipates,” “intends,” and words and phrases of similar impact. The forward-looking statements are made pursuant to safe harbor provisions of the Private Securities Litigation Reform Act of 1995.
Forward-looking statements in this presentation include, but are not limited to, statements regarding:
Strong market interest in Universal Payments validates strategy;
Expectations regarding 2015 financial guidance related to non-GAAP revenue, adjusted EBITDA;
Expectations regarding Q2 2015 non-GAAP revenue; and
Expectations regarding full year SNET
MEETS THE CHALLENGE OF CHANGE
Universal Payments 22
|
|
Forward-Looking Statements
All of the foregoing forward-looking statements are expressly qualified by the risk factors discussed in our filings with the Securities and Exchange Commission. Such factors include but are not limited to, increased competition, the performance of our strategic product, UP, BASE24-eps, demand for our products, restrictions and other financial covenants in our credit facility, consolidations and failures in the financial services industry, customer reluctance to switch to a new vendor, the accuracy of management’s backlog estimates, the maturity of certain products, our strategy to migrate customers to our next generation products, ratable or deferred recognition of certain revenue associated with customer migrations and the maturity of certain of our products, failure to obtain renewals of customer contracts or to obtain such renewals on favorable terms, delay or cancellation of customer projects or inaccurate project completion estimates, volatility and disruption of the capital and credit markets and adverse changes in the global economy, our existing levels of debt, impairment of our goodwill or intangible assets, litigation, future acquisitions, strategic partnerships and investments, risks related to the expected benefits to be achieved in the transaction with Retail Decisions, the complexity of our products and services and the risk that they may contain hidden defects or be subjected to security breaches or viruses, compliance of our products with applicable legislation, governmental regulations and industry standards, our compliance with privacy regulations, the protection of our intellectual property in intellectual property litigation, the cyclical nature of our revenue and earnings and the accuracy of forecasts due to the concentration of revenue generating activity during the final weeks of each quarter, business interruptions or failure of our information technology and communication systems, our offshore software development activities, risks from operating internationally, including fluctuations in currency exchange rates, exposure to unknown tax liabilities, and volatility in our stock price. For a detailed discussion of these risk factors, parties that are relying on the forward-looking statements should review our filings with the Securities and Exchange Commission, including our most recently filed Annual Report on Form 10-K.
MEETS THE CHALLENGE OF CHANGE
Universal Payments 23
|
|

Universal Payments