Attached files
| file | filename |
|---|---|
| 8-K - FORM 8-K - SB ONE BANCORP | v408665_8k.htm |
Exhibit 99.1

Annual Meeting April 29 th , 2015
2 FORWARD - LOOKING STATEMENT This confidential presentation, and the oral presentation that supplements it, have been developed by Sussex Bancorp (“Sussex” or the “Company”), were prepared exclusively for the benefit and internal use of the recipient and are not an offer or the solicitation of an offer to buy securities. Neither this presentation, nor the oral presentation that supplements it, nor any of their contents, may be used, reproduced, disseminated, quoted or referred to for any other purpose, in whole or in part, without the prior written consent of the Company. Some of the statements contained in this presentation are “forward - looking statements” within the meaning of Section 27A of the Securities Act of 1933, as amended, and Section 21E of the Securities Exchange Act of 1934, as amended. When used in this presentation, words such as “may,” “plan,” “contemplate,” “anticipate,” “believe,” “intend,” “continue,” “expect,” “project,” “predict,” “estimate,” “target,” “could,” “is likely,” “should,” “would,” “will,” or similar expressions are intended to identify “forward - looking statements” within the meaning of the Private Securities Litigation Reform Act of 1995. You are cautioned not to place undue reliance on any forward - looking statements, which speak only as of the date made. These statements may relate to the Company’s future financial performance, strategic plans or objectives, revenue, expense or earnings projections, or other financial items. By their nature, these statements are subject to numerous uncertainties that could cause actual results to differ materially from those anticipated in the statements. Factors that could cause actual results to differ materially from the results anticipated or projected include, but are not limited to, the following: ( i ) competition in the industry and markets in which the Company operates; (ii) levels of non - performing assets; (iii) changes in general interest rates; (iv) loan demand; (v) rapid changes in technology affecting the financial services industry; (vi) real estate values; (vii) changes in government regulation; and (viii) general economic and business conditions.

Welcome Edward J. Leppert − Chairman of the Board Anthony Labozzetta − President and Chief Executive Officer Steven Fusco − SEVP and Chief Financial Officer 3
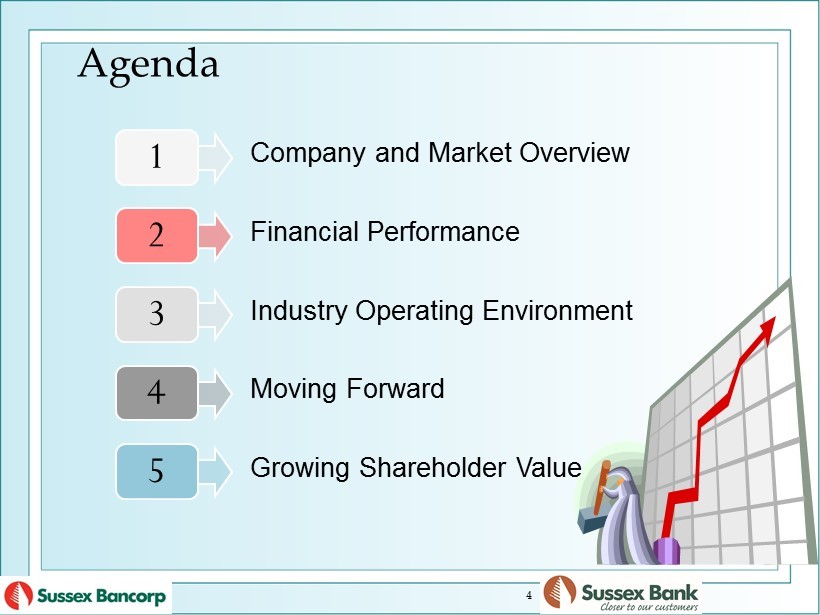
Agenda 1 2 3 4 Financial Performance Industry Operating Environment Moving Forward 5 Growing Shareholder Value Company and Market Overview 4

1. Company and Market Overview
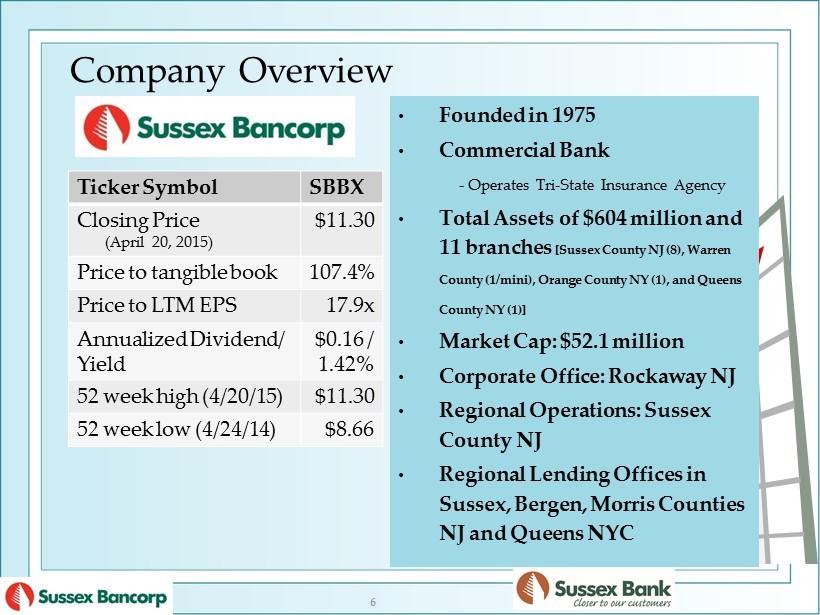
Ticker Symbol SBBX Closing Price (April 20, 2015) $11.30 Price to tangible book 107.4% Price to LTM EPS 17.9x Annualized Dividend/ Yield $0.16 / 1.42% 52 week high (4/20/15) $11.30 52 week low (4/24/14) $8.66 • Founded in 1975 • Commercial Bank - Operates Tri - State Insurance Agency • Total Assets of $604 million and 11 branches [Sussex County NJ (8), Warren County (1/mini), Orange County NY (1), and Queens County NY (1)] • Market Cap: $52.1 million • Corporate Office: Rockaway NJ • Regional Operations: Sussex County NJ • Regional Lending Offices in Sussex, Bergen, Morris Counties NJ and Queens NYC Company Overview 6
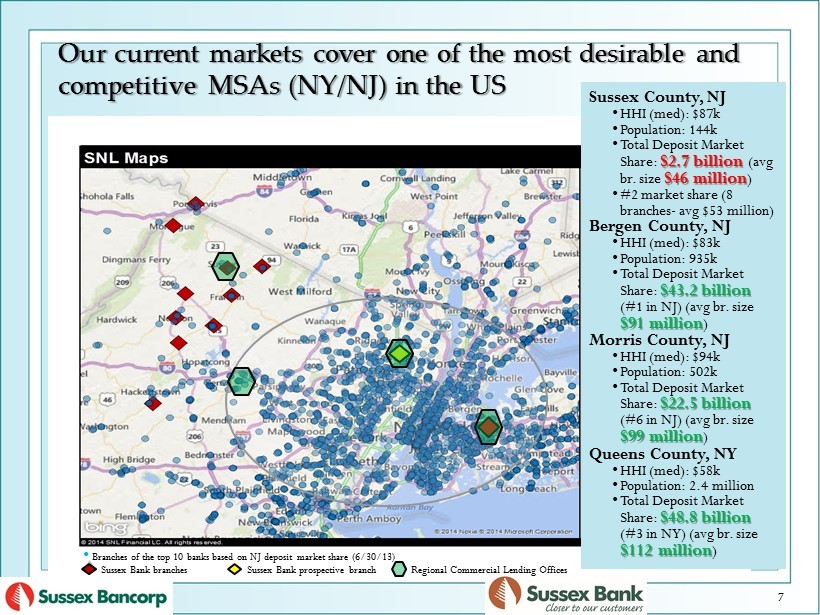
Our current markets cover one of the most desirable and competitive MSAs (NY/NJ) in the US 7 Sussex County, NJ • HHI (med): $ 87k • Population: 144k • Total Deposit Market Share: $ 2.7 billion ( avg br. size $ 46 million ) • #2 market share (8 branches - avg $ 53 million) Bergen County, NJ • HHI (med): $ 83k • Population: 935k • Total Deposit Market Share: $ 43.2 billion (#1 in NJ) ( avg br. size $91 million ) Morris County , NJ • HHI (med): $94k • Population: 502k • Total Deposit Market Share: $22.5 billion (#6 in NJ) ( avg br. size $99 million ) Queens County, NY • HHI (med): $58k • Population: 2.4 million • Total Deposit Market Share: $48.8 billion (#3 in NY) ( avg br. size $112 million ) • Branches of the top 10 banks based on NJ deposit market share (6/30/13) Sussex Bank branches Sussex Bank prospective branch Regional Commercial Lending Offices
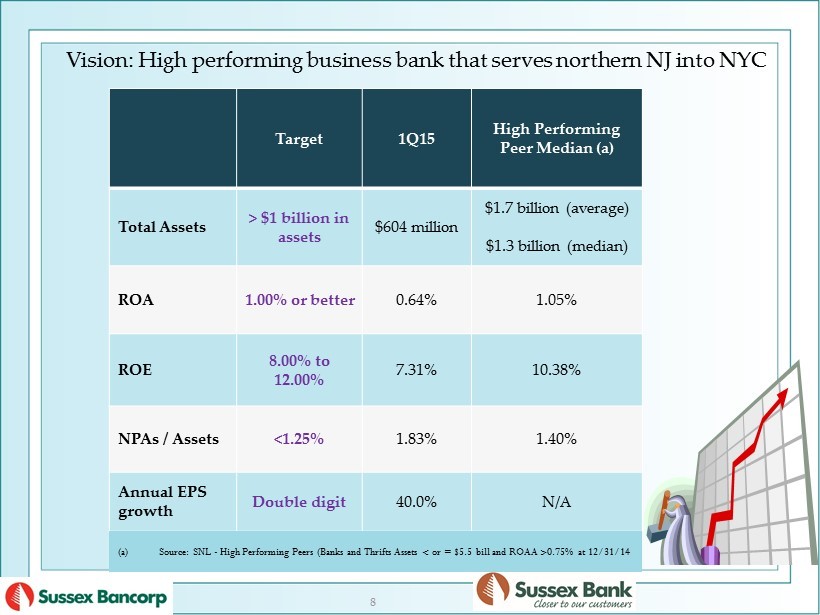
Vision: High performing business bank that serves northern NJ into NYC Target 1Q15 High Performing Peer Median (a) Total Assets > $1 billion in assets $604 million $1.7 billion (average) $1.3 billion (median) ROA 1.00% or better 0.64% 1.05% ROE 8.00% to 12.00% 7.31% 10.38% NPAs / Assets <1.25% 1.83% 1.40% Annual EPS growth Double digit 40.0% N/A (a) Source: SNL - High Performing Peers (Banks and Thrifts Assets < or = $5.5 bill and ROAA >0.75% at 12/31/14 8
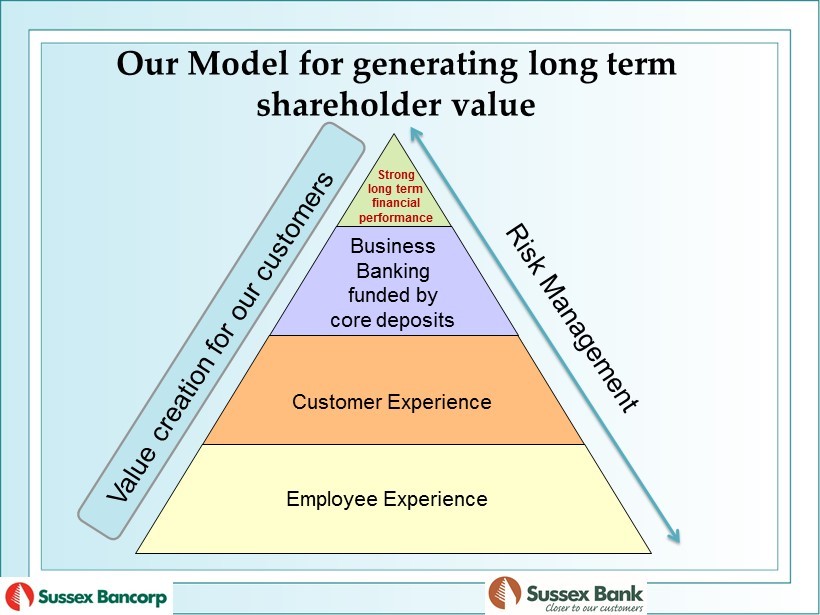
Employee Experience Customer Experience Business Banking funded by core deposits Strong long term financial performance 9 Our Model for generating long term shareholder value
2. Financial Performance
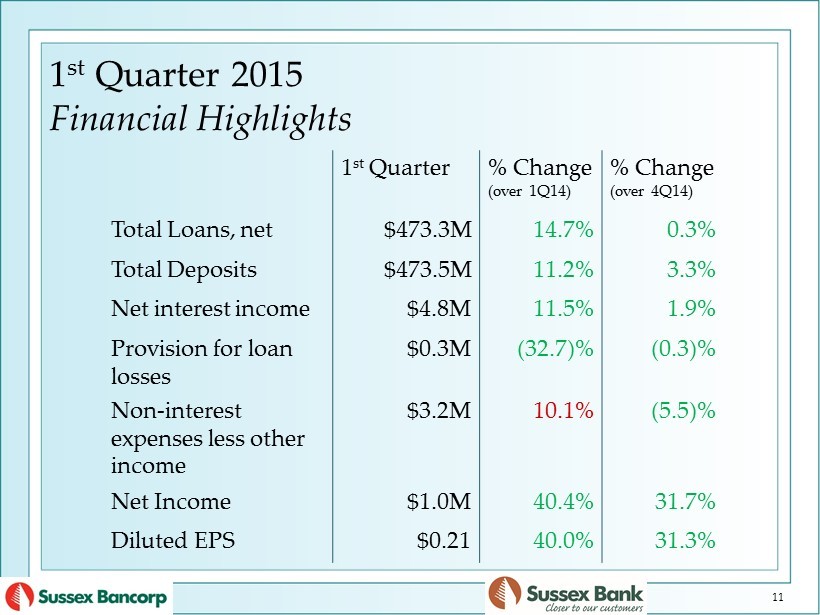
1 st Quarter 2015 Financial Highlights 1 st Quarter % Change (over 1Q14) % Change (over 4Q14) Total Loans, net $473.3M 14.7% 0.3% Total Deposits $473.5M 11.2% 3.3% Net interest income $4.8M 11.5% 1.9% Provision for loan losses $0.3M (32.7)% (0.3)% Non - interest expenses less other income $3.2M 10.1% (5.5)% Net Income $1.0M 40.4% 31.7% Diluted EPS $0.21 40.0% 31.3% 11
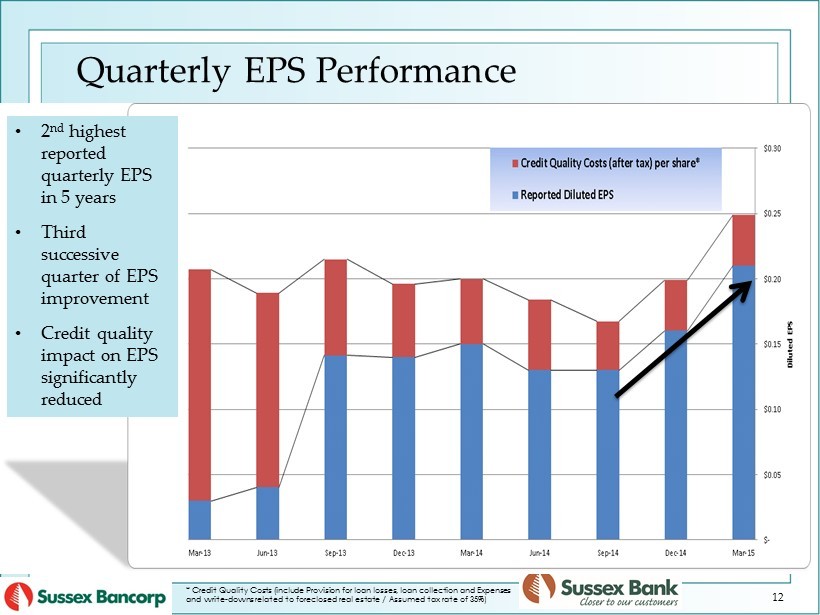
Quarterly EPS Performance • 2 nd highest reported quarterly EPS in 5 years • Third successive quarter of EPS improvement • Credit quality impact on EPS significantly reduced * Credit Quality Costs (include Provision for loan losses, loan collection and Expenses and write - downs related to foreclosed real estate / Assumed tax rate of 35%) 12
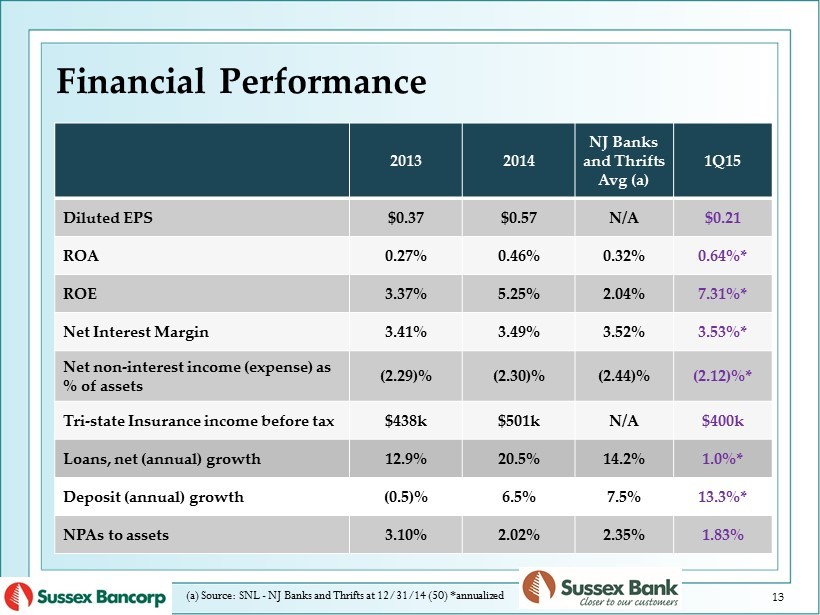
2013 2014 NJ Banks and Thrifts Avg (a) 1Q15 Diluted EPS $0.37 $0.57 N/A $0.21 ROA 0.27% 0.46% 0.32% 0.64%* ROE 3.37% 5.25% 2.04% 7.31%* Net Interest Margin 3.41% 3.49% 3.52% 3.53%* Net non - interest income (expense) as % of assets (2.29)% (2.30)% (2.44)% (2.12)%* Tri - state Insurance income before tax $438k $501k N/A $400k Loans, net (annual) growth 12.9% 20.5% 14.2% 1.0%* Deposit (annual) growth (0.5)% 6.5% 7.5% 13.3%* NPAs to assets 3.10% 2.02% 2.35% 1.83% Financial Performance 13 (a) Source : SNL - NJ Banks and Thrifts at 12/31/14 (50) *annualized
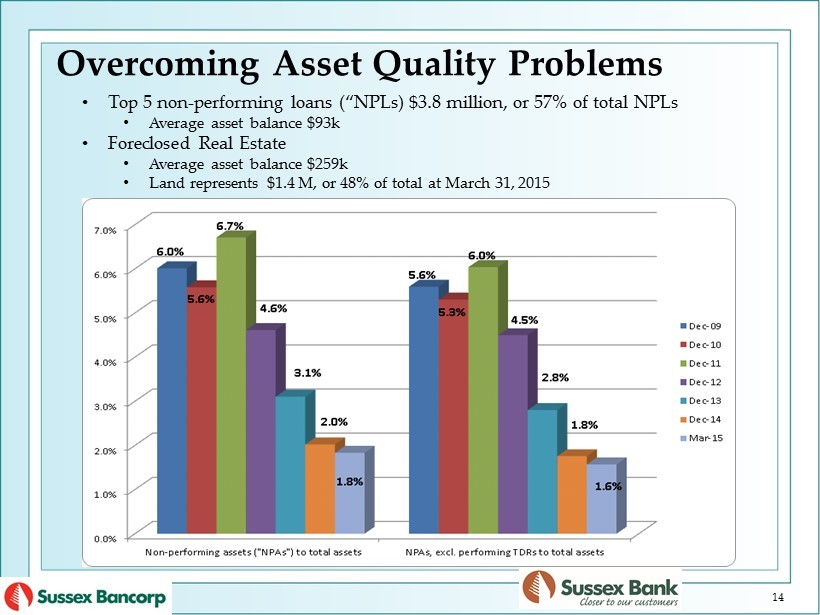
Overcoming Asset Quality Problems • Top 5 non - performing loans (“NPLs) $3.8 million, or 57% of total NPLs • Average asset balance $93k • Foreclosed Real Estate • Average asset balance $259k • Land represents $1.4 M, or 48% of total at March 31, 2015 14
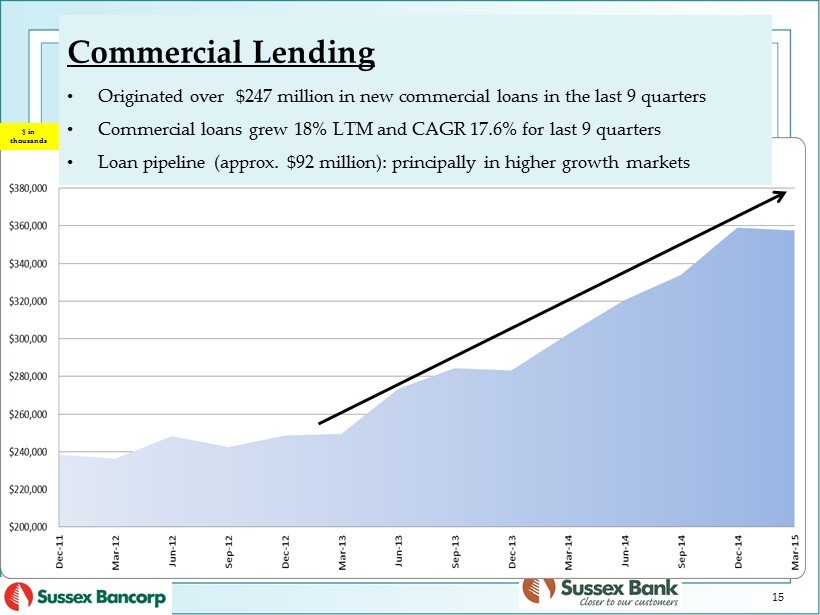
Commercial Lending • Originated over $247 million in new commercial loans in the last 9 quarters • Commercial loans grew 18% LTM and CAGR 17.6% for last 9 quarters • Loan pipeline (approx. $92 million): principally in higher growth markets $ in thousands 15
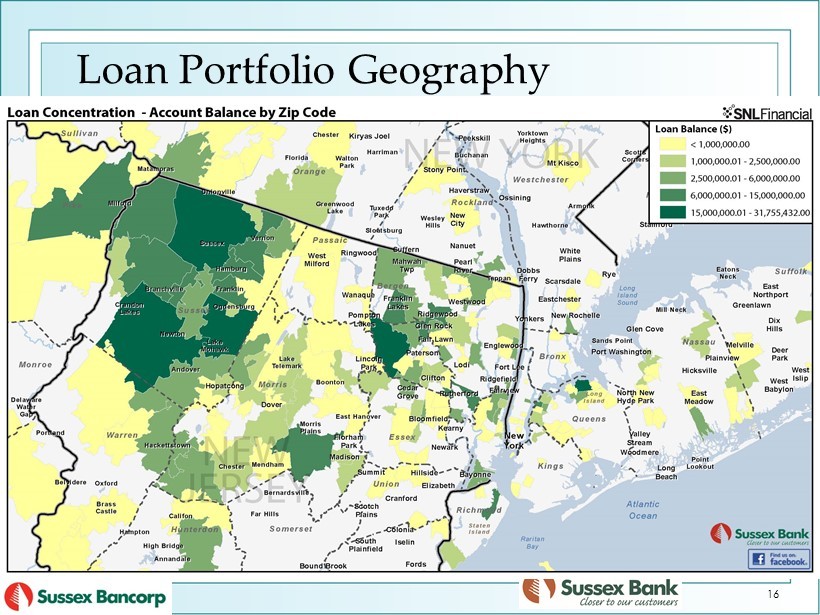
Loan Portfolio Geography 16

• Total deposits are up 28% (CAGR 4.8%) • Shift in mix (non - interest bearing up 125% CAGR 17%) Deposits 17

3 . Industry Operating Environment
Industry Operating Environment • Net interest margin pressures − Duration of low interest rate environment impact on assets • Increasing probability of flattening yield curve − 2008 through present - many banks have increased their exposure in long term assets − Possible deposit disintermediation in a rising rate environment • Commercial Loan Competition − Brokers, Converted Mutuals , Non - banks, etc. − Credit risk (i.e. structure, terms, pricing, etc.) • Regulatory and compliance requirements − Always changing (most recently Basel III implementation ) • Customer preferences / expectation changes − Technology changed the way we live and transact − Traditional bank / branch delivery channels [Defects] • Technology / Cybersecurity 19
• Opportunities arise from challenges • These are exciting times for us • Patience, resilience and discipline Industry Operating Environment 20

4. Moving Forward
Path to > 1% ROA 1. Grow our business / Leverage capital − Expand into markets that support long - term growth objectives • De - novo branching centered around commercial lending teams • Our Astoria branch − Approx. 1,200 sf, technology driven − New staffing model − Projected breakeven in 18 months - anticipating $25 million in deposits within 9 months − Approx. 30 days since opening • Total deposits of $9.5 million (68% core deposits/non - CDs ) with an overall cost of funds of 0.63% • New projected breakeven is 15 months • Continue de - novo branching into Bergen, Morris, Hudson counties in NJ and NYC • Target existing markets within Sussex County 22
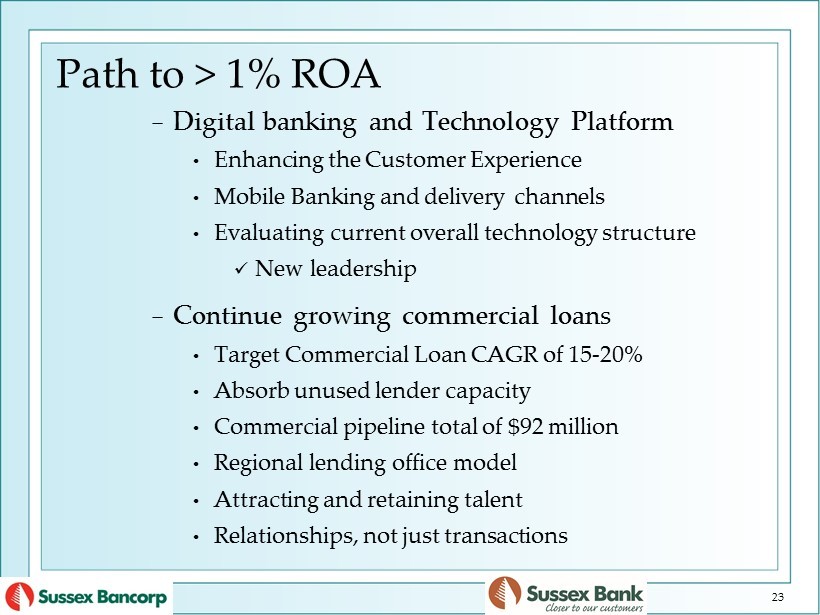
Path to > 1% ROA − Digital banking and Technology Platform • Enhancing the Customer Experience • Mobile Banking and delivery channels • Evaluating current overall technology structure x New leadership − Continue growing commercial loans • Target Commercial Loan CAGR of 15 - 20% • Absorb unused lender capacity • Commercial pipeline total of $92 million • Regional lending office model • Attracting and retaining talent • Relationships, not just transactions 23
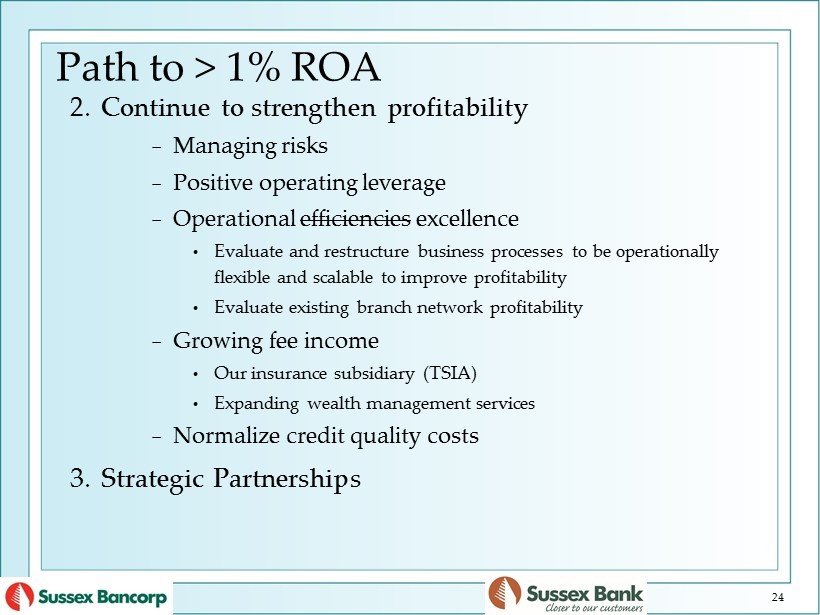
Path to > 1% ROA 2. Continue to strengthen profitability − Managing risks − Positive operating leverage − Operational efficiencies excellence • Evaluate and restructure business processes to be operationally flexible and scalable to improve profitability • Evaluate existing branch network profitability − Growing fee income • Our insurance subsidiary (TSIA) • Expanding wealth management services − Normalize credit quality costs 3. Strategic Partnerships 24

5 . Growing Shareholder Value
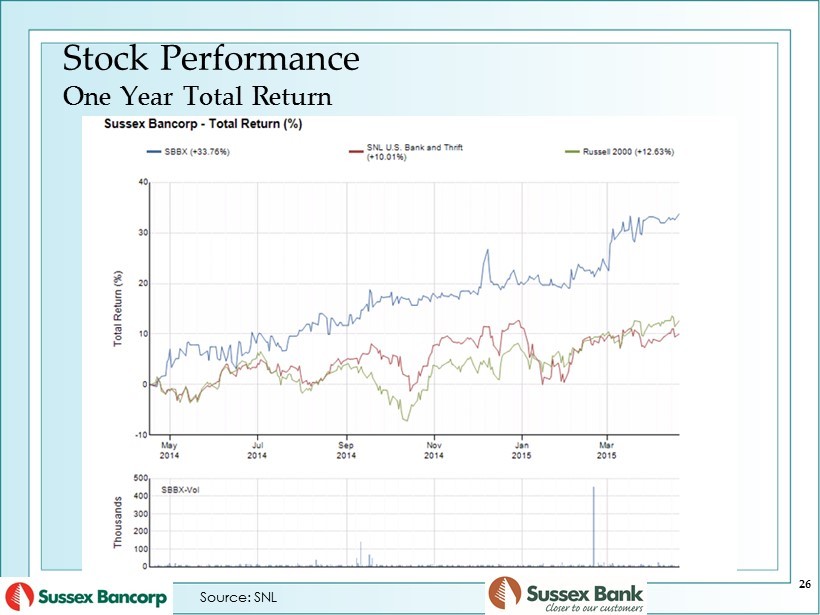
Stock Performance One Year Total Return 26 Source: SNL
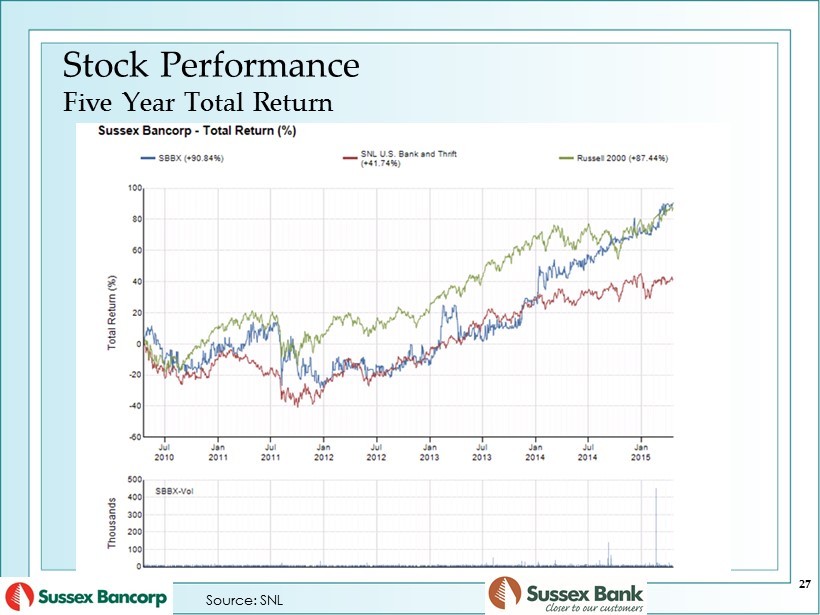
27 Source: SNL Stock Performance Five Year Total Return
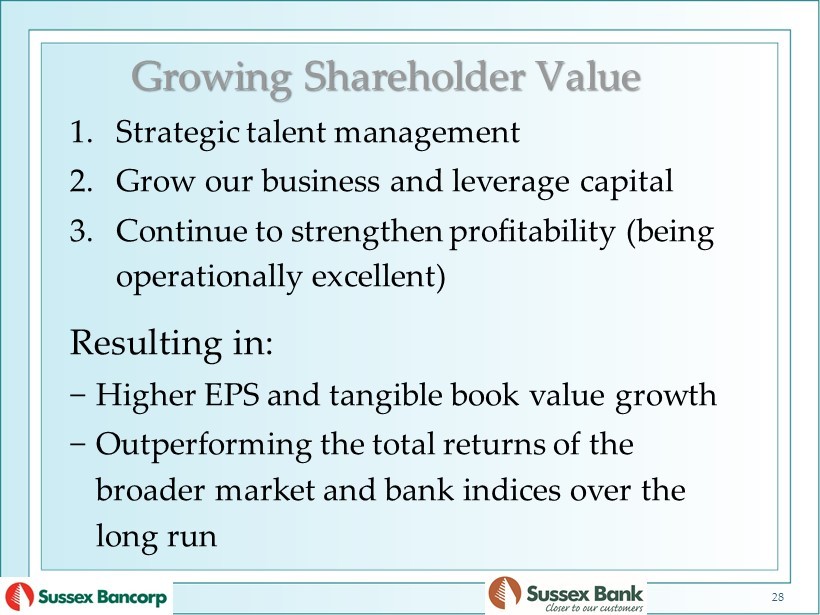
Growing Shareholder Value 1. Strategic talent management 2. Grow our business and leverage capital 3. Continue to strengthen profitability (being operationally excellent) Resulting in: − Higher EPS and tangible book value growth − Outperforming the total returns of the broader market and bank indices over the long run 28

Annual Meeting April 29 th , 2015 Recap and Questions?