Attached files
| file | filename |
|---|---|
| 8-K - 8-K ANNUAL MEETING - ORRSTOWN FINANCIAL SERVICES INC | a8-kannualmeeting.htm |

Annual Shareholder Meeting April 28, 2015 Exhibit 99

Forward Looking Statement 2 Certain statements we may make today may constitute “forward looking statements” under the Private Securities Litigation Reform Act of 1995. Orrstown Financial’s actual results may differ significantly from the results discussed in such forward-looking statements. Factors that might cause such a difference include, but are not limited to, economic conditions, competition in the geographic and business areas in which Orrstown Financial conducts its operations, fluctuations in interest rates, credit quality, government regulation and other risks and uncertainties, including those described in the Company’s filings with the Securities and Exchange Commission. The statements we make today are valid only as of today’s date and we disclaim any obligation to update this information.
Rules of Conduct 3 In the interest of an orderly Meeting of the Shareholders of Orrstown Financial Services, Inc. (the “Company”), we ask you to honor the following rules of procedure: Shareholders should not address the Meeting until recognized by the Chairman of the Meeting. Upon recognition by the Chairman, the shareholder will have the floor. Speakers should then state their name and status as a shareholder. We ask that shareholders approach the microphone at the front of the theater. The business of the Meeting will be taken up as set forth in the Agenda. When an item on the Agenda is before the Meeting for consideration, questions and comments should be confined solely to that item. Questions or comments not related to an Agenda item will not be entertained at the Meeting. If there are any matters of individual concern to a shareholder, they should be raised after the Meeting with representatives of the Company.

Rules of Conduct 4 Shareholders should confine comments to one subject at a time in order to give other shareholders an opportunity to speak on that subject. Please permit the speaker to conclude his or her remarks without interruption. A shareholder will be permitted up to two minutes to address the Meeting when recognized by the Chairman. Derogatory references to personalities or comments that are otherwise in bad taste or any outbursts of demonstration will not be permitted and will be a basis for removal from the Meeting. No cameras or other recording devices will be permitted at the Meeting. All cell phones, pagers and other electronic communication devices must be turned off.

Rules of Conduct 5 The views, constructive comments and criticisms of the shareholders are welcome, but the purpose of the Meeting will be observed. The Chairman will stop discussions that are: Irrelevant to the matter under consideration, Proposals related to the conduct of the Company’s ordinary business operations, Derogatory or inflammatory, Related to customers of Orrstown Bank, or In substance repetitious statements made by other persons.

Agenda 6 Conduct Meeting Business Management Report Questions from our Shareholders Adjournment

Joel R. Zullinger, Chairman of the Board April 28, 2015 Call to Order

Joel R. Zullinger, Chairman of the Board April 28, 2015 Conduct Meeting Business

Thomas R. Quinn, Jr. President & CEO 9 Management Report
Management Report 10 2014: High-level summary of performance Report card on last year’s objectives David Boyle, our CFO, will review the financial results Ben Wallace, EVP of Operations and Technology, will highlight how we are leveraging technology I’ll make some closing remarks looking ahead to 2015

2014: Summary of Performance 11 Significant regulatory progress in 2014 resulted in 4/2/2015 release from all enforcement actions Continued momentum in 2014 Pre-tax income totaled $13.0 million, a 33% increase Improved net interest margin of 3.20% in 2014 vs. 3.03% in 2013 Loan growth of 5.1% Orrstown Financial Advisors over $1 billion in total assets under management and record revenue of $6.8 million Solid Asset Quality Y/E 2013 Y/E 2014 Total nonperforming assets to assets 1.73% 1.29% Total risk assets* decreased 37.5% $26.3 million $16.5 million Allowance for loan losses (ALLL) to total loans 3.12% 2.09% *Risk assets are defined as nonaccrual loans, restructured loans, loans past due 90 days or more and still accruing, and real estate owned
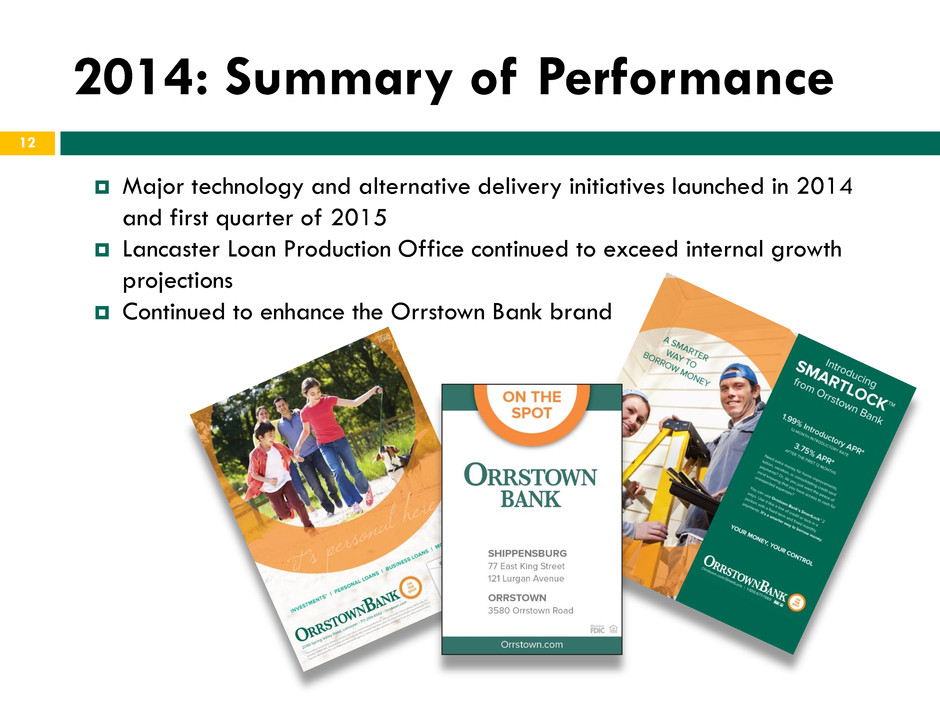
2014: Summary of Performance 12 Major technology and alternative delivery initiatives launched in 2014 and first quarter of 2015 Lancaster Loan Production Office continued to exceed internal growth projections Continued to enhance the Orrstown Bank brand

Update of Last Year’s Objectives 13 Last year we told you our goals were to: Continue to work with our Primary Regulators to remediate remaining matters Build a diversified and growing balance sheet Focus on revenue growth Leverage data and technology

Update of Last Year’s Objectives (continued) 14 Last year we told you our goals were to: Enhance our retail franchise through: Developing delivery channels Simplifying product line Focusing on fee income generation Obtaining a greater share of our customers’ business Improve our efficiency ratio Restore dividends just as soon as we were able

Remediate Remaining Regulatory Matters 15 Date Actions March 22, 2012 Bank and Company placed under formal enforcement actions by the Pennsylvania Department of Banking & Securities (“PADOB”) and the Federal Reserve Bank of Philadelphia (“FRB”) April 21, 2014 PADOB terminates formal enforcement and replaces with an informal MOU February 6, 2015 PADOB removes informal MOU, thereby terminating all enforcement actions with the PADOB April 2, 2015 FRB terminates formal agreement, thereby terminating all enforcement actions with FRB The Bank and Company have successfully resolved all outstanding regulatory issues

Build and Diversify our Balance Sheet 16 Established loan growth momentum in second half of 2014 (grew 5.1% for the year) Continued to increase core funding and reduce reliance on higher cost brokered deposits Successfully employed total-rate-of-return investment portfolio strategy Continued to build capital levels through retained earnings

Focus on Revenue Growth 17 2014 revenue challenges: Mortgage refinance slowdown Loan growth tempered by pushing out of certain higher yielding commercial loans Despite those challenges: Interest income grew 2.92% in 2014 while interest expenses declined 17.00% Net interest margin improved from 3.03% to 3.20% Grew the loan book 5.1%

18 We made significant investments in 2013-2014 in e-delivery channels, website, mobile applications, customer intelligence, core infrastructure capacity and hardening against cyber security threats We leveraged our technology spend and enhanced data to attract new customers and deepen our relationships with existing customers We mined customer and staff data to produce enhanced real- time analytics about each line of business Leverage Data and Technology

Enhance our retail franchise 19 We enhanced face to face interactions through needs-based sales approach supported by enhanced sales MIS data We measure and monitor key metrics such as sales activities, products per household, next likely product/service, etc. Explore growth opportunities, particularly in regions supported by favorable demographics

Improve our Efficiency Ratio 20 Efficiency ratio remains too high (83.0% at year end) Need to grow balance sheet and related interest income Strong focus on non-interest income sources Leverage technology investments of 2013 and 2014 Eliminate embedded regulatory costs Continued expense reduction focus in 2015

Restore dividends as soon as we were able 21 We were pleased to restore a dividend of $0.07/share* We also continued our longstanding tradition of giving back to the communities we serve: The Orrstown Bank Foundation surpassed 100 students and $100,000 in total scholarship awards in 2014 $147,000 donated in 2015 through the Commonwealth of Pennsylvania’s Educational Improvement Tax Credit Program Over $340,000 in total giving in 2014 Countless hours of volunteer service by the employees of Orrstown Bank Launched significant internship program with Shippensburg University *Payable on May 21, 2015 to shareholders of record as of May 8, 2015
David P. Boyle EVP/Chief Financial Officer 22 Summary Financial Review

2014: Financial Recap 23 Dollars in 000s (For the year ended) Balance Sheet 2014 2013 2012 Assets $1,190,443 1,177,812$ 1,232,668$ Loans 704,956 671,037 703,739 Deposits 949,704 1,000,390 1,085,039 Total shareholders equity 127,265 91,439 87,694 Trust AUM*- Market Value 1,017,013 1,085,216 992,378 Summary of Operations Net Interest Income 34,024 32,087 37,888 Non Interest Income 18,854 17,808 23,262 Non interest Expense 43,768 43,247 43,349 Net Income (Loss) 29,142 10,004 (38,454) Return on Average Equity 28.78% 11.30% (35.22%) Return on Average Assets 2.48% 0.84% (2.84%) Per Common Share Net Income (Loss) 3.59 1.24 (4.77) Book Value 15.40 11.28 10.85 Asset Quality Ratios Total Nonperforming assets to assets 1.29% 1.73% 1.61% Total risk assets to total assets 1.38% 2.23% 1.86% Allowance for loan losses to total loans 2.09% 3.12% 3.29% *Assets Under Management
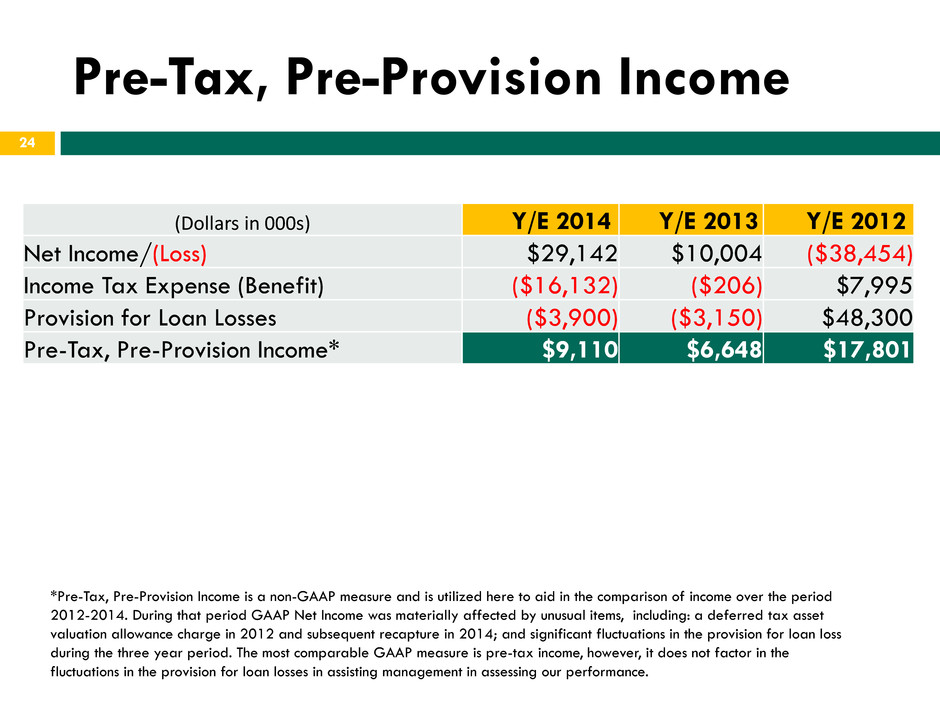
Pre-Tax, Pre-Provision Income 24 (Dollars in 000s) Y/E 2014 Y/E 2013 Y/E 2012 Net Income/(Loss) $29,142 $10,004 ($38,454) Income Tax Expense (Benefit) ($16,132) ($206) $7,995 Provision for Loan Losses ($3,900) ($3,150) $48,300 Pre-Tax, Pre-Provision Income* $9,110 $6,648 $17,801 *Pre-Tax, Pre-Provision Income is a non-GAAP measure and is utilized here to aid in the comparison of income over the period 2012-2014. During that period GAAP Net Income was materially affected by unusual items, including: a deferred tax asset valuation allowance charge in 2012 and subsequent recapture in 2014; and significant fluctuations in the provision for loan loss during the three year period. The most comparable GAAP measure is pre-tax income, however, it does not factor in the fluctuations in the provision for loan losses in assisting management in assessing our performance.
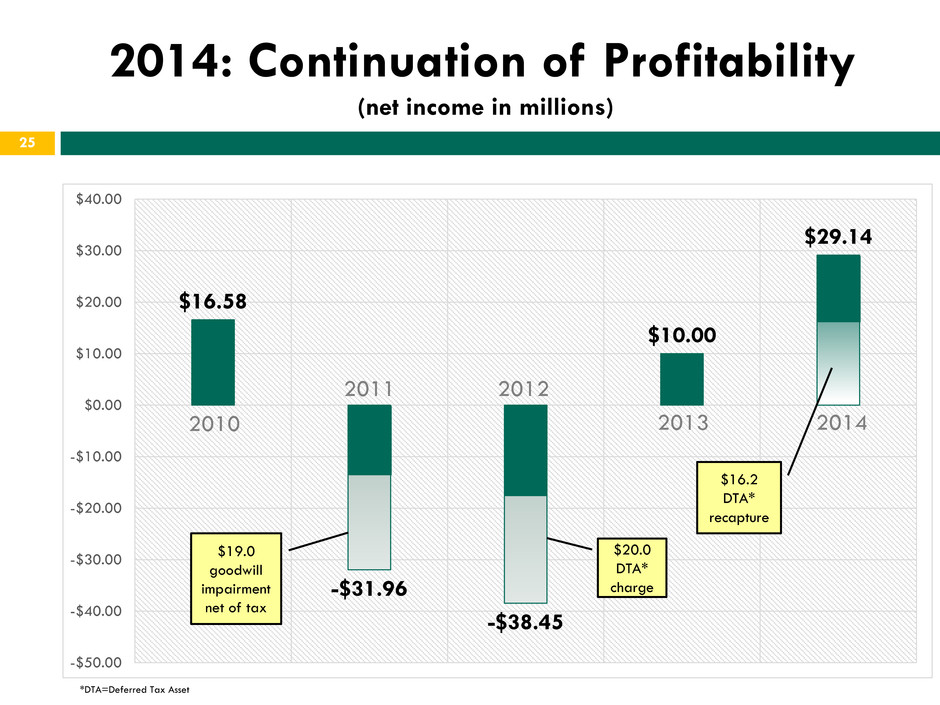
25 2014: Continuation of Profitability (net income in millions) $16.58 -$31.96 -$38.45 $10.00 $29.14 -$50.00 -$40.00 -$30.00 -$20.00 -$10.00 $0.00 $10.00 $20.00 $30.00 $40.00 2010 2011 2012 2013 2014 $19.0 goodwill impairment net of tax $20.0 DTA* charge $16.2 DTA* recapture *DTA=Deferred Tax Asset

5 Quarter View 26 (dollars in 000s) 2014 2015 Q1 Q2 Q3 Q4 Q1 Total Assets $1,198,017 $1,167,308 $1,183,392 1,190,443 1,189,420 Loans 673,282 678,854 680,374 704,946 727,753 Total Deposits 1,002,405 981,705 989,234 949,704 945,756 Total Interest Income 9,601 9,585 9,477 9,520 9,228 Total Interest Expense 1,085 1,085 1,030 959 913 Net Interest Income 8,516 8,500 8,447 8,561 8,316 Non Interest Income 4,438 5,138 4,752 4,526 5,368 Non Interest Expense 10,976 10,765 10,898 11,129 10,506
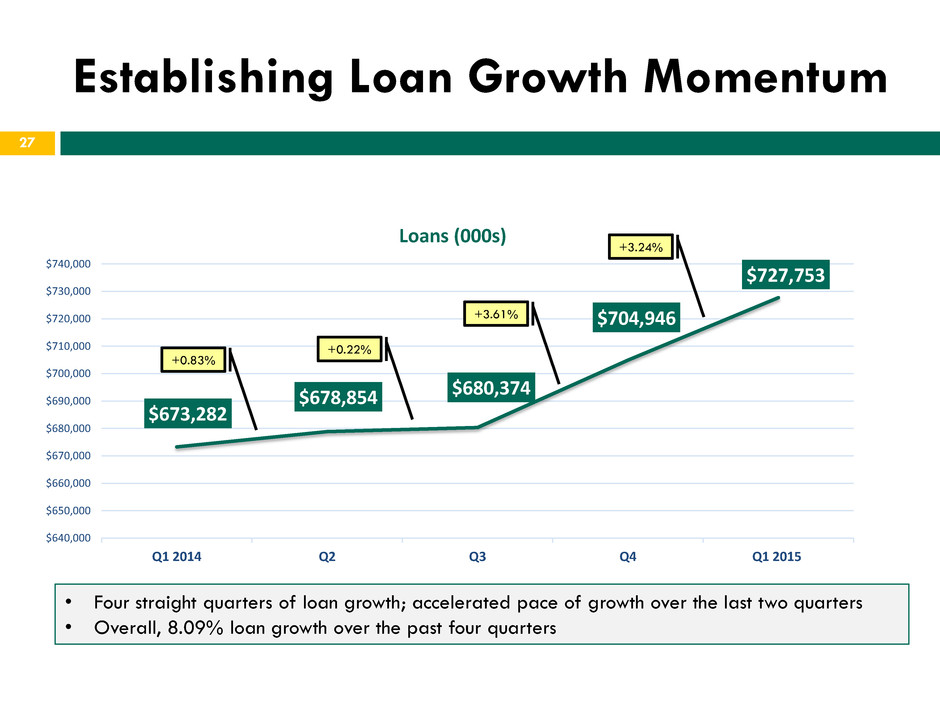
Establishing Loan Growth Momentum 27 2014 2015 • Four straight quarters of loan growth; accelerated pace of growth over the last two quarters • Overall, 8.09% loan growth over the past four quarters $673,282 $678,854 $680,374 $704,946 $727,753 $640,000 $650,000 $660,000 $670,000 $680,000 $690,000 $700,000 $710,000 $720,000 $730,000 $740,000 Q1 2014 Q2 Q3 Q4 Q1 2015 Loans (000s) +0.83% +0.22% +3.61% +3.24%

Disciplined Expense Control 28 $41.03 $43.35 $43.25 $43.77 $30.00 $32.00 $34.00 $36.00 $38.00 $40.00 $42.00 $44.00 $46.00 Total Non-Interest Expense (in millions) * *Excludes $19.5 MM Goodwill impairment charge 2011 2012 2013 2014

Capital Preservation and Balance Sheet Impact 29 Company grew capital without shareholder dilution 2010 2011 2012 2013 2014 Y/E Assets (000s) $1,511,722 $1,444,097 $1,232,688 $1,177,812 $1,190,443 Tier 1 Regulatory Capital $139,623 $121,249 $84,999 $95,741 $110,750 8% Capital Baseline $120,938 $115,528 $98,615 $94,225 $95,235 Capital Excess/(Shortfall) $18,685 $5,721 ($13,616) $1,516 $15,515

Well Capitalized 30 6.82% [VALUE] [VALUE] 8.14% 13.70% 14.97% 9.53% 15.58% 16.84% 0.00% 2.00% 4.00% 6.00% 8.00% 10.00% 12.00% 14.00% 16.00% 18.00% TIER 1 LEVERAGE RATIO TIER 1 RISK-BASED RATIO TOTAL RISK-BASED RATIO 2012 2013 2014
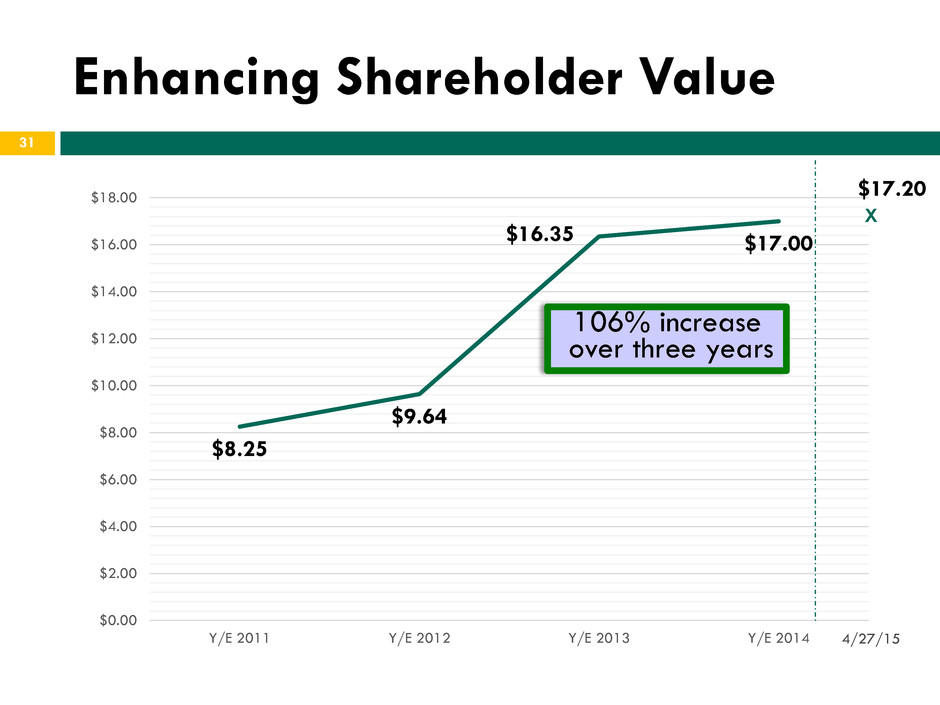
31 Enhancing Shareholder Value 70% increase in 2013 Y/E 2011 Y/E 2012 Y/E 2013 $8.25 $9.64 $16.35 $17.00 $0.00 $2.00 $4.00 $6.00 $8.00 $10.00 $12.00 $14.00 $16.00 $18.00 Y/E 2011 Y/E 2012 Y/E 2013 Y/E 2014 106% increase over three years 4/27/15 X $17.20

Highlights of Analysts’ View 32 Reported 1Q2015 Results: Reiterate Outperform Rating; Adjusting Estimates and Raising Target Price; “And They’re Off” Matthew Schultheis, CFA / Boenning & Scattergood (April 24, 2015)* *full report available at www.orrstown.com in the investor relations section

Benjamin W. Wallace EVP/Operations & Technology 33 Leveraging Technology Investments

2013-14: Significant Investments in Operations and Technology 34 Enhanced expertise throughout the Operations and Technology Groups Investments in hardware, software, and infrastructure Recognition of changing demographics and customer preferences and support for key revenue enhancing efforts Cybersecurity and Enterprise Risk Management focus

Industry-wide Customer Preferences are Changing 35 0 2000 4000 6000 8000 10000 12000 14000 Teller Transactions ‘92 ‘96 ‘02 ‘07 ‘13 46.6% decline in teller volume over the past two decades Average monthly volume of teller transactions at community banks and credit unions. Source: FMSI

Industry-wide Customer Preferences are Changing 36 1 9.3% 10.1% 17.5% 34.9% 28.2% ONLINE BANKING USAGE STATISTICS never twice a year monthly weekly daily 63% of customers utilize online banking on a daily or weekly basis (and over 8 in 10 customers use at least once a month) 1 37.7% 16.8% 17.2% 9.8% 18.5% MOBILE BANKING USAGE STATISTICS never twice a year monthly weekly daily Mobile banking usage (smartphones and tablets) is growing quickly. Almost 50% of customers use their mobile device to access banking information at least once a month Source: Capgemini Analysis, 2012; 2012 Retail Banking Voice of the Customer Survey As a result, fewer customers require face-to-face interaction to conduct their banking business

On-line Channel (Laptops and PCs) 37 Orrstown.com optimized as a sales revenue generating engine Critical delivery channel, particularly for new customer attraction and account growth More mature platform; 7.02% year-over-year growth

Mobile Banking: (Smartphones and Tablets) 38 62,600,000 163,900,000 209,700,000 U.S. Smartphone Ownership 2014 2017 2010 Opportunity in a rapidly growing market Orrstown.com was designed from the ground up with the mobile experience in mind 92.9% growth in mobile usage over the past 12 months; more than 7,200 customers utilize our mobile platforms We are now seeing 10% of our deposits come from mobile platform or ATM …It is still early days and we expect the growth trajectory will continue Smartphone ownership statistics from Pew Research and Statista; % of ownership indicates number of US adults (age 18 and older) using 2014 estimated population as baseline. Mobile usage growth statistics compare March 2014 to March 2015 data 25.6% 67.0% 85.7%

Leveraging our investments in 2015 39 Alternative delivery channel focus (web-site, mobile, telesales) Meeting changing customer preferences through unique product and service offerings (“relevancy through delivery channel choice”) Expand geographic markets and increase desirability among new demographic groups Lower the cost of funds to originate deposits, mortgages, and consumer loans In summary… match changing customer behaviors and meet increasing demand for alternative delivery channels

Cyber Security Remains Critical 40 Continue to be a regional and national leader in cyber defense

Thomas R. Quinn, Jr. President & Chief Executive Officer Closing Remarks/2015 Focus

Focus for 2015-Execute our Strategic Plan 42 Enterprise Risk Management Expense control and efficiency ratio Enhance shareholder value Organic loan growth Take advantage of market disruptions Leverage technology, smart data, and alternative delivery channels to attract new customers to Orrstown Bank Increase wallet share of existing customers Expansion into attractive markets (currently in process of converting limited purpose office in Lancaster to full- service financial center)
Questions from the Floor April 28, 2015

Joel R. Zullinger, Chairman of the Board April 28, 2015 Conduct Meeting Business

April 28, 2015 Thank You
