Attached files
| file | filename |
|---|---|
| 8-K - 8-K - GARMIN LTD | v408668_8k.htm |
 |
Exhibit 99.1 |
Garmin Reports Solid First Quarter 2015 Margins and Operating Results
Schaffhausen, Switzerland / April 29, 2015/ Business Wire
Garmin Ltd. (Nasdaq: GRMN – News) today announced results for the quarter ended March 28, 2015.
Highlights in the quarter include:
| · | Total revenue of $585 million in the first quarter of 2015 with fitness, outdoor, aviation and marine delivering 63% of total revenue and collectively growing 9% over the year ago quarter |
| · | The relative strength of the US Dollar compared to other major currencies negatively impacted revenue by approximately $38 million, or 7%, in the first quarter of 2015 |
| · | Gross margin improved from the prior year to 59% while operating margin remained strong at 19% |
| · | Pro forma EPS of $0.55 for first quarter 2015, consistent with the prior year |
| · | Launched vívofit™ 2, vívoactive™, and fēnix® 3, highlighting our continued commitment to a broad product portfolio in the rapidly growing wearables category |
| (in thousands, | 13-Weeks Ended | |||||||||||
| except per share data) | March 28, | March 29, | Yr over Yr | |||||||||
| 2015 | 2014 | Change | ||||||||||
| Net sales | $ | 585,394 | $ | 583,221 | 0 | % | ||||||
| Auto | 216,126 | 242,952 | -11 | % | ||||||||
| Fitness | 130,994 | 100,288 | 31 | % | ||||||||
| Outdoor | 75,915 | 83,985 | -10 | % | ||||||||
| Aviation | 98,062 | 95,994 | 2 | % | ||||||||
| Marine | 64,297 | 60,002 | 7 | % | ||||||||
| Gross profit % | 59 | % | 57 | % | ||||||||
| Operating profit % | 19 | % | 21 | % | ||||||||
| GAAP diluted EPS | $ | 0.35 | $ | 0.61 | -42 | % | ||||||
| Pro forma diluted EPS (1) | $ | 0.55 | $ | 0.55 | 0 | % | ||||||
| (1) | See attached tables for reconciliation of non GAAP measures including pro forma diluted EPS and free cash flow |
Executive Overview from Cliff Pemble, President and Chief Executive Officer:
“We were able to deliver solid operating results and consistent pro forma EPS in the first quarter despite the negative impact of a stronger US Dollar compared to other major currencies,” said Cliff Pemble, president and chief executive officer (CEO) of Garmin Ltd. “These results highlight our ability to capitalize on growth opportunities in the near-term while still investing in our market share position and long-term product roadmap through increased advertising and research and development expense. These investments are expected to generate ongoing growth potential in 2015 and future years.”
Fitness:
The fitness segment posted revenue growth of 31% in the quarter with contributions from activity trackers, our recently launched Forerunner® 920XT and our cycling products. Gross margin remained strong at 63% while operating margin declined to 26%, as we continued to invest in advertising and research and development to drive long-term growth opportunities. Additions to the vivo family, including vívofit 2 and vívoactive, began shipping late in the first quarter and we expect them to reach additional retail channels throughout the second quarter as the wearables opportunity continues to expand. In cycling, we recently announced Vector™ 2 and 2S – the latest pedal-based power meters - designed for easy installation and maintenance while delivering the most advanced cycling metrics. Our broad fitness portfolio has never been stronger, offering products for those just beginning their pursuit of an active lifestyle to elite athletes.
Outdoor:

The outdoor segment posted a revenue decline of 10% in the quarter, falling short of our expectations. Though revenue declined, gross and operating margins within the segment were strong at 66% and 31%, respectively. While outdoor started slowly in 2015, we do anticipate improvement in the second quarter as we are experiencing robust demand for the fēnix 3 and as we launch additional new products within the segment. In April, we announced the VIRB® X and XE which will begin to ship in the second quarter. The new VIRB action cameras focus on delivering a data-rich experience for the user with embedded sensors capturing speed, altitude, and many other metrics. The G-Metrix™ data is then seamlessly incorporated into the video utilizing our VIRB Edit software, which offers robust features and capabilities in an easy-to-use platform. This hardware and software combination, along with our enhanced mobile application featuring on-the-go mobile video creation, offer a superior user experience that we believe will help us gain momentum in the action camera market and further broaden our revenue base in the outdoor segment.
Aviation:
The aviation segment posted revenue growth of 2% in the first quarter of 2015 following a solid first quarter 2014, when revenue growth was 19% due primarily to new OEM programs. The gross margin in aviation was strong at 73% while operating margin declined to 27% due to growth in research and development to support future revenue opportunities. During the quarter, we continued to enhance our ADS-B offerings and now provide the most comprehensive line of solutions to meet pending modernization deadlines around the world. We believe this will drive improving growth in our aftermarket category. Throughout the remainder of 2015, we will be focused on final certifications with key OEM partners that represent significant market share gains in the business jet and helicopter markets.
Marine:
The marine segment posted revenue growth of 7% following significant growth of 19% in the first quarter of 2014. We expect growth to accelerate in the second quarter due to a strong backlog for recently introduced products that have proven popular with consumers. Gross margin improved year-over-year to 55% in the quarter with product mix shifting toward new products with less discounting and higher margin profiles. Operating margin also improved in the quarter generating operating income growth of 20%. We remain focused on innovation and product portfolio expansion that will generate market share gains and growing profits throughout 2015.
Auto:
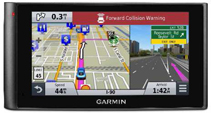
The auto segment posted a revenue decline of 11% as PND sales continued to decline and the contribution of amortization of previously deferred revenue fell as expected. Gross and operating margins in the quarter were 48% and 10%, respectively. The gross margin improvement over the prior year was primarily due to reduced discounting and lower cost of materials. We recently introduced the nüvicam™, the first PND with a built-in dash cam and advanced alerts including forward collision and lane departure to improve driver awareness. This advanced product highlights the ongoing innovation that we will deliver in both aftermarket and OEM applications.
Additional Financial Information:
Total operating expenses in the quarter were $232 million, a 10% increase from the prior year. Research and development investment increased 10% with growth primarily focused on aviation and active lifestyle products in fitness and outdoor. Advertising increased 13% as we continued to invest in point-of-sale presence with key retailers, which will produce long-term revenue results, and prepared for the launch of a spring wearables advertising campaign. Selling, general and administrative expense increased by 10% driven largely by legal related expenses.
The effective tax rate in the first quarter of 2015 was 12.3% compared to 16.6% in the prior year with comparable benefits in both years related to release of reserves. The year-over-year decrease in the effective tax rate is primarily due to the expected full year income mix at the end of first quarter of 2015 as compared to a less favorable expectation at the end of first quarter of 2014.
We continued to return cash to shareholders with our quarterly dividend of approximately $92 million and our share repurchase activity which totaled $16 million in the current quarter. We have $284 million remaining in the share repurchase program authorized through December 31, 2016. We ended the quarter with cash and marketable securities of approximately $2.7 billion.
As announced in February, the Board will recommend to the shareholders for approval at the annual meeting to be held on June 5, 2015 a cash dividend in the total amount of $2.04 per share (subject to possible adjustment based on the total amount of the dividend in Swiss Francs) payable in quarterly installments.
2015 Guidance:
We are maintaining the guidance issued in February of approximately $2.9 billion of revenue and approximately $3.10 of pro forma EPS as our performance thus far is consistent with our expectations.
Webcast Information/Forward-Looking Statements:
The information for Garmin Ltd.’s earnings call is as follows:
| When: | Wednesday, April 29, 2015 at 10:30 a.m. Eastern | |
| Where: | http://www.garmin.com/aboutGarmin/invRelations/irCalendar.html | |
| How: | Simply log on to the web at the address above or call to listen in at 855-757-3897 |
An archive of the live webcast will be available until June 24, 2015 on the Garmin website at www.garmin.com. To access the replay, click on the Investor Relations link and click over to the Events Calendar page.
This release includes projections and other forward-looking statements regarding Garmin Ltd. and its business. Any statements regarding the Company’s estimated earnings and revenue for fiscal 2015, the Company’s expected segment revenue growth rate, margins, new products to be introduced in 2015 and the Company’s plans and objectives are forward-looking statements. The forward-looking events and circumstances discussed in this release may not occur and actual results could differ materially as a result of risk factors affecting Garmin, including, but not limited to, the risk factors that are described in the Annual Report on Form 10-K for the year ended December 27, 2014 filed by Garmin with the Securities and Exchange Commission (Commission file number 0-31983). A copy of Garmin’s 2013 Form 10-K can be downloaded from http://www.garmin.com/aboutGarmin/invRelations/finReports.html.
Garmin, fēnix, Forerunner and VIRB are registered trademarks and vívofit, vívoactive, Vector and nüvicam are trademarks of Garmin Ltd. or its subsidiaries. All other brands, product names, company names, trademarks and service marks are the properties of their respective owners. All rights reserved.
| Investor Relations Contact: | Media Relations Contact: |
| Kerri Thurston | Ted Gartner |
| 913/397-8200 | 913/397-8200 |
| investor.relations@garmin.com | media.relations@garmin.com |
Garmin Ltd. And Subsidiaries
Condensed Consolidated Statements of Income (Unaudited)
(In thousands, except per share information)
| 13-Weeks Ended | ||||||||
| March 28, | March 29, | |||||||
| 2015 | 2014 | |||||||
| Net sales | $ | 585,394 | $ | 583,221 | ||||
| Cost of goods sold | 241,272 | 252,387 | ||||||
| Gross profit | 344,122 | 330,834 | ||||||
| Advertising expense | 27,672 | 24,428 | ||||||
| Selling, general and administrative expense | 98,750 | 89,873 | ||||||
| Research and development expense | 106,002 | 96,164 | ||||||
| Total operating expense | 232,424 | 210,465 | ||||||
| Operating income | 111,698 | 120,369 | ||||||
| Other income (expense): | ||||||||
| Interest income | 8,024 | 9,768 | ||||||
| Foreign currency gains (losses) | (44,264 | ) | 12,814 | |||||
| Other | 738 | (484 | ) | |||||
| Total other income (expense) | (35,502 | ) | 22,098 | |||||
| Income before income taxes | 76,196 | 142,467 | ||||||
| Income tax provision | 9,403 | 23,649 | ||||||
| Net income | $ | 66,793 | $ | 118,818 | ||||
| Net income per share: | ||||||||
| Basic | $ | 0.35 | $ | 0.61 | ||||
| Diluted | $ | 0.35 | $ | 0.61 | ||||
| Weighted average common shares outstanding: | ||||||||
| Basic | 191,762 | 195,090 | ||||||
| Diluted | 192,341 | 195,860 | ||||||
Part I - Financial Information
Item I - Condensed Consolidated Financial Statements
Garmin Ltd. And Subsidiaries
Condensed Consolidated Balance Sheets
(In thousands, except per share information)
| (Unaudited) | ||||||||
| March 28, | December 27, | |||||||
| 2015 | 2014 | |||||||
| Assets | ||||||||
| Current assets: | ||||||||
| Cash and cash equivalents | $ | 1,171,388 | $ | 1,196,268 | ||||
| Marketable securities | 270,212 | 167,989 | ||||||
| Accounts receivable, net | 425,650 | 570,191 | ||||||
| Inventories, net | 470,444 | 420,475 | ||||||
| Deferred income taxes | 56,165 | 56,102 | ||||||
| Deferred costs | 48,824 | 51,336 | ||||||
| Prepaid expenses and other current assets | 57,624 | 48,615 | ||||||
| Total current assets | 2,500,307 | 2,510,976 | ||||||
| Property and equipment, net | 436,104 | 430,887 | ||||||
| Marketable securities | 1,259,102 | 1,407,344 | ||||||
| Restricted cash | 313 | 308 | ||||||
| Noncurrent deferred income tax | 66,664 | 67,712 | ||||||
| Noncurrent deferred costs | 32,142 | 36,140 | ||||||
| Intangible assets, net | 224,381 | 218,083 | ||||||
| Other assets | 24,266 | 21,853 | ||||||
| Total assets | $ | 4,543,279 | $ | 4,693,303 | ||||
| Liabilities and Stockholders' Equity | ||||||||
| Current liabilities: | ||||||||
| Accounts payable | $ | 125,745 | $ | 149,094 | ||||
| Salaries and benefits payable | 63,775 | 62,764 | ||||||
| Accrued warranty costs | 23,866 | 27,609 | ||||||
| Accrued sales program costs | 37,049 | 58,934 | ||||||
| Deferred revenue | 185,899 | 203,598 | ||||||
| Accrued royalty costs | 5,811 | 51,889 | ||||||
| Accrued advertising expense | 17,190 | 26,334 | ||||||
| Other accrued expenses | 68,998 | 67,780 | ||||||
| Deferred income taxes | 13,370 | 17,673 | ||||||
| Income taxes payable | 190,594 | 182,260 | ||||||
| Dividend payable | 91,964 | 185,326 | ||||||
| Total current liabilities | 824,261 | 1,033,261 | ||||||
| Deferred income taxes | 39,448 | 39,497 | ||||||
| Non-current income taxes | 78,663 | 80,611 | ||||||
| Non-current deferred revenue | 121,906 | 135,130 | ||||||
| Other liabilities | 1,371 | 1,437 | ||||||
| Stockholders' equity: | ||||||||
| Shares, CHF 10 par value, 208,077 shares authorized and issued; 191,520 shares outstanding at March 28, 2015 and 191,815 shares outstanding at December 27, 2014 | 1,797,435 | 1,797,435 | ||||||
| Additional paid-in capital | 80,598 | 73,521 | ||||||
| Treasury stock | (345,143 | ) | (330,132 | ) | ||||
| Retained earnings | 1,928,165 | 1,859,972 | ||||||
| Accumulated other comprehensive income | 16,575 | 2,571 | ||||||
| Total stockholders' equity | 3,477,630 | 3,403,367 | ||||||
| Total liabilities and stockholders' equity | $ | 4,543,279 | $ | 4,693,303 | ||||
Garmin Ltd. And Subsidiaries
Condensed Consolidated Statements of Cash Flows (Unaudited)
(In thousands)
| 13-Weeks Ended | ||||||||
| March 28, | March 29, | |||||||
| 2015 | 2014 | |||||||
| Operating Activities: | ||||||||
| Net income | $ | 66,793 | $ | 118,818 | ||||
| Adjustments to reconcile net income to net cash provided by operating activities: | ||||||||
| Depreciation | 12,280 | 11,672 | ||||||
| Amortization | 6,584 | 6,740 | ||||||
| Gain (loss) on sale of property and equipment | 24 | (617 | ) | |||||
| Provision for doubtful accounts | (1,080 | ) | (189 | ) | ||||
| Deferred income taxes | (3,647 | ) | 5,942 | |||||
| Unrealized foreign currency loss (gain) | 47,877 | (15,334 | ) | |||||
| Provision for obsolete and slow moving inventories | 4,344 | 3,384 | ||||||
| Stock compensation expense | 7,769 | 6,325 | ||||||
| Realized (gain) loss on marketable securities | (340 | ) | 1,544 | |||||
| Changes in operating assets and liabilities: | ||||||||
| Accounts receivable | 129,448 | 137,198 | ||||||
| Inventories | (56,897 | ) | (64,083 | ) | ||||
| Other current and non-current assets | (11,537 | ) | (1,591 | ) | ||||
| Accounts payable | (25,957 | ) | (20,411 | ) | ||||
| Other current and non-current liabilities | (73,408 | ) | (80,011 | ) | ||||
| Deferred revenue | (29,870 | ) | (45,290 | ) | ||||
| Deferred cost | 6,470 | 8,129 | ||||||
| Income taxes payable | 2,802 | (1,053 | ) | |||||
| Net cash provided by operating activities | 81,655 | 71,173 | ||||||
| Investing activities: | ||||||||
| Purchases of property and equipment | (18,143 | ) | (15,537 | ) | ||||
| Proceeds from sale of property and equipment | 664 | 609 | ||||||
| Purchase of intangible assets | (717 | ) | (1,111 | ) | ||||
| Purchase of marketable securities | (254,741 | ) | (298,695 | ) | ||||
| Redemption of marketable securities | 308,751 | 223,786 | ||||||
| Proceeds from repayment on loan receivable | 0 | 94,507 | ||||||
| Change in restricted cash | (5 | ) | 3 | |||||
| Acquisitions, net of cash acquired | (12,632 | ) | 0 | |||||
| Net cash provided by investing activities | 23,177 | 3,562 | ||||||
| Financing activities: | ||||||||
| Dividends paid | (91,964 | ) | (87,853 | ) | ||||
| Purchase of treasury stock under share repurchase plan | (16,260 | ) | (32,986 | ) | ||||
| Purchase of treasury stock related to equity awards | (89 | ) | (58 | ) | ||||
| Proceeds from issuance of treasury stock related to equity awards | 246 | 1,107 | ||||||
| Tax benefit from issuance of equity awards | 399 | 2,199 | ||||||
| Net cash used in financing activities | (107,668 | ) | (117,591 | ) | ||||
| Effect of exchange rate changes on cash and cash equivalents | (22,044 | ) | 398 | |||||
| Net decrease in cash and cash equivalents | (24,880 | ) | (42,458 | ) | ||||
| Cash and cash equivalents at beginning of period | 1,196,268 | 1,179,149 | ||||||
| Cash and cash equivalents at end of period | $ | 1,171,388 | $ | 1,136,691 | ||||
Garmin Ltd. And Subsidiaries
Net Sales, Gross Profit, and Operating Income by Segment (Unaudited)
| Reporting Segments | ||||||||||||||||||||||||
| Outdoor | Fitness | Marine | Auto | Aviation | Total | |||||||||||||||||||
| 13-Weeks Ended March 28, 2015 | ||||||||||||||||||||||||
| Net sales | $ | 75,915 | $ | 130,994 | $ | 64,297 | $ | 216,126 | $ | 98,062 | $ | 585,394 | ||||||||||||
| Gross profit | $ | 50,220 | $ | 83,075 | $ | 35,513 | $ | 103,803 | $ | 71,511 | $ | 344,122 | ||||||||||||
| Operating income | $ | 23,834 | $ | 34,638 | $ | 4,566 | $ | 22,480 | $ | 26,180 | $ | 111,698 | ||||||||||||
| 13-Weeks Ended March 29, 2014 | ||||||||||||||||||||||||
| Net sales | $ | 83,985 | $ | 100,288 | $ | 60,002 | $ | 242,952 | $ | 95,994 | $ | 583,221 | ||||||||||||
| Gross profit | $ | 50,910 | $ | 64,085 | $ | 31,053 | $ | 113,791 | $ | 70,995 | $ | 330,834 | ||||||||||||
| Operating income | $ | 23,683 | $ | 33,512 | $ | 3,810 | $ | 30,564 | $ | 28,800 | $ | 120,369 | ||||||||||||
Garmin Ltd. And Subsidiaries
Net Sales by Geography (Unaudited)
| 13-Weeks Ended | ||||||||||||
| March 28, | March 29, | Yr over Yr | ||||||||||
| 2015 | 2014 | Change | ||||||||||
| Net sales | $ | 585,394 | $ | 583,221 | 0 | % | ||||||
| Americas | 305,261 | 304,808 | 0 | % | ||||||||
| EMEA | 208,351 | 220,603 | -6 | % | ||||||||
| APAC | 71,782 | 57,810 | 24 | % | ||||||||
| EMEA - Europe, Middle East and Africa; APAC - Asia Pacific | ||||||||||||
Non-GAAP Financial Information
Pro Forma net income (earnings) per share
Management believes that net income per share before the impact of foreign currency translation gain or loss and income tax adjustments that materially impact the effective tax rate, as discussed below, is an important measure. The majority of the Company’s consolidated foreign currency gain or loss result from transactions involving the Euro, the British Pound Sterling and the Taiwan Dollar and from the exchange rate impact of the significant cash and marketable securities, receivables and payables held in a currency other than the functional currency at one of the Company’s subsidiaries. However, there is minimal cash impact from such foreign currency gain or loss. The Company’s income tax expense is periodically impacted by material net releases of reserves primarily related to completion of audits and/or the expiration of statutes effecting prior periods. Thus, reported income tax expense is not reflective of the income tax expense that is incurred related to the current period earnings. The net release of other uncertain tax position reserves, amounting to approximately $5 million and $6 million in first quarter 2015 and 2014, respectively, have not been included as pro forma adjustments in the following presentation of pro forma net income as such amounts have been considered immaterial, tend to be more recurring in nature and are comparable between periods. Accordingly, earnings per share before the impact of foreign currency translation gain or loss and income tax adjustments that materially impact the effective tax rate permits a consistent comparison of the Company’s operating performance between periods.
Garmin Ltd. And Subsidiaries
Net income per share (Pro Forma)
(in thousands, except per share information)
| 13-Weeks Ended | ||||||||
| March 28, | March 29, | |||||||
| 2015 | 2014 | |||||||
| Net Income (GAAP) | $ | 66,793 | $ | 118,818 | ||||
| Foreign currency (gain) / loss, net of tax effects | $ | 38,801 | $ | (10,687 | ) | |||
| Net income (Pro Forma) | $ | 105,594 | $ | 108,131 | ||||
| Net income per share (GAAP): | ||||||||
| Basic | $ | 0.35 | $ | 0.61 | ||||
| Diluted | $ | 0.35 | $ | 0.61 | ||||
| Net income per share (Pro Forma): | ||||||||
| Basic | $ | 0.55 | $ | 0.55 | ||||
| Diluted | $ | 0.55 | $ | 0.55 | ||||
| Weighted average common shares outstanding: | ||||||||
| Basic | 191,762 | 195,090 | ||||||
| Diluted | 192,341 | 195,860 | ||||||
Free cash flow
Management believes that free cash flow is an important financial measure because it represents the amount of cash provided by operations that is available for investing and defines it as operating cash flow plus one-time cash payments associated with our inter-company restructuring less capital expenditures for property and equipment.
Garmin Ltd. And Subsidiaries
Free Cash Flow
(in thousands)
| 13-Weeks Ended | ||||||||
| March 28, | March 29, | |||||||
| 2015 | 2014 | |||||||
| Net cash provided by operating activities | $ | 81,655 | $ | 71,173 | ||||
| Less: purchases of property and equipment | $ | (18,143 | ) | $ | (15,537 | ) | ||
| Free Cash Flow | $ | 63,512 | $ | 55,636 | ||||