Attached files
| file | filename |
|---|---|
| EX-23.4 - EX-23.4 - Energy & Exploration Partners, Inc. | d870334dex234.htm |
| EX-23.3 - EX-23.3 - Energy & Exploration Partners, Inc. | d870334dex233.htm |
| EX-23.1 - EX-23.1 - Energy & Exploration Partners, Inc. | d870334dex231.htm |
| EX-99.1 - EX-99.1 - Energy & Exploration Partners, Inc. | d870334dex991.htm |
| EX-99.4 - EX-99.4 - Energy & Exploration Partners, Inc. | d870334dex994.htm |
Table of Contents
As filed with the Securities and Exchange Commission on April 29, 2015
Registration No. 333-198704
UNITED STATES
SECURITIES AND EXCHANGE COMMISSION
Washington, D.C. 20549
Amendment No. 3
to
Form S-1
REGISTRATION STATEMENT
UNDER
THE SECURITIES ACT OF 1933
Energy & Exploration Partners, Inc.
(Exact name of registrant as specified in its charter)
| Delaware | 1311 | 80-0839466 | ||
| (State or other jurisdiction of incorporation or organization) |
(Primary Standard Industrial Classification Code Number) |
(I.R.S. Employer Identification No.) |
Two City Place, Suite 1700
100 Throckmorton
Fort Worth, Texas 76102
(817) 789-6712
(Address, including zip code, and telephone number, including area code, of registrant’s principal executive offices)
Tom D. McNutt
Executive Vice President, General Counsel and Secretary
Two City Place, Suite 1700
100 Throckmorton
Fort Worth, Texas 76102
(817) 789-6712
(Name, address, including zip code, and telephone number, including area code, of agent for service)
Copies to:
| Charles H. Still, Jr. Bracewell & Giuliani LLP 711 Louisiana Street, Suite 2300 Houston, Texas 77002 (713) 221-3309 |
Kirk Tucker Andrew J. Stanger Mayer Brown LLP 700 Louisiana, Suite 3400 Houston, Texas 77002 (713) 238-3000 |
Approximate date of commencement of proposed sale to the public: As soon as practicable after the effective date of this registration statement.
If any of the securities being registered on this Form are to be offered on a delayed or continuous basis pursuant to Rule 415 under the Securities Act of 1933, check the following box: ¨
If this Form is filed to register additional securities for an offering pursuant to Rule 462(b) under the Securities Act, please check the following box and list the Securities Act registration statement number of the earlier effective registration statement for the same offering. ¨
If this Form is a post-effective amendment filed pursuant to Rule 462(c) under the Securities Act, check the following box and list the Securities Act registration statement number of the earlier effective registration statement for the same offering. ¨
If this Form is a post-effective amendment filed pursuant to Rule 462(d) under the Securities Act, check the following box and list the Securities Act registration statement number of the earlier effective registration statement for the same offering. ¨
Indicate by check mark whether the registrant is a large accelerated filer, an accelerated filer, a non-accelerated filer, or a smaller reporting company. See the definitions of “large accelerated filer,” “accelerated filer” and “smaller reporting company” in Rule 12b-2 of the Exchange Act. (Check one):
| Large accelerated filer ¨ | Accelerated filer ¨ | Non-accelerated filer x (Do not check if a smaller reporting company) |
Smaller reporting company ¨ |
The registrant hereby amends this registration statement on such date or dates as may be necessary to delay its effective date until the registrant shall file a further amendment which specifically states that this registration statement shall thereafter become effective in accordance with Section 8(a) of the Securities Act of 1933 or until the registration statement shall become effective on such date as the Commission acting pursuant to said Section 8(a), may determine.
Table of Contents
The information in this prospectus is not complete and may be changed. We and the selling stockholders may not sell these securities until the registration statement filed with the Securities and Exchange Commission is effective. This prospectus is not an offer to sell these securities and it is not soliciting an offer to buy these securities in any state where the offer or sale is not permitted.
SUBJECT TO COMPLETION, DATED APRIL 29, 2015
PROSPECTUS
Shares

Energy & Exploration Partners, Inc.
Common Stock
$ Per Share
We are offering shares of our common stock, and the selling stockholders are offering shares of our common stock. We will not receive any proceeds from the sale of our common stock by the selling stockholders. This is the initial public offering of our common stock. Prior to this offering, there has been no public market for our common stock. The initial public offering price of our common stock is expected to be between $ and $ per share. We have applied to list our common stock on the New York Stock Exchange under the symbol “ENXP.”
We are an “emerging growth company” under the federal securities laws and will be subject to reduced public company reporting requirements. See “Summary—Implications of Being an Emerging Growth Company.”
Investing in our common stock involves risks. Please see the section entitled “Risk Factors” starting on page 17 of this prospectus to read about risks you should consider carefully before buying shares of our common stock.
Neither the Securities and Exchange Commission nor any state securities commission has approved or disapproved of these securities or passed upon the accuracy or adequacy of this prospectus. Any representation to the contrary is a criminal offense.
| Per Share | Total | |||||||
| Public offering price |
$ | $ | ||||||
| Underwriting discount(1) |
$ | $ | ||||||
| Proceeds, before expenses, to us |
$ | $ | ||||||
| Proceeds to selling stockholders(2) |
$ | $ | ||||||
| (1) | For additional information about underwriting compensation, please see “Underwriting.” |
| (2) | Expenses associated with the offering of shares by the selling stockholders, other than underwriting discounts, will be paid by us. |
We have granted the underwriters a 30-day option to purchase up to an additional shares of our common stock at the public offering price, less the underwriting discount, to cover any over-allotments.
The underwriters expect to deliver the shares of common stock on or about , 2015.
Joint Book-Running Managers
| Citigroup | Credit Suisse | RBC Capital Markets | ||
| BofA Merrill Lynch | UBS Investment Bank | |||
Co-Managers
| Scotia Howard Weil | Stephens Inc. | Seaport Global |
The date of this prospectus is , 2015.
Table of Contents
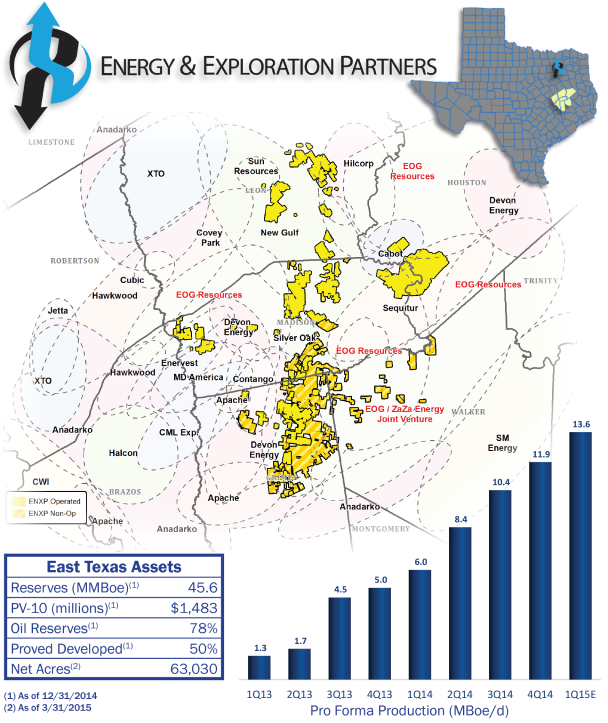
Table of Contents
| 1 | ||||
| 17 | ||||
| 43 | ||||
| 45 | ||||
| 46 | ||||
| 47 | ||||
| 48 | ||||
| 49 | ||||
| MANAGEMENT’S DISCUSSION AND ANALYSIS OF FINANCIAL CONDITION AND RESULTS OF OPERATIONS |
50 | |||
| 72 | ||||
| 99 | ||||
| 104 | ||||
| 110 | ||||
| 114 | ||||
| 116 | ||||
| 121 | ||||
| MATERIAL U.S. FEDERAL INCOME TAX CONSIDERATIONS FOR NON-U.S. HOLDERS |
123 | |||
| 126 | ||||
| 133 | ||||
| 133 | ||||
| 133 | ||||
| F-1 | ||||
| A-1 |
You should rely only on the information contained in this document and any free writing prospectus we provide you. We, the selling stockholders and the underwriters have not authorized anyone to provide you with additional or different information. We, the selling stockholders and the underwriters are offering to sell, and seeking offers to buy, these securities only in jurisdictions where offers and sales are permitted. The information in this prospectus is accurate only as of the date of this prospectus, regardless of the time of delivery of this prospectus or any sale of these securities.
Through and including , 2015 (the 25th day after the date of this prospectus), all dealers effecting transactions in these securities, whether or not participating in this offering, may be required to deliver a prospectus. This is in addition to a dealer’s obligation to deliver a prospectus when acting as an underwriter and with respect to an unsold allotment or subscription.
Industry and Market Data
The market data and certain other statistical information used throughout this prospectus are based on independent industry publications, government publications or other published independent sources. Some data is also based on our good faith estimates. Although we believe these third-party sources are reliable and that the information is accurate and complete, none of us, the selling stockholders and the underwriters have independently verified the third-party information and our estimates may differ materially from actual data. The industry in which we operate is subject to a high degree of uncertainty and risk due to a variety of factors, including those described in the section titled “Risk Factors.” These and other factors could cause results to differ materially from those expressed in these publications.
i
Table of Contents
This summary provides a brief overview of information contained elsewhere in this prospectus. Because it is abbreviated, this summary does not contain all the information that you should consider before investing in our common stock. You should read the entire prospectus carefully before making an investment decision, including the information presented under the headings “Risk Factors,” “Cautionary Note Regarding Forward-Looking Statements” and “Management’s Discussion and Analysis of Financial Condition and Results of Operations” and the historical and pro forma financial statements and the notes thereto included elsewhere in this prospectus. Unless the context otherwise requires, references in this prospectus to “we,” “us,” “our” or “our company” refer to Energy & Exploration Partners, Inc. and its subsidiaries. Unless otherwise indicated, information presented in this prospectus assumes that the underwriters’ option to purchase additional shares of our common stock is not exercised. We have provided definitions for some of the industry terms used in this prospectus in the “Glossary of Selected Oil and Natural Gas Terms.”
Overview
We are an independent exploration and production company focused on the acquisition, exploration, development and exploitation of conventional and unconventional oil and natural gas resources. As of March 31, 2015, we owned approximately 79,179 net acres, primarily in two basins: the East Texas Basin where we are pursuing opportunities in the Lower Cretaceous formations of the Buda, Georgetown, Edwards and Glen Rose (the Buda-Rose play), the Woodbine sandstone, the Goodland limestone and the Eagle Ford shale, which we refer to collectively as the East Texas stacked play; and the Denver-Julesburg Basin in Wyoming, which we refer to as the DJ Basin. We target liquids-rich resource plays and have built our leasehold acreage position through direct acquisitions from mineral owners and other exploration and production companies. Our management team has extensive engineering, geological, geophysical and technical expertise in our operating areas.
As of December 31, 2014, we had total estimated proved reserves of 45,580 MBoe, 18,260 MBoe of which were developed and 27,321 MBoe of which were undeveloped and 78% of which were oil and 61,655 MBoe of probable and possible reserves, of which 68% were oil. See “—Summary Reserve Data.” Pro forma for the Ft. Trinidad acquisition described below, our average daily net production increased significantly from approximately 6,016 Boe/day for the three months ended March 31, 2014 to 11,933 Boe/day for the three months ended December 31, 2014 and to approximately 13,573 Boe/day for the three months ended March 31, 2015, as currently estimated.
Our primary area of focus is the East Texas stacked play, in which we owned approximately 63,080 net acres as of March 31, 2015. On July 22, 2014, we completed the purchase of approximately 18,300 net acres in the Ft. Trinidad field in the East Texas stacked play from TreadStone Energy Partners, LLC, or TreadStone, including interests in 45 gross (43.5 net) producing wells and 10 gross (9.8 net) wells waiting on completion, a 3-well salt water disposal system and approximately 30 square miles of 3D seismic data, for a purchase price of approximately $700 million in cash, after post-closing adjustments. We refer to this transaction as the Ft. Trinidad acquisition.
We are the operator on approximately 81% of our net acres in the East Texas stacked play and 99% of our proved developed producing reserves as of December 31, 2014. We began drilling on our operated East Texas stacked play acreage in May 2013, and we have drilled or were in the process of drilling 60 gross (58.2 net) operated wells on this acreage as of March 31, 2015. As of March 31, 2015, 13 gross (12.9 net) wells were waiting on completion. We completed 5 wells during the three months ended March 31, 2015, and plan to complete 11 wells during the quarter ended June 30, 2015. In addition to our acreage in the East Texas stacked play, as of March 31, 2015 we had approximately 14,162 net acres in the DJ Basin, where we have 100% operated working interests.
1
Table of Contents
The majority of our capital expenditure budget for 2015 and 2016 is focused on the development of our operated acreage in the East Texas stacked play with vertical Buda-Rose wells. The following table presents summary data for our acreage in the East Texas stacked play and our other operating areas as of March 31, 2015, and our drilling capital budget of $97 million for the year ending December 31, 2015 and $115 million for the year ending December 31, 2016. We also have budgeted estimated capital expenditures of $9 million for the year ending December 31, 2015 and $13 million for the year ending December 31, 2016 for land acquisition, leasehold extension, seismic surveys and other capital needs. See “Management’s Discussion and Analysis of Financial Condition and Results of Operations—Liquidity and Capital Resources” and “Business—Capital Budget.”
| Drilling Capital Budget | ||||||||||||||||||||
| 2015(1) | 2016 | |||||||||||||||||||
| Net Acres | Net Wells | $ | Net Wells | $ | ||||||||||||||||
| (in millions) | (in millions) | |||||||||||||||||||
| East Texas Stacked Play(2) |
63,080 | 23 | $ | 97 | 41 | $ | 115 | |||||||||||||
| Other(3) |
16,098 | — | $ | — | — | $ | — | |||||||||||||
|
|
|
|
|
|
|
|
|
|
|
|||||||||||
| Total |
79,179 | 23 | $ | 97 | 41 | $ | 115 | |||||||||||||
|
|
|
|
|
|
|
|
|
|
|
|||||||||||
| (1) | Includes approximately $37 million of drilling and completion capital spent prior to March 31, 2015 and approximately $29 million to finish drilling and completion of wells that began drilling in 2014. |
| (2) | Operated working interests range from approximately 71% to 100% and non-operated working interests range from approximately 5% to 52%. |
| (3) | In addition to 14,162 net acres in the DJ Basin, includes 1,936 net acres in the Permian Basin in West Texas which we consider non-core and for which we have not allocated any capital in our budget through 2016. We have 100% operated working interests in the DJ Basin and the Permian Basin. |
Our Operating Areas
East Texas Stacked Play
As of March 31, 2015, we owned approximately 63,080 net acres in the East Texas stacked play located in Madison, Grimes, Leon, Houston and Walker Counties, Texas. We believe our East Texas stacked play acreage to be prospective for up to 14 zones, including our primary near-term objectives in the Buda-Rose limestone formations of the Buda, Georgetown, Edwards and Glen Rose, the Woodbine sandstone, the Goodland limestone and the Eagle Ford shale. We are currently evaluating the Austin Chalk and Sub Clarksville formations, which may eventually present us with additional drilling locations. We are also utilizing 3D seismic data to evaluate deep gas opportunities in the James Lime, Cotton Valley, Bossier and Haynesville formations.
The majority of our leases in the East Texas stacked play not held by production are in the second or third year of their three-year primary term and generally provide for either two- or three-year extension options. In 2015, we plan to drill 23 net wells and complete 30 net wells and have budgeted $98 million for estimated drilling and completion capital expenditures on our acreage in the East Texas stacked play, of which 6 wells had commenced drilling and $37 million of capital expenditures were made prior to March 31, 2015. In 2016, we plan to drill 41 net wells and have budgeted $115 million for estimated drilling and completion capital expenditures on our acreage in the East Texas stacked play. Approximately 32,500 of our net acres in the East Texas stacked play are held by production, including substantially all of the acreage acquired in the Ft. Trinidad acquisition.
We began drilling on our operated East Texas stacked play acreage in May 2013, and as of March 31, 2015, we have drilled or were in the process of drilling 60 gross (58.2 net) operated wells on this acreage. Of these wells, 46 gross (44.3 net) have been completed and placed on production, while the other 14 gross (13.9 net) wells were in various stages of drilling or completion. In the Ft. Trinidad acquisition, we acquired interests in 45 gross (43.5 net) producing wells and 10 gross (9.8 net) wells awaiting completion as of July 22, 2014. As of
2
Table of Contents
March 31, 2015, 13 gross (12.9 net) wells were waiting on completion. We expect to drill or commence drilling a total of 23 net wells and complete 30 net wells during 2015, including 6 wells that commenced drilling prior to March 31, 2015.
The following table demonstrates production data on the vertical Buda-Rose wells we have drilled and completed or recompleted on our East Texas acreage as of April 15, 2015. On average, the wells have recorded peak gross 30 day average production rates of 489 Boe/day as of April 15, 2015 and gross estimated ultimate recoveries of 320 MBoe as of December 31, 2014.
| No. of |
First |
Gross Production |
Peak Gross Wellhead Production (Boe/d per well) (1)(2) |
Gross D&C per well ($MM)(2) |
||||||||||||||||||||||||
| Well/Pad Name |
24 Hr |
30 day |
180 Days |
|||||||||||||||||||||||||
| Shelly 3. |
1 | Jan-13 | 258 | 876 | 745 | 521 | 4.0 | |||||||||||||||||||||
| Shelly 1. |
1 | Feb-13 | 194 | 1,256 | 933 | 517 | 3.9 | |||||||||||||||||||||
| Shelly 4. |
1 | Mar-13 | 35 | 333 | 111 | 87 | 3.8 | |||||||||||||||||||||
| Forrest A 5. |
1 | Apr-13 | 505 | 1,852 | 1,121 | 917 | 2.4 | |||||||||||||||||||||
| Elijah Carter Unit 1. |
1 | May-13 | 62 | 416 | 252 | 173 | 2.6 | |||||||||||||||||||||
| Carter Starns 1. |
1 | May-13 | 93 | 742 | 345 | 212 | 2.3 | |||||||||||||||||||||
| Turner Unit 1. |
1 | Jun-13 | 71 | 992 | 635 | 241 | 2.5 | |||||||||||||||||||||
| Forrest C 6. |
1 | Jul-13 | 41 | 979 | 237 | 98 | 2.9 | |||||||||||||||||||||
| Little Unit 1. |
1 | Aug-13 | 12 | 221 | 124 | 48 | 2.6 | |||||||||||||||||||||
| Shelly 5. |
1 | Aug-13 | 28 | 279 | 121 | 73 | 2.4 | |||||||||||||||||||||
| Shaw Unit 1. |
1 | Aug-13 | 6 | 178 | 100 | 35 | 2.0 | |||||||||||||||||||||
| Hunt Unit 1. |
1 | Sep-13 | 75 | 1,168 | 602 | 284 | 3.6 | |||||||||||||||||||||
| SJSF 52. |
1 | Oct-13 | 12 | 154 | 60 | 52 | 3.0 | |||||||||||||||||||||
| Forrest C 12. |
1 | Oct-13 | 238 | 1,425 | 921 | 763 | 3.0 | |||||||||||||||||||||
| Adams Unit 1. |
1 | Oct-13 | 19 | 331 | 191 | 102 | 3.0 | |||||||||||||||||||||
| Wakefield-Jones Unit 1. |
1 | Nov-13 | 124 | 1,235 | 841 | 517 | 3.0 | |||||||||||||||||||||
| Harrison Forrest Oil Unit 2. |
1 | Nov-13 | 99 | 617 | 362 | 258 | 2.4 | |||||||||||||||||||||
| Forrest C 11. |
1 | Dec-13 | 23 | 554 | 311 | 99 | 2.9 | |||||||||||||||||||||
| Harrison Forrest Oil Unit 3. |
1 | Dec-13 | 67 | 535 | 349 | 209 | 2.4 | |||||||||||||||||||||
| Jason Bourne State Unit 1. |
1 | Dec-13 | 9 | 245 | 105 | 35 | 2.4 | |||||||||||||||||||||
| Shelly 6. |
1 | Jan-14 | 207 | 1,199 | 854 | 688 | 2.8 | |||||||||||||||||||||
| Forrest 7. |
1 | Feb-14 | 13 | 564 | 163 | 82 | 8.1 | (3) | ||||||||||||||||||||
| Wakefield-Jones 100 Pad. |
3 | May-14 | 174 | 1,004 | 706 | 602 | 3.1 | |||||||||||||||||||||
| Carolyn 100 Pad. |
2 | Jun-14 | 164 | 1,110 | 946 | 637 | 3.1 | |||||||||||||||||||||
| Shelly 7. |
1 | Jun-14 | 91 | 1,244 | 768 | 412 | 5.0 | |||||||||||||||||||||
| Harrison Forrest 100 Pad. |
3 | Jun-14 | 38 | 685 | 294 | 196 | 2.9 | |||||||||||||||||||||
| Forrest C 200 Pad. |
2 | Jul-14 | 44 | 511 | 408 | 213 | 2.3 | |||||||||||||||||||||
| Crowson Nash 100 Pad. |
2 | Aug-14 | 23 | 274 | 175 | 99 | 3.5 | |||||||||||||||||||||
| Maples 100 Pad. |
2 | Oct-14 | 32 | 698 | 284 | 158 | 2.7 | |||||||||||||||||||||
| Shelly 200 Pad. |
4 | Oct-14 | 65 | 853 | 509 | 358 | 3.8 | |||||||||||||||||||||
| Shelly 100 Pad. |
4 | Oct-14 | 82 | 850 | 608 | 448 | 4.0 | (3) | ||||||||||||||||||||
| Comanchero Unit A 1H. |
1 | Nov-14 | 14 | 484 | 205 | 7.0 | ||||||||||||||||||||||
| Johnny Ringo A 1. |
1 | Nov-14 | 31 | 909 | 361 | 3.4 | ||||||||||||||||||||||
| Jeanette 100 Pad. |
2 | Nov-14 | 77 | 973 | 749 | 3.6 | ||||||||||||||||||||||
| Butler 100 Pad. |
3 | Nov-14 | 72 | 892 | 698 | 3.7 | ||||||||||||||||||||||
| SJSF - 53. |
1 | Dec-14 | 1 | 218 | 33 | 4.2 | ||||||||||||||||||||||
| Forrest C 400 Pad. |
3 | Dec-14 | 10 | 270 | 177 | 3.4 | ||||||||||||||||||||||
| Joyce 100 Pad. |
2 | Dec-14 | 75 | 1,152 | 778 | 4.6 | (3) | |||||||||||||||||||||
| Forrest 700 Pad (4). |
2 | Mar-15 | 21 | 928 | 2.7 | (3)(5) | ||||||||||||||||||||||
| Weighted Average |
78 | 761 | 476 | 317 | 3.4 | |||||||||||||||||||||||
3
Table of Contents
| Recompleted Wells(6) | First Production |
Gross Cumulative Production (MBoe) |
Peak Gross Wellhead Production (Boe/d) (1) |
Recompletion Cost ($MM) |
||||||||||||||||||||
| Well Name |
24 Hr |
30 day |
180 Days | |||||||||||||||||||||
| Forrest 2 |
May-12 | 311 | 1,014 | 754 | 605 | 1.9 | ||||||||||||||||||
| Shelly 2 |
Sep-12 | 274 | 1,540 | 965 | 796 | 1.7 | ||||||||||||||||||
| Maples 1 |
Sep-12 | 276 | 849 | 685 | 547 | 1.3 | ||||||||||||||||||
| W Forrest 4 |
Nov-12 | 305 | 1,353 | 1,056 | 609 | 2.0 | ||||||||||||||||||
| Turner Unit 2 |
Jun-13 | 117 | 654 | 471 | 279 | 1.2 | ||||||||||||||||||
| Harrison Forrest Oil Unit 8-1 |
Jun-13 | 231 | 1,310 | 962 | 732 | 1.6 | ||||||||||||||||||
| SJSF 45 |
Aug-13 | 4 | 135 | 41 | 17 | 0.7 | ||||||||||||||||||
| SJSF 7 (51-7) |
Aug-13 | 18 | 175 | 90 | 53 | 0.8 | ||||||||||||||||||
| Shaw Unit 2 |
Oct-13 | 62 | 492 | 277 | 157 | 1.9 | ||||||||||||||||||
| Westmar Unit 55-1 |
Apr-14 | 34 | 459 | 297 | 171 | 2.6 | ||||||||||||||||||
| Weighted Average |
163 | 798 | 560 | 397 | 1.6 | |||||||||||||||||||
|
|
||||||||||||||||||||||||
| Weighted Average of All Wells |
90 | 766 | 485 | 331 | ||||||||||||||||||||
|
|
||||||||||||||||||||||||
| (1) | 24-hour peak gross wellhead production refers to the highest 24-hour gross production recorded during the life of the well/pad. All other peak gross wellhead production data refer to the highest average gross production recorded for the consecutive number of days specified during the life of the well/pad. Data is omitted where a well/pad has not been in production for the specified consecutive number of days. |
| (2) | Per well data from multi-well production pads represents the total production for the pad divided by the number of wells on that pad. |
| (3) | One or more wells sidetracked resulting in additional cost. |
| (4) | As of April 15, 2015, these wells were flowing back for less than 30 days. The 24-hour peak gross wellhead production is the peak test rate only through April 15, 2015. |
| (5) | Management estimate. |
| (6) | Reentry in existing wellbore and recompleted in different zones. |
In September 2012, we, together with other operators, contracted with a leading geophysical services company to acquire a 330-square-mile 3D seismic survey covering a majority of our operated and non-operated acreage position in Grimes and Madison Counties and the southern portion of Leon County. Seismic field acquisition activities were completed in October 2013 and interpretation is ongoing. Including the approximately 30-square-mile 3D seismic from the Ft. Trinidad acquisition, we have approximately 360 square miles of 3D seismic data covering our acreage.
Recently, there has been significant industry activity in the East Texas stacked play, which, for purposes of industry comparisons, we define as Brazos, Burleson, Grimes, Houston, Leon, Madison, Robertson and Walker Counties, Texas. The most active operators offsetting our acreage position include EOG Resources, Inc., Halcón Resources Corporation, Anadarko Petroleum Corporation, Cabot Oil & Gas Corporation, Devon Energy Corporation, Apache Corporation, MD America Holdings, LLC, Burk Royalty Company, Silver Oak Energy, LLC, ZaZa Energy Corporation, Contango Oil & Gas Company, Crimson Energy Partners III, L.L.C. and SM Energy Company. According to Drilling Info, Inc. there were 396 drilling permits filed in 2012, 511 drilling permits filed in 2013 and 878 permits filed in 2014 in the East Texas stacked play.
DJ Basin
As of March 31, 2015, we owned approximately 14,162 net undeveloped acres in the DJ Basin with a 100% operated working interest. Our DJ Basin acreage is in Laramie and Goshen Counties, Wyoming. Our DJ Basin leasehold acreage is focused on the western, northern and eastern extensions of the Silo Field in Laramie County, Wyoming, and the deepest parts of the basin in Goshen County, Wyoming. We are evaluating several zones within the Niobrara shale, Fort Hays limestone and Codell sand formations. Additional targets include the J Sandstone, Dakota sandstone, Greenhorn limestone and Lyons sandstone formations along with Permian and Pennsylvanian objectives. We believe our DJ Basin leasehold acreage is in areas with a higher incidence of naturally induced faulting and fracturing and moderate to high Niobrara resistivities. The majority of our leases in the DJ Basin are in the third year of their five-year primary term and generally provide for three- to five-year extension options. Our drilling capital budget does not include any amounts allocated to develop our DJ Basin acreage in 2015 and 2016.
4
Table of Contents
Our Strategy
We intend to actively drill and develop our acreage position in the East Texas stacked play in an effort to maximize its value and resource potential. Through the conversion of our undeveloped acreage, which we believe has significant oil-weighted resource potential, we will seek to increase our production, reserves and cash flow while generating attractive returns on invested capital.
Strategically drill and develop our existing acreage positions. We plan to strategically drill and develop our East Texas stacked play acreage. For 2015, we plan to drill 23 net wells and complete 30 net wells and have budgeted $97 million for estimated drilling capital expenditures in our acreage in the East Texas stacked play. In 2016, we plan to drill 41 net wells and have budgeted $115 million for estimated drilling capital expenditures on our acreage in the East Texas stacked play.
Leverage technology to maximize inventory of high quality drilling prospects. The majority of our East Texas stacked play acreage is characterized by multiple productive intervals including the Buda-Rose limestone formations of the Buda, Georgetown, Edwards and Glen Rose, the Woodbine sandstone, the Goodland limestone and the Eagle Ford shale. We received data from a 330-square-mile seismic survey from a leading geophysical services company starting in October 2013, and interpretation is ongoing. We also acquired approximately 30 square miles of 3D seismic data in the Ft. Trinidad acquisition. We intend to use this 3D seismic data, micro-seismic data and other advanced technologies for well planning and reservoir characterization, as well as to delineate hazards and locate bypassed pay. Our highly skilled staff of geophysicists and geologists have analyzed over 4,500 well logs in the East Texas stacked play and have extensive experience in using such technologies to optimize completions and resource recovery.
Enhance returns through operational efficiencies as our rig count and well count grow. We intend to focus on the continuous improvement of our operating measures as we seek to convert our undeveloped East Texas stacked play acreage into a cost-efficient development project. We are the operator on approximately 99% of our proved developed producing reserves as of December 31, 2014 and 81% of our East Texas stacked play acreage as of March 31, 2015, and our acreage position is generally in large contiguous blocks. This operational control will allow us to more efficiently manage the pace of development activities and the gathering and marketing of our production and control operating costs and technical applications, including horizontal and vertical development. Our operations team will continue to evaluate our operating results against those of other operators in the area in order to benchmark our performance relative to other operators and adopt best practices to decrease drilling times, optimize completions and increase EURs.
Selectively acquire additional leasehold acreage in our existing core area. We have a proven history of acquiring leasehold positions that we believe have substantial oil-weighted resource potential and can meet our targeted returns on invested capital. We plan to continue to leverage the relationships of our experienced land professionals to pursue select additional leasehold acquisitions in the East Texas stacked play that meet our strategic and financial targets.
Maintain sufficient liquidity to execute our capital plan. As of April 27, 2015, we had approximately $32 million of cash on hand. We expect that cash on hand and cash flows from operations will fully fund our capital expenditure budget for 2015. Our commodity derivative contracts had a mark-to-market value of approximately $54 million as of April 8, 2015. In addition, subject to obtaining the participation of existing or new lenders and other conditions, we may incur additional loans of up to $175 million under our senior secured term loan described under “—Recent Financing—Senior Secured Term Loan.” We also may pursue dispositions of non-core assets to provide additional drilling capital and liquidity. We intend to actively manage our exposure to commodity price risk through commodity derivative positions on our anticipated future production.
5
Table of Contents
Our Strengths
We believe we are well positioned to successfully execute our business strategies and achieve our business objectives because of the following competitive strengths:
Large acreage position in our East Texas stacked play area. We owned approximately 63,080 net acres in the East Texas stacked play as of March 31, 2015. The majority of our leasehold acreage is in or near areas of considerable activity by large independent operators, although such activity may not be indicative of our future operations. We believe that lease terms on our acreage and our current drilling plan allow us enough time to drill wells that will hold a substantial portion of our acreage by production.
Rapidly growing, oil-weighted production profile. Pro forma including the Ft. Trinidad acquisition, our average net production has increased from approximately 6,016 Boe/day for the three months ended March 31, 2014 to approximately 13,573 Boe/day for the three months ended March 31, 2015, as currently estimated. In addition, our production primarily consists of oil; for the year ended December 31, 2014 production was 76% oil, 12% natural gas liquids and 12% natural gas.
Substantial drilling inventory. We estimate there are approximately 2,061 net potential drilling locations across our existing acreage in the East Texas stacked play, including 96 net vertical Buda-Rose and 14 net horizontal Woodbine proved undeveloped locations. We estimate there are an additional 779 net potential vertical Buda-Rose locations based on 40 to 160 acre spacing, 947 net potential horizontal Woodbine, Eagle Ford and Goodland locations based on 100 to 320 acre spacing and approximately 226 net potential vertical locations in the Edwards and Glen Rose formations. During 2015 and 2016, we anticipate drilling 64 net wells on our East Texas stacked play acreage, leaving us a substantial drilling inventory for future years.
Operating control over the majority of our asset portfolio. In order to better maintain control over our portfolio, we have established a leasehold position comprised primarily of operated properties. This includes operating approximately 81% of our East Texas stacked play acreage and 100% of our DJ Basin acreage as of March 31, 2015 and 99% of our proved developed producing reserves as of December 31, 2014. As operator, we have primary control over prospect selection and exploration and development timing and capital allocation, as well as the ability to implement logistical practices that we believe will allow us to shorten the time between our drilling and completion operations and first production.
Proximity to significant industry infrastructure and access to multiple product markets. Our acreage in the East Texas stacked play is near substantial existing hydrocarbon gathering, transportation, processing and refining capacity, and has access to multiple product sales points. We believe our East Texas stacked play oil production can generally be sold at a price that is close to New York Mercantile Exchange-West Texas Intermediate (NYMEX-WTI) benchmark prices due to the East Texas stacked play’s proximity to the Gulf Coast. Consequently, our oil production benefits from higher realized pricing relative to many North American crude oil producers in other areas, which can often trade at a more significant discount to NYMEX-WTI benchmark prices. For example, for the three months ended December 31, 2014, the average realized price for our oil production was $70.00/Bbl compared to production weighted average NYMEX-WTI index price of $71.73/Bbl for the same period.
Experienced and incentivized technical, operational and management teams. Our senior technical team is comprised of geoscience, engineering and operational professionals who average approximately 34 years of industry experience. Members of our technical team have previously held technical and management positions with major and independent oil and natural gas companies, including Anadarko Petroleum Corporation, Mobil
6
Table of Contents
Corporation, Exxon Corporation and Encana Corporation. Our core management and operational team has built our existing significant acreage positions in the East Texas stacked play and our other operating areas. Our management has been and will continue to be compensated with equity incentives, as we believe that equity ownership is one of the best ways to motivate management and employees.
Recent Financing
On July 22, 2014, in connection with the closing of the Ft. Trinidad acquisition, we completed a financing consisting of a $775 million senior secured term loan, which we refer to as the senior secured term loan, and the issuance of $375 million of our 8.0% convertible subordinated notes due 2019, which we refer to as the convertible notes, as described more fully below. We used a portion of the net proceeds from the financing to pay the purchase price for the Ft. Trinidad acquisition and to refinance and replace our previously outstanding senior unsecured notes, including a prepayment premium. We used the remaining net proceeds to fund capital expenditures for drilling and developing our leasehold acreage, acquiring additional oil and gas leases, extending expiration of our leasehold acreage and acquiring 3D seismic data.
Senior Secured Term Loan
On July 22, 2014, our wholly owned subsidiary, Energy & Exploration Partners, LLC, which we refer to as ENXP LLC, entered into the $775 million senior secured term loan with a group of institutional lenders. We have guaranteed ENXP LLC’s obligations under the senior secured term loan, which are secured by a pledge of our equity interests in ENXP LLC and substantially all of ENXP LLC’s and its subsidiaries’ assets. For a description of the senior secured term loan, see “Management’s Discussion and Analysis of Financial Condition and Results of Operations—Liquidity and Capital Resources—Debt Facilities and Notes—Senior Secured Term Loan.”
Convertible Notes Offering
On July 22, 2014, we issued $375 million of our convertible notes in a private placement transaction. Holders of the convertible notes may elect to convert their notes into shares of our common stock at a specified conversion price in connection with the closing of a qualified public offering. A qualified public offering is defined as the first public offering of our common stock in which the aggregate gross proceeds to us and any selling stockholders equals or exceeds $400 million and following which our common stock is listed on a U.S. national securities exchange. We expect this offering will constitute a qualified public offering.
Holders of the convertible notes may elect to convert their convertible notes during a period that will end on a date prior to the completion of this offering to be determined by us. Following the completion of a qualified public offering, we may redeem, and intend to redeem, any convertible notes not converted at a price equal to 100% of the principal amount of the convertible notes redeemed, plus accrued interest. Accordingly, we expect that all of the convertible notes will be converted in connection with this offering. Assuming the conversion of all of the convertible notes and an initial public offering price of $ per share of our common stock in this offering (the midpoint of the price range set forth on the cover page of this prospectus), the convertible notes will convert into shares of our common stock upon completion of this offering. A $1.00 increase in the initial public offering price per share would decrease the number of shares issuable upon conversion of the convertible notes by shares, and a $1.00 decrease in the initial public offering price per share would increase the number of shares issuable upon conversion of the convertible notes by shares.
7
Table of Contents
Additionally, holders of the convertible notes have certain registration rights with respect to the shares of common stock issuable upon conversion of the convertible notes, including piggyback registration rights that permit holders to sell up to an aggregate 36% of those shares of common stock in a qualified public offering. We expect that some or all of the convertible note holders will exercise their rights to sell shares in this offering. See “Principal and Selling Stockholders.” For a description of the convertible notes, see “Management’s Discussion and Analysis of Financial Condition and Results of Operations—Liquidity and Capital Resources—Debt Facilities and Notes—Convertible Notes.”
Corporate History; Corporate Information
Our company was formed as Energy & Exploration Partners, LLC in 2006 and began operations in 2008. In late 2009, we began leasing in the Eagle Ford Shale trend, primarily in McMullen and LaSalle Counties, Texas, where we leased and ultimately sold over 125,000 acres to major and independent oil and natural gas companies, including Murphy Oil Corporation and Comstock Resources, Inc. In early 2011, we began accumulating leasehold acreage in our current operating areas.
Energy & Exploration Partners, Inc. was incorporated on July 31, 2012 pursuant to the laws of the State of Delaware to become a holding company for our business. In August 2012, we completed a series of reorganization transactions, which we refer to collectively as our corporate reorganization. For more information on our corporate reorganization, see “Certain Relationships and Related Party Transactions—Corporate Reorganization.”
Our principal executive offices are located at Two City Place, Suite 1700, 100 Throckmorton, Fort Worth, Texas 76102, and our telephone number at that address is (817) 789-6712. Our website address is http://www.enxp.com. Information contained on our website is not incorporated by reference into this prospectus, and you should not consider the information contained on our website to be part of this prospectus.
8
Table of Contents
Risk Factors
An investment in our common stock involves significant risks. In particular, the following considerations may offset our competitive strengths or have a negative effect on our business, financial condition or results of operations, which could cause a decrease in the price of our common stock and result in a loss of all or a portion of your investment:
| • | Oil and natural gas prices are volatile. A substantial or extended decline in oil and natural gas prices may adversely affect our business, financial condition or results of operations and our ability to meet our capital expenditure plans and financial commitments. |
| • | Drilling for and producing oil and natural gas are high risk activities with many uncertainties that could adversely affect our business, financial condition or results of operations. |
| • | Our exploration and development projects require substantial capital expenditures. We may be unable to obtain required capital or financing on satisfactory terms. |
| • | Drilling locations that we decide to drill may not yield oil or natural gas in commercial quantities, or at all. |
| • | Our estimated proved, probable and possible reserves are based on many assumptions that may turn out to be inaccurate. Any significant inaccuracies in these reserve estimates or underlying assumptions will materially affect the quantities and present value of our reserves. |
| • | Our business is difficult to evaluate because we have a limited operating history. |
| • | The agreement governing our senior secured term loan contains covenants that may inhibit our ability to make certain investments, incur additional indebtedness or engage in certain other transactions, which could adversely affect our ability to meet our future goals. |
| • | Our level of indebtedness, including future indebtedness, could reduce our financial flexibility. |
| • | Our potential drilling locations are expected to be drilled over several years, making them susceptible to uncertainties that could materially alter the occurrence or timing of their drilling. |
| • | If we fail to realize the anticipated benefits of a significant acquisition, including the Ft. Trinidad acquisition, our results of operations may be lower than we expect. |
| • | We are subject to complex federal, state, local and other laws and regulations, including environmental and human health and safety laws and regulations, which could adversely affect the timing, cost, manner or feasibility of conducting our operations and expose us to significant liabilities. |
| • | Certain of our directors, executive officers and other members of management and certain of our significant stockholders have direct economic interests in some of our properties, and their interests may not be aligned with our interests. |
| • | The concentration of our capital stock ownership by our largest stockholders will limit your ability to influence corporate matters. |
This list is not exhaustive. Please read the full discussion of these risks and other risks under the heading “Risk Factors” beginning on page 17.
Implications of Being an Emerging Growth Company
As a company with less than $1.0 billion in revenue during its last fiscal year, we qualify as an “emerging growth company” as defined in the Jumpstart Our Business Startups Act of 2012, or the JOBS Act. An emerging
9
Table of Contents
growth company may take advantage of exemptions from various reporting requirements that are applicable to other public companies that are not “emerging growth companies.” These include:
| • | an exemption from the auditor attestation requirements of Section 404 of the Sarbanes-Oxley Act relating to internal control over financial reporting; |
| • | reduced disclosure about the emerging growth company’s executive compensation arrangements; and |
| • | exemptions from the requirements of holding a non-binding advisory vote on executive compensation and shareholder approval of golden parachute arrangements. |
We may take advantage of these reporting exemptions until we are no longer an emerging growth company. We will remain an “emerging growth company” until the earliest of the following:
| • | the end of the fiscal year in which the fifth anniversary of the completion of this offering occurs; |
| • | the end of the first fiscal year in which the market value of our common stock that is held by non-affiliates is at least $700 million as of the end of the second quarter of such fiscal year; |
| • | the end of the first fiscal year in which we have total annual gross revenues of at least $1 billion; and |
| • | the date on which we have issued more than $1 billion in non-convertible debt securities in any rolling three-year period. |
We expect to take advantage of some or all of these reduced reporting requirements, and if we do, the information that we provide to our stockholders may be different from information provided by other public companies. We have taken advantage of the reduced executive compensation disclosure requirements in this prospectus. Additionally, in this prospectus we have taken advantage of reduced financial reporting requirements available under the JOBS Act for an emerging growth company in the registration statement for its initial public offering. Specifically, we have provided only three years of selected financial data and only two years of audited financial statements of TreadStone.
Section 107 of the JOBS Act provides that an emerging growth company may take advantage of the extended transition period provided in Section 7(a)(2)(B) of the Securities Act for complying with new or revised accounting standards. In other words, an emerging growth company may delay the adoption of certain accounting standards until those standards would otherwise apply to private companies. However, we are choosing to “opt out” of the extended transition period, and as a result, we will comply with new or revised accounting standards on the relevant dates on which adoption of such standards is required for non-emerging growth companies. Section 107 of the JOBS Act provides that our decision to opt out of the extended transition period for complying with new or revised accounting standards is irrevocable.
10
Table of Contents
THE OFFERING
| Issuer |
Energy & Exploration Partners, Inc. |
| Common stock offered by us |
shares |
| Common stock offered by the selling stockholders |
shares |
| Common stock to be outstanding after this offering |
shares |
| Option to purchase additional shares |
The underwriters have an option to purchase a maximum of additional shares of common stock from us to cover sales by the underwriters of more than shares. The underwriters may exercise this option at any time within 30 days from the date of this prospectus. |
| Use of proceeds |
We expect to receive approximately $ million of net proceeds from the sale of the common stock offered by us, based upon an assumed initial public offering price of $ per share (the midpoint of the price range set forth on the cover page of this prospectus), after deducting underwriting discounts and estimated offering expenses payable by us. Each $1.00 increase (decrease) in the public offering price would increase (decrease) our net proceeds by approximately $ million. |
| We intend to use the net proceeds we receive from this offering to: |
| • | repay the note, which we refer to as the Chesapeake note, described under “Management’s Discussion and Analysis of Financial Condition and Results of Operations—Liquidity and Capital Resources—Debt Facilities and Notes—Chesapeake Note,” which as of March 31, 2015 had a principal amount outstanding of approximately $21.8 million; and |
| • | fund a portion of our capital expenditure budget through 2016 for drilling and developing our leasehold acreage, acquiring additional oil and natural gas leases, extending the expiration of our current leasehold acreage and acquiring 3D seismic data. |
| We will not receive any proceeds from the sale of shares by the selling stockholders. See “Use of Proceeds.” |
| Dividend policy |
After this offering, we do not anticipate paying cash dividends on our common stock in the foreseeable future. See “Dividend Policy.” |
| Listing |
We have applied to list our common stock on the New York Stock Exchange under the symbol “ENXP.” |
| Risk factors |
See “Risk Factors” beginning on page 17 for a discussion of factors you should consider before deciding to purchase shares of our common stock. |
11
Table of Contents
Unless otherwise indicated, all share information contained in this prospectus:
| • | assumes that the underwriters’ option to purchase additional shares, granted by us, will not be exercised; |
| • | does not include shares of common stock reserved for issuance under our 2012 Stock Incentive Plan; |
| • | gives effect to a -for-1 stock split that we will effect immediately prior to the completion of this offering; |
| • | gives effect to the automatic conversion of outstanding warrants into shares of our common stock at the completion of this offering on a net basis assuming an initial public offering price of $ per share; and |
| • | gives effect to the conversion of convertible notes into shares of our common stock upon completion of this offering assuming the conversion of all convertible notes and an initial public offering price of $ per share. A $1.00 increase in the initial public offering price per share would decrease the number of shares issuable upon conversion of the convertible notes by shares, and a $1.00 decrease in the initial public offering price per share would increase the number of shares issuable upon conversion of the convertible notes by shares. |
12
Table of Contents
Summary Historical and Pro Forma Consolidated Financial Data
Set forth below are our summary historical and pro forma consolidated financial data as of the dates and for the periods indicated. The summary historical consolidated financial data as of December 31, 2014 and 2013 and for the years ended December 31, 2014, 2013 and 2012 are derived from our audited consolidated financial statements included elsewhere in this prospectus.
The summary pro forma consolidated financial data as of and for the year ended December 31, 2014 are derived from the unaudited pro forma combined and consolidated financial statements included elsewhere in this prospectus. The summary pro forma combined and consolidated statement of operations data give effect to the following transactions as if they had occurred on January 1, 2014:
| • | the Ft. Trinidad acquisition; |
| • | the issuance of the $375.0 million principal amount of convertible notes; |
| • | the borrowing of $775.0 million under the senior secured term loan; |
| • | the conversion of the convertible notes into shares of our common stock upon completion of this offering, assuming an initial offering price of $ per share and that conversion rights are exercised with respect to all of the convertible notes; |
| • | the extinguishment of our senior unsecured notes; and |
| • | the automatic conversion of the outstanding warrants into shares of our common stock upon completion of this offering. |
The summary pro forma combined and consolidated balance sheet data give effect to the conversion of the convertible notes into shares of our common stock upon completion of this offering, assuming an initial offering price of $ per share and that conversion rights are exercised with respect to all of the convertible notes, and the automatic conversion of the outstanding warrants into shares of our common stock upon completion of this offering as if these conversions had occurred on December 31, 2014.
The summary pro forma combined and consolidated financial data are not necessarily indicative of what our results of operations or financial position would have been if the Pro Forma Transactions had actually occurred on the dates indicated or of our future results of operations or financial position.
13
Table of Contents
The information set forth below should be read together with “Management’s Discussion and Analysis of Financial Condition and Results of Operations” and the historical and pro forma financial statements and the notes thereto included elsewhere in this prospectus. The financial data included in this prospectus may not be indicative of our future results of operations, financial position and cash flows.
| Historical | Pro Forma | |||||||||||||||
| Year Ended December 31, |
Year Ended December 31, 2014 |
|||||||||||||||
| 2012 | 2013 | 2014 | ||||||||||||||
| (unaudited) | ||||||||||||||||
| (in thousands) | ||||||||||||||||
| Statement of operations data: |
||||||||||||||||
| Revenues |
$ | 216 | $ | 16,437 | $ | 145,381 | $ | 261,838 | ||||||||
| Operating expenses |
14,989 | 36,333 | 119,237 | 168,567 | ||||||||||||
| Income (loss) from operations |
(14,773 | ) | (19,896 | ) | 26,144 | 93,271 | ||||||||||
| Net income (loss) |
8,734 | (21,767 | ) | (6,187 | ) | 95,623 | ||||||||||
| Historical | Pro Forma | |||||||||||||||
| As of December 31, | As of December 31, 2014 |
|||||||||||||||
| 2012 | 2013 | 2014 | ||||||||||||||
| (unaudited) | ||||||||||||||||
| (in thousands) | ||||||||||||||||
| Balance sheet data: |
||||||||||||||||
| Cash and cash equivalents |
$ | 10,228 | $ | 3,569 | $ | 62,014 | $ | 62,014 | ||||||||
| Property, plant and equipment |
33,448 | 229,257 | 1,097,732 | 1,097,732 | ||||||||||||
| Total assets |
68,074 | 243,573 | 1,307,996 | 1,286,540 | ||||||||||||
| Long-term debt, net of discount |
14,191 | (1) | 168,336 | 1,097,988 | (2) | 774,216 | (2) | |||||||||
| Total equity |
28,564 | 30,265 | 29,201 | |||||||||||||
| (1) | Excludes $7.1 million reflected as current note payable. |
| (2) | Excludes $7.8 million reflected as current note payable. |
| Historical | ||||||||||||
| Year Ended December 31, |
||||||||||||
| 2012 | 2013 | 2014 | ||||||||||
| (in thousands) | ||||||||||||
| Other financial data: |
||||||||||||
| Net cash provided by (used in) operating activities |
$ | (11,072 | ) | $ | 19,946 | $ | 73,760 | |||||
| Net cash provided by (used in) investing activities |
12,911 | (164,482 | ) | (888,827 | ) | |||||||
| Net cash provided by financing activities |
2,992 | 137,877 | 873,512 | |||||||||
| Opening cash |
5,397 | 10,228 | 3,569 | |||||||||
| Closing cash |
10,228 | 3,569 | 62,014 | |||||||||
14
Table of Contents
Summary Reserve Data
The following table presents summary data with respect to our estimated net proved oil and natural gas reserves as of December 31, 2013 and December 31, 2014 and our estimated net probable and possible oil and natural gas reserves as of December 31, 2014. For additional information regarding our reserves, see “Business—Our Operations—Estimated proved, probable and possible reserves.” The estimates of our reserves as of December 31, 2013 and December 31, 2014 are based on reports prepared by Cawley, Gillespie & Associates, Inc., our independent reserve engineers. Reserve estimates were prepared in accordance with the rules and regulations of the SEC regarding oil and natural gas reserve reporting. All of the reserves shown in the table below are in the East Texas stacked play.
| As of December 31, 2013(1) |
As of December 31, 2014(1) |
|||||||
| Proved developed reserves: |
||||||||
| Oil (MBbl) |
1,947 | 13,948 | ||||||
| Natural gas (MMcf)(2) |
2,897 | 12,993 | ||||||
| Natural gas liquids (MBbl) |
— | 2,147 | ||||||
| Equivalent (MBoe) |
2,430 | 18,260 | ||||||
| Proved undeveloped reserves(3): |
||||||||
| Oil (MBbl) |
3,912 | 21,547 | ||||||
| Natural gas (MMcf)(2) |
4,292 | 17,495 | ||||||
| Natural gas liquids (MBbl) |
— | 2,858 | ||||||
| Equivalent (MBoe) |
4,627 | 27,321 | ||||||
| Proved reserves: |
||||||||
| Oil (MBbl) |
5,859 | 35,495 | ||||||
| Natural gas (MMcf)(2) |
7,188 | 30,487 | ||||||
| Natural gas liquids (MBbl) |
— | 5,004 | ||||||
| Equivalent (MBoe) |
7,057 | 45,580 | ||||||
| Total proved developed reserves as a percent of total proved reserves |
34 | % | 40 | % | ||||
| Oil as a percent of total proved reserves |
83 | % | 78 | % | ||||
| PV-10 (in thousands)(4) |
$ | 149,045 | $ | 1,483,140 | ||||
| Proved developed PV-10 as a percent of total PV-10 |
60 | % | 50 | % | ||||
| Probable reserves(5): |
||||||||
| Oil (MBbl) |
9,716 | |||||||
| Natural gas (MMcf) |
42,323 | |||||||
| Natural gas liquids (MBbl) |
4,715 | |||||||
| Equivalent (MBoe) |
21,484 | |||||||
| Oil as a percent of total probable reserves |
45 | % | ||||||
| PV-10 (in thousands)(4) |
$ | 237,929 | ||||||
| Possible reserves(5): |
||||||||
| Oil (MBbl) |
32,232 | |||||||
| Natural gas (MMcf) |
23,479 | |||||||
| Natural gas liquids (MBbl) |
4,026 | |||||||
| Equivalent (MBoe) |
40,171 | |||||||
| Oil as a percent of total possible reserves |
80 | % | ||||||
| PV-10 (in thousands)(4) |
$ | 519,607 | ||||||
| (1) | Our estimated proved, probable and possible reserves were determined using index prices for oil and natural gas without giving effect to derivative transactions, and were held constant throughout the life of the properties. The unweighted arithmetic average first-day-of-the-month prices for the twelve months ended |
15
Table of Contents
| December 31, 2014 and December 31, 2013 were $94.99/Bbl and $96.94/Bbl for oil, respectively, and $4.35/MMBtu and $3.67/MMBtu for natural gas, respectively. These prices were adjusted by well for gravity, quality, heating value, shrinkage, transportation and marketing. Including such adjustments, the prices as of December 31, 2014 and December 31, 2013 were $93.71/Bbl and $95.16/Bbl for oil, respectively, $4.04/Mcf and $3.39/Mcf for natural gas, respectively, and $31.35/Bbl for natural gas liquids as of December 31, 2014. |
| (2) | Includes immaterial amounts of natural gas liquids as of December 31, 2013. |
| (3) | As of December 31, 2014, includes 108 gross (95.7 net) vertical Buda-Rose drilling locations with simple average estimated ultimate recoveries of 293 MBoe gross (239 MBoe net) per well, average working interest of 88.6%, average net revenue interest of 82.3% and estimated gas shrinkage of 32%. Also includes 25 gross (24.7 net) vertical Edwards drilling locations and 15 gross (13.5 net) horizontal Woodbine and Eagle Ford drilling locations. |
| (4) | PV-10 is a non-GAAP financial measure. PV-10 of proved reserves is derived from the standardized measure of discounted future net cash flows (the Standardized Measure), which is the most directly comparable GAAP financial measure. PV-10 of proved reserves is equal to the Standardized Measure at the applicable date, before deducting estimated future income taxes, discounted at 10%. We believe that the presentation of PV-10 is relevant and useful to investors because it presents the relative monetary significance of our properties regardless of tax structure. Further, investors may utilize the measure as a basis for comparison of the relative size and value of our proved reserves to other companies. We use this measure when assessing the potential return on investment related to our oil and natural gas properties. However, PV-10 is not equal to, nor a substitute for, the Standardized Measure. Moreover, GAAP does not provide a measure of estimated future net cash flows for reserves other than proved reserves. PV-10 estimates for reserve categories other than proved use the relevant reserve volumes, but PV-10 is otherwise calculated using the same assumptions as those for, and in a manner consistent with, the calculation of Standardized Measure. We believe that PV-10 estimates for reserve categories other than proved present useful information for investors about the future net cash flows of our reserves in the absence of a comparable GAAP measure such as Standardized Measure. Investors should be cautioned that estimates of PV-10 of probable reserves, as well as the underlying volumetric estimates, are inherently more uncertain of being recovered and realized than comparable measures for proved reserves, and that the uncertainty for possible reserves is even more significant. Further, because estimates of probable and possible reserve volumes and PV-10 have not been adjusted for risk due to this uncertainty of recovery, they should not be summed arithmetically with each other or with comparable estimates for proved reserves. Our PV-10 and the Standardized Measure do not purport to present the fair value of our proved, probable or possible reserves. See “—Reconciliation of PV-10 to the Standardized Measure” below. |
| (5) | All of our estimated probable and possible reserves are classified as undeveloped. |
Reconciliation of PV-10 to the Standardized Measure
The Standardized Measure represents the present value of estimated future cash inflows from proved reserves, less future development, production and income tax expenses, discounted at 10% per annum to reflect timing of future cash flows. The following table provides a reconciliation of PV-10 of proved reserves to the GAAP financial measure of the Standardized Measure as of December 31, 2013 and December 31, 2014.
| As of December 31, | ||||||||
| 2013 | 2014 | |||||||
| (unaudited) (in thousands) | ||||||||
| Present value of estimated future net revenues (PV-10) |
$ | 149,045 | $ | 1,483,140 | ||||
| Future income taxes, discounted at 10% |
$ | (35,159 | ) | $ | (269,042 | ) | ||
|
|
|
|
|
|||||
| Standardized measure of discounted future net cash flows |
$ | 113,886 | $ | 1,214,098 | ||||
|
|
|
|
|
|||||
16
Table of Contents
An investment in our common stock involves significant risks. You should carefully consider the risks described below together with the other information set forth in this prospectus before making an investment decision. Our business, financial condition or results of operations could be materially adversely affected by any of these risks. The trading price of our common stock could decline due to any of these risks, and you may lose all or part of your investment.
Risks Related to the Oil and Natural Gas Industry and Our Business
A substantial or extended decline in oil, natural gas and natural gas liquids prices may adversely affect our business, financial condition or results of operations and our ability to meet our capital expenditure obligations and financial commitments.
The prices we will receive for our oil, natural gas and natural gas liquids will significantly affect our revenue, profitability, access to capital and future rate of growth. Oil and natural gas are commodities and, therefore, their prices are subject to wide fluctuations in response to relatively minor changes in supply and demand. Historically, the markets for oil and natural gas have been volatile. For example, for the five years ended March 31, 2015, the NYMEX—WTI oil price ranged from a high of $113.93 per Bbl to a low of $43.46 per Bbl, while the NYMEX—Henry Hub natural gas price ranged from a high of $6.15 per MMBtu to a low of $1.91 per MMBtu. Additionally, between July 2014 and March 2015, the NYMEX-WTI oil price fell from in excess of $100 per Bbl to below $45 per Bbl, the lowest price seen since 2009. These markets will likely continue to be volatile in the future. The prices we will receive for our production, and the levels of our production, will depend on numerous factors beyond our control. These factors include the following:
| • | worldwide and regional economic conditions impacting the global supply and demand for oil and natural gas; |
| • | the actions of the Organization of Petroleum Exporting Countries, or OPEC; |
| • | the price and quantity of imports of foreign oil and natural gas; |
| • | political conditions in or hostilities in oil-producing and natural gas-producing regions and related sanctions, including current conflicts in the Middle East and conditions in Africa, South America, Russia and Ukraine; |
| • | the level of global oil and domestic natural gas exploration and production; |
| • | the level of global oil and domestic natural gas inventories; |
| • | prevailing prices on local oil and natural gas price indexes in the areas in which we operate; |
| • | localized supply and demand fundamentals and gathering, processing and transportation availability; |
| • | weather conditions and natural disasters; |
| • | domestic and foreign governmental regulations; |
| • | authorization of exports from the United States of liquefied natural gas or oil; |
| • | speculation as to the future price of oil and the speculative trading of oil and natural gas futures contracts; |
| • | price and availability of competitors’ supplies of oil and natural gas; |
| • | technological advances affecting energy consumption; and |
| • | the price and availability of alternative fuels. |
Lower oil and natural gas prices will reduce our cash flows and our borrowing ability. Our business plan requires substantial additional capital, which we may be unable to raise on acceptable terms in the future, which may in turn limit our ability to develop our exploration and production plans. A substantial or extended decline in
17
Table of Contents
oil and natural gas prices may also reduce the amount of oil and natural gas that we can produce economically. Additionally, an extended decline in commodity prices could lead us to reduce our capital expenditure budget and scale back our drilling and development plans.
Oil prices have declined substantially from historical highs and may remain depressed for the foreseeable future. An extended period of depressed oil prices or additional decreases in prices may cause us to reduce our capital expenditure budget and scale back our drilling and development plans and adversely affect our cash flows, results of operations, financial position and the quantity and present value of our reserves, perhaps materially.
Between July 2014 and March 2015, the NYMEX-WTI oil price fell from in excess of $100 per Bbl to below $45 per Bbl, the lowest price seen since 2009. The reduction in price has been caused by many factors, including substantial increases in U.S. oil production and reserves from unconventional (shale) reservoirs, without an offsetting increase in demand. This environment could cause the prices for oil to remain at current levels or to fall to lower levels. Because of the decline in oil prices, we have reduced our capital expenditure budget and scaled back our drilling and development plans significantly from levels anticipated prior to the decline in prices. If prices for oil continue to remain depressed for lengthy periods or decline further, we may make further reductions in our capital expenditure budget and drilling and development plans. We also may be required to write down the value of our oil and natural gas properties, and some of our undeveloped locations may no longer be economically viable.
In addition, sustained low prices for oil may negatively impact the quantity and present value of our estimated proved reserves and the anticipated EURs of our wells. As required by SEC rules, our oil and natural gas reserves and the future net revenues from those reserves as of December 31, 2014 are based on the unweighted arithmetic average of the first-day-of the month price for the twelve months preceding December 31, 2014. Because of the recent decline in prices, that average price substantially exceeds current market prices. See “—The present value of future net revenues from our reserves will not necessarily be the same as the current market value of our estimated oil and natural gas reserves.”
These factors may materially adversely affect our cash flows, results of operations and financial position and the market price of our common stock.
Drilling for and producing oil and natural gas are high risk activities with many uncertainties that could adversely affect our business, financial condition or results of operations.
Our future financial condition and results of operations will depend on the success of our exploration, development and production activities. Our oil and natural gas exploration and production activities are subject to numerous risks beyond our control, including the risk that drilling will not result in commercially viable oil or natural gas production. Our decisions to purchase, explore, develop or otherwise exploit drilling locations or properties will depend in part on the evaluation of data obtained through geophysical and geological analyses, production data and engineering studies, the results of which are often inconclusive or subject to varying interpretations. Our costs of drilling, completing and operating wells are uncertain before drilling commences. In addition, the application of new techniques for horizontal fracture stimulation and completion, may make it more difficult to accurately estimate these costs. Overruns in budgeted expenditures are common risks that can make a particular project uneconomic. Further, many factors may curtail, delay or cancel our scheduled drilling projects, including the following:
| • | increases in the costs of, shortages of or delays in obtaining rigs, equipment, qualified personnel or other services; |
| • | facility or equipment malfunctions; |
| • | unexpected drilling conditions; |
| • | pressure or irregularities in geological formations; |
18
Table of Contents
| • | adverse weather conditions; |
| • | reductions in oil and natural gas prices; |
| • | delays imposed by or resulting from compliance with permitting and other regulatory requirements; |
| • | proximity to and capacity of gathering, processing and transportation facilities; |
| • | availability of water; |
| • | compliance with changing well integrity, environmental, health and safety, and other regulatory requirements; |
| • | environmental hazards, such as natural gas leaks, oil or salt water spills, pipeline and tank ruptures and unauthorized discharges of toxic gases or other pollutants into the environment, including the subsurface; |
| • | lost or damaged oilfield development and service tools; |
| • | pipe or cement failures, casing collapses or other downhole failures; |
| • | loss of drilling fluid circulation; |
| • | fires, blowouts, surface craterings and explosions; |
| • | uncontrollable flows of oil, natural gas or well fluids; |
| • | loss of leases due to incorrect payment of royalties; |
| • | title problems; and |
| • | limitations in the market for oil and natural gas. |
Our business plan requires additional capital, which we may be unable to raise on acceptable terms in the future, which may in turn limit our ability to pursue our exploration and production plans.
We expect our capital outlays and operating expenditures to increase substantially over the next several years as we expand our operations. Exploration and production plans are expensive, and we expect that we will need to raise substantial additional capital, through future private or public equity offerings, strategic alliances or debt financing.
Our future capital requirements will depend on many factors, including:
| • | the scope, rate of progress and cost of our exploration and production activities; |
| • | oil and natural gas prices; |
| • | our ability to locate and acquire hydrocarbon reserves; |
| • | our ability to produce oil or natural gas from those reserves; |
| • | the terms and timing of any drilling and other production-related arrangements that we may enter into; |
| • | fluctuations in our working capital needs; |
| • | interest payments and debt service requirements; |
| • | prevailing economic conditions; |
| • | the ability and willingness of banks and other lenders to lend to us; |
| • | our ability to access the equity and debt capital markets; |
| • | the cost and timing of governmental permits or approvals; and |
| • | the effects of competition by larger companies operating in the oil and natural gas industry. |
19
Table of Contents
We currently intend to finance our future capital expenditures primarily with the net proceeds from this offering, cash on hand, cash flows provided by operating activities, proceeds from asset divestitures and additional borrowings under our senior secured term loan, if available. We expect cash on hand and cash flows provided by operating activities based on current commodity prices will fully fund our 2015 capital expenditures budget. We expect that we will need to seek additional equity or debt financing to fund capital expenditures in excess of our current budget, which financing may not be available on favorable terms, or at all. Subject to obtaining the participation of existing or new lenders and other conditions, we may incur additional loans of up to $175 million under our senior secured term loan. We may not be able to obtain the participation of existing or new lenders or be able to satisfy the other conditions for additional loans under the senior secured term loan. Further, our cash flows from operating activities are uncertain and may be less than expected, as revenues from production are dependent on the success of our exploration and development activities. If additional financing is not available, we would be forced to curtail or delay our planned capital expenditures. The issuance of additional debt may require that a larger portion of our cash flows provided by operating activities be used for the payment of principal and interest on our debt, thereby reducing our ability to use cash flows to fund working capital, capital expenditures and acquisitions. If we succeed in selling additional equity securities to raise funds, at such time the ownership percentage of our existing stockholders would be diluted, and new investors may demand rights, preferences or privileges senior to those of our common stock. If we raise additional capital through debt financing, the financing may involve covenants that restrict our business activities. If we choose to farm-out interests in our prospects, we may lose operating control over such prospects.
If we are not successful in raising additional capital, we may be unable to continue our exploration and production activities or successfully exploit our oil and natural gas properties, and we may lose the rights to develop these oil and natural gas properties upon the expiration of our leases.
Drilling locations that we decide to drill may not yield oil in commercial quantities or quality, or at all.
We describe some of our potential drilling locations and our plans to explore those drilling locations in this prospectus. Our potential drilling locations are in various stages of evaluation, ranging from locations that are ready to drill to locations that will require substantial additional interpretation. There is no way to predict in advance of drilling and testing whether any particular location will yield oil or natural gas in sufficient quantities to recover drilling or completion costs or to be economically viable. The use of technologies and the study of producing fields in the same area will not enable us to know conclusively prior to drilling whether oil or natural gas will be present or, if present, whether oil or natural gas will be present in sufficient quantities to be economically viable. Even if sufficient amounts of oil or natural gas exist, we may damage the potentially productive hydrocarbon bearing formation or experience mechanical difficulties while drilling or completing the well, resulting in a reduction in production from the well or abandonment of the well. If we drill additional wells that we identify as dry holes, our drilling success rate may decline and materially harm our business. We cannot assure you that the analogies we draw from available data from other wells, more fully explored locations or producing fields will be applicable to our potential drilling locations. Further, drilling costs and initial production rates reported by other operators in the areas in which our properties are located may not be indicative of future or long-term drilling costs or production rates. Ultimately, the cost of drilling, completing and operating any well is often uncertain, and new wells may not be productive.
We may terminate our drilling program for a prospect if data, information, studies and previous reports indicate that the possible development of our prospect is not commercially viable and, therefore, does not merit further investment. If a significant number of our prospects do not prove to be successful, our business, financial condition and results of operations will be materially adversely affected.
20
Table of Contents
We have a limited operating history and our future performance is uncertain.
We are a company in the initial stages of exploration, development and exploitation of our leasehold acreage. Companies in their initial stages of development face substantial business risks and may suffer significant losses. We have generated substantial net losses and negative cash flows from operating activities since we adopted a business strategy to develop our undeveloped leasehold acreage and expect to continue to incur substantial net losses from operating activities until our production increases. In considering an investment in our securities, you should consider that there is only limited historical and financial operating information available upon which to base your evaluation of our performance. We face challenges and uncertainties in financial planning as a result of the unavailability of historical data and uncertainties regarding the nature, scope and results of our future activities. These challenges may be magnified as a result of the Ft. Trinidad acquisition. New companies must develop successful business relationships, establish operating procedures, hire staff, install management information and other systems, establish facilities and obtain licenses, as well as take other measures necessary to conduct their intended business activities. We may not be successful in implementing our business strategies or in completing the development of the infrastructure necessary to conduct our business as planned. In the event that one or more of our drilling programs is not completed or is delayed or terminated, our operating results will be adversely affected and our operations will differ materially from the activities described in this prospectus. As a result of industry factors or factors relating specifically to us, we may have to change our methods of conducting business, which may cause a material adverse effect on our results of operations and financial condition. The uncertainty and risks described in this prospectus may impede our ability to economically find, develop, exploit and acquire oil and natural gas reserves. As a result, we may not be able to achieve or sustain profitability or positive cash flows provided by our operating activities in the future.
The agreement governing the senior secured term loan contains covenants that may inhibit our ability to make certain investments, incur additional indebtedness or engage in certain other transactions, which could adversely affect our ability to meet our future goals.
The agreement governing the senior secured term loan contains covenants that, among other things, restrict:
| • | our investments, loans and advances and the payment of dividends and other restricted payments; |
| • | our incurrence of additional indebtedness; |
| • | the granting of liens other than certain permitted liens; |
| • | mergers, consolidations and sales of all or a substantial part of our business or properties; and |
| • | the sale of assets (other than production sold in the ordinary course of business). |
These covenants may restrict our ability to expand or pursue our business strategies. The agreement also contains financial covenants. The breach of any of these covenants could result in a default under the senior secured term loan. If an event of default occurs, the lenders could elect to declare all amounts borrowed, together with accrued interest, to be due and payable. If we were unable to repay such borrowings or interest, our lenders under the senior secured term loan could proceed against their collateral. If our indebtedness were to be accelerated, our assets may not be sufficient to repay in full such indebtedness.
Our level of indebtedness, which may increase, could reduce our financial flexibility.
As of December 31, 2014, on a pro forma basis giving effect to the effect to this offering, the use of a portion of the net proceeds of this offering to repay the Chesapeake note in full and the conversion of the convertible notes into shares of common stock upon completion of this offering, we would have had outstanding indebtedness net of debt discounts, of approximately $761 million, consisting of the senior secured term loan. In the future, we may incur significant indebtedness in order to develop our properties or to make future acquisitions. The terms of our senior secured term loan limit our ability to incur additional indebtedness, but those limitations are subject to significant exceptions.
21
Table of Contents
Our level of indebtedness could affect our operations in several ways, including the following:
| • | a significant portion of our cash flows will be used to service our indebtedness; |
| • | a high level of debt increases our vulnerability to general adverse economic and industry conditions; |
| • | the covenants contained in the agreement governing our senior secured term loan will, and the terms of our future indebtedness may, limit our ability to borrow additional funds, dispose of assets, pay dividends and make certain investments; |
| • | our debt covenants may also affect our flexibility in planning for, and reacting to, changes in the economy and in our industry; |
| • | a high level of debt may place us at a competitive disadvantage compared to our competitors that are less leveraged and, therefore, may be able to take advantage of opportunities that our indebtedness would prevent us from pursuing; and |
| • | a high level of debt may impair our ability to obtain additional financing in the future for working capital, capital expenditures, acquisitions, general corporate expenses or other purposes. |
A high level of indebtedness would increase the risk that we may default on our debt obligations. Our ability to meet our debt obligations and to reduce our level of indebtedness will depend on our future performance.
General economic conditions, oil and natural gas prices and financial, business and other factors affect our operations and our future performance. Many of these factors are beyond our control. We may not be able to generate sufficient cash flows to pay the interest on our debt and future working capital, borrowings or equity financing may not be available to pay or refinance such debt. Factors that will affect our ability to raise cash through an offering of our capital stock or a refinancing of our debt include financial market conditions, the value of our assets and our performance at the time we need capital.
Part of our strategy involves drilling in existing or emerging plays using some of the latest available horizontal drilling and completion techniques. The results of our planned exploratory drilling in these plays are subject to drilling and completion technique risks, and drilling results may not meet our expectations for reserves or production. As a result, we may incur material write-downs and the value of our undeveloped acreage could decline if drilling results are unsuccessful.
Our operations in the East Texas stacked play involve utilizing the latest drilling and completion techniques in order to maximize cumulative recoveries and therefore generate the highest possible returns. Risks that we may face while drilling include, but are not limited to, landing our well bore in the desired drilling zone, staying in the desired drilling zone while drilling horizontally through the formation, running our casing the entire length of the well bore and being able to run tools and other equipment consistently through the horizontal well bore. Risks that we may face while completing our wells include, but are not limited to, being able to fracture stimulate the planned number of stages, being able to run tools the entire length of the well bore during completion operations, staying in the desired formation when fracturing, and successfully cleaning out the well bore after completion of the final fracture stimulation stage.
The results of our drilling in new or emerging formations will be more uncertain initially than drilling results in areas that are more developed and have a longer history of established production. Newer or emerging formations and areas have limited or no production history and consequently we are less able to predict future drilling results in these areas.
Ultimately, the success of these drilling and completion techniques can only be evaluated over time as more wells are drilled and production profiles are established over a sufficiently long time period. If our drilling results are less than anticipated or we are unable to execute our drilling program because of capital constraints, lease expirations, access to gathering systems and limited takeaway capacity or otherwise, and/or natural gas and oil
22
Table of Contents
prices decline, the return on our investment in these areas may not be as attractive as we anticipate. Further, as a result of any of these developments we could incur material write-downs of our oil and natural gas properties and the value of our undeveloped acreage could decline in the future.
Our properties are geographically concentrated, making us disproportionately vulnerable to risks associated with operating in our areas of operation.
Our properties are geographically concentrated. All of our acreage is located primarily in two basins: the East Texas stacked play and the DJ Basin. The majority of our acreage is located in the East Texas stacked play, our primary area of operation. As a result of this concentration, we may be disproportionately exposed to the impact of events or circumstances in these areas (particularly in the East Texas stacked play) such as regional supply and demand factors, delays or interruptions of production from wells caused by governmental regulation, gathering, processing or transportation capacity constraints, market limitations, or interruption of the gathering, processing or transportation of oil, natural gas or natural gas liquids.
If oil and natural gas prices decrease, our development efforts are unsuccessful or our capital and operating costs increase substantially, we may be required to take write-downs of the carrying values of our oil and natural gas properties.
We employ the full cost method of accounting for our oil and natural gas properties which, among other things, imposes limits to the capitalized cost of our assets. The capitalized cost pool cannot exceed the net present value of the underlying oil and natural gas reserves. We will review our future proved oil and natural gas properties for impairment whenever events and circumstances indicate that a decline in the recoverability of their carrying value may have occurred. Based on specific circumstances at the time of prospective impairment reviews, and the continuing evaluation of development plans, production data, economics and other factors, we may be required to write down the carrying value of our oil and natural gas properties, which may result in a decrease in the amount available under future credit facilities. A write down constitutes a non-cash charge to earnings. We may incur impairment charges in the future, which could have a material adverse effect on our results of operations for the periods in which such charges are taken.
Our estimated reserves are based on many assumptions that may turn out to be inaccurate. Any significant inaccuracies in these reserve estimates or underlying assumptions will materially affect the quantities and present value of our reserves.
The process of estimating oil and natural gas reserves is complex. It requires interpretations of available technical data and many assumptions, including assumptions relating to current and future economic conditions and commodity prices. Any significant inaccuracies in these interpretations or assumptions could materially affect the estimated quantities and present value of reserves shown in this prospectus. See “Business—Our Operations—Estimated proved, probable and possible reserves” for information about our estimated oil and natural gas reserves.
In order to prepare estimates of our proved reserves, Cawley, Gillespie & Associates, Inc., our independent reserve engineers, must project production rates and the timing of development expenditures as well as analyze available geological, geophysical, production and engineering data. The extent, quality and reliability of this data can vary. The process also requires economic assumptions about matters such as oil and natural gas prices, drilling and operating expenses, capital expenditures, taxes and availability of funds. Although the reserve information contained in this prospectus is prepared by our independent reserve engineers, estimates of oil and natural gas reserves are inherently imprecise. Further, estimates of probable and possible reserves are inherently more uncertain than estimates of proved reserves.
Actual future production, oil and natural gas prices, revenues, taxes, development expenditures, operating expenses and quantities of recoverable oil and natural gas reserves will vary from our estimates. Any significant variance could materially affect the estimated quantities and present value of reserves shown in this prospectus.
23
Table of Contents
In addition, we may adjust estimates of proved, probable and possible reserves to reflect production history, results of exploration and development, prevailing oil and natural gas prices and other factors, many of which are beyond our control.
The present value of future net revenues from our reserves will not necessarily be the same as the current market value of our estimated oil and natural gas reserves.
You should not assume that the present value of future net revenues from our proved, probable and possible reserves is the current market value of our estimated oil and natural gas reserves. As required by SEC rules and regulations, we based the estimated discounted future net revenues from reserves as of December 31, 2012, December 31, 2013 and December 31, 2014 on the unweighted arithmetic average of the first-day-of-the-month price for the preceding twelve months without giving effect to derivative transactions as well as operating and development costs being incurred at the end of the reporting period. Consequently, it may not reflect the prices ordinarily received or that will be received for oil and natural gas production because of seasonal price fluctuations or other varying market conditions, nor may it reflect the actual costs that will be required to produce or develop the oil and natural gas properties. Accordingly, estimates included herein of future net cash flows may be materially different from the future net cash flows that are ultimately received. Estimates of future net cash flows from probable reserves, as well as the underlying volumetric estimates, are inherently more uncertain of being recovered and realized than comparable measures for proved reserves, and the uncertainty for possible reserves is even more significant. Because estimates of probable and possible reserve volumes and future net cash flows have not been adjusted for risk due to this uncertainty of recovery, they should not be summed arithmetically with each other or with comparable estimates for proved reserves. In addition, the ten percent discount factor, which is required by the SEC to be used in calculating discounted future net cash flows for reporting purposes, may not be the most appropriate discount factor based on interest rates in effect from time to time and risks associated with us or the oil and gas industry in general. Therefore, the estimates of discounted future net cash flows, Standardized Measure and PV-10 in this prospectus should not be construed as accurate estimates of the current market value of our proved, probable and possible reserves. Actual future net revenues from our oil and natural gas properties will be affected by factors such as:
| • | actual prices we receive for oil and natural gas; |
| • | actual cost of development and production expenditures; |
| • | the amount and timing of actual production; and |
| • | changes in governmental regulations or taxation. |
Actual future prices and costs may differ materially from those used in the present value estimates included in this prospectus.
Unless we replace our reserves with new reserves and develop those reserves, our future reserves and production will decline, which would adversely affect our future cash flows and results of operations.
Producing hydrocarbon reservoirs generally are characterized by declining production rates that vary depending upon reservoir characteristics and other factors. Unless we conduct successful ongoing exploitation, development and exploration activities or continually acquire properties containing reserves, our reserves will decline as reserves are produced. Our future oil and natural gas reserves and production, and therefore our future cash flow and results of operations, are highly dependent on our success in efficiently developing and exploiting our current reserves and economically finding or acquiring additional recoverable reserves. We may not be able to develop, exploit, find or acquire sufficient additional reserves to replace our production. If we are unable to replace our production, the value of our reserves will decrease, and our business, financial condition and results of operations would be adversely affected.
24
Table of Contents
Our business depends on oil and natural gas gathering and transportation facilities owned by third parties.
The marketability of our oil and natural gas production will depend in part on the availability, proximity and capacity of gathering, processing and pipeline systems owned by third parties. The unavailability of, or lack of, available capacity on these systems and facilities could result in the shut-in of producing wells or the delay, or discontinuance, of development plans for properties. We do not expect to purchase firm transportation on third-party facilities and, therefore, we expect the transportation of our production to be generally interruptible in nature and lower in priority to those having firm transportation arrangements. Federal and state regulation of oil and natural gas production and transportation, tax and energy policies, changes in supply and demand, pipeline pressures or quality standards, pipeline integrity requirements, damage to or destruction of pipelines and general economic conditions could adversely affect our ability to produce, gather and transport our oil and natural gas.
The disruption of third-party facilities due to maintenance, force majeure and/or weather could also negatively impact our ability to market and deliver our products. We have no control over when or if such facilities are restored by third-party owners or operators, or what prices will be charged for their services. A total shut-in of production resulting from the acts or omissions of third-party transportation providers, or circumstances affecting third-party transportation facilities, could materially affect us due to a lack of cash flow, and if a substantial portion of the price risk associated with production volumes is mitigated through commodity derivative instruments at lower than market prices, those commodity derivative settlements would have to be paid from borrowings absent sufficient cash flow.
The unavailability or high cost of additional drilling rigs, equipment, supplies, personnel and oilfield services could adversely affect our ability to execute our exploration and development plans within our budget and on a timely basis.
Shortages or the high cost of drilling rigs, equipment, supplies, personnel or oilfield services, particularly in the East Texas stacked play, could delay or adversely affect our exploration and development operations or cause us to incur significant expenditures that are not provided for in our capital budget, which could have a material adverse effect on our business, financial condition or results of operations. The cost to develop our projects has not been fixed and remains dependent upon a number of factors, including the completion of detailed cost estimates and final engineering, contracting and procurement costs. Our drilling and operation schedules may not proceed as planned and may experience delays or cost overruns. Any delays may increase the costs of the projects, requiring additional capital, and such capital may not be available on a timely and cost-effective fashion.
Market conditions or operational impediments may hinder our access to oil and natural gas markets or delay our production.
Market conditions or the unavailability of satisfactory oil and natural gas gathering, transportation and processing arrangements may hinder our access to oil and natural gas markets or delay our production. The availability of a ready market for our oil and natural gas production will depend on a number of factors, including the demand for and supply of oil and natural gas and the proximity of reserves to pipelines and terminal facilities. Our ability to market our production will depend, in substantial part, on the availability and capacity of gathering systems, processing and pipelines facilities owned and operated by third-parties. Our failure to obtain such services on acceptable terms could materially harm our business. We may be required to shut in wells due to lack of a market or inadequacy or unavailability of oil or natural gas pipelines or gathering system capacity. If our production becomes shut-in for any of these or other reasons, we would be unable to realize revenue from those wells until other arrangements were made to deliver the products to market.
25
Table of Contents
We may incur substantial losses or be subject to substantial liability claims as a result of our oil and natural gas operations. Additionally, we may not be insured for, or our insurance may be inadequate to protect us against, these risks.
Our oil and natural gas exploration and production activities are subject to the operating risks associated with drilling for and producing oil and natural gas, including the possibility of:
| • | environmental hazards, such as uncontrolled flows of oil, natural gas, brine, well fluids, toxic gas or other pollution into the environment, including groundwater contamination; |
| • | abnormally pressured formations; |
| • | mechanical difficulties, such as stuck oilfield drilling and service tools and casing collapse; |
| • | fires, explosions and ruptures of pipelines; |
| • | personal injuries and death; and |
| • | natural disasters. |
Any of these risks could adversely affect our ability to conduct operations or result in substantial losses to us as a result of:
| • | injury or loss of life; |
| • | damage to and destruction of property, natural resources or equipment; |
| • | pollution or other environmental damage; |
| • | regulatory investigations or penalties; |
| • | suspension of our operations; or |
| • | repairs or remediation costs. |
We are not insured against all risks. Losses and liabilities arising from uninsured and underinsured events could materially and adversely affect our business, financial condition or results of operations. We may elect not to obtain insurance if we believe that the cost of available insurance is excessive relative to the risks presented. In addition, pollution and environmental risks generally are not fully insurable. The occurrence of an event that is not fully covered by insurance could have a material adverse effect on our business, financial condition and results of operations.
Our potential drilling locations are expected to be drilled over several years, making them susceptible to uncertainties that could materially alter the occurrence or timing of their drilling. In addition, we may not be able to raise the substantial amount of capital that would be necessary to drill a substantial portion of our potential drilling locations.
We have provided information regarding potential drilling locations on our existing acreage. Our ability to drill and develop these locations is subject to a number of uncertainties, including the availability of capital, seasonal conditions, regulatory approvals, availability of drilling services and equipment, lease expirations, gathering systems, processing marketing and pipeline transportation constraints, oil and natural gas prices, drilling and production costs, drilling results and other factors. Additionally, our leases will expire if, prior to expiration of the initial term of such leases, we do not meet the production levels in the leases to hold the acreage. Because of these uncertainties and the potential for losing acreage where we have insufficient production to hold the acreage, we do not know if the potential drilling locations will ever be drilled or if we will be able to produce oil or natural gas from these or any other potential drilling locations. Pursuant to SEC rules and guidance, subject to limited exceptions, proved undeveloped reserves may only be booked if they relate to wells scheduled to be drilled within five years of the date of booking. SEC rules and guidance may limit our potential to book proved undeveloped reserves as we pursue our drilling program.
26
Table of Contents
Our acreage must be drilled before lease expiration, generally within three to five years, in order to hold the acreage by production. In the highly competitive market for acreage, failure to drill sufficient wells in order to hold acreage will result in a substantial lease renewal cost, or if renewal is not feasible, loss of our lease and prospective drilling opportunities.
Our leases on oil and natural gas properties typically have a primary term of three to five years, after which they expire unless, prior to expiration, production is established within the spacing units covering the undeveloped acres. As of March 31, 2015, we had leases representing 15,050 net acres expiring in 2015, 9,480 net acres expiring in 2016 and 22,184 net acres expiring thereafter, assuming that we exercise all available lease extension options on our East Texas stacked play and DJ Basin acreage. If our extension options expire and we have to renew such leases on new terms, we could incur significant cost increases, and we may not be able to renew such leases on commercially reasonable terms or at all. In addition, on certain portions of our acreage, third-party leases become immediately effective if our leases expire. As such, our actual drilling activities may materially differ from our current expectations, which could adversely affect our business.
We are not the operator on a portion of our acreage, and, therefore, we will not be able to control the timing of exploration or development efforts, associated costs, or the rate of production of any non-operated assets.
Although we are the operator on the majority of our acreage, we are not the operator on approximately 11,850 net acres in the East Texas stacked play as of March 31, 2015. As we carry out our exploration and development programs in the future, we may enter into arrangements with respect to existing or future drilling locations that result in additional drilling locations being operated by others. As a result, we may have limited ability to exercise influence over the operations of the drilling locations operated by our partners. Dependence on the operator could prevent us from realizing our target returns for those locations. The success and timing of exploration and development activities operated by our partners will depend on a number of factors that will be largely outside of our control, including:
| • | the timing and amount of capital expenditures; |
| • | the operator’s expertise and financial resources; |
| • | the approval of other participants in drilling wells; |
| • | the selection of technology; and |
| • | the rate of production of reserves, if any. |
This limited ability to exercise control over the operations of some of our drilling locations may cause a material adverse effect on our results of operations and financial condition.
Our use of 3D seismic data is subject to interpretation and may not accurately identify the presence of oil and natural gas, which could adversely affect the results of our drilling operations.
Even when properly used and interpreted, 3D seismic data and visualization techniques are only tools used to assist geologists in identifying subsurface structures and hydrocarbon indicators and do not enable the interpreter to know whether hydrocarbons are in fact present in those structures. In addition, the use of 3D seismic and other advanced technologies requires greater predrilling expenditures that traditional drilling strategies, and we could incur losses as a result of such expenditures. As a result, our drilling activities may not be successful or economical.
Our operations are substantially dependent on the availability of water and disposal of wastewater. Restrictions on our ability to obtain water and dispose of wastewater may have an adverse effect on our financial condition, results of operations and cash flows.
Water is an important component of deep shale oil and natural gas production during both the drilling and hydraulic fracturing processes. Drought conditions have persisted in Texas over the past several years. According to
27
Table of Contents
the Lower Colorado River Authority, from 2011 to 2014, Texas experienced some of the lowest inflows in recorded history. As a result of this severe drought, some local water districts have begun restricting the use of water subject to their jurisdiction for hydraulic fracturing in order to protect local water supply. If we are unable to obtain water to use in our operations from local sources, we may be unable to economically produce oil and natural gas, which could have an adverse effect on our financial condition, results of operations and cash flows.
Our oil and natural gas exploration and production operations generate wastewater, drilling muds and other waste streams, some of which may be disposed by injection in underground wells situated in non-producing subsurface formations. The drilling and operation of these injection wells are regulated by the SDWA and analogous state and local laws. The Underground Injection Well Program under the SDWA requires that we obtain permits from the EPA or delegated state agencies for our disposal wells, establishes minimum standards for injection well operations, restricts the types and quantities of fluids that may be injected and prohibits the migration of fluid containing any contaminants into underground sources of drinking water.
Our inability to dispose of or recycle wastewater generated from its exploration and production operations, or the imposition of new legal requirements relating to wastewater disposal could adversely impact our business, financial condition and results of operations.
We are subject to complex federal, state, local and other laws and regulations that could adversely affect the timing, cost, manner or feasibility of conducting our operations and expose us to significant liabilities.
Our ownership and operation of oil and natural gas properties are subject to complex and stringent laws and regulations. In order to conduct our operations in compliance with these laws and regulations, we must obtain and maintain numerous permits, approvals and certificates from various federal, state and local governmental authorities. We may experience delays in receiving such permits, approvals and certificates. Delays in permitting could result in delays in execution of our drilling and development program. We may incur substantial costs in order to maintain compliance with existing laws and regulations. In addition, our costs of compliance may increase if existing laws and regulations are revised or reinterpreted, or if new laws and regulations become applicable to our operations. Such changes could have a material adverse effect on our business, financial condition and results of operations. Failure to comply with laws and regulations applicable to our operations, including any evolving interpretation and enforcement by governmental authorities, could have a material adverse effect on our business, financial condition and results of operations.
See “Business—Regulation of the Oil and Natural Gas Industry” for a further description of the laws and regulations that affect us.
Restrictions on drilling activities intended to protect certain species or their habitat may adversely affect our ability to conduct drilling activities in some of the areas where we operate.
Oil and natural gas operations in our operating areas can be adversely affected by seasonal or permanent restrictions on drilling activities designed to protect various species and habitat. Seasonal restrictions may limit our ability to operate in protected areas and can intensify competition for drilling rigs, oilfield equipment, services, supplies and qualified personnel, which may lead to periodic shortages when drilling is allowed. These constraints and the resulting shortages or high costs could delay our operations and materially increase our operating and capital costs. Permanent restrictions imposed to protect species and habitat could prohibit drilling in certain areas or require the implementation of expensive mitigation measures.
The Endangered Species Act, or ESA, prohibits the harming of endangered or threatened species, provides for habitat protection and imposes stringent civil and criminal penalties for noncompliance. Complying with these protections could cause us to incur increased costs arising from species protection measures or could result in limitations, delays or prohibitions on our exploration and production activities that could have an adverse impact on our ability to develop and produce our reserves. Moreover, as a result of a settlement approved by the
28
Table of Contents
U.S. District Court for the District of Columbia on September 9, 2011, the U.S. Fish and Wildlife Service, or FWS, is required to consider listing numerous species as threatened or endangered under the ESA. For example, on March 27, 2014, the FWS announced the listing of the lesser prairie chicken, whose habitat is over a five-state region, including Texas where we operate, as a threatened species under the ESA. However, the FWS also announced a final rule that will limit regulatory impacts on landowners and businesses from the listing if those landowners and businesses have entered into certain range-wide conservation planning agreements, such as those developed by the Western Association of Fish and Wildlife Agencies, or WAFWA, pursuant to which such parties agreed to take steps to protect the lesser prairie chicken’s habitat and to pay a mitigation fee if its actions harm the lesser prairie chicken’s habitat. The final designation of previously unprotected species in areas where we operate as threatened or endangered could cause us to incur increased costs arising from species protection measures or could result in limitations, delays or prohibitions on our exploration and production activities that could have an adverse impact on our ability to develop and produce our reserves as well as on our business, financial condition and results of operation.
Our operations are subject to environmental and human health and safety laws and regulations that may expose us to significant costs and liabilities.
Our ownership and operation of oil and natural gas properties are subject to stringent and complex federal, state and local laws and regulations governing human health and safety aspects of our operations, the discharge of materials into the environment or otherwise relating to environmental protection. These laws and regulations may impose numerous obligations that are applicable to our operations including the acquisition of permits before conducting drilling, underground injection or other regulated activities; the restriction of types, quantities and concentration of materials that can be released into the environment; the limitation or prohibition of drilling activities on certain lands lying within wilderness, wetlands and other protected areas; the application of specific health and safety criteria addressing worker protection; and the imposition of substantial liabilities for pollution resulting from operations. Numerous governmental authorities, such as the U.S. Environmental Protection Agency, or the EPA, and analogous state agencies have the power to enforce compliance with these laws and regulations and the permits issued under them, oftentimes requiring difficult and costly actions. Failure to comply with these laws and regulations may result in the assessment of administrative, civil or criminal penalties; the imposition of investigatory or remedial obligations; and the issuance of injunctions limiting or preventing some or all of our operations.
There is inherent risk of incurring significant environmental costs and liabilities in the performance of our operations due to our handling of petroleum hydrocarbons and wastes, because of air emissions and wastewater discharges related to our operations, and as a result of historical industry operations and waste disposal practices.
Under certain environmental laws and regulations, we could be subject to joint and several, strict liability for the removal or remediation of previously released materials or property contamination regardless of whether we were responsible for the release or contamination or whether the operations were in compliance with all applicable laws at the time those actions were taken. Private parties, including the owners of properties upon which our wells are drilled and facilities where our petroleum hydrocarbons or wastes are taken for reclamation or disposal, may also have the right to pursue legal actions to enforce compliance as well as to seek damages for non-compliance with environmental laws and regulations or for personal injury or property damage.
In addition, the risk of accidental spills or releases could expose us to significant liabilities that could have a material adverse effect on our business, financial condition or results of operations. Changes in environmental laws and regulations occur frequently, and any changes that result in more stringent or costly well drilling, construction, completion or water management activities, or waste handling, storage, transport, disposal or cleanup requirements could require us to make significant expenditures to attain and maintain compliance and may otherwise have a material adverse effect on our own results of operations, competitive position or financial condition. We may not be able to recover some or any of these costs from insurance.
29
Table of Contents
Climate change laws and regulations restricting emissions of “greenhouse gases” could result in increased operating costs and reduced demand for the oil and natural gas that we produce while the physical effects of climate change could disrupt our production and cause us to incur significant costs in preparing for or responding to those effects.
On December 15, 2009, the EPA published its findings that emissions of carbon dioxide, methane and other “greenhouse gases” present an endangerment to human health and the environment because emissions of such gases are, according to the EPA, contributing to warming of the Earth’s atmosphere and other climatic changes. These findings by the EPA have allowed the agency to proceed with the adoption and implementation of regulations restricting emissions of greenhouse gases under existing provisions of the federal Clean Air Act.
Among other things, EPA regulations now require specified large greenhouse gas emitters in the United States, including companies in the energy industry, to annually report those emissions. Additionally, starting in 2011, new sources or modifications of existing sources of significant quantities of greenhouse gas emissions that are already subject to regulation as major sources of conventional pollutants are required to obtain permits—and to use best available control technology to control those emissions—pursuant to the Clean Air Act as a prerequisite to the development of that greenhouse gas emissions source. Such regulations may over time require us to incur costs to reduce emissions of greenhouse gases associated with our operations or could adversely affect demand for the oil and natural gas we produce. On January 14, 2015, the White House announced a goal to reduce methane emissions from the oil and gas sector by 40% to 45% from 2012 emission levels by 2025. That same day and in support of the effort, the EPA announced that it will release a proposed rule in the summer of 2015 that will directly regulate methane emissions from the oil and gas industry.
Additionally, from time to time over the past several years, the U.S. Congress has considered legislation to restrict or regulate emissions of greenhouse gases. In addition, a number of the states, either individually or through multi-state regional initiatives, address greenhouse gas emissions primarily through the development of emission inventories or regional greenhouse gas cap and trade programs. Although most of the state-level initiatives have to date been focused on large sources of greenhouse gas emissions, such as electric power plants, it is possible that smaller sources could become subject to greenhouse gas-related regulation. Depending on the particular program, we could be required to control emissions or to purchase and surrender allowances for greenhouse gas emissions resulting from our operations. Any future federal laws or implementing regulations that may be adopted to address greenhouse gas emissions could require us to incur increased operating costs and could adversely affect demand for the oil and natural gas we produce.
Finally, it should be noted that some scientists have concluded that increasing concentrations of greenhouse gases in the Earth’s atmosphere may produce climate changes that have significant physical effects, such as increased frequency and severity of storms, floods and other climatic events. If any such effects were to occur, they could have an adverse effect on our exploration and production operations. Significant physical effects of climate change could also have an indirect effect on our financing and operations by disrupting the transportation or process-related services provided by midstream companies, service companies or suppliers with whom we have a business relationship. We may not be able to recover through insurance some or any of the damages, losses or costs that may result from potential physical effects of climate change.
Federal and state legislative and regulatory initiatives relating to hydraulic fracturing could result in increased costs and operating restrictions or delays.
Hydraulic fracturing is an essential and common practice in the oil and natural gas industry used to stimulate production of natural gas and/or oil from dense subsurface rock formations. Hydraulic fracturing involves using water, sand and certain chemicals to fracture the hydrocarbon-bearing rock formation to allow flow of hydrocarbons into the wellbore. We expect to routinely apply hydraulic fracturing techniques in substantially all of our oil and natural gas drilling and completion programs. The process is typically regulated by state oil and natural gas commissions; however, the EPA has asserted federal regulatory authority over certain
30
Table of Contents
hydraulic fracturing activities using diesel under the Safe Drinking Water Act and in February 2014 released final guidance documents regarding the process for obtaining a permit for hydraulic fracturing involving diesel fuel pursuant to this regulatory authority.
Certain states, including Texas and Wyoming where we operate, have adopted, and other states are considering adopting, regulations that could impose more stringent permitting, public disclosure and well construction requirements on hydraulic fracturing operations or otherwise seek to ban fracturing activities altogether. In addition to state laws, local land use restrictions, such as city ordinances, may restrict or prohibit the performance of well drilling in general and/ or hydraulic fracturing in particular. The Texas legislature has introduced a bill that, if passed, would preempt local governments from enacting ordinances that limit or ban oil and gas operations. In the event state, local or municipal legal restrictions are adopted in areas where we are currently conducting, or in the future plan to conduct operations, we may incur additional costs to comply with such requirements that may be significant in nature, experience delays or curtailment in the pursuit of exploration, development or production activities, and perhaps even be precluded from the drilling of wells.
There are also certain governmental reviews that have been conducted or are either underway or being proposed that focus on environmental aspects of hydraulic fracturing practices. The White House Council on Environmental Quality is coordinating an administration-wide review of hydraulic fracturing practices, and a committee of the United States House of Representatives has conducted an investigation of hydraulic fracturing practices. Furthermore, a number of federal agencies are analyzing, or have been requested to review, a variety of environmental issues associated with hydraulic fracturing. The EPA has commenced a study of the potential environmental effects of hydraulic fracturing on drinking water and groundwater. The EPA released a progress report on this study in late 2012 and expects to release a draft report in 2015 for public comment and peer review and a final report in 2016. On May 19, 2014, EPA published in the Federal Register an Advanced Notice of Proposed Rulemaking under the Toxic Substances Control Act that seeks public comment on the types of information that should be reported or disclosed for hydraulic fracturing substances or mixtures and the mechanism for obtaining this information.
On March 31, 2015, the EPA released proposed pretreatment standards and effluent limitations applicable to the discharge of wastewater from hydraulic fracturing activities. On March 26, 2015, the U.S. Department of the Interior, Bureau of Land Management published a final rule imposing new requirements applicable to hydraulic fracturing operations conducted on federal lands. The final rule is set to become effective on June 24, 2015, and requires companies to publicly disclose the chemicals used in hydraulic fracturing operations after fracturing operations have been completed and includes provisions addressing well-bore integrity and wastewater management.
Further, on April 17, 2012, the EPA approved final rules that subject all oil and natural gas operations, including production, processing, transmission, storage and distribution activities to regulation under the New Source Performance Standards, or NSPS, and National Emission Standards for Hazardous Air Pollutants, or NESHAPS, programs. These rules also include NSPS standards for completions of hydraulically fractured gas wells. These standards include the reduced emission completion, or REC, techniques developed in EPA’s Natural Gas STAR program along with pit flaring of gas not sent to the gathering line. The REC standards are applicable to newly drilled and fractured wells as well as certain existing wells that are refractured. Further, the regulations under NESHAPS include maximum achievable control technology, or MACT, standards for those glycol dehydrators and storage vessels at major sources of hazardous air pollutants not currently subject to MACT standards. While these rules have been finalized, many of the rules’ provisions will be phased- in over time, with the more stringent requirements like REC not becoming effective until January 1, 2015.
Increased regulation and attention given to the hydraulic fracturing process could lead to greater opposition to, including litigation regarding, oil and natural gas production activities using hydraulic fracturing techniques. Additional legislation or regulation could also lead to operational delays or increased operating costs in the production of oil and natural gas, including from the developing shale plays, or could make it more difficult to
31
Table of Contents
perform hydraulic fracturing. The adoption of any federal, state or local laws or the implementation of regulations regarding hydraulic fracturing could potentially cause a decrease in the completion of new oil and natural gas wells, increased compliance costs and time, which could adversely affect our business, financial position, results of operations and cash flows.
Competition in the oil and natural gas industry is intense, making it more difficult for us to acquire properties, market oil and natural gas and secure trained personnel.
Our ability to acquire additional drilling locations and to find and develop reserves in the future will depend on our ability to evaluate and select suitable properties and to consummate transactions in a highly competitive environment for acquiring properties, obtaining gathering, processing and pipeline transportation services, marketing oil and natural gas and securing equipment and trained personnel. Also, there is substantial competition for capital available for investment in the oil and natural gas industry. Many of our competitors possess and employ financial, technical and personnel resources substantially greater than ours. Those companies may be able to pay more for productive oil and natural gas properties and exploratory drilling locations or to identify, evaluate, bid for and purchase a greater number of properties and locations than our financial or personnel resources permit.
Furthermore, these companies may also be better able to withstand the financial pressures of unsuccessful drilling attempts, sustained periods of volatility in financial and commodity markets and generally adverse global and industry-wide economic conditions, and may be better able to absorb the burdens resulting from changes in relevant laws and regulations, which would adversely affect our competitive position. In addition, companies may be able to offer better compensation packages to attract and retain qualified personnel than we are able to offer. The cost to attract and retain qualified personnel in the regions in which we operate has increased over the past few years due to competition and may increase substantially in the future. We may not be able to compete successfully in the future in acquiring prospective reserves, developing reserves, marketing hydrocarbons, attracting and retaining quality personnel and raising additional capital, which could have a material adverse effect on our business.
The loss of senior management or technical personnel could adversely affect our operations.
To a large extent, we depend on the services of our senior management and technical personnel who have extensive experience and expertise in evaluating and analyzing producing oil and natural gas properties and drilling prospects, maximizing production from oil and natural gas properties, marketing oil and natural gas production, and developing and executing acquisition, financing and hedging strategies. Our ability to hire and retain senior management and technical personnel is important to our continued success and growth. The unexpected loss of the services of one or more of these individuals could negatively impact our ability to execute our business strategy. We do not maintain, nor do we plan to obtain, any insurance against the loss of any of these individuals.
Changes in the differential between benchmark prices of oil and natural gas and the reference or regional index price used to price our actual oil and natural gas sales could have a material adverse effect on our results of operations and financial condition.
The reference or regional index prices that we will use to price our oil and natural gas sales sometimes will reflect a discount to the relevant benchmark prices. The difference between the benchmark price and the price we reference in our sales contracts is called a differential. We cannot accurately predict oil and natural gas differentials. Changes in differentials between the benchmark price for oil and natural gas and the reference or regional index price we reference in our sales contracts could have a material adverse effect on our results of operations and financial condition.
32
Table of Contents
Derivative activities could result in financial losses or could reduce our income.
To achieve more predictable cash flows and to reduce our exposure to adverse fluctuations in the prices of oil and natural gas, we have entered into and may in the future enter into additional derivative arrangements for a portion of our oil and natural gas production, including collars and fixed-price swaps. We may not designate our future derivative instruments as hedges for accounting purposes, in which case we would record all derivative instruments on our balance sheet at fair value. Changes in the fair value of derivative instruments are recognized in earnings. Accordingly, our earnings may fluctuate significantly as a result of changes in the fair value of our derivative instruments.
Derivative arrangements also expose us to the risk of financial loss in some circumstances, including when:
| • | production is less than the volume covered by the derivative instruments; |
| • | the counterparty to the derivative instrument defaults on its contract obligations; or |
| • | there is an increase in the differential between the underlying price in the derivative instrument and actual prices received. |
In addition, our commodity derivative transactions will expose us to credit risk in the event of default by counterparties. Further deterioration in the credit markets may impact the credit ratings of our potential counterparties and affect their ability to fulfill their obligations to us and their willingness to enter into future transactions with us. A default under any of these agreements could negatively impact our financial performance.
The agreement governing our senior secured term loan requires that we enter into commodity derivative contracts for specified minimum and maximum percentages of our anticipated future production and impose additional restrictions on our commodity hedging activities. These restrictions could limit our flexibility in managing our exposure to commodity price risk. See “Management’s Discussion and Analysis of Financial Condition and Results of Operations—Liquidity and Capital Resources—Debt Facilities and Notes—Senior Secured Term Loan.”
The adoption of derivatives legislation by Congress, and implementation of that legislation by federal agencies, could have an adverse impact on our ability to mitigate risks associated with our business.
On July 21, 2010, the President signed into law the Dodd-Frank Wall Street Reform and Consumer Protection Act, or the Dodd-Frank Reform Act, which, among other provisions, establishes federal oversight and regulation of the over-the-counter derivatives market and entities that participate in that market. The legislation required the Commodities Futures Trading Commission, or the CFTC, and the SEC to promulgate rules and regulations implementing the new legislation, which they have done since late 2010 and are expected to continue to do into 2015. From late 2010 and continuing to the present date, the CFTC has proposed dozens of rules implementing the Dodd-Frank Reform Act, and has promulgated most of the required final rules based on those proposals. Due to these new rules, it is increasingly clear that the costs of derivatives-based hedging for commodities will likely increase for all market participants. In addition, the Dodd-Frank Reform Act does not explicitly exempt end users from the requirements to post margin in connection with hedging activities. While several senators have indicated that it was not the intent of the Act to require margin from end users, the exemption is not in the Act. While rules proposed by the CFTC and federal banking regulators would allow for non-cash collateral and exemptions from margin for end users, the rules are not final and therefore some uncertainty remains. The full range of new Dodd-Frank requirements enacted, to the extent applicable to us or our derivatives counterparties, may result in increased costs and cash collateral requirements for the types of derivative instruments we use to mitigate and otherwise manage our financial and commercial risks related to fluctuations in natural gas, oil and NGL commodity prices. In addition, proposed rules that would impose federally-mandated position limits covering a wide range of derivatives positions, including non-exchange traded bilateral swaps related to commodities including oil and natural gas are being considered by the CFTC. If these position limits rules go into effect as proposed, they are likely to increase regulatory monitoring and compliance
33
Table of Contents
costs for all market participants, even where a given trading entity is not in danger of breaching position limits. These and other regulatory developments stemming from the Dodd-Frank Reform Act, including stringent new reporting requirements for derivatives positions and detailed criteria that must be satisfied to continue to enter into uncleared swap transactions, could have a material impact on our derivatives trading and hedging activities in the form of increased transaction costs and compliance responsibilities. Any of the foregoing consequences could have a material adverse effect on our financial position, results of operations and cash flows.
Declining general economic, business or industry conditions could have a material adverse effect on our results of operations.
Concerns over the worldwide economic outlook, geopolitical issues, the availability and cost of credit and the United States mortgage and real estate markets contributed to increased volatility and diminished expectations for the global economy. These factors, combined with volatile commodity prices, declining business and consumer confidence and increased unemployment resulted in a worldwide recession during the second half of 2008 and 2009. Concerns about global economic growth could have a significant adverse effect on global financial markets and commodity prices. If the economic climate in the United States or abroad were to deteriorate, demand for petroleum products could diminish, which could depress the prices at which we could sell our oil and natural gas and ultimately decrease our revenue and profitability.
Increased costs of capital could adversely affect our business.
Our business and operating results can be harmed by factors such as the availability, terms and cost of capital, increases in interest rates or a reduction in credit rating. Changes in any one or more of these factors could cause our cost of doing business to increase, limit our access to capital, limit our ability to pursue acquisition opportunities, reduce our cash flows available for drilling and place us at a competitive disadvantage. Recent and continuing disruptions and volatility in the global financial markets may lead to an increase in interest rates or a contraction in credit availability impacting our ability to finance our operations. We require continued access to capital. A significant reduction in the availability of credit could materially and adversely affect our ability to achieve our planned growth and operating results.
We may be subject to risks in connection with acquisitions, including the Ft. Trinidad acquisition, and the integration of significant acquisitions may be difficult.
We regularly evaluate acquisitions of reserves, properties, prospects and leaseholds and other strategic transactions that appear to fit within our overall business strategy. The successful acquisition of properties routinely requires an assessment of multiple factors, including:
| • | recoverable reserves; |
| • | future oil and natural gas prices and their appropriate differentials; |
| • | development and operating costs; and |
| • | potential environmental and other liabilities. |
The accuracy of these assessments is inherently uncertain. In connection with these assessments, we will perform a review of the subject properties that we believe to be generally consistent with industry practices. Our review will not reveal all existing or potential problems nor will it permit us to become sufficiently familiar with the properties to fully assess their deficiencies and potential recoverable reserves. Inspections may not always be performed on every well, and environmental problems are not necessarily observable even when an inspection is undertaken. Even when problems are identified, the seller may be unwilling or unable to provide effective contractual protection against all or part of the problems. We often do not hold rights to contractual indemnification for environmental liabilities and acquire properties on an “as is” basis. Although the purchase and sale agreement for the Ft. Trinidad acquisition includes certain representations and warranties of the sellers
34
Table of Contents
and requires the sellers to indemnify us for certain losses, these representations, warranties and indemnities are subject to significant limitations and may not protect us against all liabilities or other problems associated with the acquired properties.
Significant acquisitions and other strategic transactions may involve other risks, including:
| • | diversion of our management’s attention to evaluating, negotiating and integrating significant acquisitions and strategic transactions; |
| • | challenge and cost of integrating acquired operations, information management and other technology systems and business cultures with those of ours while carrying on our ongoing business; |
| • | difficulty associated with coordinating geographically separate organizations; and |
| • | challenge of attracting and retaining personnel associated with acquired operations. |
The process of integrating operations could cause an interruption of, or loss of momentum in, the activities of our business. Members of our senior management may be required to devote considerable amounts of time to this integration process, which will decrease the time they will have to manage our business. If our senior management is not able to effectively manage the integration process, or if any significant business activities are interrupted as a result of the integration process, our business could suffer.
Additionally, the success of a significant acquisition will depend, in part, on our ability to realize anticipated growth opportunities from combining the acquired assets or operations into our existing operations. Even if a combination is successful, it may not be possible to realize the full benefits we may expect in estimated proved reserves, production volume, cost savings from operating synergies or other benefits anticipated from an acquisition or realize these benefits within the expected time frame. Anticipated benefits of an acquisition may be offset by operating losses relating to changes in commodity prices, or in oil and natural gas industry conditions, or by risks and uncertainties relating to the exploratory prospects of the combined assets or operations, or an increase in operating or other costs or other difficulties. If we fail to realize the benefits we anticipate from an acquisition, our results of operations may be adversely affected.
Because of the size of the Ft. Trinidad acquisition relative to our previously existing operations, the foregoing risks related to acquisitions are magnified in connection with the Ft. Trinidad acquisition. The Ft. Trinidad acquisition substantially expanded the scope of our operations. Our failure to successfully adapt to the expanded scope of operations, integrate the acquired assets or realize the anticipated benefits of the Ft. Trinidad acquisition would have a material adverse effect on our business, financial condition and results of operations.
We may incur losses as a result of title defects in the properties in which we invest.
It is our practice in acquiring oil and natural gas leases or interests not to incur the expense of retaining lawyers to examine the title to the mineral interest. Rather, we rely upon the judgment of oil and natural gas lease brokers or landmen who perform the fieldwork in examining records in the appropriate governmental office before attempting to acquire a lease in a specific mineral interest.
Prior to the drilling of an oil or gas well, however, it is the normal practice in our industry for the person or company acting as the operator of the well to obtain a preliminary title review to ensure there are no obvious defects in title to the well. Frequently, as a result of such examinations, certain curative work must be done to correct defects in the marketability of the title, and such curative work entails expense. Our failure to cure any title defects may delay or prevent us from utilizing the associated mineral interest, which may adversely impact our ability in the future to increase production and reserves. Additionally, undeveloped acreage has greater risk of title defects than developed acreage, and a majority of our acreage is undeveloped. If there are any title defects or defects in assignment of leasehold rights in properties in which we hold an interest or that we acquire, we will suffer a financial loss.
35
Table of Contents
Cyber attacks targeting systems and infrastructure used by the oil and gas industry may adversely impact our operations.
Our business has become increasingly dependent on digital technologies to conduct certain exploration, development and production activities. We depend on digital technology to estimate quantities of oil and gas reserves, process and record financial and operating data, analyze seismic and drilling information, and communicate with our employees and third party partners. Unauthorized access to our seismic data, reserves information or other proprietary information could lead to data corruption, communication interruption, or other operational disruptions in our exploration or production operations. Also, computers control nearly all of the oil and gas distribution systems in the United States, which are necessary to transport our production to market. A cyber attack directed at oil and gas distribution systems could damage critical distribution and storage assets or the environment, delay or prevent delivery of production to markets and make it difficult or impossible to accurately account for production and settle transactions.
While we have not yet experienced any cyber attacks, there is no assurance that we will not suffer material losses relating to attacks in the future. Further, as cyber attacks continue to evolve, we may be required to expend significant additional resources to continue to modify or enhance our protective measures or to investigate and remediate any vulnerabilities to cyber attacks.
Certain federal income tax deductions currently available with respect to natural gas and oil exploration and development may be eliminated, and additional state taxes on natural gas extraction may be imposed, as a result of future legislation.
The Obama Administration’s budget proposal for fiscal year 2015 and legislation introduced in a prior session of Congress include proposals that would, if enacted, make significant changes to U.S. federal income tax laws, including the elimination of certain key U.S. federal income tax incentives currently available to oil and natural gas exploration and production companies. These changes include, but are not limited to, (1) the repeal of the percentage depletion allowance for oil and natural gas properties, (2) the elimination of current deductions for intangible drilling and development costs, (3) the elimination of the deduction for certain domestic production activities, and (4) an extension of the amortization period for certain geological and geophysical expenditures. It is unclear whether these or similar changes will be enacted and, if enacted, how soon any such changes could become effective.
The passage of any legislation as a result of these proposals or any other similar change in U.S. federal income tax law could eliminate or postpone certain tax deductions that are currently available with respect to oil and natural gas exploration and development, and any such change, as well as any changes to or the imposition of new state or local taxes (including the imposition of, or increase in, production, severance or similar taxes), could negatively affect our financial condition and results of operations.
Risks Related to This Offering and our Common Stock
The initial public offering price of our common stock may not be indicative of the market price of our common stock after this offering. In addition, an active liquid trading market for our common stock may not develop and our stock price may be volatile.
Prior to this offering, our common stock was not traded on any market. An active and liquid trading market for our common stock may not develop or be maintained after this offering. Liquid and active trading markets usually result in less price volatility and more efficiency in carrying out investors’ purchase and sale orders. The market price of our common stock could vary significantly as a result of a number of factors, some of which are beyond our control. In the event of a decline in the market price of our common stock, you could lose a substantial part or all of your investment in our common stock. The initial public offering price will be negotiated between us and representatives of the underwriters, based on the numerous factors which we discuss in the “Underwriting” section of this prospectus, and may not be indicative of the market price of our common stock
36
Table of Contents
after this offering. Consequently, you may not be able to sell shares of our common stock at prices equal to or greater than the price paid by you in the offering.
Additionally, the stock markets have experienced significant price and volume fluctuations. As a result, following this offering, the market price of our common stock may be volatile and may decline, including for reasons unrelated to our operating performance or prospects. The market price of our common stock could be subject to significant fluctuations in response to various factors or events, including among other things:
| • | our operating performance and the performance of other similar companies; |
| • | actual or anticipated differences in our operating results; |
| • | changes in our revenue or earnings estimates, if any, or recommendations by securities analysts; |
| • | publication of research reports about us or our industry by securities analysts; |
| • | additions and departures of key personnel; |
| • | strategic decisions by us or our competitors, such as acquisitions, divestments, spin-offs, joint ventures, strategic investments or changes in business strategy; |
| • | the passage of legislation or other regulatory developments that adversely affect us or our industry; |
| • | speculation in the press or investment community; |
| • | sales of our common stock by us or our stockholders, or the perception that such sales may occur; |
| • | actions by institutional stockholders; |
| • | changes in accounting principles; |
| • | terrorist acts; and |
| • | general market conditions, including fluctuations in commodity prices or factors unrelated to our performance. |
These factors may lower the trading price of our common stock, regardless of our actual operating performance. In addition, the stock markets, from time to time, experience extreme price and volume fluctuations that may be unrelated or disproportionate to the operating performance of companies. These broad fluctuations may lower the market price of our common stock.
Certain of our directors, executive officers and other members of management, and certain of our large stockholders have direct economic interests in some of our properties, and their interests may not be aligned with our interests.
Certain of our stockholders, directors, executive officers and other members of our management have overriding royalty interests relating to our existing oil and natural gas properties. These overriding royalty interests generally entitle them to percentages of the net revenue associated with sales of oil and natural gas produced from these oil and natural gas properties, without any corresponding responsibility for payment of any expenses other than certain taxes. These percentages range from 0% to 2.5% in the East Texas stacked play and 0% to 4.2% in the DJ Basin. Because the amounts of the overriding royalty interest percentages vary among our properties and do not apply to all of our properties, including properties acquired in the Chesapeake acquisition and the Ft. Trinidad acquisition, and will not apply to other properties acquired after completion of this offering, the overriding royalty interests may create conflicts of interest for our management in setting our exploration and development priorities. Since October 2012, we have not granted, and we do not intend to grant, additional overriding royalty interests with respect to our properties to our directors, executive officers or other employees.
37
Table of Contents
The concentration of our capital stock ownership by our largest stockholders will limit your ability to influence corporate matters.
Upon completion of this offering, we anticipate that Hunt Pettit, our founder, President and Chief Executive Officer, will own approximately % of our outstanding common stock and affiliates of Highbridge Principal Strategies, LLC, or Highbridge, will own approximately % of our outstanding common stock. Consequently, Mr. Pettit and Highbridge will continue to have substantial control over all matters that require approval by our stockholders, including the election of directors and approval of significant corporate transactions. Additionally, Mr. Pettit and Highbridge are entitled to nominate persons to serve on our Board of Directors, subject to their maintaining certain levels of ownership of our common stock. See “Management—Board of Directors.” Mr. Pettit and Highbridge may have interests that are different from other stockholders or holders of notes, and they could delay or prevent an acquisition or merger of our company even if the transaction could benefit our stockholders. Moreover, this concentration of our capital stock ownership and control makes it very difficult for other stockholders to replace directors and management without the consent of the controlling stockholders. In addition, this significant concentration of capital stock ownership may adversely affect the price prospective buyers are willing to pay for our common stock because investors often perceive disadvantages in owning stock in companies with controlling stockholders, which could, in turn, materially and adversely affect the trading price of our common stock.
Purchasers of common stock in this offering will experience immediate and substantial dilution of $ per share.
Based on an assumed initial public offering price of $ per share, purchasers of our common stock in this offering will experience an immediate and substantial dilution of $ per share in the pro forma net tangible book value per share of our common stock from the initial public offering price, and our pro forma net tangible book value as of December 31, 2014 after giving effect to this offering would be $ per share. See “Dilution” for a complete description of the calculation of pro forma net tangible book value.
Because we are a relatively small company, the requirements of being a public company, including compliance with the reporting requirements of the Exchange Act and the requirements of the Sarbanes-Oxley Act, may strain our resources, increase our costs and distract management; and we may be unable to comply with these requirements in a timely or cost-effective manner.
As a public company with listed equity securities, we will need to comply with certain laws, regulations and requirements, including corporate governance provisions of the Sarbanes-Oxley Act of 2002, related regulations of the SEC and the requirements of the New York Stock Exchange, or the NYSE, with which we are not required to comply as a private company. Complying with these statutes, regulations and requirements will occupy a significant amount of time of our board of directors and management and will significantly increase our costs and expenses. We will need to:
| • | institute a more comprehensive compliance function; |
| • | design, establish, evaluate and maintain a system of internal control over financial reporting in compliance with the requirements of Section 404 of the Sarbanes-Oxley Act of 2002 and the related rules and regulations of the SEC and the Public Company Accounting Oversight Board; |
| • | comply with rules promulgated by the NYSE; |
| • | prepare and distribute periodic public reports in compliance with our obligations under the federal securities laws; |
| • | establish new internal policies, such as those relating to disclosure controls and procedures and insider trading; |
| • | involve and retain to a greater degree outside counsel and accountants in the above activities; and |
| • | establish an investor relations function. |
38
Table of Contents
However, for as long as we remain an “emerging growth company” as defined in the JOBS Act, we may take advantage of certain exemptions from various reporting requirements that are applicable to other public companies that are not emerging growth companies. See “Summary—Implications of Being an Emerging Growth Company.” If we choose to take advantage of some or all of these reduced reporting requirements, the information that we provide to our stockholders may be different from information provided by other public companies.
While we believe our internal control over financial reporting has been effective at supporting our past financial reporting needs, it may not continue to be effective at reporting activities as a public company operating under our current business strategy. If one or more material weaknesses emerge related to reporting the activities related to our current business strategy, or if we otherwise fail to establish and maintain effective internal control over financial reporting, our ability to accurately report our financial results could be adversely affected.
Prior to completion of this offering, we have been a private company with limited accounting personnel to adequately execute our accounting processes and other supervisory resources with which to address our internal control over financial reporting. We believe our internal control over financial reporting was effective under our prior business strategy of acquiring and selling undeveloped leasehold acreage. In the first quarter of 2012, we adopted a business strategy to develop and exploit our undeveloped leasehold acreage, and accordingly implemented plans to enhance our financial reporting activities related to our current strategy and to meet the financial reporting requirements required of a public company. However, there is no certainty that as a result of our actions we will be able to maintain effective internal control over financial reporting.
Our independent registered public accounting firm is not required to formally attest to the effectiveness of our internal control over financial reporting under Section 404 of the Sarbanes-Oxley Act until the later of the year following our first annual report required to be filed with the SEC or the date we are no longer an emerging growth company. At such time, our independent registered public accounting firm may issue a report that is adverse in the event it is not satisfied with the level at which our controls are documented, designed or operating.
Effective internal controls are necessary for us to provide reliable financial reports, prevent fraud and operate successfully as a public company. If we cannot provide reliable financial reports or prevent fraud, our ability to accurately report our financial results could be adversely affected and our reputation and operating results would be harmed. We cannot be certain that our efforts to develop and maintain our internal controls will be successful, that we will be able to maintain adequate controls over our financial processes and reporting in the future or that we will be able to comply with our obligations under Section 404 of the Sarbanes-Oxley Act. Any failure to develop or maintain effective internal controls, or difficulties encountered in implementing or improving our internal controls, could harm our operating results or cause us to fail to meet our reporting obligations. Ineffective internal controls could also cause investors to lose confidence in our reported financial information, which would likely have a negative effect on the trading price of our shares of common stock.
We are an “emerging growth company,” and we cannot be certain whether the reduced disclosure requirements applicable to emerging growth companies will make our common stock less attractive to investors.
We are an “emerging growth company,” as defined in the JOBS Act, and we may take advantage of certain exemptions from various reporting requirements that are applicable to other public companies that are not emerging growth companies. See “Summary—Implications of Being an Emerging Growth Company.” We cannot predict whether investors will find our common stock less attractive because we may rely on these exemptions. If some investors find our common stock less attractive as a result, there may be a less active trading market for our common stock and our stock price may be more volatile.
39
Table of Contents
In addition, Section 107 of the JOBS Act provides that an emerging growth company may take advantage of the extended transition period provided in Section 7(a)(2)(B) of the Securities Act for complying with new or revised accounting standards. In other words, an emerging growth company may delay the adoption of certain accounting standards until those standards would otherwise apply to private companies. However, we are choosing to “opt out” of such extended transition period, and as a result, we will comply with new or revised accounting standards on the relevant dates on which adoption of such standards is required for non-emerging growth companies. Section 107 of the JOBS Act provides that our decision to opt out of the extended transition period for complying with new or revised accounting standards is irrevocable.
We do not intend to pay dividends on our common stock and, consequently, your only opportunity to achieve a return on your investment is if the price of our stock appreciates.
We do not plan to declare dividends on shares of our common stock in the foreseeable future. Additionally, the agreement governing the senior secured term loan places certain restrictions on our ability to pay cash dividends. Consequently, your only opportunity to achieve a return on your investment in us will be if the market price of our common stock appreciates, which may not occur, and you sell your shares at a profit. There is no guarantee that the price of our common stock that will prevail in the market after this offering will ever exceed the price that you pay.
We may invest or spend our net proceeds from this offering in ways with which you may not agree or in ways that may not yield a return.
A portion of the net proceeds from this offering is expected to be used for our capital expenditure budget. Our management will have considerable discretion in the application of our net proceeds, and you will not have the opportunity, as part of your investment decision, to assess whether the proceeds are being used appropriately. Until our net proceeds are used, they may be placed in investments that do not produce significant income or that may lose value.
Future sales of our common stock in the public market could lower our stock price, and any additional capital raised by us through the sale of equity or convertible securities will dilute your ownership in us.
We may sell additional shares of common stock in subsequent public offerings or otherwise issue additional shares of common stock or convertible securities. Assuming the underwriters do not exercise their option to purchase additional shares and giving effect to the conversion of all outstanding convertible notes and the exercise of outstanding warrants based on an assumed initial public offering price of $ per share, after the completion of this offering, we will have outstanding shares of common stock. Following the completion of this offering, our existing stockholders (including holders of convertible notes and warrants) will beneficially own shares, or % of our total outstanding shares, all of which will be restricted from immediate resale under the federal securities laws and shares of which will be subject to lock-up agreements described in “Underwriting,” but may be sold into the market in the future. Our existing stockholders and warrant holders (excluding holders of convertible notes) are parties to a registration rights agreement with us that will require us to effect the registration of their shares in certain circumstances no earlier than 180 days after the date of this prospectus. In addition, we are required to file a shelf registration statement that must be effective within 180 days after the closing of this this offering covering the resale of all shares of our common stock that are issued upon conversion of the convertible notes, other than the shares being sold in this offering.
As soon as practicable after this offering, we intend to file a registration statement with the SEC on Form S-8 providing for the registration of shares of our common stock reserved for issuance under our stock incentive plan. Subject to the satisfaction of vesting conditions, restrictions applicable to our affiliates under Rule 144 under the Securities Act and the expiration of lock-up agreements, shares registered under our registration statement on Form S-8 will be available for resale immediately in the public market without restriction.
40
Table of Contents
We cannot predict the size of future issuances of our common stock or the effect, if any, that future issuances and sales of shares of our common stock will have on the market price of our common stock. Sales of substantial amounts of our common stock (including shares issued in connection with an acquisition), or the perception that such sales could occur, may adversely affect prevailing market prices of our common stock.
Our amended and restated certificate of incorporation and amended and restated bylaws and Delaware law contain provisions that could discourage acquisition bids or merger proposals, which may adversely affect the market price of our common stock.
Our amended and restated certificate of incorporation authorizes our board of directors to issue preferred stock without stockholder approval. If our board of directors elects to issue preferred stock, it could be more difficult for a third party to acquire us. In addition, some provisions of our amended and restated certificate of incorporation and amended and restated bylaws could make it more difficult for a third party to acquire control of us, even if the change of control would be beneficial to and desirable by our stockholders, including:
| • | a classified board of directors, so that only approximately one-third of our directors are elected each year; |
| • | limitations on the removal of directors; |
| • | limitations on the ability of our stockholders to call special meetings; and |
| • | advance notice provisions for stockholder proposals and nominations for elections to the board of directors to be acted upon at meetings of stockholders. |
Furthermore, because we are incorporated in Delaware, we are governed by the provisions of Section 203 of the General Corporation Law of the State of Delaware, which prohibits, with some exceptions, stockholders owning in excess of 15% of our outstanding voting stock from engaging in business combination transactions with us. See “Description of Capital Stock—Anti-Takeover Effects of Provisions of Our Certificate of Incorporation, Our Bylaws and Delaware Law.”
We may issue preferred stock, the terms of which could adversely affect the voting power or value of our common stock.
Our amended and restated certificate of incorporation authorizes us to issue, without the approval of our stockholders, one or more classes or series of preferred stock having such designations, preferences, limitations and relative rights, including preferences over our common stock respecting dividends and distributions, as our board of directors may determine. The terms of one or more classes or series of preferred stock could adversely impact the voting power or value of our common stock. For example, we might grant holders of preferred stock the right to elect some number of our directors in all events or on the happening of specified events or the right to veto specified transactions. Similarly, the repurchase or redemption rights or liquidation preferences we might assign to holders of preferred stock could affect the residual value of our common stock.
Our amended and restated certificate of incorporation will designate the Court of Chancery of the State of Delaware as the sole and exclusive forum for certain types of actions and proceedings that may be initiated by our stockholders, which could limit our stockholders’ ability to obtain a favorable judicial forum for disputes with us or our directors, officers, employees or agents.
Our amended and restated certificate of incorporation will provide that, unless we consent in writing to the selection of an alternative forum, the Court of Chancery of the State of Delaware will, to the fullest extent permitted by applicable law, be the sole and exclusive forum for (i) any derivative action or proceeding brought on our behalf, (ii) any action asserting a claim of breach of a fiduciary duty owed by any of our directors, officers, employees or agents to us or our stockholders, (iii) any action asserting a claim against us or any director or officer or other employee of ours arising pursuant to any provision of the General Corporation Law of the State of Delaware, our amended and restated certificate of incorporation or our bylaws, or (iv) any action
41
Table of Contents
asserting a claim against us or any director or officer or other employee of ours that is governed by the internal affairs doctrine, in each such case subject to such Court of Chancery having personal jurisdiction over the indispensable parties named as defendants therein. Any person or entity purchasing or otherwise acquiring any interest in shares of our capital stock will be deemed to have notice of, and consented to, the provisions of our amended and restated certificate of incorporation described in the preceding sentence. This choice of forum provision may limit a stockholder’s ability to bring a claim in a judicial forum that it finds favorable for disputes with us or our directors, officers, employees or agents, which may discourage such lawsuits against us and such persons. Alternatively, if a court were to find these provisions of our amended and restated certificate of incorporation inapplicable to, or unenforceable in respect of, one or more of the specified types of actions or proceedings, we may incur additional costs associated with resolving such matters in other jurisdictions, which could adversely affect our business, financial condition or results of operations.
The underwriters of this offering may waive or release parties to the lock-up agreements entered into in connection with this offering, which could adversely affect the price of our common stock.
We, each of our executive officers and directors and certain of our existing stockholders (including the selling stockholders) have entered into lock-up agreements with respect to their common stock, pursuant to which they are subject to certain resale restrictions for a period of 180 days from the date of this prospectus. The representative of the underwriters, at any time and without notice, may release all or any portion of the common stock subject to the foregoing lock-up agreements. If the restrictions under the lock-up agreements are waived, then common stock will be available for sale into the public markets, which could cause the market price of our common stock to decline and impair our ability to raise capital.
If securities or industry analysts do not publish research or reports about our business, if they adversely change their recommendations regarding our common stock or if our operating results do not meet their expectations, our stock price could decline.
The trading market for our common stock will be influenced by the research and reports that industry or securities analysts publish about us or our business. We may not obtain research coverage of our common stock by securities and industry analysts. If one or more of these analysts cease coverage of our company or fail to publish reports on us regularly, we could lose visibility in the financial markets, which in turn could cause our stock price or trading volume to decline. Moreover, if one or more of the analysts who cover our company downgrades our common stock or publishes inaccurate or unfavorable research about our business or if our operating results do not meet their expectations, our stock price could decline. If one or more of these analysts ceases coverage of us or fails to publish reports on us regularly, demand for our common stock could decrease, which could cause our stock price and trading volume to decline.
42
Table of Contents
CAUTIONARY NOTE REGARDING FORWARD-LOOKING STATEMENTS
This prospectus contains forward-looking statements that are subject to a number of risks and uncertainties, many of which are beyond our control. All statements, other than statements of historical fact included in this prospectus, regarding our strategy, future operations, financial position, estimated revenues and losses, projected costs, prospects, plans and objectives of management are forward-looking statements. When used in this prospectus, the words “could,” “believe,” “anticipate,” “intend,” “estimate,” “expect,” “may,” “continue,” “predict,” “potential,” “project” and similar expressions are intended to identify forward-looking statements, although not all forward-looking statements contain such identifying words.
Forward-looking statements may include statements about our:
| • | discovery and development of oil and natural gas reserves; |
| • | cash flows and liquidity; |
| • | business and financial strategy, budget, projections and operating results; |
| • | oil and natural gas realized prices; |
| • | timing and amount of future production of oil and natural gas; |
| • | future net cash flows from reserves; |
| • | availability of drilling and production equipment; |
| • | availability of oil field labor; |
| • | amount, nature and timing of capital expenditures, including future development costs; |
| • | borrowing capacity under future credit facilities; |
| • | availability and terms of capital; |
| • | drilling and completion of wells; |
| • | competition; |
| • | marketing of oil and natural gas; |
| • | timing, location and size of property acquisitions; |
| • | expected benefits of the Ft. Trinidad acquisition; |
| • | costs of exploiting and developing our properties and conducting other operations; |
| • | general economic and business conditions; |
| • | effectiveness of our risk management activities; |
| • | environmental and other liabilities; |
| • | counterparty credit risk; |
| • | governmental regulation and taxation of the oil and natural gas industry; and |
| • | plans, objectives, expectations and intentions contained in this prospectus that are not historical. |
All forward-looking statements speak only as of the date of this prospectus. You should not place undue reliance on these forward-looking statements. Although we believe that our plans, objectives, expectations and intentions reflected in or suggested by the forward-looking statements we make in this prospectus are reasonable,
43
Table of Contents
we can give no assurance that these plans, objectives, expectations or intentions will be achieved. We disclose important factors that could cause our actual results to differ materially from our expectations under “Risk Factors” and “Management’s Discussion and Analysis of Financial Condition and Results of Operations” and elsewhere in this prospectus. These factors include risks related to:
| • | variations in the market demand for, and prices of, oil and natural gas; |
| • | estimates of oil and natural gas reserve data; |
| • | the adequacy of our capital resources and liquidity; |
| • | general economic and business conditions; |
| • | the Ft. Trinidad acquisition; |
| • | failure to realize expected value creation from property acquisitions; |
| • | uncertainties about our ability to replace reserves and economically develop our reserves; |
| • | risks related to the concentration of our operations; |
| • | drilling results; |
| • | potential financial losses or earnings reductions from our commodity price risk management programs; |
| • | potential adoption of new governmental regulations; and |
| • | our ability to satisfy future cash obligations and environmental costs. |
These cautionary statements qualify all forward-looking statements attributable to us or persons acting on our behalf.
44
Table of Contents
We expect to receive net proceeds of approximately $ million from the sale of our common stock, assuming an initial public offering price of $ per share (the midpoint of the price range set forth on the cover page of this prospectus) and after deducting estimated expenses payable by us and underwriting discounts and commissions. An increase or decrease in the initial public offering price of $1.00 per share of common stock would cause the net proceeds that we will receive from this offering, after deducting estimated expenses payable by us and underwriting discounts and commissions, to increase or decrease by approximately $ million. We will not receive any of the proceeds from the sale of shares of our common stock by the selling stockholders. We will pay all expenses related to this offering, other than the underwriting discount related to the shares sold by the selling stockholders.
We intend to use a portion of the net proceeds we receive from this offering to repay in full the Chesapeake note, which had an outstanding principal amount and accrued interest of approximately $21.8 million as of March 31, 2015. We intend to use the remainder of the net proceeds from this offering to fund a portion of our capital expenditure budget of $193 million for the period from April 1, 2015 through December 31, 2016. The capital expenditure budget includes approximately $60 million for the period from April 1, 2015 through December 31, 2015 and $115 million in 2016 for drilling and developing our leasehold acreage and approximately $5 million for the period from April 1, 2015 through December 31, 2015 and approximately $13 million in 2016 for other capital expenditures, including acquiring additional oil and natural gas leases, extending the expiration of our current leasehold acreage and acquiring 3D seismic data. We intend to fund the remainder of our capital expenditure budget with cash on hand and cash flows from operations.
The following table sets forth the expected sources and uses of funds for repayment of the Chesapeake note and our capital expenditure budget from April 1, 2015 through December 31, 2016.
| Sources of Funds ($ in millions) |
Uses of Funds ($ in millions) |
|||||||||
| Net proceeds from this offering |
$ | Repayment of Chesapeake note and interest(4) |
$ | 22 | ||||||
| Current cash and cash equivalents(1) |
32 | Remaining 2015 drilling and completion capital |
60 | |||||||
| Other potential sources(2) |
2016 drilling and completion capital |
115 | ||||||||
| Remaining other 2015 capital(5) |
5 | |||||||||
| Other 2016 capital(5) |
13 | |||||||||
|
|
|
|
|
|||||||
| Total sources of funds(3) |
$ | 215 | Total uses of funds(3) |
$ | 215 | |||||
|
|
|
|
|
|||||||
| (1) | As of April 27, 2015. |
| (2) | Other potential sources include cash flow from operations, proceeds from potential asset divestitures and/or future equity or debt financings. |
| (3) | Certain totals may not add due to rounding. |
| (4) | $21.8 million principal amount and accrued interest as of March 31, 2015. |
| (5) | Includes land acquisition, leasehold extension, seismic surveys and other capital. |
The ultimate amount of capital we will expend is largely discretionary and may fluctuate materially based on market conditions, commodity prices, the success of drilling operations, access to capital and other factors. Additionally, the timing and costs of drilling on our non-operated leasehold acreage in the East Texas stacked play generally will be within the control of the operator of the acreage.
45
Table of Contents
We do not anticipate declaring or paying any cash dividends to holders of our common stock in the foreseeable future. We currently intend to retain future earnings, if any, to finance the expansion of our business. Our future dividend policy is within the discretion of our board of directors and will depend upon various factors, including our results of operations, financial condition, capital requirements and investment opportunities. In addition, the agreement governing our senior secured term loan restricts our ability to pay cash distributions.
46
Table of Contents
The following table sets forth our capitalization as of December 31, 2014:
| • | on a historical basis; and |
| • | on a pro forma as adjusted basis giving effect to (1) this offering and the receipt of the net proceeds therefrom, (2) the use of a portion of the net proceeds to repay the Chesapeake note, (3) the conversion of all convertible notes into shares of our common stock assuming an initial public offering price of $ per share (the midpoint of the price range set forth on the cover page of this prospectus), and (4) the automatic conversion of outstanding warrants for shares of our common stock at the completion of this offering on a net basis assuming an initial public offering price of $ per share (the midpoint of the price range set forth on the cover page of this prospectus). |
You should read the following table in conjunction with “Use of Proceeds,” “Selected Consolidated Financial Data,” “Management’s Discussion and Analysis of Financial Condition and Results of Operations” and our historical and pro forma consolidated financial statements and related notes thereto appearing elsewhere in this prospectus.
| As of December 31, 2014 | ||||||||
| Historical | Pro Forma As Adjusted |
|||||||
| (in thousands) | ||||||||
| Cash and cash equivalents |
$ | 62,014 | $ | |||||
|
|
|
|
|
|||||
| Long-term debt, including current maturities: |
||||||||
| Senior secured term loan |
771,125 | (1) | 771,125 | (1) | ||||
| Convertible notes |
375,000 | (2) | — | |||||
| Chesapeake note |
21,325 | — | ||||||
|
|
|
|
|
|||||
| Total long-term debt, including current maturities |
1,167,450 | 771,125 | ||||||
| Stockholders’ equity: |
||||||||
| Preferred stock, $0.01 par value; shares authorized, no shares issued and outstanding |
— | — | ||||||
| Common stock, $0.01 par value; shares authorized, shares (Historical) and shares (Pro Forma As Adjusted) issued and outstanding |
5 | |||||||
| Additional paid-in capital |
47,752 | |||||||
| Accumulated deficit |
(18,556 | ) | ||||||
|
|
|
|
|
|||||
| Total stockholders’ equity |
29,201 | |||||||
|
|
|
|
|
|||||
| Total capitalization |
$ | 1,196,651 | $ | |||||
|
|
|
|
|
|||||
| (1) | Excludes estimated discount of approximately $10.5 million. |
| (2) | Excludes estimated discount of approximately $51.2 million related to the fair value of embedded derivatives related to the conversion and change of control features of the notes. See the notes to the consolidated financial statements included elsewhere in this prospectus. |
47
Table of Contents
Purchasers of our common stock in this offering will experience immediate and substantial dilution in the net tangible book value per share of the common stock for accounting purposes. Our net tangible book value as of December 31, 2014, after giving pro forma effect to the conversion of the convertible notes and outstanding warrants into shares of common stock upon completion of this offering, was approximately $ million, or $ per share of common stock. Pro forma net tangible book value per share is determined by dividing our pro forma tangible net worth (tangible assets less total liabilities) by the total number of outstanding shares of common stock outstanding immediately prior to the closing of this offering, after giving effect to the conversion of all convertible notes and the automatic conversion of outstanding warrants at the completion of this offering. After giving further effect to the sale of the shares in this offering and assuming the receipt of the estimated net proceeds (after deducting estimated discounts and expenses of this offering), our adjusted pro forma net tangible book value as of December 31, 2014 would have been approximately $ million, or $ per share. This represents an immediate increase in the net tangible book value of $ per share to our existing stockholders and an immediate dilution (i.e., the difference between the offering price and the adjusted pro forma net tangible book value after this offering) to new investors purchasing shares in this offering of $ per share. The following table illustrates the per share dilution to new investors purchasing shares in this offering:
| Assumed initial public offering price per share |
$ | |||
| Pro forma net tangible book value per share as of December 31, 2014 |
$ | |||
| Increase per share attributable to new investors in this offering |
$ | |||
|
|
|
|||
| As adjusted pro forma net tangible book value per share after giving effect to this offering |
||||
|
|
|
|||
| Dilution in pro forma net tangible book value per share to new investors in this offering |
$ | |||
|
|
|
The following table summarizes, on an as adjusted pro forma basis as of December 31, 2014, the total number of shares of common stock owned by existing stockholders and to be owned by new investors, the total consideration paid, and the average price per share paid by our existing stockholders and to be paid by new investors in this offering at $ , which is the midpoint of the range of the initial public offering prices set forth on the cover page of this prospectus, calculated before deduction of estimated underwriting discounts and commissions:
| Shares Acquired(1) | Total Consideration | Average Price Per Share |
||||||||||||||||
| Number |
Percent | Amount | Percent | |||||||||||||||
| Existing stockholders |
% | $ | % | $ | ||||||||||||||
| New investors |
% | % | ||||||||||||||||
|
|
|
|
|
|
|
|
|
|
||||||||||
| Total |
100.0 | % | $ | 100.0 | % | $ | ||||||||||||
|
|
|
|
|
|
|
|
|
|
||||||||||
| (1) | The number of shares disclosed for the existing stockholders includes (i) shares being sold by the selling stockholders, (ii) shares to be issued upon automatic conversion of outstanding warrants at the completion of this offering on a net basis assuming an initial public offering price of $ per share and (iii) shares to be issued upon conversion of the outstanding convertible notes assuming an initial public offering price of $ per share. The number of shares disclosed for the new investors does not include the shares being purchased by the new investors from the selling stockholders in this offering. |
48
Table of Contents
SELECTED CONSOLIDATED FINANCIAL DATA
Set forth below are our selected consolidated financial data as of the dates and for the periods indicated. The selected historical consolidated financial data as of December 31, 2012, 2013 and 2014 and for the years ended December 31, 2012, 2013 and 2014, are derived from our audited consolidated financial statements included elsewhere in this prospectus.
The information set forth below should be read together with “Management’s Discussion and Analysis of Financial Condition and Results of Operations” and the historical financial statements and the notes thereto included elsewhere in this prospectus. The financial data included in this prospectus may not be indicative of our future results of operations, financial position and cash flows.
| Year Ended December 31, |
||||||||||||
| 2012 | 2013 | 2014 | ||||||||||
| (in thousands) | ||||||||||||
| Statement of operations data: |
||||||||||||
| Revenues |
$ | 216 | $ | 16,437 | $ | 145,381 | ||||||
| Operating expenses |
14,989 | 36,333 | 119,237 | |||||||||
| Income (loss) from operations |
(14,773 | ) | (19,896 | ) | 26,144 | |||||||
| Net income (loss) |
8,734 | (21,767 | ) | (6,187 | ) | |||||||
| As of December 31, | ||||||||||||
| 2012 | 2013 | 2014 | ||||||||||
| (in thousands) | ||||||||||||
| Balance sheet data: |
||||||||||||
| Cash and cash equivalents |
$ | 10,228 | $ | 3,569 | $ | 62,014 | ||||||
| Property, plant and equipment |
33,448 | 229,257 | 1,097,732 | |||||||||
| Total assets |
68,074 | 243,573 | 1,307,996 | |||||||||
| Long-term debt, net of discount |
14,191 | (1) | 168,336 | 1,097,988 | (2) | |||||||
| Total equity |
28,564 | 30,265 | 29,201 | |||||||||
| (1) | Excludes $7.1 million reflected as current note payable |
| (2) | Excludes $7.8 million reflected as current note payable |
| Year Ended December 31, |
||||||||||||
| 2012 | 2013 | 2014 | ||||||||||
| (in thousands) | ||||||||||||
| Other financial data: |
||||||||||||
| Net cash provided by (used in) operating activities |
$ | (11,072 | ) | $ | 19,946 | $ | 73,760 | |||||
| Net cash provided by (used in) investing activities |
12,911 | (164,482 | ) | (888,827 | ) | |||||||
| Net cash provided by financing activities |
2,992 | 137,877 | 873,512 | |||||||||
| Opening cash |
5,397 | 10,228 | 3,569 | |||||||||
| Closing cash |
10,228 | 3,569 | 62,014 | |||||||||
49
Table of Contents
MANAGEMENT’S DISCUSSION AND ANALYSIS OF
FINANCIAL CONDITION AND RESULTS OF OPERATIONS
The following discussion and analysis of our financial condition and results of operations should be read in conjunction with our combined financial statements and related notes appearing elsewhere in this prospectus. The following discussion contains “forward-looking statements” that reflect our future plans, estimates, beliefs and expected performance. We caution that assumptions, expectations, projections, intentions, or beliefs about future events may, and often do, vary from actual results and the differences can be material. See “Risk Factors” and “Cautionary Note Regarding Forward-Looking Statements.”
Overview
We are an independent exploration and production company focused on the acquisition, exploration, development and exploitation of conventional and unconventional oil and natural gas resources. As of March 31, 2015, we owned approximately 79,179 net acres, primarily in two basins: the East Texas Basin where we are pursuing opportunities in the Lower Cretaceous formations of the Buda, Georgetown, Edwards and Glen Rose (the Buda-Rose play), the Woodbine sandstone, the Goodland limestone and the Eagle Ford shale, which we refer to collectively as the East Texas stacked play; and the Denver-Julesburg Basin in Wyoming, which we refer to as the DJ Basin. We target liquids-rich resource plays and have built our leasehold acreage position through direct acquisitions from mineral owners and other exploration and production companies. Our management team has extensive engineering, geological, geophysical and technical expertise in our operating areas.
As of December 31, 2014, we had total estimated proved reserves of 45,580 MBoe, 18,260 MBoe of which were developed and 27,321 MBoe of which were undeveloped and 78% of which were oil. See “Prospectus Summary—Summary Reserve Data.” Pro forma for the Ft. Trinidad acquisition, our average daily net production increased significantly from approximately 6,016 Boe/day for the three months ended March 31, 2014 to 11,933 Boe/day for the three months ended December 31, 2014 and to approximately 13,573 Boe/day for the three months ended March 31, 2015, as currently estimated.
Our primary area of focus is the East Texas stacked play, in which we owned approximately 63,080 net acres as of March 31, 2015. On July 22, 2014, we completed the purchase of approximately 18,300 net acres in the Ft. Trinidad field in the East Texas stacked play from TreadStone Energy Partners, LLC, including interests in 45 gross (43.5 net) producing wells and 10 gross (9.8 net) wells waiting on completion and a 3-well salt water disposal system and approximately 30 square miles of 3D seismic data, for a purchase price of approximately $700 million in cash, after post-closing adjustments. We refer to this transaction as the Ft. Trinidad acquisition. In connection with the consummation of the Ft. Trinidad acquisition, we borrowed $775 million under a senior secured term loan (referred to herein as the senior secured term loan) and issued $375 million principal amount of our 8.00% convertible subordinated notes due 2019 (referred to herein as our convertible notes). We used a portion of the $1.15 billion proceeds from the financings to pay the purchase price for the Ft. Trinidad acquisition, refinance and replace our previously outstanding $225 million principal amount of senior unsecured notes, including a prepayment premium. The results of operations of the Ft. Trinidad acquisition are included in our consolidated results of operations from the date of acquisition. The Ft. Trinidad acquisition has resulted in a substantial change in the scope of our operations, and we expect the acquisition and related financing to have a material impact on our future results of operations, financial position and cash flows. Accordingly, our historical results of operations and financial position discussed below may not be comparable with our future results of operations and financial position.
We are the operator of approximately 81% of our 63,080 net acres in the East Texas stacked play as of March 31, 2015 and of 99% of our proved developed producing reserves as of December 31, 2014. In addition to our acreage in the East Texas stacked play, as of March 31, 2015 we had approximately 14,162 net acres in the DJ Basin, where we have 100% operated working interests.
50
Table of Contents
Prior to the first quarter of 2012, we were engaged primarily in the acquisition and sale of undeveloped oil and natural gas leasehold interests. Beginning in the first quarter of 2012, we adopted a business strategy to develop and exploit our undeveloped leasehold acreage in order to provide a greater return on investments in those properties. At that time, we adopted the full cost method of accounting for oil and natural gas properties.
We began accumulating our leasehold acreage in our core areas in early 2011 and began development and exploitation of our acreage in the first quarter of 2012. In April 2013, we completed a significant acquisition of acreage in the East Texas stacked play, which we refer to as the Chesapeake acquisition. Our primary focus is now on the development of our operated acreage in the East Texas stacked play, and the majority of our capital expenditure budget for 2015 and 2016 is focused on the development of this acreage. We began drilling on our operated East Texas stacked play acreage in May 2013, and we have drilled or are in the process of drilling 60 gross (58.2 net) operated wells on this acreage as of March 31, 2015 In the Ft. Trinidad acquisition, we acquired interests in 45 gross (43.5 net) producing wells and 10 gross (9.8 net) wells waiting on completion as of July 22, 2014. As of March 31, 2015, 13 gross (12.9 net) wells were waiting on completion.
In August 2012, we completed a series of transactions that resulted in Energy & Exploration Partners, Inc. becoming a holding company for our business. We refer to these transactions as our corporate reorganization. See “Certain Relationships and Related Party Transactions—Corporate Reorganization.”
Factors that Significantly Affect Our Results and How We Evaluate Our Operations
As we continue to pursue our strategy of developing and exploiting our leasehold acreage, we expect that our results will be affected significantly by a number of factors, some of which are outside of our control. We discuss our performance based upon these factors and related operational metrics. These factors and metrics include the following, which we discuss in more detail below:
| • | production volumes; |
| • | realized prices on the sale of oil and natural gas, including the effect of our commodity derivative contracts; |
| • | operating expenses, including lease operating expenses, production taxes, general and administrative expense, impairment and depreciation, depletion and amortization; and |
| • | other income and expenses, including loss on early extinguishment of debt, interest expenses, loss on derivatives, gain on sale of assets and income tax expense. |
Production Volumes
Prior to completion of the Chesapeake acquisition and our subsequent development activity, we had minimal production. As a result of the Chesapeake acquisition during the second quarter of 2013, we acquired interests in nine producing wells, one well awaiting a pipeline connection and one non-producing well in the East Texas stacked play. Additionally, during the period from July 1, 2013 to March 31, 2015 we drilled 60 operated wells and participated in the drilling of six non-operated wells. As a result of these activities, our average daily net production from the East Texas stacked play has increased from 515 Boe/day for the year ended December 31, 2013 to 5,744 Boe/day for the year ended December 31, 2014. The Ft. Trinidad acquisition significantly increased our production, as we acquired interests in 45 gross (43.5 net) producing wells and 10 gross (9.8 net) wells waiting on completion as of July 22, 2014 in the Ft. Trinidad acquisition. Pro forma for the Ft. Trinidad acquisition, our average daily net production for the year ended December 31, 2014 was approximately 9,195 Boe/day. We expect to continue to increase production through further development of our East Texas stacked play acreage. For more information regarding production volumes and drilling plans, see “Business—Our Operations— Production, price and cost history” and “—Capital Budget.”
51
Table of Contents
Realized Prices on the Sale of Oil and Natural Gas
Factors Affecting the Sales Price of Oil and Natural Gas. We market and expect to continue to market our crude oil and natural gas production to a variety of purchasers based on regional pricing. The relative prices of crude oil and natural gas are determined by the factors impacting global and regional supply and demand dynamics, such as economic conditions, production levels, weather cycles and other events. In addition, relative prices are heavily influenced by product quality and location relative to consuming and refining markets.
Oil. The New York Mercantile Exchange—West Texas Intermediate (NYMEX-WTI) futures price is a widely used benchmark in the pricing of domestic crude oil in the United States. The actual prices realized from the sale of crude oil differ from the quoted NYMEX-WTI price as a result of quality and location differentials. Quality differentials to NYMEX-WTI prices result from the fact that crude oils differ from one another in their molecular makeup, which plays an important part in their refining and subsequent sale as petroleum products. Among other things, there are two characteristics that commonly drive quality differentials: (1) the crude oil’s American Petroleum Institute, or API, gravity and (2) the crude oil’s percentage of sulfur content by weight. In general, lighter crude oil (with higher API gravity) produces a larger number of lighter products, such as gasoline, which have higher resale value and, therefore, normally sell at a higher price than heavier oil. Crude oil with low sulfur content (“sweet” crude oil) is less expensive to refine and, as a result, normally sells at a higher price than high sulfur-content crude oil (“sour” crude oil).
Location differentials to NYMEX-WTI prices result from variances in transportation costs based on the produced crude oil’s proximity to the major consuming and refining markets to which it is ultimately delivered. Crude oil that is produced close to major consuming and refining markets, such as near Cushing, Oklahoma, is in higher demand as compared to crude oil that is produced farther from such markets. Consequently, crude oil that is produced close to major consuming and refining markets normally realizes a higher price (i.e., a lower location differential to NYMEX-WTI). We believe oil production from the East Texas stacked play can generally be sold at prices that are close to NYMEX-WTI benchmark prices due to the East Texas stacked play’s proximity to the Gulf Coast. For example, for the three months ended December 31, 2014, the average realized price for our oil production was $70.00/Bbl compared to production weighted average NYMEX-WTI index price of $71.73/Bbl for the same period.
In the past, crude oil prices have been extremely volatile, and we expect this volatility to continue. For example, the NYMEX-WTI oil price ranged from a high of $110.53/Bbl to a low of $86.68/Bbl during the year ended December 31, 2013 and from a high of $107.26/Bbl to a low of $53.27/Bbl during the year ended December 31, 2014. Subsequent to December 31, 2014, the NYMEX-WTI oil price declined to below $45/Bbl. As of April 15, 2015, the NYMEX-WTI oil price was $55.95/Bbl.
Natural Gas. The NYMEX-Henry Hub price of natural gas is a widely used benchmark for the pricing of natural gas in the United States. Similar to crude oil, the actual prices realized from the sale of natural gas differ from the quoted NYMEX-Henry Hub price as a result of quality and location differentials. Quality differentials to NYMEX-Henry Hub prices result from: (1) the Btu content of natural gas, which measures its heating value, and (2) the percentage of sulfur, CO2 and other inert content by volume. Wet natural gas with a high Btu content sells at a premium to low Btu content dry natural gas because it yields a greater quantity of natural gas liquids (NGLs). Natural gas with low sulfur and CO2 content sells at a premium to natural gas with high sulfur and CO2 content because of the added cost to separate the sulfur and CO2 from the natural gas to render it marketable.
Wet natural gas is processed in third-party natural gas plants, and residue natural gas as well as NGLs are recovered and sold. Dry natural gas residue from our properties is generally sold based on index prices in the region from which it is produced.
Location differentials to NYMEX-Henry Hub prices result from variances in transportation costs based on the natural gas’s proximity to the major consuming markets to which it is ultimately delivered. Also affecting the differential is the processing fee deduction retained by the natural gas processing plant generally in the form of percentage of proceeds. Generally, these index prices have historically been at a discount to NYMEX-Henry Hub natural gas prices.
52
Table of Contents
In the past, natural gas prices have been extremely volatile, and we expect this volatility to continue. For example, the NYMEX-Henry Hub natural gas price ranged from a high of $4.46 per MMBtu to a low of $3.11 per MMBtu during the year ended December 31, 2013 and from a high of $6.15 per MMBtu to a low of $2.89 per MMBtu during the year ended December 31, 2014.
Commodity Derivative Contracts. In October 2013, we began a commodity derivative policy designed to minimize volatility in our cash flows from changes in commodity prices. As of April 8, 2015, we had entered into crude oil derivative positions as follows:
| Year |
Month(s) | Type of Contract |
Pricing Index |
Volume (Bbl/d or MMBtu/d) |
Swap | Contract Price ($/Bbl or MMBtu) Weighted Average Price |
||||||||||||||||
| Floor | Ceiling | |||||||||||||||||||||
| Crude Oil |
||||||||||||||||||||||
| 2015 |
Apr—Dec | Collar | LLS | 200 | $ | — | $ | 81.00 | $ | 98.43 | ||||||||||||
| 2015 |
Apr—Jun | Collar | WTI | 3,650 | — | 79.06 | 99.39 | |||||||||||||||
| 2015 |
Apr | Swap | WTI | 2,000 | 69.00 | — | — | |||||||||||||||
| 2015 |
Jul—Dec | Collar | WTI | 3,650 | — | 55.14 | 99.39 | |||||||||||||||
| 2016 |
Jan—Dec | Collar | LLS | 200 | — | 71.75 | 100.43 | |||||||||||||||
| 2016 |
Jan—Dec | Collar | WTI | 2,500 | — | 51.08 | 98.96 | |||||||||||||||
| 2017 |
Jan—Dec | Swap | WTI | 2,000 | 68.25 | — | — | |||||||||||||||
| 2018 |
Jan—Dec | Swap | WTI | 2,000 | 68.25 | — | — | |||||||||||||||
The production volumes covered by our derivative positions represent approximately 47% of production projected through March 2017 from proved developed producing reserves in our December 31, 2014 reserve report. Between April 1 and April 9, 2015, we received a total of $34.5 million in cash from the settlement or restructuring of several of our commodity derivative positions. As of April 9, 2015 our commodity derivative contracts had a mark-to-market value of approximately $52 million. The agreement governing our senior secured term loan requires us to enter into commodity derivative instruments for specified minimum and maximum levels of anticipated production. Should we reduce our estimates of future production to amounts which are lower than our commodity derivative volumes, we will reduce our positions as soon as practical. If forward crude oil or natural gas prices increase to prices higher than the prices at which we have entered into commodity derivative positions, we may be required to make margin calls out of our working capital in the amounts those prices exceed the prices we have entered into commodity derivative positions. We do not intend to enter into commodity derivative transactions for the purpose of speculative trading.
Operating Expenses
Operating expenses consist of lease operating expense, production taxes, general and administrative expense, full cost ceiling impairment, impairment and abandonment of unproved properties and depreciation, depletion and amortization (DD&A). We discuss impairments and DD&A under the full cost method of accounting below under “—Critical Accounting Policies and Estimates—Oil and Natural Gas Properties.”
Lease Operating Expense. Lease operating expense consists primarily of oil and natural gas production expenses, ad valorem taxes and workover expenses.
Oil and natural gas production expenses are the costs incurred in the operation of producing properties and workover costs. We expect expenses for utilities, direct labor, water injection and disposal, and materials and supplies to comprise the most significant portion of our oil and natural gas production expenses. Oil and natural gas production expenses do not include general and administrative costs or production and other taxes. Certain items, such as direct labor and materials and supplies, generally remain relatively fixed across broad production volume ranges, but can fluctuate depending on activities performed during a specific period. For instance, repairs to our pumping equipment or surface facilities may result in increased oil and natural gas production expenses in periods during which they are performed.
53
Table of Contents
A majority of our operating cost components will be variable and increase or decrease as the level of produced hydrocarbons and water increases or decreases. For example, we will incur power costs in connection with various production related activities such as pumping to recover oil and natural gas and separation and treatment of water produced in connection with our oil and natural gas production. Over the life of hydrocarbon fields, the amount of water produced may increase for a given volume of oil or gas production, and, as pressure declines in natural gas wells that also produce water, more power will be needed to provide energy to artificial lift systems that help to remove produced water from the wells. Thus, production of a given volume of hydrocarbons may become more expensive each year as the cumulative oil and natural gas produced from a field increases until, at some point, additional production becomes uneconomic.
Ad valorem taxes are included in lease operating expense and are generally tied to the valuation of oil and natural gas properties; however, these valuations are reasonably correlated to revenues, excluding the effects of any commodity derivative contracts.
Production Taxes. Texas regulates the development, production, gathering and sale of oil and natural gas, including imposing production taxes and requirements for obtaining drilling permits. For oil production, Texas currently imposes a production tax of 4.6% of the market value of the oil produced and an additional 3/16 of one cent per barrel of crude petroleum produced, and for natural gas, Texas currently imposes a production tax of 7.5% of the market value of the natural gas produced.
General and Administrative Expense. Currently our general and administrative expense primarily consist of employee related costs, share-based compensation and professional fees. We expect that general and administrative expense will increase following the closing of this offering when we will be a publicly traded company. General and administrative expense related to being a publicly traded company includes: Exchange Act reporting expenses; expenses associated with Sarbanes-Oxley compliance; expenses associated with listing on a national securities exchange; independent auditor fees; legal fees; investor relations expenses; registrar and transfer agent fees; director and officer liability insurance costs; and director compensation.
Other Income and Expenses
Our other income and expenses consist primarily of loss on early extinguishment of debt, interest expense, loss on derivatives, gain on sale of assets and income tax benefit (expense).
Loss on Early Extinguishment of Debt. During each of 2013 and 2012, we paid off our indebtedness related to then-existing credit facilities. As a result, we recorded a loss on the early extinguishment of debt of $3.7 million and $1.0 million for the years ended December 31, 2013 and 2012, respectively. The loss recognized in both periods consists of a make-whole payment made to retire the debt and the elimination of unamortized debt issuance costs. Additionally, during July 2014, we refinanced and replaced our senior unsecured notes resulting in a loss of approximately $75.5 million on the early extinguishment of debt, including a prepayment penalty, which is reflected in our financial statements for the year ended December 31, 2014.
Interest Expense. We have financed and expect to continue to finance a portion of our working capital requirements, capital expenditures and acquisitions with borrowings under our debt facilities and notes. See “—Liquidity and Capital Resources—Debt Facilities and Notes.” As a result, we incur interest expense that is affected by both fluctuations in interest rates and our financing decisions. Interest expense includes interest paid to our lenders. In addition, we include the amortization of debt discounts, deferred financing costs (including origination and amendment fees), commitment fees and annual agency fees in interest expense. Due to the significant increase in our indebtedness as a result of the issuance of the convertible notes and the senior secured term loan, our interest expense increased significantly in the second half of 2014 and will be higher in the future in comparison to prior periods.
54
Table of Contents
Gain (Loss) on Derivatives. We initiated a commodity derivative policy during 2013 to utilize various derivative instruments to economically hedge our exposure to oil and natural gas price volatility. Additionally, the agreement governing our senior secured term loan requires us to enter into commodity derivative instruments for a minimum of 40% and maximum of 80% of anticipated production from our proved reserves. During 2013 and 2014 we entered into arrangements for fixed price swaps and costless collars (puts and calls) to economically hedge future oil and natural gas prices and comply with our debt instrument requirements. We have not designated any of our derivative instruments as hedges; therefore, the derivatives are carried at fair value on the consolidated balance sheets as assets or liabilities, and all changes in fair value are recorded as gains and losses in the statements of operations.
Our convertible notes contain a conversion feature allowing holders to convert all or part of the convertible notes into shares of our common stock upon the closing of a qualified public offering. The convertible notes also contain a put option feature allowing holders to require us to repurchase for cash all or part of the outstanding convertible notes if we undergo a change of control. The embedded features meet the definition of a derivative under ASC 815 and require bifurcation and are accounted for as a separate combined derivative. The fair value of the embedded derivative are measured and recorded at fair value each subsequent reporting period and changes in fair value are recognized in the statement of operations as a gain or loss on derivatives.
During the year ended December 31, 2013, we experienced a loss on commodity derivative instruments of $0.7 million, of which $0.6 million related to a decrease in the fair market value of the commodity derivatives and $0.1 million related to realized loss on the commodity derivatives. During the year ended December 31, 2014, we experienced a gain on derivatives of $106.2 million of which $4.5 million related to realized gains on commodity derivatives, $63.7 million in gains related to the change in fair market value of commodity derivative instruments and $38.0 million related to the change in fair market value of the embedded derivative.
Gain on Sale of Assets. During 2014, 2013 and 2012, we entered into agreements pursuant to which we sold working interests in our DJ Basin properties located in Colorado and a substantial portion of the East Texas stacked play acreage we owned prior to the Chesapeake acquisition. Our results include gains on the sale of assets related primarily to these this transactions.
Income Tax Expense. Prior to April 13, 2012, our properties were owned by Energy & Exploration Partners, LLC, or ENXP LLC, a limited liability company that elected to be taxed as an S corporation and therefore was not a taxable entity and did not directly pay federal income taxes. Accordingly, no provision for federal corporate income taxes has been provided for the period from February 14, 2006, the date of our inception, to December 31, 2011, or for the period from January 1, 2012 to April 13, 2012, as taxable income was allocated directly to our equity holders.
Our income tax expense in our historical financial statements for periods prior to April 13, 2012 results from the State of Texas margin tax that applies to entities organized as partnerships or limited liability companies.
On April 13, 2012, ENXP LLC terminated its election to be treated as an S corporation and became a C corporation for federal income tax reporting purposes. Accordingly, as of that date we became, and after our corporate reorganization continue to be, subject to federal income taxes, which may affect future operating results and cash flows. In connection with our becoming a C corporation, an estimated net deferred tax liability of approximately $1.1 million was established for differences between the book and tax basis of our assets and liabilities and a corresponding expense was recorded to net income from operations.
Our income tax subsequent to April 13, 2012 included provisions for both federal and state income tax benefits (expenses) using the asset and liability method wherein deferred tax assets and liabilities are recognized for the future tax consequences attributable to differences between financial statement carrying amounts and the respective tax basis of the existing assets and liabilities as measured using enacted tax rates applicable to each tax jurisdiction. Additionally, we include penalty and interest expenses assessed on tax filings in income tax expense.
55
Table of Contents
Results of Operations
The discussion of our results of operations and period to period comparisons presented below analyze our historical results, which may not be indicative of future results. The Ft. Trinidad acquisition substantially expanded the scope of our operations, and we expect it to have a material impact on our future results of operations. Accordingly, our historical results of operations discussed below may not be comparable with our future results of operations.
Year Ended December 31, 2014 Compared to Year Ended December 31, 2013
Production and Oil and Natural Gas Sales
The following table summarizes our oil and natural gas production volumes and average sales prices for the years ended December 31, 2014 and 2013.
| Year Ended December 31, | ||||||||
| 2013 | 2014 | |||||||
| Production Volumes: |
||||||||
| Oil (Bbls) |
161,579 | 1,598,069 | ||||||
| Natural gas liquids (Bbls) |
5,123 | 258,490 | ||||||
| Natural gas (Mcf) |
128,603 | 1,440,870 | ||||||
| Total (BOE) |
188,136 | 2,096,704 | ||||||
| Average realized prices: |
||||||||
| Oil (Bbls) |
$ | 98.02 | $ | 82.67 | ||||
| Natural gas liquids (Bbls) |
26.02 | 30.49 | ||||||
| Natural gas (Mcf) |
3.62 | 3.74 | ||||||
| Total (BOE) |
87.37 | 69.34 | ||||||
Oil and gas sales increased $129.0 million during the year ended December 31, 2014 to $145.4 million compared to $16.4 million for the prior year. The increase was primarily due to increased production resulting from the acquisition of our Ft. Trinidad assets in July 2014, including new production from wells completed post acquisition. The increase in revenue due to production was partially offset by a decrease in commodity prices during 2014 compared to the prior period.
The average realized sales price for oil was $82.67/Bbl for the year ended December 31, 2014, a decrease of 16%, compared to $98.02/Bbl for 2013. The price received on our oil sales during the year ended December 31, 2014 of $82.67/Bbl was the average months’ NYMEX-WTI prices adjusted for differentials determined on a locational basis and other market factors. The simple daily average NYMEX-WTI price for the year ended December 31, 2014 was $92.91/Bbl.
The average realized sales price for natural gas was $3.74/Mcf for the year ended December 31, 2014, an increase of 3%, compared to $3.62/Mcf for 2013. The price received on our natural gas sales during year ended December 31, 2014 of $3.74/Mcf was the average month’s Henry Hub natural gas spot price adjusted for differentials determined on a locational basis, liquids Btu content and other market factors. The simple daily average Henry Hub natural gas spot price for the year ended December 31, 2014 was $4.26/Mcf.
Operating Expenses
Lease Operating Expense. Lease operating expense was $26.7 million for the year ended December 31, 2014, compared to $3.2 million for the year ended December 31, 2013. The increase in lease operating expense was due to the increase in the number of wells producing during 2014, primarily due to the acquisition of our Ft. Trinidad assets in July 2014 and new wells drilled during 2014.
Production Taxes. Production taxes increased by approximately $6.1 million from $0.9 million for the year ended December 31, 2013 to $7.0 million for the year ended December 31, 2014. The increase was primarily due
56
Table of Contents
to an increase in revenues. Production volumes sold increased from 188,136 Boe during 2013 to 2,096,704 Boe during 2014, primarily due to the acquisition of our Ft. Trinidad assets in July 2014. Production taxes were approximately 5% of oil and natural gas sales during 2014 and the prior period.
Full-Cost Ceiling Impairment. We did not record a full cost ceiling impairment for the year ended December 31, 2014. Full cost ceiling impairment was $8.4 million for the year ended December 31, 2013 due to an $8.4 million excess in carrying costs associated with our oil and natural gas properties over the estimated ceiling limit on the book value of our oil and natural gas properties during the first quarter of 2013. Prior to the Chesapeake acquisition and the full implementation of our 2013 drilling program, we had reserves on a limited number of properties, which resulted in a low limit of our ceiling threshold. We participated in the drilling of two non-operated wells that were dry holes during the first quarter of 2013 that were included in the full cost pool with no corresponding reserves recorded. The dry hole costs were the primary contributor to the first quarter 2013 full-cost ceiling impairment.
General and Administrative Expense. General and administrative expense increased by approximately $2.4 million from $16.9 million for the year ended December 31, 2013 to $19.3 million for the year ended December 31, 2014. This increase was primarily due to an increase in employee and employee related costs of $10.4 million, third party professional fees and other outside services of $3.2 million and other net administrative costs of $1.0 million for the year ended December 31, 2014 compared to the year ended December 31, 2013, primarily related to our expanding employee base and the growth in our business. These increases were partially offset by a $8.1 million decrease in share based compensation expense for the year ended December 31, 2014 compared to the same period in 2013, primarily due to certain shares fully vesting in prior periods, and a $4.1 million increase in employee related and miscellaneous costs capitalized to oil and gas properties due to the increase in our drilling program during 2014.
Depletion, Depreciation and Amortization Expenses. Depletion, depreciation and amortization increased by approximately $59.3 million from $6.9 million for the year ended December 31, 2013 to $66.2 million for the year ended December 31, 2014. The increase is due to an increase in production during 2014 compared to the prior period, primarily due to the acquisition of our Ft. Trinidad assets in July 2014. Additionally, the depletion rate per Boe for the year ended December 31, 2014 declined to $31.30 compared to $35.38 for the prior period. The decline in the depletion rate per Boe during the year ended December 31, 2014 is primarily due to the addition of proved reserves resulting from wells acquired and drilled during 2014.
Other Income and Expenses
The following table summarizes other income and expense for the periods indicated (in thousands):
| Year Ended December 31, |
||||||||||||
| 2013 | 2014 | $Variance | ||||||||||
| Other income (expense) |
||||||||||||
| Interest and other income |
$ | 53 | $ | 147 | $ | 94 | ||||||
| Loss on early extinguishment of debt |
(3,677 | ) | (75,517 | ) | (71,840 | ) | ||||||
| Interest expense |
(17,211 | ) | (78,386 | ) | (61,175 | ) | ||||||
| Gain (loss) on derivatives |
(662 | ) | 106,196 | 106,858 | ||||||||
| Gain on sales of assets |
14,275 | 14,249 | (26 | ) | ||||||||
|
|
|
|
|
|
|
|||||||
| Total other expense, net |
$ | (7,222 | ) | $ | (33,311 | ) | $ | (26,089 | ) | |||
|
|
|
|
|
|
|
|||||||
Loss on Early Extinguishment of Debt. Loss on early extinguishment of debt was approximately $3.7 million for the year ended December 31, 2013. The loss relates to the prepayment penalty and expensing of the unamortized debt issuance costs from the early payoff of our Guggenheim credit facility in April 2013. For the
57
Table of Contents
year ended December 31, 2014, loss on early extinguishment was approximately $75.5 million. The loss relates to the prepayment penalty, expensing of the unamortized debt issuance costs and expensing of unamortized debt discounts from the refinancing and replacement of our senior unsecured notes in July 2014.
Interest Expense. Interest expense increased approximately $61.2 million from $17.2 million for the year ended December 31, 2013 to $78.4 million for the year ended December 31, 2014. This increase was primarily due to increased interest and amortization of debt discounts and debt issuance costs associated with higher debt levels during 2014, partially offset by an increase in capitalized interest. In July 2014, contemporaneously with the closing of the Ft. Trinidad acquisition, we refinanced our senior unsecured notes of approximately $225 million replacing them with convertible notes and a senior secured term loan of approximately $375 million and $775 million, respectively. Capitalized interest increased $7.4 million from $3.8 million for the year ended December 31, 2013 to $11.2 million for the year ended December 31, 2014.
Gain (Loss) on Derivatives. Gain on derivatives was approximately $106.2 million for the year ended December 31, 2014. The gain on derivatives was composed of $63.7 million in gain related to the change in fair market value of commodity derivative instruments, $38.0 million in gain related to the change in fair market value of our embedded derivative instrument related to the convertible notes and $4.5 million realized gains on our commodity derivative instruments. The $4.5 million in realized gain relates to settlement of oil and natural gas positions during the year ended December 31, 2014. Loss on derivatives was approximately $0.7 million for the year ended December 31, 2013. The loss on derivatives was composed of $0.1 million in realized loss and $0.6 million in loss related to the change in fair market value, on our commodity derivative instruments, resulting primarily from an increase in estimated future oil prices on our commodity derivative instruments. The $0.1 million of realized loss relates to settlement of oil positions for our November and December 2013 production periods. We initially entered into derivative instruments subsequent to September 30, 2013; therefore, derivative gains or losses represent only a portion of the year ended December 31, 2013.
Gain on Sales of Assets. Gain on sales of assets decreased by approximately $26,000 from $14.3 million for the year ended December 31, 2013 to $14.2 million for the year ended December 31, 2014. The gains recognized for the 2013 and 2014 periods represent additional sale proceeds related to contingent payments received from one of our operating partners related to a sale of unevaluated properties in 2012, but for which the contingent requirements were not met until subsequent periods.
Income Tax Expense
Income tax benefit decreased by approximately $4.4 million from a tax benefit of $5.4 million for the year ended December 31, 2013 to a tax benefit of $1.0 million for the year ended December 31, 2014. This decrease in income tax benefit is primarily due to a decrease in net income before tax of $23.0 million for the year ended December 31, 2014 compared to the prior year. The tax benefit recorded for the year ended December 31, 2014 was partially offset by a $0.1 million valuation allowance recorded during 2014 due to our uncertainty surrounding the future use of our tax attributes and the tax effect of permanent differences related to share based compensation of $1.7 million and prior year penalties of $1.4 million abated by the IRS in the current year.
58
Table of Contents
Year Ended December 31, 2013 Compared to Year Ended December 31, 2012
Production and Oil and Natural Gas Sales
The following table summarizes our oil and natural gas production volumes and average sales prices for the years ended December 31, 2013 and 2012.
| Year Ended December 31, | ||||||||
| 2012 | 2013 | |||||||
| Production Volumes: |
||||||||
| Oil (Bbls) |
2,247 | 161,579 | ||||||
| Natural gas liquids (Bbls) |
383 | 5,123 | ||||||
| Natural gas (Mcf) |
3,903 | 128,603 | ||||||
| Total (BOE) |
3,281 | 188,136 | ||||||
| Average realized prices: |
||||||||
| Oil (Bbls) |
$ | 87.58 | $ | 98.02 | ||||
| Natural gas liquids (Bbls) |
27.78 | 26.02 | ||||||
| Natural gas (Mcf) |
2.17 | 3.62 | ||||||
| Total (BOE) |
65.81 | 87.37 | ||||||
Oil and gas sales increased $16.2 million during the year ended December 31, 2013 to $16.4 million compared to $0.2 million for the prior year. The increase is primarily due to increased production during 2013 resulting from the addition of 25 gross producing wells, including nine operated and five non-operated wells drilled and completed during 2013 and the acquisition of 11 wells in our April 2013 Chesapeake acquisition. This increase in producing wells is partially offset by the sale of two gross wells during June 2013.
The average realized sales price for oil was $98.02/Bbl for the year ended December 31, 2013, an increase of 12%, compared to $87.58/Bbl for 2012. The price received on our oil sales during the year ended December 31, 2013 of $98.02/Bbl was the average months’ NYMEX-WTI prices adjusted for differentials determined on a locational basis and other market factors. The simple daily average NYMEX-WTI price for the year ended December 31, 2013 was $98.01.
The average realized sales price for natural gas was $3.62/Mcf for the year ended December 31, 2013, an increase of 67%, compared to $2.17/Mcf for 2012. The price received on our natural gas sales during year ended December 31, 2013 of $3.62/Mcf was the average month’s Henry Hub natural gas spot price adjusted for differentials determined on a locational basis, liquids Btu content and other market factors. The simple daily average Henry Hub natural gas spot price for the year ended December 31, 2013 was $3.73/Mcf.
Operating Expenses
Lease Operating Expense. Lease operating expense was $3.2 million for the year ended December 31, 2013, compared to $11,000 for the year ended December 31, 2012. The increase in lease operating expense is due to the increase in the number of producing wells from three gross productive wells at December 31, 2012 to 26 gross productive wells at December 31, 2013. Our first producing wells began production in March 2012, and, as a result, we had de minimis lease operating expenses associated with the three wells producing during 2012.
Production Taxes. Production taxes increased by approximately $0.9 million from $14,000 for the year ended December 31, 2012 to $0.9 million for the year ended December 31, 2013. The increase is primarily due to an increase in production volumes sold from 3,281 Boe during 2012 to 188,136 Boe during 2013.
Full-Cost Ceiling Impairment. Full cost ceiling impairment was $8.4 million for the year ended December 31, 2013 due to an $8.4 million excess in carrying costs associated with our oil and natural gas properties (net of amortization) over the estimated ceiling limit on the book value of our oil and natural gas
59
Table of Contents
properties. During the first quarter of 2013, prior to our Chesapeake acquisition and the full implementation of our 2013 drilling program, we had reserves on a limited number of properties, which resulted in a low limit on our ceiling threshold. We participated in the drilling of two non-operated wells that were dry holes during the first quarter of 2013 that were included in the full cost pool with no corresponding reserves recorded. The dry hole costs were the primary contributor to the 2013 impairment. Full cost ceiling impairment was $4.0 million for the year ended December 31, 2012 due to a $4.0 million excess in carrying costs associated with our oil and natural gas properties (net of amortization) over the estimated ceiling limit on the book value of our oil and natural gas properties. During the fourth quarter of 2012, we had reserves on a limited number of properties, which resulted in a low limit on our ceiling threshold. We participated in the drilling of one non-operated well that was a dry hole during the fourth quarter of 2012 that was included in the full cost pool with no corresponding reserves recorded. The dry hole cost was the primary contributor to the 2012 impairment.
General and Administrative Expense. General and administrative expense increased by approximately $6.4 million from $10.5 million for the year ended December 31, 2012 to $16.9 million for the year ended December 31, 2013. Of the $6.4 million increase, $5.2 million related to non-cash share-based compensation expense related to awards granted under our 2012 Stock Incentive Plan, which was established in the third quarter of 2012. Excluding share-based compensation expense, general and administrative expense increased $1.2 million primarily due to increased employee related costs associated with our expanding employee base, partially offset by a decrease in third-party professional fees.
Depletion, Depreciation and Amortization Expenses. Depletion, depreciation and amortization increased by approximately $6.4 million from $0.5 million for the year ended December 31, 2012 to $6.9 million for the year ended December 31, 2013. The increase is primarily due to an increase in production during 2013 compared to the prior period. Additionally, the depletion rate per Boe for the year ended December 31, 2013 declined to $35.38 compared to $93.48 for the prior period. At December 31, 2013, we had 19.6 net producing wells compared to 0.3 net wells producing at December 31, 2012. The decline in the depletion rate per Boe during the year ended December 31, 2013 is primarily due to the addition of proved reserves resulting from wells drilled and acquired wells during 2013. Our reserves increased 22,328% to 7.1 MMBoe at December 31, 2013 compared to 31,500 Boe at December 31, 2012.
Other Income and Expenses
The following table summarizes other income and expense for the periods indicated (in thousands):
| Year Ended December 31, |
||||||||||||
| 2012 | 2013 | $ Variance | ||||||||||
| Other income (expense) |
||||||||||||
| Interest and other income |
$ | 10 | $ | 53 | $ | 43 | ||||||
| Loss on early extinguishment of debt |
(985 | ) | (3,677 | ) | (2,692 | ) | ||||||
| Interest expense |
(2,842 | ) | (17,211 | ) | (14,369 | ) | ||||||
| Loss on derivatives |
— | (662 | ) | (662 | ) | |||||||
| Gain on sales of assets |
34,738 | 14,275 | (20,463 | ) | ||||||||
|
|
|
|
|
|
|
|||||||
| Total other income (expense), net |
$ | 30,921 | $ | (7,222 | ) | $ | (38,143 | ) | ||||
|
|
|
|
|
|
|
|||||||
Loss on Early Extinguishment of Debt. Loss on early extinguishment of debt increased approximately $2.7 million from $1.0 million for the year ended December 31, 2012 to $3.7 million for the year ended December 31, 2013. This increase is primarily due to the payoff of a previously existing credit facility during 2013. The $3.7 million recognized as a loss consists of a make-whole payment of $2.8 million to retire the credit facility and the elimination of $0.9 million unamortized debt issuance costs related to this facility. In 2012, we recorded a loss on debt extinguishment of $1.0 million related to the expensing of our unamortized debt issuance costs upon termination of a $10 million 14% senior secured note.
60
Table of Contents
Interest Expense. Interest expense increased approximately $14.4 million from $2.8 million for the year ended December 31, 2012 to $17.2 million for the year ended December 31, 2013. This increase is primarily due to increased interest and amortization of debt issuance costs associated with higher debt levels during 2013. These increases were partially offset by an increase in capitalized interest of $3.8 million during 2013. During April 2013, we issued our senior unsecured notes in the amount of $140.0 million and used a portion of the proceeds of the issuance of the senior unsecured notes to retire our then existing credit facility. In addition, during April 2013, we issued the $18.0 million subordinated Chesapeake note as payment for a portion of the purchase price for the Chesapeake acquisition. In December 2013, we issued an additional $25.0 million of our senior unsecured notes.
Loss on Derivatives. Loss on derivatives was approximately $0.7 million for the year ended December 31, 2013. Loss on derivatives is composed of $0.1 million in realized loss on our commodity derivative instruments and $0.6 million in loss related to the change in fair market value on our commodity derivative instruments. The $0.1 million of realized loss relates to settlement of oil positions for our November and December 2013 production periods. The $0.6 million loss reflects the change in fair market value on our oil positions for production periods subsequent to 2013, resulting primarily from an increase in estimated future oil prices. We initially entered into derivative instruments subsequent to December 31, 2012; therefore, there were no derivative gains or losses during the year ended December 31, 2012.
Gain on Sales of Assets. Gain on sales of assets decreased by approximately $20.5 million from $34.7 million for the year ended December 31, 2012 to $14.3 million for the year ended December 31, 2013. The $34.7 million gain for the year ended December 31, 2012 was related to the sale of a 75% to 85% working interest in certain of our unevaluated East Texas stacked play acreage. The $14.3 million gain on sale of assets for the year ended December 31, 2013 represents additional sales proceeds related to a $14.6 million contingent payment, net of related expenses, received from one of our operating partners related to a sale of unevaluated properties in 2012, but for which the contingent requirements were not met until March 2013.
Income Tax Expense
Income tax expense decreased by approximately $12.8 million from a tax expense of $7.4 million for the year ended December 31, 2012 to a tax benefit of $5.4 million for the year ended December 31, 2013. This decrease in income tax expense is primarily due to a decrease in net income before tax of $43.3 million for the year ended December 31, 2013 compared to the prior year. The tax benefit recorded for the year ended December 31, 2013 was partially offset by a $2.2 million valuation allowance recorded during 2013 due to our uncertainty surrounding the future use of our tax attributes.
Liquidity and Capital Resources
Through December 31, 2014 our primary sources of liquidity have been associated with sales of leasehold acreage positions, borrowings under debt facilities and cash flows from operations.
Significant Asset Sales
During 2012, we received proceeds of approximately $78.0 million related to the sale of acreage positions in certain East Texas stacked play acreage.
During 2013, we received a contingent payment of approximately $14.6 million related to the sale of acreage positions in 2012 but for which the contingent requirements were not met until March 2013.
Also in 2013, we sold our DJ Basin assets located in Weld County, Colorado for consideration of approximately $5.5 million in cash, subject to customary purchase price adjustments. The divested assets include approximately 2,648 net acres and two gross (0.1 net) non-operated wells.
61
Table of Contents
During March 2014, we recorded an additional contingent payment of approximately $14.6 million related to the sale of acreage positions in 2012 but for which the contingent requirements were met in March 2014. We received the cash payment during May 2014.
During June 2014, we completed the disposition of certain oil and gas leaseholds in Houston and Robertson Counties, Texas, to several oil and gas companies for sales proceeds of approximately $5.4 million in cash.
Prior Debt Facilities and Notes
Senior Secured Note. During 2012, prior to its retirement, we had a senior secured note that had borrowings totaling $15.0 million which were used to fund leasehold acquisitions and our share of operating costs with our operating partners. We repaid this note on June 26, 2012 with borrowings under our Guggenheim credit facility, under which we initially borrowed $21.5 million to repay the senior secured note, increase our working capital and fund a portion of our drilling and completion program.
Senior Unsecured Notes. On April 8, 2013, we issued senior unsecured notes to affiliates of Highbridge Principal Strategies, LLC, or Highbridge, and Apollo Investment Corporation, or Apollo, in the aggregate principal amount of $140.0 million. We used a portion of the net proceeds from these senior unsecured notes to fund a portion of the cash purchase price for the Chesapeake acquisition, to repay indebtedness under our Guggenheim credit facility and to fund drilling and development of our East Texas stacked play acreage. On December 12, 2013, January 31, 2014 and March 27, 2014, we issued $25.0 million, $15.0 million and $45.0 million, respectively, of additional senior unsecured notes to Highbridge and Apollo. We used the net proceeds from the sale of the additional senior unsecured notes to fund drilling and development of our East Texas stacked play acreage. We refinanced and replaced all of the senior secured notes on July 22, 2014 with the net proceeds of our senior secured term loan and convertible notes, which required payment of a prepayment premium of $52.6 million. We also entered into a secured term loan agreement with Highbridge and Apollo in August 2013, but did not borrow under the term loan. The term loan agreement was terminated on July 22, 2014.
Debt Facilities and Notes
Chesapeake Note. In April 2013, as part of the purchase price for the Chesapeake acquisition, we issued to an affiliate of Chesapeake Energy Corporation a promissory note in the original principal amount of $18.0 million, which we refer to as the Chesapeake note. The Chesapeake note matures on the earlier of (1) October 8, 2018, (2) the closing of our initial public offering or (3) six months after the date of repayment of our senior debt (as defined in the Chesapeake note) in full. The Chesapeake note bears interest at 10% per annum until our senior debt is paid in full and 15% thereafter. Until our senior debt is paid in full, all interest on the Chesapeake note is paid in kind. As of December 31, 2014, the principal amount outstanding on the Chesapeake note was approximately $21.3 million. We plan to repay the Chesapeake note in full with the net proceeds from this offering. See “Use of Proceeds.”
Convertible Notes. On July 22, 2014, contemporaneously with the closing of the TreadStone Ft. Trinidad acquisition and the senior secured term loan, we issued $375 million of our 8.0% convertible subordinated notes due 2019 in a private placement transaction. We used a portion of the net proceeds of the convertible notes offering, along with the net proceeds from the senior secured term loan, to refinance and replace our senior unsecured notes. We used the remaining net proceeds to fund capital expenditures for drilling and developing our leasehold acreage, acquiring additional oil and gas leases, extending expiration of our leasehold acreage and acquiring 3D seismic data and for general corporate purposes.
The convertible notes bear interest at a rate of 8.0% per annum subject to semi-annual increases of 0.50% beginning on July 1, 2015 if a preliminary prospectus under the Securities Act with a bona fide price range in connection with a qualified public offering (as defined below) has not been filed by each such date and, in each case, the qualified public offering has not priced within 60 days after the date of such scheduled interest rate increase.
62
Table of Contents
Holders of the convertible notes may elect to convert their notes into shares of our common stock at a specified conversion price in connection with the closing of a qualified public offering. A qualified public offering is defined as the first public offering of our common stock in which the aggregate gross proceeds to us and any selling stockholders equals or exceeds $400.0 million and following which our common stock is listed on a U.S. national securities exchange. We expect this offering will constitute a qualified public offering.
The number of shares of common stock issuable upon conversion of the convertible notes will be the greater of:
| • | the number of shares of common stock determined by dividing (1) the principal amount of the convertible notes converted by (2) a conversion price that is equal to a specified percentage of the public offering price per share in the qualified public offering that decreases over time, which percentage will be 86% if this offering is consummated on or before June 30, 2015 and 70% if this offering is consummated on or after July 1, 2015 and on or before December 31, 2015; and |
| • | a number of shares of common stock that represents a percentage of our outstanding shares of common stock immediately prior to the consummation of a qualified public offering (giving effect to the conversion of the convertible notes and all other securities that are convertible into shares of our common stock, but before the issuance by us of shares in the qualified public offering) that is equal to (1) the principal amount of the convertible notes converted divided by (2) $900 million. |
Holders of the convertible notes may elect to convert their convertible notes during a period that will end on a date prior to the completion of this offering to be determined by us. Following the completion of a qualified public offering, we may redeem, and intend to redeem, any convertible notes not converted at a price equal to 100% of the principal amount of the convertible notes redeemed, plus accrued interest. Accordingly, we expect that all of the convertible notes will be converted in connection with this offering. Assuming the conversion of all of the convertible notes and an initial public offering price of $ per share of our common stock in this offering (the midpoint of the price range set forth on the cover page of this prospectus), the convertible notes will convert into shares of our common stock upon completion of this offering. A $1.00 increase in the initial public offering price per share would decrease the number of shares issuable upon conversion of the convertible notes by shares, and a $1.00 decrease in the initial public offering price per share would increase the number of shares issuable upon conversion of the convertible notes by shares.
Holders of the convertible notes have certain registration rights with respect to the shares of common stock issuable upon conversion of the convertible notes, including piggyback registration rights that permit holders to sell up to an aggregate 36% of those shares of common stock in a qualified public offering. We expect that some or all of the convertible note holders will exercise their rights to sell shares in this offering. The remaining shares not sold in a qualified public offering will be subject to a 180-day lockup. See “Principal and Selling Stockholders.”
Senior Secured Term Loan. On July 22, 2014, contemporaneously with the closing of the Ft. Trinidad acquisition and the offering of the convertible notes, we entered into the agreement governing the senior secured term loan with a group of institutional lenders and borrowed $775 million under the senior secured term loan. The senior secured term loan matures on January 22, 2019 and provided for an original principal amount of $775 million. Subject to certain conditions, including obtaining the participation of existing or prospective lenders, we may incur incremental term loans in an amount up to $175 million.
Our wholly owned subsidiary, ENXP LLC, is the borrower under the senior secured term loan. We and each of ENXP LLC’s subsidiaries guarantee the obligations of ENXP LLC under the senior secured term loan. Our obligations under the senior secured term loan are secured by a pledge of our equity interests in ENXP LLC and substantially all of ENXP LLC’s and its subsidiaries’ assets, including a perfected mortgage lien on oil and gas properties that represent at least 80% of the present value in our reserve report. The senior secured term loan bears interest at variable rates, at our option, (x) based on the greater of (a) the London interbank offered rate times the statutory reserves and (b) 1% (in either case the “Adjusted LIBOR”), plus 6.75%, or (y) the greatest of (a) the prime rate, (b) the federal funds effective rate plus 1/2 of 1%, and (c) the Adjusted LIBOR for one month,
63
Table of Contents
plus 5.75%. We are required to repay the senior secured term loan quarterly, in the principal amount of $1.9 million, plus accrued and unpaid interest, with the balance due at maturity.
We may prepay the senior secured term loan, in whole or in part, at any time subject to an applicable premium (i) in year 1, of 2% of the principal repaid, (ii) in year 2, of 1% of the principal repaid, and (iii) on and after the second anniversary of the closing date, no premium. Subject to certain exceptions, we are required to prepay any loans outstanding under the senior secured term loan by an amount equal to: (x) 100% of the net cash proceeds of certain asset dispositions, (y) 50% of the excess cash flow for any fiscal year, subject to reduction to 25% or 0% in the event certain leverage ratios are achieved and (z) 100% of the net cash proceeds of the issuance of unpermitted debt. We and ENXP LLC may also repurchase the senior secured term loan from one or more lenders in the open market or pursuant to Dutch auction procedures, subject to the satisfaction of certain conditions.
Subject to certain exceptions and baskets, the agreement governing the senior secured term loan contains customary restrictive covenants, including restrictions on liens, debt, investments, acquisitions, dividends and other distributions, mergers, consolidations and dispositions. The agreement requires us to meet a maximum leverage ratio of (x) 4.50 to 1.00 for the fiscal quarters ending December 31, 2014 through and including September 30, 2015 and (y) 3.00 to 1.00 for the fiscal quarter ending December 31, 2015 and each fiscal quarter thereafter, tested on a quarterly basis. Additionally, the agreement governing our senior secured term loan requires us to enter into commodity derivative instruments for a minimum of 40% and maximum of 80% of anticipated production from our proved reserves. The agreement provides for customary events of default, subject to applicable grace periods. As of December 31, 2014, we were in compliance with all debt covenants.
Liquidity Outlook
We expect to incur substantial expenditures as we continue to explore and develop our oil and natural gas prospects, and as we opportunistically invest in additional oil and natural gas leases adjacent to our current positions, develop our discoveries which we determine to be commercially viable and incur expenses related to operating as a public company and compliance with regulatory requirements.
Our future financial condition and liquidity will be impacted by, among other factors, the success of our exploration and appraisal drilling program, the number of commercially viable oil and natural gas discoveries made and the quantities of oil and natural gas discovered, the prices of oil and natural gas, the speed with which we can bring such discoveries to production, and the actual cost of exploration, appraisal and development of our prospects.
We estimate that we will make capital expenditures, excluding capitalized interest and general and administrative expense, of approximately $234 million during the period from January 1, 2015 to December 31, 2016. We currently intend to finance our future capital expenditures primarily with the net proceeds from this offering, cash on hand, cash flows provided by operating activities, proceeds from asset divestitures, additional borrowings under our senior secured term loan, if available, and public or private equity or debt financing. We expect cash on hand and cash flows provided by operating activities based on current commodity prices will fully fund our $106 million capital expenditures budget for 2015. However, we may require significant additional funds earlier than we currently expect in order to execute our strategy as planned. Additionally, because the wells funded by our 2015 and 2016 drilling plans represent only a small percentage of our potential drilling locations, we will be required to generate or raise significant amounts of additional capital to develop our entire inventory of potential drilling locations if we elect to do so. We may seek additional funding through asset sales, farm-out arrangements and public or private equity or debt financings.
Our capital budget may be adjusted as business conditions warrant. The amount, timing and allocation of capital expenditures is largely discretionary and within our control, except that the timing and costs of drilling on our non-operated East Texas stacked play leasehold interests generally will be within the control of the operator. If oil and natural gas prices continue to remain depressed for lengthy periods or decline further, costs increase significantly, or we are unable to raise additional capital, we could defer a significant portion of our budgeted
64
Table of Contents
capital expenditures until later periods to prioritize capital projects that we believe have the highest expected returns and potential to generate near-term cash flows. We routinely monitor and adjust our capital expenditures in response to changes in commodity prices, availability of financing, drilling and acquisition costs, industry conditions, timing of regulatory approvals, availability of rigs, success or lack of success in drilling activities, contractual obligations, internally generated cash flows and other factors both within and outside our control.
As of December 31, 2014, on a pro forma basis giving effect to this offering, the use of a portion of the net proceeds of this offering to repay the Chesapeake note in full and the conversion of all outstanding convertible notes into shares of our common stock upon completion of this offering, we would have had outstanding indebtedness, net of debt discounts, of approximately $761 million, consisting of the senior secured term loan, and cash and cash equivalents of approximately $ million.
Cash Flows
The discussion of our cash flows and period to period comparisons presented below analyze our historical results as presented in the “Selected Consolidated Financial Data,” which may not be indicative of future results. Cash outflows for undeveloped leasehold acreage that were previously reported as operating outflows in our financial statements when we were an entity engaged in the acquisition and sale of undeveloped oil and natural gas leasehold interests, are reported as investing outflows in the Selected Consolidated Financial Data.
The table below sets forth our cash flow data for the years ended December 31, 2012, 2013 and 2014.
| Year Ended December 31, |
||||||||||||
| 2012 | 2013 | 2014 | ||||||||||
| (in thousands) | ||||||||||||
| Net cash provided by (used in) operating activities |
$ | (11,072 | ) | $ | 19,946 | $ | 73,760 | |||||
| Net cash provided by (used in) investing activities |
$ | 12,911 | $ | (164,482 | ) | (888,827 | ) | |||||
| Net cash provided by financing activities |
$ | 2,992 | $ | 137,877 | 873,512 | |||||||
| Opening cash |
$ | 5,397 | $ | 10,228 | 3,569 | |||||||
| Closing cash |
$ | 10,228 | $ | 3,569 | 62,014 | |||||||
Cash flows provided by (used in) operating activities
Net cash provided by operating activities was $73.8 million for the year ended December 31, 2014 compared to $19.9 million for the same period in 2013. The increase in cash provided between the comparable periods was primarily due to a $99.3 million increase in cash provided due to an increase in revenues, net of lease operating expenses and production taxes, resulting from increased oil and gas production, primarily from our Ft. Trinidad assets acquired during 2014. The increase in cash provided was partially offset by an increase in cash interest expense of $24.6 million due to increased long-term debt borrowings and an increase in cash general and administrative expenditures of approximately $10.5 million due to increased employee related costs and third party professional fees. Changes in working capital provided $22.2 million of cash during the year ended December 31, 2014 compared to $21.0 million of cash provided for the comparable period in 2013.
Net cash provided by operating activities was $19.9 million for the year ended December 31, 2013 compared to net cash used in operating activities of $11.1 million for the year ended December 31, 2012. The increase between the comparable periods was primarily due to a $12.2 million increase in revenues, net of lease operating expenses and severance taxes, from our oil and natural gas properties acquired and drilled in 2013 and an increase of $14.9 million related to changes in working capital due to timing on payment and receipt of cash during the year ended December 31, 2013 compared to the prior period. These increases were partially offset by an increase of $17.2 million in cash paid for interest expense.
65
Table of Contents
Cash flows provided by (used in) investing activities
Net cash used in investing activities was $888.8 million for the year ended December 31, 2014 compared to net cash used in investing activities of $164.5 million during the comparable period in 2013. This increase in net cash used in investing activities is primarily due to an increase of $631.3 million in acquisition of oil and natural gas properties and an increase of $92.0 million in oil and natural gas properties additions, primarily related to an increase in our drilling program between the comparable periods. We used approximately $700.2 million for the acquisition of our Ft. Trinidad assets during the year ended December 31, 2014 and approximately $68.9 million for the Chesapeake acquisition during the year ended December 31, 2013.
Net cash used in investing activities was $164.5 million for the year ended December 31, 2013 compared to net cash provided by investing activities of $12.9 million for the year ended December 31, 2012. This decrease in net cash provided by investing activities is primarily due to an increase of $128.9 million in oil and natural gas property additions combined with a decrease of $55.3 million in sales proceeds between the comparable periods. We received net sales proceeds for the year ended December 31, 2013 amounting to $14.3 million from one of our operating partners related to the sale of East Texas stacked play properties, net proceeds of $5.0 million from our sale of our Weld County, Colorado DJ Basin properties and net proceeds of $0.6 million from the sale of interests in two of our producing wells. Sales proceeds during the year ended December 31, 2012 related to proceeds from the disposal of working interests in unevaluated oil and gas properties of $75.2 million.
Cash flows provided by financing activities
Net cash provided by financing activities was $873.5 million for the year ended December 31, 2014, compared to net cash provided by financing activities of $137.9 million during the comparable period in 2013. The primary source of cash during the year ended December 31, 2014 was cash received from the issuance of $1.2 billion of new debt, net of debt discounts of $14.6 million, partially offset by debt issuance costs of $38.9 million. A portion of the proceeds were used to refinance and replace $225.0 million of previously outstanding senior unsecured notes, pay a prepayment penalty of $52.6 million on the senior unsecured notes and make scheduled payments of $3.9 million on current debt. For the year ended December 31, 2013, the primary source of cash was the issuance of $165.0 million of our senior unsecured term loan, partially offset by debt discounts of $5.0 million, debt issuance costs of $2.0 million, the payoff of the $17.3 million net outstanding balance of our previously existing Guggenheim credit facility and the payment of $2.8 million prepayment penalty on the Guggenheim credit facility.
Net cash provided by financing activities was $137.9 million for the year ended December 31, 2013 compared to net cash provided by financing activities of $3.0 million for year ended December 31, 2012. The primary source of cash during the year ended December 31, 2013 was the issuance of $165.0 million of our senior unsecured notes, partially offset by debt discounts of $5.0 million, $2.0 million in debt issuance costs and the payoff of the $17.3 million net outstanding balance of our previously existing Guggenheim credit facility. For the year ended December 31, 2012 the primary source of financing cash was $30.3 million of proceeds from borrowings under the Guggenheim credit facility, net of deposits, offset by payments of $22.5 million of the preexisting senior secured note, $1.3 million of debt issuance costs, and $1.7 million of deferred offering costs.
66
Table of Contents
Obligations and Commitments
We had the following contractual obligations and commitments as of December 31, 2014 (in thousands):
| Obligations and Commitments Due By Period | ||||||||||||||||||||||||||||
| Total | Remaining 2015 |
2016 | 2017 | 2018 | 2019 | Thereafter | ||||||||||||||||||||||
| Convertible Notes(1) |
$ | 375,000 | $ | — | $ | — | $ | — | $ | — | $ | 375,000 | $ | — | ||||||||||||||
| Term Loan(2) |
771,125 | 7,750 | 7,750 | 7,750 | 7,750 | 740,125 | — | |||||||||||||||||||||
| Subordinated Chesapeake note(3) |
30,798 | — | — | — | 30,798 | — | — | |||||||||||||||||||||
| Contractual lease payments |
8,273 | 6,241 | 1,894 | 101 | 37 | — | — | |||||||||||||||||||||
|
|
|
|
|
|
|
|
|
|
|
|
|
|
|
|||||||||||||||
| Total contractual obligations |
$ | 1,185,196 | $ | 13,991 | $ | 9,644 | $ | 7,851 | $ | 38,585 | $ | 1,115,125 | $ | — | ||||||||||||||
|
|
|
|
|
|
|
|
|
|
|
|
|
|
|
|||||||||||||||
| (1) | Excludes interest and repayment premiums, as we expect that all of the convertible notes will be converted into common stock in connection with the completion of this offering. |
| (2) | Excludes interest because the term loan bears interest at a floating rate, and we therefore cannot determine with accuracy the amounts of future interest payments. |
| (3) | Includes approximately $12.8 million of interest paid or to be paid in kind. The principal amount of the Chesapeake note and accrued interest outstanding at December 31, 2014 was approximately $21.3 million. We intend to repay the Chesapeake note in full with the net proceeds of this offering. |
Critical Accounting Policies and Estimates
Our consolidated financial statements are impacted by the accounting policies used and the estimates and assumptions made by management during their preparation. A complete summary of these policies is included in Note 2—Summary of Significant Accounting Policies of the notes to our historical consolidated financial statements. The following is a discussion of our critical accounting policies and estimates.
Oil and Natural Gas Properties. Beginning in the first quarter of 2012, we adopted the full-cost method of accounting for oil and natural gas properties. Accordingly, all costs associated with acquisition, exploration and development of oil and natural gas reserves are capitalized.
Under full-cost accounting rules, capitalized costs, less accumulated amortization, and net of deferred income taxes, may not exceed an amount (the ceiling) equal to the sum of: (i) the present value of estimated future net revenues less future production, development, site restoration and abandonment costs derived based on current costs assuming continuation of existing economic conditions and computed using a discount factor of ten percent; (ii) the cost of properties not being amortized; and (iii) the lower of cost or estimated fair value of unproven properties included in the costs being amortized. If unamortized costs capitalized within the cost pool exceed the ceiling, the excess is charged to expense and separately disclosed during the period in which the excess occurs. Amounts thus required to be written off are not reinstated for any subsequent increase in the cost center ceiling.
Depreciation, depletion and amortization is provided using the unit-of-production method based upon estimates of proved oil and natural gas reserves with oil and natural gas production being converted to a common unit of measure based upon their relative energy content. Investments in unproved properties and major development projects are not amortized until proved reserves associated with the projects can be determined or until impairment occurs. If the results of an assessment indicate that the properties are impaired, the amount of the impairment is added to the capitalized costs to be amortized. Once the assessment of unproved properties is complete and when major development projects are evaluated, the costs previously excluded from amortization are transferred to the full-cost pool and amortization begins. The capitalized costs to be amortized also include estimated future development costs, dismantlement, restoration and abandonment costs, net of estimated salvage value.
67
Table of Contents
In arriving at depletion rates under the unit-of-production method, the quantities of recoverable oil and natural gas reserves are established based on estimates made by our geologists and engineers, which require significant judgment as does the projection of future production volumes and levels of future costs, including future development costs. In addition, considerable judgment is necessary in determining when unproved properties become impaired and in determining the existence of proved reserves once a well has been drilled. All of these judgments may have significant impact on the calculation of depletion and impairment expense. Sales of proved and unproved properties are accounted for as adjustments of capitalized costs with no gain or loss recognized, unless such adjustments would significantly alter the relationship between capitalized costs and proved oil and natural gas reserves, in which case the gain or loss would be recognized in the statement of operations.
Oil and Natural Gas Reserves. We recorded proved oil and natural gas reserves in the fourth quarter of 2012 and prepared our first third party reserve report as of December 31, 2012. In January 2010, the Financial Accounting Standards Board (“FASB”) issued an update to the oil and natural gas topic, which aligns the oil and natural gas reserve estimation and disclosure requirements with the requirements in the Securities and Exchange Commission (“SEC”) final rule, Modernization of the Oil and Natural Gas Reporting Requirements, which we refer to as the Final Rule. The Final Rule was issued on December 31, 2008 and is intended to provide investors with a more meaningful and comprehensive understanding of oil and natural gas reserves, which should help investors evaluate the relative value of oil and natural gas companies.
The Final Rule permits the use of new technologies to determine proved reserve estimates if those technologies have been demonstrated empirically to lead to reliable conclusions about reserve volume estimates.
The Final Rule also allows, but does not require, companies to disclose their probable and possible reserves to investors in documents filed with the SEC.
In addition, the disclosure requirements require companies to report oil and natural gas reserves using an average price based upon the first of month simple average prices for the prior 12 month period rather than a year-end price. The Final Rule became effective for fiscal years ending on or after December 31, 2009.
Reserves and their relation to estimated future net cash flows impact our depletion and impairment calculations. As a result, adjustments to depletion and impairment are made concurrently with changes to reserve estimates. The reserve estimates and the projected cash flows derived from these reserve estimates are prepared in accordance with SEC guidelines. The accuracy of our reserve estimates is a function of many factors including the quality and quantity of available data, the interpretation of that data, the accuracy of various mandated economic assumptions, and the judgments of the individuals preparing the estimates, all of which could deviate significantly from actual results. As such, reserve estimates may vary materially from the ultimate quantities of oil, natural gas, and natural gas liquids eventually recovered.
Asset Retirement Obligations. We comply with Accounting Standards Codification (“ASC”) 410-20, Asset Retirement and Environmental Obligations (“ASC 410-20”), to recognize estimated amounts for asset retirement obligations and asset retirement costs. This standard requires us to record a liability for the fair value of the asset retirement obligations, excluding salvage values. ASC 410-20 requires liability recognition for retirement obligations associated with tangible long-lived assets, such as producing well sites, gathering systems, and related equipment. The obligations included within the scope of ASC 410-20 are those for which we face a legal obligation for settlement. The initial measurement of the asset retirement obligation is fair value, defined as “the price that an entity would have to pay a willing third party of comparable credit standing to assume the liability in a current transaction other than in a forced or liquidation sale.” The significant unobservable inputs to this fair value measurement include estimates of plugging, abandonment, remediation costs, and well life. The inputs are calculated based on historical data as well as current estimates. When the liability is initially recorded,
68
Table of Contents
the entity increases the carrying amount of the related long-lived asset. Over time, accretion of the liability is recognized each period, and the capitalized cost is amortized over the useful life of the related asset. Upon settlement of the liability, an entity either settles the obligation for its recorded amount or incurs a gain or loss upon settlement which the entity treats as an adjustment to the full-cost pool.
Revenue Recognition. Our oil and natural gas production is currently sold to purchasers by us or by the operator of the property in which we have an interest. We follow the entitlements method of recognizing oil and natural gas revenues and record revenues based on our contractual interest in our properties.
Share-Based Compensation. We follow ASC 718, Compensation—Stock Compensation, which requires the measurement and recognition of compensation expense for all share-based payment awards, including restricted stock units based on estimated grant date fair values. Restricted stock units are valued using the market price of our common share on the date of grant. We record compensation expense, net of estimated forfeitures, over the requisite service period.
Embedded Derivatives. We follow ASC 815-15 Derivatives and Hedging—Embedded derivatives, which provides the characteristics that must be met for a financial instrument or contract to be classified as a derivative. Our convertible notes include embedded features that require bifurcation and are accounted for as a separate combined embedded derivative. We estimate the fair market value of our embedded derivative of our convertible notes as the difference between the fair market value of our convertible notes with all contractual features and the fair market value of our convertible notes without the contractual features associated with the embedded derivative, in both cases using relevant market data. In the case of the fair market value of our convertible notes with all contractual features, the Hybrid Method is used utilizing probability-weighted expected return method combined with the option-price method. In the case of the fair market value of the convertible notes without those contractual features associated with the embedded derivative, a discounted cash flow approach is used.
Use of Estimates. The preparation of our consolidated financial statements requires us to make estimates and assumptions that affect the reported amounts of assets, liabilities, revenues and expenses and related disclosure of contingent assets and liabilities. Certain accounting policies involve judgments and uncertainties to such an extent that there is reasonable likelihood that materially different amounts could have been reported under different conditions or if different assumptions had been used. We evaluate our estimates and assumptions on a regular basis. We base our estimates on historical experience and various other assumptions that we believe to be reasonable under the circumstances, the results of which form the basis for making judgments about the carrying values of assets and liabilities that are not readily apparent from other sources. Actual results may differ from these estimates and from assumptions used in preparation of our combined financial statements. We provide expanded discussion of our more significant accounting policies, estimates and judgments below. We believe these accounting policies reflect our more significant estimates and assumptions used in preparation of our consolidated financial statements. See Note 2—Summary of Significant Accounting Policies to our consolidated financial statements for a discussion of additional accounting policies and estimates made by management.
Recently Adopted Accounting Standards and Recent Accounting Pronouncements
In December 2011 the FASB issued Accounting Standards Update (“ASU”) No. 2011-11, Balance Sheet (Topic 210), Disclosures about Offsetting Assets and Liabilities. ASU 2011-11 required entities to disclose both gross information and net information about both instruments and transactions eligible for offset in the statement of financial position and instruments and transactions subject to an agreement similar to a master netting arrangement. In January 2013, an update was issued to further clarify that the disclosure requirements are limited to derivatives, repurchase agreements, and securities lending transactions to the extent that they are (i) offset in the financial statements or (ii) subject to an enforceable master netting arrangement or similar agreement. Adoption of the new guidance, effective for the fiscal year beginning January 1, 2013, had no impact on the Company’s consolidated financial position, results of operations or cash flows. However, we were required to include additional disclosures relating to our derivative instruments.
69
Table of Contents
In May 2014, the Financial Accounting Standards Board issued ASU 2014-09, Revenue from Contracts with Customers. ASU 2014-09 amends the guidance for revenue recognition to replace numerous, industry-specific requirements. The core principle of the amendment is that an entity should recognize revenue for the transfer of goods or services equal to the amount that it expects to be entitled to receive for those goods or services. The amendment implements a five-step process for customer contract revenue recognition that focuses on transfer of control, as opposed to transfer of risk and rewards. The amendment also requires enhanced disclosures regarding the nature, amount, timing and uncertainty of revenues and cash flows arising from contracts with customers. The amendments are effective for reporting periods beginning after December 15, 2016, and early adoption is prohibited. Entities can transition to the standard either retrospectively to each period presented or as a cumulative-effect adjustment as of the date of adoption. We have not determined the impact the adoption of ASU 2014-09 will have on our consolidated financial statements or the method we will utilize upon adoption during the first quarter of 2017.
In August 2014, the FASB issued ASU 2014-15, Presentation of Financial Statements - Going Concern. The new standard requires management to assess an entity’s ability to continue as a going concern and to provide related disclosures in certain circumstances. Under the new guidance, disclosures are required when conditions give rise to substantial doubt about an entity’s ability to continue as a going concern within one year from the financial statement issuance date. The guidance is effective for annual periods ending after December 15, 2016, and all annual and interim periods thereafter. Early application is permitted. We do not expect the adoption of this guidance will have an impact on our financial position, results of operations or disclosure.
In April 2015, the FASB issued ASU 2015-03, “Simplifying the Presentation of Debt Issuance Costs.” ASU 2015-03 requires that debt issuance costs related to a recognized debt liability be presented in the balance sheet as a direct deduction from the carrying amount of that debt liability, consistent with debt discounts. The ASU is effective for annual periods beginning after December 15, 2015, and interim periods within those annual periods. The adoption of this pronouncement will result in a change in the presentation of debt issuance costs on our financials at the effective date.
No other new pronouncements materially affecting our financial statements were issued.
Inflation
Inflation in the United States has been relatively low in recent years and did not have a material impact on our results of operations for the years ended December 31, 2014, 2013 and 2012. Although the impact of inflation has been insignificant in recent years, it is still a factor in the United States economy, and our industry tends to experience inflationary pressure on the cost of oilfield services and equipment during periods when increasing oil and natural gas prices increase drilling activity.
Quantitative and Qualitative Disclosures about Market Risk
We are exposed to a variety of market risks including commodity price risk, interest rate risk and counterparty and customer risk. We address these risks through a program of risk management including the use of derivative instruments.
Commodity price exposure. We are exposed to market risk as the prices of oil and natural gas fluctuate as a result of changes in supply and demand and other factors. Due to the inherent volatility in oil and natural gas prices, we have used and may in the future use commodity derivative instruments, such as collars, swaps, puts and basis swaps to mitigate the price risk associated with a significant portion of our anticipated oil and natural gas production. By removing a majority of the price volatility associated with future production, we expect to reduce, but not eliminate, the potential effects of variability in cash flow from operations due to fluctuations in commodity prices. We have entered into and expect to continue to enter into derivative instruments in the future to cover a significant portion of our future production and to comply with covenants in the agreement governing our senior secured term loan.
70
Table of Contents
Commodity Derivative Sensitivity Analysis. Based on oil and natural gas futures prices as of December 31, 2014, and derivative arrangements outstanding as of December 31, 2014 and assuming both a 10% increase and decrease thereon, we would expect changes in the fair market value of our oil and natural gas derivative positions as follows (in thousands):
| Derivative Contract Fair Value |
||||
| Futures prices at December 31, 2014 |
$ | 63,101 | ||
| Futures prices 10% increase |
$ | 28,492 | ||
| Futures prices 10% decrease |
$ | 98,281 | ||
For additional information regarding our commodity derivative positions see “—Factors that Significantly Affect Our Results and How We Evaluate Our Operations—Realized Prices on the Sale of Oil and Natural Gas—Commodity Derivative Contracts.”
Interest rate risk. As of December 31, 2014, we had a $771.1 million outstanding balance on our senior secured term loan, which bears interest at floating rates, and $375 million principal amount of our convertible notes, which bear interest at an escalating fixed rate. See “—Liquidity and Capital Resources—Debt Facilities and Notes.” We may utilize interest rate derivatives to mitigate interest rate exposure to reduce interest rate expenses related to existing debt. Interest rate derivatives are used solely to modify interest rate exposure and not to modify the overall leverage of the debt portfolio. We had no interest rate derivatives at December 31, 2014.
Counterparty and customer credit risk. We are exposed to counterparty risk from the purchasers of our oil and natural gas, our operating partners, our derivative counterparties and our joint venture partners. Oil and natural gas and joint interest receivables are generally unsecured. Three customers made up approximately 82% of our accounts receivable as of December 31, 2014 and 89% of our revenues for the year ended December 31, 2014. Enterprise Crude Oil LLC, Texican Crude & Hydrocarbons, LLC and BP Energy Company made up approximately 31%, 39% and 12%, respectively of our accounts receivable and Enterprise Crude Oil LLC, Texican Crude & Hydrocarbons, LLC and Shell Trading Company (US) made up approximately 35%, 28% and 26%, respectively of our revenues for the period.
Our derivative instruments expose us to credit risk in the event of nonperformance by counterparties. It is our policy to enter into derivative contracts only with counterparties that are creditworthy financial institutions deemed by management as competent and competitive market makers. We evaluate the credit standing of such counterparties by reviewing their credit rating. The counterparties to our current derivative agreements have investment grade ratings.
The inability or failure of our significant purchasers or partners to meet their obligations to us or their insolvency or liquidation may adversely affect our financial results.
We maintain cash deposits in certain banks that at times exceeded the maximum insured by the Federal Deposit Insurance Corporation. We monitor the financial condition of the banks and have experienced no losses on these accounts.
Off-Balance Sheet Arrangements
We do not have any off-balance sheet arrangements.
71
Table of Contents
Overview
We are an independent exploration and production company focused on the acquisition, exploration, development and exploitation of conventional and unconventional oil and natural gas resources. As of March 31, 2015, we owned approximately 79,179 net acres, primarily in two basins: the East Texas Basin where we are pursuing opportunities in the Lower Cretaceous formations of the Buda, Georgetown, Edwards and Glen Rose (the Buda-Rose play), the Woodbine sandstone, the Goodland limestone and the Eagle Ford shale, which we refer to collectively as the East Texas stacked play; and the Denver-Julesburg Basin in Wyoming, which we refer to as the DJ Basin. We target liquids-rich resource plays and have built our leasehold acreage position through direct acquisitions from mineral owners and other exploration and production companies. Our management team has extensive engineering, geological, geophysical and technical expertise in our operating areas.
As of December 31, 2014, we had total estimated proved reserves of 45,580 MBoe, 18,260 MBoe of which were developed and 27,321 MBoe of which were undeveloped and 78% of which were oil and 61,655 MBoe of probable and possible reserves, of which 68% were oil. See “—Our Operations—Estimated proved, probable and possible reserves.” Pro forma for the Ft. Trinidad acquisition, our average daily net production increased significantly from approximately 6,016 Boe/day for the three months ended March 31, 2014 to 11,933 Boe/day for the three months ended December 31, 2014 and to approximately 13,573 Boe/day for the three months ended March 31, 2015, as currently estimated.
Our primary area of focus is the East Texas stacked play, in which we owned approximately 63,080 net acres as of March 31, 2015. On July 22, 2014, we completed the Ft. Trinidad acquisition, in which we acquired approximately 18,300 net acres in the Ft. Trinidad field in the East Texas stacked play, including interests in 45 gross (43.5 net) producing wells and 10 gross (9.8 net) wells waiting on completion, a 3-well salt water disposal system and approximately 30 square miles of 3D seismic data, for a purchase price of approximately $700 million in cash, after post-closing adjustments.
We are the operator of approximately 81% of our net acres in the East Texas stacked play and of 99% of our proved developed producing reserves as of December 31, 2014. We began drilling on our operated East Texas stacked play acreage in May 2013, and we have drilled or were in the process of drilling 60 gross (58.2 net) operated wells on this acreage as of March 31, 2015. As of March 31, 2015, 13 gross (12.9 net) wells were waiting on completion. We completed 5 wells during the three months ended March 31, 2015, and plan to complete 11 wells during the quarter ended June 30, 2015. In addition to our acreage in the East Texas stacked play, as of March 31, 2015 we had 14,162 net acres in the DJ Basin, where we have 100% operated working interests.
The majority of our capital expenditure budget for 2015 and 2016 is focused on the development of our operated acreage in the East Texas stacked play with vertical Buda-Rose wells. The following table presents summary data for our acreage in the East Texas stacked play and our other operating areas as of March 31, 2015 and our drilling capital budget of $97 million for the year ending December 31, 2015 and $115 million for the year ending December 31, 2016. We also have budgeted estimated capital expenditures of $9 million for the year ending December 31, 2015 and $13 million for the year ending December 31, 2016 for land acquisition, leasehold extension, seismic surveys and other capital needs. See “Management’s Discussion and Analysis of Financial Condition and Results of Operations—Liquidity and Capital Resources” and “—Capital Budget.”
| Drilling Capital Budget | ||||||||||||||||||||
| 2015(1) | 2016 | |||||||||||||||||||
| Net Acres | Net Wells | $ | Net Wells | $ | ||||||||||||||||
| (in millions) | (in millions) | |||||||||||||||||||
| East Texas Stacked Play(2) |
63,080 | 23 | $ | 97 | 41 | $ | 115 | |||||||||||||
| Other(3) |
16,098 | — | $ | — | — | $ | — | |||||||||||||
|
|
|
|
|
|
|
|
|
|
|
|||||||||||
| Total |
79,179 | 23 | $ | 97 | 41 | $ | 115 | |||||||||||||
|
|
|
|
|
|
|
|
|
|
|
|||||||||||
72
Table of Contents
| (1) | Includes approximately $37 million of drilling capital spent prior to March 31, 2015 and approximately $29 million to finish drilling and completion of wells that began drilling in 2014. |
| (2) | Operated working interests range from approximately 71% to 100% and non-operated working interests range from approximately 5% to 52%. |
| (3) | In addition to 14,162 net acres in the DJ Basin, includes 1,936 net acres in the Permian Basin in West Texas which we consider non-core and for which we have not allocated any capital in our budget through 2016. We have 100% operated working interests in the DJ Basin and the Permian Basin. |
Our Operating Areas
East Texas Stacked Play
As of March 31, 2015, we owned approximately 63,080 net acres in the East Texas stacked play located in Madison, Grimes, Leon, Houston and Walker Counties, Texas. We believe our East Texas stacked play acreage to be prospective for up to 14 zones, including our primary near-term objectives in the Buda-Rose limestone formations of the Buda, Georgetown, Edwards and Glen Rose and the Woodbine sandstone, the Goodland limestone and the Eagle Ford shale. We are currently evaluating the Austin Chalk and Sub Clarksville formations, which may eventually present us with additional drilling locations. We are also utilizing 3D seismic data to evaluate deep gas opportunities in the James Lime, Cotton Valley, Bossier and Haynesville formations.
The majority of our leases in the East Texas stacked play not held by production are in the second or third year of their three-year primary term and generally provide for either two- or three-year extension options. In 2015, we plan to drill 23 net wells and complete 30 net wells and have budgeted $98 million for estimated drilling and completion capital expenditures on our acreage in the East Texas stacked play, of which 6 wells had commenced drilling and $37 million of capital expenditures were made in prior to March 31, 2015. In 2016, we plan to drill 41 net wells and have budgeted $115 million for estimated drilling and completion capital expenditures on our acreage in the East Texas stacked play. Approximately 32,500 of our net acres in the East Texas stacked play are held by production including substantially all of the acreage acquired in the Ft. Trinidad acquisition.
We began drilling on our operated East Texas stacked play acreage in May 2013, and as of March 31, 2015, we have drilled or were in the process of drilling 60 gross (58.2 net) operated wells on this acreage. Of these wells, 46 gross (44.3 net) have been completed and placed on production, while the other 14 gross (13.9 net) wells were in various stages of drilling or completion. In the Ft. Trinidad acquisition, we acquired interests in 45 gross (43.5 net) producing wells and 10 gross (9.8 net) wells awaiting completion as of July 22, 2014. As of March 31, 2015, 13 gross (12.9 net) wells were waiting on completion. We expect to drill or commence drilling a total of 23 net wells and complete 30 net wells during 2015, including 14 wells that commenced drilling prior to March 31, 2015.
73
Table of Contents
The following table demonstrates production data on the vertical Buda-Rose wells we have drilled and completed on our East Texas acreage as of April 15, 2015. On average, the wells have recorded initial 30 day average production rates of 489 Boe/day as of April 15, 2015 and gross estimated ultimate recoveries of 320 MBoe as of December 31, 2014.
| No. of |
First |
Gross Production |
Peak Gross Wellhead Production (Boe/d per well) (1)(2) |
Gross D&C per well ($MM)(2) |
||||||||||||||||||||||||
| Well/Pad Name |
24 Hr |
30 day |
180 Days |
|||||||||||||||||||||||||
| Shelly 3. |
1 | Jan-13 | 258 | 876 | 745 | 521 | 4.0 | |||||||||||||||||||||
| Shelly 1. |
1 | Feb-13 | 194 | 1,256 | 933 | 517 | 3.9 | |||||||||||||||||||||
| Shelly 4. |
1 | Mar-13 | 35 | 333 | 111 | 87 | 3.8 | |||||||||||||||||||||
| Forrest A 5. |
1 | Apr-13 | 505 | 1,852 | 1,121 | 917 | 2.4 | |||||||||||||||||||||
| Elijah Carter Unit 1. |
1 | May-13 | 62 | 416 | 252 | 173 | 2.6 | |||||||||||||||||||||
| Carter Starns 1. |
1 | May-13 | 93 | 742 | 345 | 212 | 2.3 | |||||||||||||||||||||
| Turner Unit 1. |
1 | Jun-13 | 71 | 992 | 635 | 241 | 2.5 | |||||||||||||||||||||
| Forrest C 6. |
1 | Jul-13 | 41 | 979 | 237 | 98 | 2.9 | |||||||||||||||||||||
| Little Unit 1. |
1 | Aug-13 | 12 | 221 | 124 | 48 | 2.6 | |||||||||||||||||||||
| Shelly 5. |
1 | Aug-13 | 28 | 279 | 121 | 73 | 2.4 | |||||||||||||||||||||
| Shaw Unit 1. |
1 | Aug-13 | 6 | 178 | 100 | 35 | 2.0 | |||||||||||||||||||||
| Hunt Unit 1. |
1 | Sep-13 | 75 | 1,168 | 602 | 284 | 3.6 | |||||||||||||||||||||
| SJSF 52. |
1 | Oct-13 | 12 | 154 | 60 | 52 | 3.0 | |||||||||||||||||||||
| Forrest C 12. |
1 | Oct-13 | 238 | 1,425 | 921 | 763 | 3.0 | |||||||||||||||||||||
| Adams Unit 1. |
1 | Oct-13 | 19 | 331 | 191 | 102 | 3.0 | |||||||||||||||||||||
| Wakefield-Jones Unit 1. |
1 | Nov-13 | 124 | 1,235 | 841 | 517 | 3.0 | |||||||||||||||||||||
| Harrison Forrest Oil Unit 2. |
1 | Nov-13 | 99 | 617 | 362 | 258 | 2.4 | |||||||||||||||||||||
| Forrest C 11. |
1 | Dec-13 | 23 | 554 | 311 | 99 | 2.9 | |||||||||||||||||||||
| Harrison Forrest Oil Unit 3. |
1 | Dec-13 | 67 | 535 | 349 | 209 | 2.4 | |||||||||||||||||||||
| Jason Bourne State Unit 1. |
1 | Dec-13 | 9 | 245 | 105 | 35 | 2.4 | |||||||||||||||||||||
| Shelly 6. |
1 | Jan-14 | 207 | 1,199 | 854 | 688 | 2.8 | |||||||||||||||||||||
| Forrest 7. |
1 | Feb-14 | 13 | 564 | 163 | 82 | 8.1 | (3) | ||||||||||||||||||||
| Wakefield-Jones 100 Pad. |
3 | May-14 | 174 | 1,004 | 706 | 602 | 3.1 | |||||||||||||||||||||
| Carolyn 100 Pad. |
2 | Jun-14 | 164 | 1,110 | 946 | 637 | 3.1 | |||||||||||||||||||||
| Shelly 7. |
1 | Jun-14 | 91 | 1,244 | 768 | 412 | 5.0 | |||||||||||||||||||||
| Harrison Forrest 100 Pad. |
3 | Jun-14 | 38 | 685 | 294 | 196 | 2.9 | |||||||||||||||||||||
| Forrest C 200 Pad. |
2 | Jul-14 | 44 | 511 | 408 | 213 | 2.3 | |||||||||||||||||||||
| Crowson Nash 100 Pad. |
2 | Aug-14 | 23 | 274 | 175 | 99 | 3.5 | |||||||||||||||||||||
| Maples 100 Pad. |
2 | Oct-14 | 32 | 698 | 284 | 158 | 2.7 | |||||||||||||||||||||
| Shelly 200 Pad. |
4 | Oct-14 | 65 | 853 | 509 | 358 | 3.8 | |||||||||||||||||||||
| Shelly 100 Pad. |
4 | Oct-14 | 82 | 850 | 608 | 448 | 4.0 | (3) | ||||||||||||||||||||
| Comanchero Unit A 1H. |
1 | Nov-14 | 14 | 484 | 205 | 7.0 | ||||||||||||||||||||||
| Johnny Ringo A 1. |
1 | Nov-14 | 31 | 909 | 361 | 3.4 | ||||||||||||||||||||||
| Jeanette 100 Pad. |
2 | Nov-14 | 77 | 973 | 749 | 3.6 | ||||||||||||||||||||||
| Butler 100 Pad. |
3 | Nov-14 | 72 | 892 | 698 | 3.7 | ||||||||||||||||||||||
| SJSF - 53. |
1 | Dec-14 | 1 | 218 | 33 | 4.2 | ||||||||||||||||||||||
| Forrest C 400 Pad. |
3 | Dec-14 | 10 | 270 | 177 | 3.4 | ||||||||||||||||||||||
| Joyce 100 Pad. |
2 | Dec-14 | 75 | 1,152 | 778 | 4.6 | (3) | |||||||||||||||||||||
| Forrest 700 Pad (4). |
2 | Mar-15 | 21 | 928 | 2.7 | (3)(5) | ||||||||||||||||||||||
| Weighted Average |
78 | 761 | 460 | 317 | 3.4 | |||||||||||||||||||||||
74
Table of Contents
| Recompleted Wells(6) | First Production |
Gross Cumulative Production (MBoe) |
Peak Gross Wellhead Production (Boe/d) (1) |
Recompletion Cost ($MM) |
||||||||||||||||||||
| Well Name |
24 Hr | 30 day | 180 Days | |||||||||||||||||||||
| Forrest 2 |
May-12 | 311 | 1,014 | 754 | 605 | 1.9 | ||||||||||||||||||
| Shelly 2 |
Sep-12 | 274 | 1,540 | 965 | 796 | 1.7 | ||||||||||||||||||
| Maples 1 |
Sep-12 | 276 | 849 | 685 | 547 | 1.3 | ||||||||||||||||||
| W Forrest 4 |
Nov-12 | 305 | 1,353 | 1,056 | 609 | 2.0 | ||||||||||||||||||
| Turner Unit 2 |
Jun-13 | 117 | 654 | 471 | 279 | 1.2 | ||||||||||||||||||
| Harrison Forrest Oil Unit 8-1 |
Jun-13 | 231 | 1,310 | 962 | 732 | 1.6 | ||||||||||||||||||
| SJSF 45 |
Aug-13 | 4 | 135 | 41 | 17 | 0.7 | ||||||||||||||||||
| SJSF 7 (51-7) |
Aug-13 | 18 | 175 | 90 | 53 | 0.8 | ||||||||||||||||||
| Shaw Unit 2 |
Oct-13 | 62 | 492 | 277 | 157 | 1.9 | ||||||||||||||||||
| Westmar Unit 55-1 |
Apr-14 | 34 | 459 | 297 | 171 | 2.6 | ||||||||||||||||||
| Weighted Average |
163 | 798 | 560 | 397 | 1.6 | |||||||||||||||||||
|
|
||||||||||||||||||||||||
| Weighted Average of All Wells |
90 | 766 | 475 | 331 | ||||||||||||||||||||
|
|
||||||||||||||||||||||||
| (1) | 24-hour peak gross wellhead production refers to the highest 24-hour gross production recorded during the life of the well/pad. All other peak gross wellhead production data refer to the highest average gross production recorded for the consecutive number of days specified during the life of the well/pad. Data is omitted where a well/pad has not been in production for the specified consecutive number of days. |
| (2) | Per well data from multi-well production pads represents the total production for the pad divided by the number of wells on that pad. |
| (3) | One or more wells sidetracked resulting in additional cost. |
| (4) | As of April 25, 2015, these wells were flowing back for less than 30 days. The 24-hour peak gross wellhead production is the peak test rate only through April 15, 2015. |
| (5) | Management estimate. |
| (6) | Reentry in existing wellbore and recompleted in different zones. |
In September 2012, we, together with other operators, contracted with a leading geophysical services company to acquire a 330-square-mile 3D seismic survey covering a majority of our operated and non-operated acreage position in Grimes and Madison Counties and the southern portion of Leon County. Seismic field acquisition activities were completed in October 2013 and interpretation is ongoing. Including the approximately 30-square-mile 3D seismic from the Ft. Trinidad acquisition, we have approximately 360 square miles of 3D seismic data covering our acreage.
Recently, there has been significant industry activity in the East Texas stacked play, which, for purposes of industry comparisons, we define as Brazos, Burleson, Grimes, Houston, Leon, Madison, Robertson, and Walker Counties, Texas. The most active operators offsetting our acreage position include EOG Resources, Inc., Halcón Resources Corporation, Anadarko Petroleum Corporation, Cabot Oil & Gas Corporation, Devon Energy Corporation, Apache Corporation, MD America Holdings, LLC, Burk Royalty Company, Silver Oak Energy, LLC, ZaZa Energy Corporation, Contango Oil & Gas Company, Crimson Energy Partners III, L.L.C. and SM Energy Company. According to Drilling Info, Inc. there were 396 drilling permits filed in 2012, 511 drilling permits filed in 2013 and 878 permits filed in 2014 in the East Texas stacked play.
DJ Basin
As of March 31, 2015, we owned approximately 14,162 net undeveloped acres in the DJ Basin with a 100% operated working interest. Our DJ Basin acreage is in Laramie and Goshen Counties, Wyoming. Our DJ Basin leasehold acreage is focused on the western, northern and eastern extensions of the Silo Field in Laramie County, Wyoming, and the deepest parts of the basin in Goshen County, Wyoming. We are evaluating several zones within the Niobrara shale, Fort Hays limestone and Codell sand formations. Additional targets include the J Sandstone, Dakota sandstone, Greenhorn limestone and Lyons sandstone formations along with Permian and Pennsylvanian objectives. We believe our DJ Basin leasehold acreage is in areas with a higher incidence of naturally induced faulting and fracturing and moderate to high Niobrara resistivities. The majority of our leases in the DJ Basin are in the third year of their five-year primary term and generally provide for three- to five-year extension options. Our drilling capital budget does not include any amounts allocated to develop our DJ Basin acreage in 2015 and 2016.
75
Table of Contents
Our Strategy
We intend to actively drill and develop our acreage position in the East Texas stacked play in an effort to maximize its value and resource potential. Through the conversion of our undeveloped acreage, which we believe has significant oil-weighted resource potential, we will seek to increase our production, reserves and cash flow while generating attractive returns on invested capital.
Strategically drill and develop our existing acreage positions. We plan to strategically drill and develop our East Texas stacked play acreage. For 2015, we plan to drill 23 net wells and complete 30 net wells and have budgeted $97 million for estimated drilling capital expenditures in our acreage in the East Texas stacked play. In 2016, we plan to drill 41 net wells and have budgeted $115 million for estimated drilling capital expenditures on our acreage in the East Texas stacked play.
Leverage technology to maximize inventory of high quality drilling prospects. The majority of our East Texas stacked play acreage is characterized by multiple productive intervals including the Buda-Rose limestone formations of the Buda, Georgetown, Edwards and Glen Rose, the Woodbine sandstone, the Goodland limestone and the Eagle Ford shale. We received data from a 330-square-mile seismic survey from a leading geophysical services company starting in October 2013, and interpretation is ongoing. We also acquired approximately 30 square miles of 3D seismic data in the Ft. Trinidad acquisition. We intend to use this 3D seismic data, micro-seismic data and other advanced technologies for well planning and reservoir characterization, as well as to delineate hazards and locate bypassed pay. Our highly skilled staff of geophysicists and geologists have analyzed over 4,500 well logs in the East Texas stacked play and have extensive experience in using such technologies to optimize completions and resource recovery.
Enhance returns through operational efficiencies as our rig count and well count grow. We intend to focus on the continuous improvement of our operating measures as we seek to convert our undeveloped East Texas stacked play acreage into a cost-efficient development project. We are the operator of approximately 99% of our proved developed producing reserves as of December 31, 2014 and 81% of our East Texas stacked play acreage as of March 31, 2015, and our acreage position is generally in large contiguous blocks. This operational control will allow us to more efficiently manage the pace of development activities and the gathering and marketing of our production and control operating costs and technical applications, including horizontal and vertical development. Our operations team will continue to evaluate our operating results against those of other operators in the area in order to benchmark our performance relative to other operators and adopt best practices to decrease drilling times, optimize completions and increase EURs.
Selectively acquire additional leasehold acreage in our existing core area. We have a proven history of acquiring leasehold positions that we believe have substantial oil-weighted resource potential and can meet our targeted returns on invested capital. We plan to continue to leverage the relationships of our experienced land professionals to pursue select additional leasehold acquisitions in the East Texas stacked play that meet our strategic and financial targets.
Maintain sufficient liquidity to execute our capital plan. As of April 27, 2015, we had approximately $32 million of cash on hand. We expect that cash on hand and cash flows from operations will fully fund our capital expenditure budget for 2015. Our commodity derivative contracts had a mark-to-market value of approximately $54 million as of April 8, 2015. In addition, subject to obtaining the participation of existing or new lenders and other conditions, we may incur additional loans of up to $175 million under our senior secured term loan. We also may pursue dispositions of non-core assets to provide additional drilling capital and liquidity. We intend to actively manage our exposure to commodity price risk through commodity derivative positions on our anticipated future production.
76
Table of Contents
Our Strengths
We believe we are well positioned to successfully execute our business strategies and achieve our business objectives because of the following competitive strengths:
Large acreage position in our East Texas stacked play area. We owned approximately 63,080 net acres in the East Texas stacked play as of March 31, 2015. The majority of our leasehold acreage is in or near areas of considerable activity by large independent operators, although such activity may not be indicative of our future operations. We believe that lease terms on our acreage and our current drilling plan allow us enough time to drill wells that will hold a substantial portion of our acreage by production.
Rapidly growing, oil-weighted production profile. Pro forma for the Ft. Trinidad acquisition, our average net production has increased, from approximately 6,016 Boe/day for the three months ended March 31, 2014 to approximately 13,573 Boe/day for the three months ended March 31, 2015, as currently estimated. In addition, our production primarily consists of oil; for the year ended December 31, 2014 production was 76% oil, 12% natural gas liquids and 12% natural gas.
Substantial drilling inventory. We estimate there are approximately 2,061 net potential drilling locations across our existing acreage in the East Texas stacked play, including 96 net vertical Buda-Rose and 14 net horizontal Woodbine proved undeveloped locations. We estimate there are an additional 779 net potential vertical Buda-Rose locations based on 40 to 160 acre spacing, 947 net potential horizontal Woodbine, Eagle Ford and Goodland locations based on 100 to 320 acre spacing and approximately 226 net potential vertical locations in the Edwards and Glen Rose formations. During 2015 and 2016, we anticipate drilling 64 net wells on our East Texas stacked play acreage, leaving us a substantial drilling inventory for future years.
Operating control over the majority of our asset portfolio. In order to better maintain control over our portfolio, we have established a leasehold position comprised primarily of operated properties. This includes operating approximately 81% of our East Texas stacked play acreage and 100% of our DJ Basin acreage as of March 31, 2015 and 99% of our proved developed producing reserves as of December 31, 2014. As operator, we have primary control over prospect selection and exploration and development timing and capital allocation, as well as the ability to implement logistical practices that we believe will allow us to shorten the time between our drilling and completion operations and first production.
Proximity to significant industry infrastructure and access to multiple product markets. Our acreage in the East Texas stacked play is near substantial existing hydrocarbon gathering, transportation, processing and refining capacity, and has access to multiple product sales points. We believe our East Texas stacked play oil production can generally be sold at a price that is close to New York Mercantile Exchange-West Texas Intermediate (NYMEX-WTI) benchmark prices due to the East Texas stacked play’s proximity to the Gulf Coast. Consequently, our oil production benefits from higher realized pricing differentials relative to many North American crude oil producers in other areas, which can often trade at a more significant discount to NYMEX-WTI benchmark prices. For example, for the three months ended December 31, 2014, the average realized price for our oil production was $70.00/Bbl compared to production weighted average NYMEX-WTI index price of $71.73/Bbl for the same period.
Experienced and incentivized technical, operational and management teams. Our senior technical team is comprised of geoscience, engineering and operational professionals who average approximately 34 years of industry experience. Members of our technical team have previously held technical and management positions with major and independent oil and natural gas companies, including Anadarko Petroleum Corporation, Mobil Corporation, Exxon Corporation and Encana Corporation. Our core management and operational team has built our existing significant acreage positions in the East Texas stacked play and our other operating areas. We believe that equity ownership is one of the best ways to motivate management and employees. Our management has been and will continue to be compensated with equity incentives.
77
Table of Contents
Ft. Trinidad acquisition
On July 22, 2014, we completed the acquisition from TreadStone of approximately 18,300 net acres in the Ft. Trinidad field in the East Texas stacked play, including interests in 45 gross (43.8 net) producing wells and 10 gross (9.8 net) wells waiting on completion, for an initial purchase price of approximately $719 million in cash, subject to customary post-closing adjustments. Subsequent to the initial closing, we recognized net negative post-closing adjustments of $19 million, resulting in a cash purchase price of approximately $700 million. The purchase price is subject to additional post-closing adjustments. We refer to this transaction as the Ft. Trinidad acquisition. The assets acquired from TreadStone include 32,728 MBoe of proved reserves (8,866 MBoe developed) as of June 1, 2014 and estimated production of approximately 7,107 Boe/day for the three months ended June 30, 2014. We operate all of the acreage and have an average 89.6% working interest and 83.4% net revenue interest in the acreage acquired in the Ft. Trinidad acquisition. The assets acquired from TreadStone also include a 3-well salt water disposal system currently running at 30% of its total capacity of 66 Mbbl of water per day. Since acquiring the assets in 2012, TreadStone spent approximately $189 million in development capital through June 30, 2014.
The purchase and sale agreement for the Ft. Trinidad acquisition provides for an effective date for the acquisition of April 1, 2014 and includes customary representations and warranties of the parties. The sellers are required to indemnify us for certain losses, including losses resulting from breaches by the sellers of the purchase and sale agreement and the ownership and operation of the acquired leases prior to the effective date. The sellers’ liability for indemnification is subject to individual and aggregate baskets and is capped at 10% of the unadjusted purchase price. We will be required to indemnify the sellers for certain losses, including losses resulting from breaches by us of the purchase and sale agreement and the ownership and operation of the acquired leases after the effective date.
Chesapeake Acquisition
In April 2013, we acquired 57,275 net acres in the East Texas stacked play from affiliates of Chesapeake Energy Corporation and certain co-owners, which we refer to as the Chesapeake acquisition, including nine producing wells, one well awaiting a pipeline connection and one non-producing well, for approximately $93 million, consisting of approximately $75 million in cash and a subordinated promissory note in the original principal amount of $18 million, which we refer to as the Chesapeake note. We generally have a 100% working interest in the acreage acquired in the Chesapeake acquisition, and we will operate all of the acreage acquired unless we enter into subsequent joint operating agreements with other operators.
Our Operations
Acreage
The following table sets forth certain information regarding our undeveloped and developed acreage in the East Texas stacked play and our other operating areas as of March 31, 2015. Acreage related to royalty, overriding royalty and other similar interests is excluded from this summary.
|
Undeveloped |
Developed Acres | Total | % of Acreage Held by Production |
|||||||||||||||||||||||||
| Gross | Net | Gross | Net | Gross | Net | |||||||||||||||||||||||
| Operated East Texas stacked play |
20,816 | 19,770 | 35,621 | 31,460 | 56,437 | 51,230 | 61 | % | ||||||||||||||||||||
| Non-operated East Texas stacked play |
43,459 | 10,846 | 4,289 | 1,004 | 47,748 | 11,850 | 8 | % | ||||||||||||||||||||
|
|
|
|
|
|
|
|
|
|
|
|
|
|
|
|||||||||||||||
| Total East Texas stacked play |
64,275 | 30,616 | 39,910 | 32,465 | 104,185 | 63,080 | 51 | % | ||||||||||||||||||||
| Other |
16,098 | 16,098 | — | — | 16,098 | 16,098 | 0 | % | ||||||||||||||||||||
|
|
|
|
|
|
|
|
|
|
|
|
|
|
|
|||||||||||||||
| Total(1) |
80,374 | 46,714 | 39,910 | 32,465 | 120,284 | 79,179 | 41 | % | ||||||||||||||||||||
|
|
|
|
|
|
|
|
|
|
|
|
|
|
|
|||||||||||||||
| (1) | Certain totals may not add due to rounding. |
78
Table of Contents
Undeveloped acreage expirations
The following table sets forth the number of gross and net undeveloped acres in the East Texas stacked play and our other operating areas as of March 31, 2015 that will expire in the periods indicated unless production is established within the spacing units covering the acreage prior to the expiration dates. The table assumes we exercise all available lease extension options on our East Texas stacked play and DJ Basin acreage. Of the 148 gross undeveloped drilling locations included in our reserve report dated December 31, 2014, 145 are located on developed acreage and should not be subject to any potential lease expirations. Substantially all of the acreage acquired in the Ft. Trinidad acquisition is currently held by production.
| 2015 | 2016 | 2017 | 2018+ | |||||||||||||||||||||||||||||
| Gross | Net | Gross | Net | Gross | Net | Gross | Net | |||||||||||||||||||||||||
| Operated East Texas stacked play |
11,897 | 10,851 | 5,709 | 5,709 | 2,267 | 2,267 | 942 | 942 | ||||||||||||||||||||||||
| Non-operated East Texas stacked play |
5,688 | 1,467 | 12,660 | 3,214 | 22,005 | 5,387 | 3,106 | 777 | ||||||||||||||||||||||||
|
|
|
|
|
|
|
|
|
|
|
|
|
|
|
|
|
|||||||||||||||||
| Total East Texas stacked play |
17,585 | 12,319 | 18,370 | 8,924 | 24,272 | 7,654 | 4,048 | 1,719 | ||||||||||||||||||||||||
| Other |
2,732 | 2,732 | 556 | 556 | 3,771 | 3,771 | 9,039 | 9,039 | ||||||||||||||||||||||||
|
|
|
|
|
|
|
|
|
|
|
|
|
|
|
|
|
|||||||||||||||||
| Total(1) |
20,317 | 15,050 | 18,926 | 9,480 | 28,044 | 11,426 | 13,087 | 10,758 | ||||||||||||||||||||||||
|
|
|
|
|
|
|
|
|
|
|
|
|
|
|
|
|
|||||||||||||||||
| (1) | Certain totals may not add due to rounding. |
Many of the leases comprising the acreage set forth in the table above will expire at the end of their respective primary terms unless production from the leasehold acreage has been established prior to such date, in which event the lease will remain in effect until the cessation of production in commercial quantities. While we may attempt to secure a new lease upon the expiration of certain of our acreage, there are some third-party leases that may become effective immediately if our leases expire at the end of their respective terms and production has not been established prior to such date. We have options to extend many of our leases through payment of additional lease bonus payments prior to the expiration of the primary term of the leases, and the table above assumes that we exercise those options. Our leases are mainly fee leases with three to five years of primary term.
Productive wells and drilling activity
The following table presents our total gross and net productive wells in the East Texas stacked play and our other operating areas by oil or natural gas completion as of March 31, 2015:
| Gross Productive Wells |
Net Productive Wells | |||||||||||||||||||||||||||
| Oil | Natural Gas |
Total | Oil | Natural Gas |
Total | % Operated | ||||||||||||||||||||||
| East Texas stacked play |
103 | 12 | 115 | 91.5 | 10.7 | 102.2 | 90 | % | ||||||||||||||||||||
| Other |
— | — | — | — | — | — | ||||||||||||||||||||||
|
|
|
|
|
|
|
|
|
|
|
|
|
|
|
|||||||||||||||
| Total |
103 | 12 | 115 | 91.5 | 10.7 | 102.2 | 90 | % | ||||||||||||||||||||
|
|
|
|
|
|
|
|
|
|
|
|
|
|
|
|||||||||||||||
The following table presents our total gross and net productive wells in the East Texas stacked play and our other operating areas by oil or natural gas completion as of December 31, 2014:
| Gross Productive Wells |
Net Productive Wells | |||||||||||||||||||||||||||
| Oil | Natural Gas |
Total | Oil | Natural Gas |
Total | % Operated | ||||||||||||||||||||||
| East Texas stacked play |
99 | 12 | 111 | 87.8 | 10.7 | 98.5 | 90 | % | ||||||||||||||||||||
| Other |
— | — | — | — | — | — | — | |||||||||||||||||||||
|
|
|
|
|
|
|
|
|
|
|
|
|
|
|
|||||||||||||||
| Total |
99 | 12 | 111 | 87.8 | 10.7 | 98.5 | 90 | % | ||||||||||||||||||||
|
|
|
|
|
|
|
|
|
|
|
|
|
|
|
|||||||||||||||
79
Table of Contents
“Gross wells” represents the number of wells in which a working interest is owned, and “net wells” represents the total of our fractional working interests owned in gross wells.
The following table summarizes our drilling activity for the years ended December 31, 2013 and 2014. We did not drill any development wells during 2013.
| Year Ended December 31, 2013 |
Year Ended December 31, 2014 |
|||||||||||||||
| Gross | Net | Gross | Net | |||||||||||||
| Exploratory Wells |
||||||||||||||||
| Productive |
14 | 10.1 | 19 | 14.7 | ||||||||||||
| Dry |
2 | 0.4 | — | — | ||||||||||||
| Development Wells |
||||||||||||||||
| Productive |
— | — | 21 | 20.7 | ||||||||||||
| Dry |
— | — | — | — | ||||||||||||
| Total Wells |
||||||||||||||||
| Productive |
14 | 10.1 | 40 | 35.4 | ||||||||||||
| Dry |
2 | 0.4 | — | — | ||||||||||||
|
|
|
|
|
|
|
|
|
|||||||||
| Total |
16 | 10.5 | 40 | 35.4 | ||||||||||||
|
|
|
|
|
|
|
|
|
|||||||||
As of December 31, 2014, we had 12 gross (11.8 net) operated wells in various stages of drilling or completion. As of March 31, 2015, we had 14 gross (13.9 net) operated wells in various stages of drilling or completion.
Estimated proved, probable and possible reserves
The summary data presented below with respect to our estimated proved reserves as of December 31, 2012, December 31, 2013 and December 31, 2014 and our estimated probable and possible reserves as of December 31, 2014 have been prepared by Cawley, Gillespie & Associates, Inc., our independent reserve engineering firm, in accordance with rules and regulations of the SEC applicable to companies involved in oil and natural gas producing activities.
The information in this prospectus regarding oil and natural gas reserves represents estimates only. Oil and natural gas reserve engineering is inherently a subjective process of estimating underground accumulations of oil and natural gas that cannot be measured exactly. The accuracy of any reserve estimate is a function of the quality of available data and engineering and geological interpretation and judgment. Accordingly, reserve estimates may vary from the quantities of oil and natural gas that are ultimately recovered. Further, estimates of probable and possible reserves are inherently more uncertain than estimates of proved reserves. For a discussion of some of the risks associated with estimating reserves, see “Risk Factors—Risks Related to the Oil and Natural Gas Industry and Our Business—Our estimated reserves are based on many assumptions that may turn out to be inaccurate. Any significant inaccuracies in these reserve estimates or underlying assumptions will materially affect the quantities and present value of our reserves.” For additional information regarding estimations of our proved, probable and possible reserves, see “—Preparation of reserves estimates and internal controls over reserve estimation process” and “—Technology used to establish reserves.”
As of December 31, 2012, 2013 and 2014, all of our reserves were owned by our wholly owned subsidiary, ENXP LLC.
80
Table of Contents
The table below summarizes for the East Texas stacked play and our other operating areas, our estimated proved reserves as of December 31, 2012, 2013 and 2014 and our estimated probable and possible reserves as of December 31, 2014. We had no proved undeveloped reserves as of December 31, 2012.
| As of December 31, |
||||||||||||
| 2012(1) | 2013(1) | 2014(1) | ||||||||||
| Proved reserves: |
||||||||||||
| East Texas stacked play |
||||||||||||
| Oil (MBbl) |
18 | 5,859 | 35,495 | |||||||||
| Natural gas (MMcf)(2) |
31 | 7,188 | 30,487 | |||||||||
| Natural gas liquids (MBbl) |
— | — | 5,004 | |||||||||
| Equivalent (MBoe) |
24 | 7,057 | 45,580 | |||||||||
| DJ Basin(4) |
||||||||||||
| Oil (MBbl) |
5 | — | — | |||||||||
| Natural gas (MMcf) |
18 | — | — | |||||||||
| Equivalent (MBoe) |
8 | — | — | |||||||||
|
|
|
|
|
|
|
|||||||
| Total equivalent (MBoe) |
32 | 7,057 | 45,580 | |||||||||
|
|
|
|
|
|
|
|||||||
| Proved developed reserves: |
||||||||||||
| Oil (MBbl) |
23 | 1,947 | 13,948 | |||||||||
| Natural gas (MMcf)(2) |
49 | 2,897 | 12,993 | |||||||||
| Natural gas liquids (MBbl) |
— | — | 2,147 | |||||||||
| Equivalent (MBoe) |
32 | 2,430 | 18,260 | |||||||||
| Proved undeveloped reserves(4): |
||||||||||||
| Oil (MBbl) |
— | 3,912 | 21,547 | |||||||||
| Natural gas (MMcf)(2) |
— | 4,292 | 17,495 | |||||||||
| Natural gas liquids (MBbl) |
— | — | 2,858 | |||||||||
| Equivalent (MBoe) |
— | 4,627 | 27,321 | |||||||||
| Total proved developed reserves as a percent of total proved reserves |
100 | % | 34 | % | 40 | % | ||||||
| Oil as a percent of total proved reserves |
72 | % | 83 | % | 78 | % | ||||||
| PV-10 (in thousands)(5) |
$ | 875 | $ | 149,045 | $ | 1,483,140 | ||||||
| Proved developed PV-10 as a percent of total PV-10 |
100 | % | 60 | % | 50 | % | ||||||
| Probable reserves(6): |
||||||||||||
| Oil (MBbl) |
9,716 | |||||||||||
| Natural gas (MMcf) |
42,323 | |||||||||||
| Natural gas liquids (MBbls) |
4,715 | |||||||||||
| Equivalent (MBoe) |
21,484 | |||||||||||
| Oil as a percent of total probable reserves |
45 | % | ||||||||||
| PV-10 (in thousands)(5) |
$ | 237,929 | ||||||||||
| Possible reserves(6): |
||||||||||||
| Oil (MBbl) |
32,232 | |||||||||||
| Natural gas (MMcf) |
23,479 | |||||||||||
| Natural gas liquids (MBbl) |
4,026 | |||||||||||
| Equivalent (MBoe) |
40,171 | |||||||||||
| Oil as a percent of total possible reserves |
80 | % | ||||||||||
| PV-10 (in thousands)(5) |
$ | 519,607 | ||||||||||
| (1) | Our estimated proved, probable and possible reserves were determined using index prices for oil and natural gas without giving effect to derivative transactions, and were held constant throughout the life of the properties. The unweighted arithmetic average first-day-of-the-month prices for the twelve months ended December 31, 2014, December 31, 2013 and December 31, 2012 were $94.99/Bbl, $96.94/Bbl and $94.71/Bbl for oil respectively, and $4.35/MMBtu, $3.67/MMBtu, and $2.75/MMBtu for natural gas, respectively. These prices were adjusted by well for gravity, quality, heating value, shrinkage, transportation |
81
Table of Contents
| and marketing. Including such adjustments, the prices as of December 31, 2014, December 31, 2013 and December 31, 2012 were $93.71/Bbl, $95.16/Bbl and $91.68/Bbl for oil, respectively, $4.04/Mcf, $3.39/Mcf and $3.34/Mcf for natural gas, respectively and $31.35/Bbl for natural gas liquids as of December 31, 2014. |
| (2) | Includes immaterial amounts of natural gas liquids at December 31, 2012 and 2013. |
| (3) | Consists of reserves attributable to DJ Basin assets located in Weld County, Colorado, which we sold in June 2013. |
| (4) | As of December 31, 2014, includes 108 gross (95.7 net) vertical Buda-Rose drilling locations with simple average estimated ultimate recoveries of 293 MBoe gross (239 MBoe net) per well, average working interest of 88.6%, average net revenue interest of 82.3% and estimated gas shrinkage of 32%. Also includes 25 gross (24.7 net) vertical Edwards drilling locations and 15 gross (13.5 net) horizontal Woodbine and Eagle Ford drilling locations. |
| (5) | PV-10 is a non-GAAP financial measure. PV-10 of proved reserves is derived from Standardized Measure, which is the most directly comparable GAAP financial measure. PV-10 of proved reserves is equal to the Standardized Measure of discounted future net cash flows at the applicable date, before deducting future income taxes, discounted at 10%. We believe that the presentation of PV-10 is relevant and useful to investors because it presents the relative monetary significance of our properties regardless of tax structure. Further, investors may utilize the measure as a basis for comparison of the relative size and value of our proved reserves to other companies. We use this measure when assessing the potential return on investment related to our oil and natural gas properties. However, PV-10 is not equal to, nor a substitute for, the Standardized Measure of discounted future net cash flows. Moreover, GAAP does not provide a measure of estimated future net cash flows for reserves other than proved reserves. PV-10 estimates for reserve categories other than proved use the relevant reserve volumes, but PV-10 is otherwise calculated using the same assumptions as those for, and in a manner consistent with, the calculation of Standardized Measure. Nonetheless, we believe that PV-10 estimates for reserve categories other than proved present useful information for investors about the future net cash flows of our reserves in the absence of a comparable GAAP measure such as Standardized Measure. Investors should be cautioned that estimates of PV-10 of probable reserves, as well as the underlying volumetric estimates, are inherently more uncertain of being recovered and realized than comparable measures for proved reserves, and that the uncertainty for possible reserves is even more significant. Further, because estimates of probable and possible reserve volumes and PV-10 have not been adjusted for risk due to this uncertainty of recovery, they should not be summed arithmetically with each other or with comparable estimates for proved reserves. Our PV-10 and the Standardized Measure of discounted future net cash flows do not purport to present the fair value of our proved reserves. See “—Reconciliation of PV-10 to Standardized Measure” below. |
| (6) | All of our estimated probable and possible reserves are classified as undeveloped. |
Reconciliation of PV-10 to Standardized Measure
Standardized Measure represents the present value of estimated future cash inflows from proved reserves, less future development, production and income tax expenses, discounted at 10% per annum to reflect timing of future cash flows.
The following table provides a reconciliation of PV-10 of proved reserves to the GAAP financial measure of Standardized Measure as of December 31, 2012, 2013 and 2014.
| As of December 31, | ||||||||||||
| 2012 | 2013 | 2014 | ||||||||||
| (unaudited) ($ thousands) | ||||||||||||
| Present value of estimated future net revenues (PV-10) |
$ | 875 | $ | 149,045 | $ | 1,483,140 | ||||||
| Future income taxes, discounted at 10% |
$ | (237 | ) | $ | (35,159 | ) | $ | (269,042 | ) | |||
|
|
|
|
|
|
|
|||||||
| Standardized measure of discounted future net cash flows |
$ | 638 | $ | 113,886 | $ | 1,214,098 | ||||||
|
|
|
|
|
|
|
|||||||
82
Table of Contents
Proved undeveloped reserves
As of December 31, 2014, our proved undeveloped reserves were 27,321 MBoe, an increase of 22,694 MBoe from December 31, 2013. The following table summarizes the changes in our proved undeveloped reserves during the year ended December 31, 2014 (in MBoe):
| Proved undeveloped reserves as of December 31, 2013 |
4,627 | |||
| Purchases of reserves |
28,740 | |||
| Extensions and discoveries |
3,018 | |||
| Revisions of previous estimates |
(1,313) | |||
| Transfers to proved developed |
(7,751) | |||
|
|
|
|||
| Proved undeveloped reserves as of December 31, 2014 |
27,321 | |||
|
|
|
Purchases of reserves related to the Ft. Trinidad acquisition in July 2014. As of June 1, 2014, proved undeveloped reserves attributable to the properties acquired in the Ft. Trinidad acquisition were 23,862 MBoe. Extensions and discoveries related primarily to the drilling of new wells during 2014. Revisions of previous estimates were primarily due to a reduction in the number of proved undeveloped horizontal Woodbine locations. Costs incurred relating to the development of proved reserves were approximately $86.1 million during the year ended December 31, 2014. All of our proved undeveloped reserves as of December 31, 2014 are expected to be developed within five years of their initial disclosure as proved undeveloped reserves.
Preparation of reserves estimates and internal controls over reserve estimation process
Our estimated reserves at December 31, 2012, December 31, 2013 and December 31, 2014 and the estimated reserves attributable to the properties acquired in the Ft. Trinidad acquisition at June 1, 2014 were prepared by Cawley, Gillespie and Associates, Inc., or Cawley, Gillespie, our independent reserve engineers. No director, officer or key employee of Cawley, Gillespie has any financial ownership in us. Cawley, Gillespie’s compensation for the required investigations and preparation of its reports is not contingent upon the results obtained and reported.
Our internal professional staff works closely with Cawley, Gillespie to ensure the integrity, accuracy and timeliness of data that is furnished to them for their reserve estimation process. All of the reserve information maintained in our secure reserve engineering database is provided to the external engineers. In addition, we provide Cawley, Gillespie other pertinent data, such as seismic information, geologic maps, well logs, production tests, well performance data, operating procedures and relevant economic criteria. We make all requested information, as well as our pertinent personnel, available to the external engineers as part of their evaluation of our reserves. We expect to have our reserve estimates prepared by independent third-party reserve engineers at least annually.
John Richards is the technical person responsible for overseeing the preparation of our reserve estimates. Mr. Richards has over 35 years of industry experience with positions of increasing responsibility in engineering, operations and management with companies such as Union Pacific Resources, Anadarko Petroleum and EnCana Oil & Gas. He holds a Bachelor of Science Degree in Mechanical Engineering from Louisiana Tech University.
The independent engineering analysis presented in the Cawley, Gillespie reports was overseen by Kenneth J. Mueller. Mr. Mueller is an experienced reservoir engineer having been a practicing petroleum engineer since 1979. He has more than 34 years of experience in reserve evaluation. He has a Bachelor of Science degree in Petroleum Engineering from Texas A&M University. Mr. Mueller is a licensed Professional Engineer in the State of Texas and is an active member of the Society of Petroleum Engineers and the Texas Society of Professional Engineers.
83
Table of Contents
Technology used to establish reserves
Under SEC rules, proved reserves are those quantities of oil and natural gas that by analysis of geoscience and engineering data can be estimated with reasonable certainty to be economically producible from a given date forward from known reservoirs, and under existing economic conditions, operating methods and government regulations. The term “reasonable certainty” implies a high degree of confidence that the quantities of oil and natural gas actually recovered will equal or exceed the estimate. Reasonable certainty can be established using techniques that have been proven effective by actual production from projects in the same reservoir or an analogous reservoir or by other evidence using reliable technology that establishes reasonable certainty. Reliable technology is a grouping of one or more technologies (including computational methods) that has been field tested and has been demonstrated to provide reasonably certain results with consistency and repeatability in the formation being evaluated or in an analogous formation.
To establish reasonable certainty with respect to our estimated proved reserves, Cawley, Gillespie employed technologies that have been demonstrated to yield results with consistency and repeatability. The technologies and economic data used in the estimation of our reserves include, but are not limited to, electrical logs, radioactivity logs, core analyses, geologic maps and available downhole and production data, seismic data and well test data. Reserves attributable to producing wells with sufficient production history were estimated using appropriate decline curves or other performance relationships. Reserves attributable to producing wells with limited production history were estimated using performance from analogous wells in the surrounding area and geologic data to assess the reservoir continuity. These wells were considered to be analogous based on production performance from the same formation and completion using similar techniques.
Estimates of probable reserves are inherently imprecise. When producing an estimate of the amount of oil and natural gas that is recoverable from a particular reservoir, an estimated quantity of probable reserves is an estimate of those additional reserves that are less certain to be recovered than proved reserves but which, together with proved reserves, are as likely as not to be recovered. Estimates of probable reserves are also continually subject to revisions based on production history, results of additional exploration and development, price changes and other factors.
When deterministic methods are used, it is as likely as not that actual remaining quantities recovered will exceed the sum of estimated proved plus probable reserves. When probabilistic methods are used, there should be at least a 50% probability that the actual quantities recovered will equal or exceed the proved plus probable reserves estimates. Probable reserves may be assigned to areas of a reservoir adjacent to proved reserves where data control or interpretations of available data are less certain, even if the interpreted reservoir continuity of structure or productivity does not meet the reasonable certainty criterion. Probable reserves may be assigned to areas that are structurally higher than the proved area if these areas are in communication with the proved reservoir. Probable reserves estimates also include potential incremental quantities associated with a greater percentage recovery of the hydrocarbons in place than assumed for proved reserves.
Estimates of possible reserves are also inherently imprecise. When producing an estimate of the amount of oil and natural gas that is recoverable from a particular reservoir, an estimated quantity of possible reserves is an estimate that might be achieved, but only under more favorable circumstances than are likely. Estimates of possible reserves are also continually subject to revisions based on production history, results of additional exploration and development, price changes and other factors.
When deterministic methods are used, the total quantities ultimately recovered from a project have a low probability of exceeding proved plus probable plus possible reserves. When probabilistic methods are used, there should be at least a 10% probability that the total quantities ultimately recovered will equal or exceed the proved plus probable plus possible reserves estimates. Possible reserves may be assigned to areas of a reservoir adjacent to probable reserve where data control and interpretations of available data are progressively less certain. Frequently, this will be in areas where geoscience and engineering data are unable to define clearly the area and
84
Table of Contents
vertical limits of commercial production from the reservoir. Possible reserves also include incremental quantities associated with a greater percentage of recovery of the hydrocarbons in place than the recovery quantities assumed for probable reserves.
Possible reserves may be assigned where geoscience and engineering data identify directly adjacent portions of a reservoir within the same accumulation that may be separated from proved areas by faults with displacement less than formation thickness or other geological discontinuities and that have not been penetrated by a wellbore, and the registrant believes that such adjacent portions are in communication with the known (proved) reservoir. Possible reserves may be assigned to areas that are structurally higher or lower than the proved area if these areas are in communication with the proved reservoir.
Production, price and cost history
Oil and natural gas are commodities. The price that we receive for the oil and natural gas we produce is largely a function of market supply and demand. Demand for oil and natural gas in the United States has increased during the last decade with periods of volatility. Demand is impacted by general economic conditions, weather and other seasonal conditions. Over or under supply of oil or natural gas can result in substantial price volatility. Historically, commodity prices have been volatile, and we expect that volatility to continue in the future. A substantial or extended decline in oil or natural gas prices or poor drilling results could have a material adverse effect on our financial position, results of operations, cash flows, quantities of oil and natural gas reserves that may be economically produced, and our ability to access capital markets.
The following table sets forth summary data with respect to our production results, average sales price and production costs on a historical basis for the year ended December 31, 2014.
| East Texas Stacked Play |
DJ Basin(2) | Total | ||||||||||
| Net production volumes: |
||||||||||||
| Oil (Bbl) |
1,598,069 | — | 1,598,069 | |||||||||
| Natural gas liquids (Bbl) |
258,490 | — | 258,490 | |||||||||
| Natural gas (Mcf) |
1,440,870 | — | 1,440,870 | |||||||||
| Total (Boe) |
2,096,704 | — | 2,096,704 | |||||||||
| Average daily production volumes: |
||||||||||||
| Oil (Bbl) |
4,378.3 | — | 4,378.3 | |||||||||
| Natural gas liquids (Bbl) |
708.2 | — | 708.2 | |||||||||
| Natural gas (Mcf) |
3,947.6 | — | 3,947.6 | |||||||||
| Total (Boe) |
5,744.4 | — | 5,744.4 | |||||||||
| Average prices: |
||||||||||||
| Oil (Bbl) |
$ | 82.67 | — | $ | 82.67 | |||||||
| Natural gas liquids (Bbl) |
$ | 30.49 | — | $ | 30.49 | |||||||
| Natural gas (Mcf) |
$ | 3.74 | — | $ | 3.74 | |||||||
| Total (Boe) |
$ | 69.34 | — | $ | 69.34 | |||||||
| Operating costs and expenses (per Boe): |
||||||||||||
| Lease operating expenses |
$ | 12.74 | — | $ | 12.74 | |||||||
| Production and ad valorem taxes |
$ | 3.34 | — | $ | 3.34 | |||||||
| Depreciation, depletion and amortization(1) |
n/a | — | $ | 31.30 | ||||||||
| General and administrative expenses |
n/a | — | $ | 9.19 | ||||||||
| (1) | We utilize the full cost method of accounting for our oil and natural gas proprieties. Under this method, depreciation, depletion and amortization (DD&A) is calculated at the country level rather than the field level. |
| (2) | Our producing DJ Basin assets were sold during June 2013. |
85
Table of Contents
The following table sets forth summary data with respect to our production results, average sales prices and production costs on a historical basis for the year ended December 31, 2013.
| East Texas Stacked Play |
DJ Basin |
Total | ||||||||||
| Net production volumes: |
||||||||||||
| Oil (Bbl) |
161,260 | 319 | 161,579 | |||||||||
| Natural gas liquids (Bbl) |
5,014 | 109 | 5,123 | |||||||||
| Natural gas (Mcf) |
127,874 | 729 | 128,603 | |||||||||
| Total (Boe) |
187,586 | 550 | 188,136 | |||||||||
| Average daily production volumes: |
||||||||||||
| Oil (Bbl) |
441.8 | 0.9 | 442.7 | |||||||||
| Natural gas liquids (Bbl) |
13.7 | 0.3 | 14.0 | |||||||||
| Natural gas (Mcf) |
350.3 | 2.0 | 352.3 | |||||||||
| Total (Boe) |
513.9 | 1.5 | 515.4 | |||||||||
| Average prices: |
||||||||||||
| Oil (Bbl) |
$ | 98.04 | $ | 86.85 | $ | 98.02 | ||||||
| Natural gas liquids (Bbl) |
$ | 25.96 | $ | 28.84 | $ | 26.02 | ||||||
| Natural gas (Mcf) |
$ | 3.63 | $ | 3.28 | $ | 3.62 | ||||||
| Total (Boe) |
$ | 87.45 | $ | 60.46 | $ | 87.37 | ||||||
| Operating costs and expenses (per Boe): |
||||||||||||
| Lease operating expenses |
$ | 17.10 | $ | 12.03 | $ | 17.09 | ||||||
| Production and ad valorem taxes |
$ | 4.63 | $ | 4.03 | $ | 4.60 | ||||||
| Depreciation, depletion and amortization(1)(2) |
n/a | n/a | $ | 35.39 | ||||||||
| General and administrative expenses(2) |
n/a | n/a | $ | 89.76 | ||||||||
| (1) | We utilize the full cost method of accounting for our oil and natural gas proprieties. Under this method, depreciation, depletion and amortization (DD&A) is calculated at the country level rather than the field level. |
| (2) | During the year ended December 31, 2013, we did not allocate DD&A and general and administrative expenses to the field level. |
86
Table of Contents
The following table sets forth summary data with respect to our production results, average sales prices and production costs on a historical basis for the year ended December 31, 2012.
| East Texas Stacked Play |
DJ Basin |
Total | ||||||||||
| Net production volumes: |
||||||||||||
| Oil (Bbl) |
347 | 1,900 | 2,247 | |||||||||
| Natural gas liquids (Bbl) |
— | 384 | 384 | |||||||||
| Natural gas (Mcf) |
— | 3,903 | 3,903 | |||||||||
| Total (Boe) |
347 | 2,934 | 3,281 | |||||||||
| Average daily production volumes: |
||||||||||||
| Oil (Bbl) |
0.9 | 5.2 | 6.1 | |||||||||
| Natural gas liquids (Bbl) |
— | 1.0 | 1.0 | |||||||||
| Natural gas (Mcf) |
— | 10.7 | 10.7 | |||||||||
| Total (Boe) |
0.9 | 8.1 | 9.0 | |||||||||
| Average prices: |
||||||||||||
| Oil (Bbl) |
$ | 87.69 | $ | 87.54 | $ | 87.58 | ||||||
| Natural gas liquids (Bbl) |
$ | — | $ | 27.75 | $ | 27.75 | ||||||
| Natural gas (Mcf) |
$ | — | $ | 2.17 | $ | 2.17 | ||||||
| Total (Boe) |
$ | 87.69 | $ | 63.21 | $ | 65.80 | ||||||
| Operating costs and expenses (per Boe): |
||||||||||||
| Lease operating expenses |
$ | 2.91 | $ | 0.58 | $ | 3.49 | ||||||
| Production and ad valorem taxes |
$ | 0.43 | $ | 3.79 | $ | 4.22 | ||||||
| Depreciation, depletion and amortization(1)(2) |
n/a | n/a | $ | 93.49 | ||||||||
| General and administrative expenses(2) |
n/a | n/a | $ | 3,212 | ||||||||
| (1) | We utilize the full cost method of accounting for our oil and natural gas proprieties. Under this method, depreciation, depletion and amortization (DD&A) is calculated at the country level rather than the field. |
| (2) | During the year ended December 31, 2012, we did not allocate DD&A and general and administrative expenses to the field level. |
Capital Budget
We have targeted a majority of our estimated capital expenditures for 2015 and 2016 for drilling and completion in the East Texas stacked play. The following table presents our estimated capital expenditures, excluding capitalized interest and general and administrative expense, for drilling and completion, land acquisition, leasehold extension and seismic surveys for 2015 and 2016 in the East Texas stacked play. We currently do not plan any capital expenditures in 2015 or 2016 for our other operating areas.
| Capital Expenditure Budget 2015(1) |
Capital Expenditure Budget 2016 |
|||||||||||||||
| Net Wells | $ | Net Wells | $ | |||||||||||||
| Drilling & Completion: |
||||||||||||||||
| East Texas stacked play |
23 | $ | 97 | 41 | $ | 115 | ||||||||||
|
|
|
|
|
|
|
|
|
|||||||||
| Drilling & Completion Total |
23 | $ | 97 | 41 | $ | 115 | ||||||||||
| Other: |
||||||||||||||||
| East Texas stacked play |
— | $ | 9 | — | $ | 13 | ||||||||||
|
|
|
|
|
|
|
|
|
|||||||||
| Other Total |
— | $ | 9 | — | $ | 13 | ||||||||||
|
|
|
|
|
|
|
|
|
|||||||||
| Total |
23 | $ | 106 | 41 | $ | 128 | ||||||||||
|
|
|
|
|
|
|
|
|
|||||||||
| (1) | Includes approximately $37 million of drilling capital and approximately $4 million of other capital spent prior to March 31, 2015. |
87
Table of Contents
The ultimate amount of capital we will expend is largely discretionary and may fluctuate materially based on market conditions, commodity prices, success of drilling operations, access to capital and other factors. Additionally, the timing and costs of drilling on our non-operated East Texas stacked play leasehold acreage generally will be within the control of the operator. See “Management’s Discussion and Analysis of Financial Condition and Results of Operations—Liquidity and Capital Resources.”
Title to Properties
As is customary in the oil and natural gas industry, we initially conduct a preliminary review of the title to our properties. Prior to the commencement of drilling operations on those properties, we will conduct a thorough title examination and perform curative work with respect to significant defects. To the extent title opinions or other investigations reflect title defects on those properties, we will typically be responsible for curing any title defects at our expense. We will not commence drilling operations on a property until we have cured any material title defects on such property. We will obtain title opinions on substantially all of our producing properties and expect to have satisfactory title to our producing properties in accordance with standards generally accepted in the oil and natural gas industry. Prior to completing an acquisition of producing oil and natural gas leases, we will perform title reviews on the most significant leases, and, depending on the materiality of the properties, we may obtain a title opinion or review previously obtained title opinions. Our oil and natural gas properties are subject to customary royalty and other interests, liens to secure borrowings under the senior secured term loan, liens for current taxes, and other burdens that we believe do not materially interfere with the use or affect our carrying value of the properties. See “Risk Factors—Risks Related to the Oil and Natural Gas Industry and Our Business—We may incur losses as a result of title defects in the properties in which we invest.”
Oil and Natural Gas Leases
The typical oil and natural gas lease agreement covering our properties provides for the payment of royalties to the mineral owner for all oil and natural gas produced from any wells drilled on the leased premises. The lessor royalties and other leasehold burdens on our properties in Texas are generally 25.0% or less, resulting in a net revenue interest to us generally of at least 75% or more. Royalties and other leasehold burdens on our properties in Wyoming are 20%, resulting in a net revenue interest to us of 80%.
Competition
The oil and natural gas industry is highly competitive in all phases. We encounter competition from other oil and natural gas companies in all areas of operation, from the acquisition of leasing options on oil and natural gas properties to the exploration and development of those properties. Our competitors include major integrated oil and natural gas companies, numerous independent oil and natural gas companies, individuals and drilling and income programs. Many of our competitors are large, well established companies that have substantially larger operating staffs and greater capital resources than we do. Such companies may be able to pay more for lease options on oil and natural gas properties and exploratory locations and to define, evaluate, bid for and purchase a greater number of properties and locations than our financial or human resources permit. Our ability to acquire additional properties and to discover reserves in the future will depend upon our ability to evaluate and select suitable properties and to consummate transactions in a highly competitive environment. See “Risk Factors—Risks Related to the Oil and Natural Gas Industry and Our Business—Competition in the oil and natural gas industry is intense, making it more difficult for us to acquire properties, market oil and natural gas and secure trained personnel.”
Hydraulic Fracturing
We will use hydraulic fracturing as a means to enhance the productivity of substantially all wells that we drill and complete. Hydraulic fracturing is a necessary part of the completion process because our properties are dependent upon our ability to effectively fracture the producing formations in order to produce at economic rates.
88
Table of Contents
We believe that we are in material compliance with applicable legal requirements for groundwater protection in our operations that are subject to supervision by state and federal regulators (including the Bureau of Land Management on federal acreage). These protective measures include setting surface casing at a depth sufficient to protect fresh water zones as determined by regulatory agencies, and cementing the well to create an isolating barrier between the casing pipe and surrounding geological formations. For recompletions of existing wells, the production casing is pressure tested prior to perforating the new completion interval.
Injection rates and pressures are required to be monitored in real time at the surface during our hydraulic fracturing operations. Pressure is required to be monitored on both the injection string and the immediate annulus to the injection string. Hydraulic fracturing operations are required to be shut down immediately if an abrupt change occurs to the injection pressure or annular pressure.
Certain state regulations require disclosure of the components in the solutions used in hydraulic fracturing operations, subject in some instances to exemptions for the disclosure of trade secrets. Approximately 99% of the hydraulic fracturing fluids we expect to use are made up of water and sand. The remainder of the constituents in the fracturing fluid are managed and used in accordance with applicable requirements.
Hydraulic fracture stimulation requires the use of water. We use water in our fracturing treatments in accordance with applicable water management plans and associated regulations. Except for wastewater we recycle and reuse, we dispose of wastewater in a way that reduces the impact to nearby surface water by disposing into approved injection wells.
For information regarding existing and proposed governmental regulations regarding hydraulic fracturing and related environmental matters, please read “—Regulation of the Oil and Natural Gas Industry—Environmental, Health and Safety Regulation.” For related risks to our stockholders, please read “Risk Factors—Risks Related to the Oil and Natural Gas Industry and Our Business—Federal and state legislative and regulatory initiatives relating to hydraulic fracturing could result in increased costs and additional operating restrictions or delays.”
Regulation of the Oil and Natural Gas Industry
Our operations are substantially affected by federal, state and local laws and regulations. In particular, oil and natural gas production and related operations are, or have been, subject to price controls, taxes and numerous other laws and regulations. All of the jurisdictions in which we own or operate properties for oil and natural gas production have statutory provisions regulating the exploration for and production of oil and natural gas, including provisions related to permits for the drilling of wells, bonding requirements to drill or operate wells, the location of wells, the method of drilling and casing wells, the surface use and restoration of properties upon which wells are drilled, sourcing and disposal of water used in the drilling and completion process, and the abandonment of wells. Our operations are also subject to various conservation laws and regulations. These include regulation of the size of drilling and spacing units or proration units, the number of wells which may be drilled in an area, and the unitization or pooling of oil and natural gas wells, as well as regulations that generally prohibit the venting or flaring of natural gas and impose certain requirements regarding the ratability or fair apportionment of production from fields and individual wells.
Failure to comply with applicable laws and regulations could result in substantial penalties. The regulatory burden on the industry increases the cost of doing business and affects profitability. Although we believe we are in material compliance with all applicable laws and regulations, and that such continued compliance with existing requirements will not have a material adverse effect on our financial position, cash flows or results of operations, such laws and regulations could be, and are frequently are, amended or reinterpreted. Additionally, currently unforeseen environmental incidents may occur or past non-compliance with environmental laws or regulations may be discovered. Therefore, we are unable to predict the future costs or impact of compliance or
89
Table of Contents
non-compliance. Additional proposals and proceedings that affect the oil and natural gas industry are regularly considered by Congress, the states, the Federal Energy Regulatory Commission, or FERC, and the courts. We cannot predict when or whether any such proposals may become effective.
Regulation of Transportation and Sales of Oil
Sales of crude oil, condensate and natural gas liquids are not currently regulated and are made at negotiated prices. Nevertheless, Congress could reenact price controls or impose other regulatory requirements in the future.
Our sales of crude oil are affected by the availability, terms and cost of transportation. The transportation of oil in common carrier pipelines is also subject to rate and access regulation. FERC regulates interstate oil (including NGLs) pipeline transportation service and rates under the Interstate Commerce Act. Historically, interstate oil pipeline rates were required to be cost-based. Currently, rates are generally adjusted by reference to an index, although shippers may challenge these adjustments, and pipelines may seek adjustments in excess of the index.
Settlement rates agreed to by all shippers are also permitted. In addition, market based rates are permitted in circumstances where a pipeline demonstrates a lack of market power in a given geographical area before FERC.
Intrastate oil pipeline transportation rates typically are subject to regulation by state regulatory commissions. The basis for intrastate oil pipeline regulation, and the degree of regulatory oversight and scrutiny given to intrastate oil pipeline rates, varies from state to state. Insofar as effective interstate and intrastate rates are equally applicable to all comparable shippers, we believe that the regulation of oil transportation rates will not affect our operations in any way that is of material difference from those of our competitors who are similarly situated.
Both interstate and intrastate common carrier oil pipelines must provide service on a non-discriminatory basis. Under this common carrier standard, common carriers must offer service to all similarly situated shippers requesting service on the same terms and under the same rates. When oil pipelines operate at full capacity, access is governed by prorationing provisions set forth in the pipelines’ published tariffs. Often the priority of a given shipper in the event of prorationing is dependent upon its history of shipping on a particular pipeline, with higher priority, and thus more capacity, allocated to relatively long standing shippers over new shippers. However, as a general matter, FERC does not have jurisdiction to prevent a common carrier oil pipeline from abandoning all or part of its services. Accordingly, we believe that access to oil pipeline transportation services generally will be available to us to the same extent as to our similarly situated competitors on a given pipeline.
Wholesale sales of petroleum are subject to provisions of the Energy Independence and Security Act of 2007 (“EISA”) and regulations by the FTC. Under the EISA, the Federal Trade Commission (“FTC”) issued its Petroleum Market Manipulation Rule, which became effective November 4, 2009, and prohibits fraudulent or deceptive conduct (including false or misleading statements of material fact) in connection with wholesale purchases or sales of crude oil or refined petroleum products. The rule also bans intentional failures to state a material fact when the omission makes a statement misleading and distorts, or is likely to distort, market conditions for any product covered by the rule. The FTC holds substantial enforcement authority under the EISA, including authority to request that a court impose fines of up to $1,000,000 per day per violation.
Regulation of Transportation and Sales of Natural Gas
The price at which we sell natural gas is not currently subject to federal rate regulation and, for the most part, is not subject to state regulation. Nevertheless, Congress could impose price controls in the future.
FERC regulates interstate natural gas transportation rates and service conditions, which affects the marketing of natural gas that we produce as well as the revenues we receive for sales of our natural gas. In recent
90
Table of Contents
years, FERC has made use of its anti-manipulation authority to extend its jurisdiction to entities such as producers whose role in the interstate natural gas market is typically limited to selling gas or transporting gas on interstate pipelines, including to develop and enforce its policies with respect to capacity release, open season bidding on new pipeline capacity, and related areas of FERC’s jurisdiction over interstate pipeline transportation. There are regulatory risks stemming from FERC’s aggressive enforcement of its regulations and policies related to pipeline capacity release, and the use of interstate pipeline capacity generally, by shippers like us.
With regard to our physical sales of these energy commodities, we are required to observe anti-market manipulation laws and related regulations enforced by FERC and/or the Commodity Futures Trading Commission, or the CFTC. See below the discussion of “Other federal laws and regulations affecting our industry—Energy Policy Act of 2005.” Should we violate the anti-market manipulation laws and regulations, we could also be subject to related third-party damage claims by, among others, sellers, royalty owners and taxing authorities. In addition, pursuant to FERC requirements regarding reporting by anyone who buys or sells more than a de minimis amount of natural gas in the interstate market, which were implemented in Order No. 704, some of our operations may be required to file an annual report with FERC known as Form No. 552. Under FERC’s Form No. 552, certain natural gas market participants must report information regarding their reporting of transactions to price index publishers and their blanket sales certificate status, as well as certain information regarding their wholesale, physical natural gas transactions for the previous calendar year depending on the volume of natural gas transacted. See below the discussion of “Other federal laws and regulations affecting our industry—FERC Market Transparency Rules.”
Gathering services, which occur upstream of jurisdictional transmission services, are not regulated by FERC under the NGA and may be regulated by the states onshore and in state waters. FERC has reclassified certain jurisdictional transmission facilities as non-jurisdictional gathering facilities, which may increase our costs of getting gas to point of sale locations, since the rates charged for such gathering services are not subject to FERC regulation. State regulation of natural gas gathering facilities generally includes various safety, environmental and, in some circumstances, nondiscriminatory take requirements. Although such regulation has not generally been affirmatively applied by state agencies, natural gas gathering may receive greater regulatory scrutiny in the future.
Intrastate natural gas transportation and facilities are also subject to regulation by state regulatory agencies, and certain transportation services provided by intrastate pipelines are also regulated by FERC. The basis for intrastate regulation of natural gas transportation and the degree of regulatory oversight and scrutiny given to intrastate natural gas pipeline rates and services varies from state to state. Insofar as such regulation within a particular state will generally affect all intrastate natural gas shippers within the state on a comparable basis, we believe that the regulation of similarly situated intrastate natural gas transportation in any states in which we operate and ship natural gas on an intrastate basis will not affect our operations in any way that is of material difference from those of our competitors. Like the regulation of interstate transportation rates, the regulation of intrastate transportation rates affects the marketing of natural gas that we produce, as well as the revenues we receive for sales of our natural gas.
Regulation of Production
The production of oil and natural gas is subject to regulation under a wide range of local, state and federal statutes, rules, orders and regulations. Federal, state and local statutes and regulations require permits for drilling operations, drilling bonds and reports concerning operations. All of the states in which we own and operate properties have regulations governing conservation matters, including provisions for the unitization or pooling of oil and natural gas properties, the establishment of maximum allowable rates of production from oil and natural gas wells, the regulation of well spacing, and plugging and abandonment of wells. The effect of these regulations is to limit the amount of oil and natural gas that we can produce from our wells and to limit the number of wells or the locations at which we can drill, although we can apply for exceptions to such regulations or to have
91
Table of Contents
reductions in well spacing. Moreover, each state generally imposes a production or severance tax with respect to the production and sale of oil, natural gas and natural gas liquids within its jurisdiction.
The failure to comply with these rules and regulations could result in substantial penalties. Our competitors in the oil and natural gas industry are subject to the same regulatory requirements and restrictions that affect our operations.
Other Federal Laws and Regulations Affecting Our Industry
Energy Policy Act of 2005. On August 8, 2005, President Bush signed into law the Domenici-Barton Energy Policy Act of 2005, or the EPAct 2005. EPAct 2005 is a comprehensive compilation of tax incentives, authorized appropriations for grants and guaranteed loans, and significant changes to the statutory policy that affects all segments of the energy industry. Among other matters, EPAct 2005 amended the NGA to add an anti- manipulation provision which makes it unlawful for any entity to engage in prohibited behavior to be prescribed by FERC, and furthermore provides FERC with additional civil penalty authority. EPAct 2005 provides FERC with the power to assess civil penalties of up to $1,000,000 per day for violations of the NGA and increases FERC’s civil penalty authority under the NGPA from $5,000 per violation per day to $1,000,000 per violation per day. The civil penalty provisions are applicable to entities that engage in the sale of natural gas for resale in interstate commerce. On January 19, 2006, FERC issued Order No. 670, a rule implementing the anti- manipulation provision of EPAct 2005, and subsequently denied rehearing. The rule makes it unlawful for any entity, directly or indirectly: (1) in connection with the purchase or sale of natural gas subject to the jurisdiction of FERC, or the purchase or sale of transportation services subject to the jurisdiction of FERC, to use or employ any device, scheme or artifice to defraud; (2) to make any untrue statement of material fact or omit to make any such statement necessary to make the statements made not misleading; or (3) to engage in any act or practice that operates as a fraud or deceit upon any person. The anti-manipulation rules do not apply to activities that relate only to intrastate or other non-jurisdictional sales or gathering, but do apply to otherwise non-jurisdictional entities to the extent the activities are conducted “in connection with” gas sales, purchases or transportation subject to FERC jurisdiction. The anti-manipulation rules and enhanced civil penalty authority reflect an expansion of FERC’s NGA enforcement authority. Should we fail to comply with all applicable FERC administered statutes, rules, regulations, and orders, we could be subject to substantial penalties and fines.
FERC Market Transparency Rules. On December 26, 2007, FERC issued a final rule on the annual natural gas transaction reporting requirements, as amended by subsequent orders on rehearing, or Order No. 704. Under Order No. 704, wholesale buyers and sellers of more than 2.2 million MMBtu of physical natural gas in the previous calendar year, including interstate and intrastate natural gas pipelines, natural gas gatherers, natural gas processors, natural gas marketers and natural gas producers, are required to report, on May 1 of each year, aggregate volumes of natural gas purchased or sold at wholesale in the prior calendar year to the extent such transactions utilize, contribute to or may contribute to the formation of price indices. It is the responsibility of the reporting entity to determine which individual transactions should be reported based on the guidance of Order No. 704. Order No. 704 also requires market participants to indicate whether they report prices to any index publishers and, if so, whether their reporting complies with FERC’s policy statement on price reporting.
Additional proposals and proceedings that might affect the natural gas industry are pending before Congress, FERC and the courts. We cannot predict the ultimate impact of these or the above regulatory changes to our natural gas operations. We do not believe that we would be affected by any such action materially differently than similarly situated competitors.
Environmental, and Human Health and Safety Regulation
Our exploration, development and production operations are subject to various federal, state and local laws and regulations governing human health and safety, the discharge of materials into the environment or otherwise relating to environmental protection. These laws and regulations may, among other things, require the acquisition
92
Table of Contents
of permits to conduct exploration, drilling and production operations or other regulated activities; govern the amounts and types of substances that may be released into the environment in connection with oil and natural gas drilling and production; restrict the way we handle or dispose of our wastes; limit or prohibit construction or drilling activities in environmentally sensitive areas such as wetlands, wilderness areas or areas inhabited by endangered or threatened species; require investigatory and remedial actions to mitigate pollution conditions caused by our operations or attributable to former operations; impose specific health and safety criteria addressing worker protection; and impose obligations to reclaim and abandon well sites and pits. Failure to comply with these laws and regulations may result in the assessment of administrative, civil and criminal penalties, the imposition of remedial obligations and the issuance of orders enjoining some or all of our operations in affected areas.
These laws and regulations may also restrict the rate of oil and natural gas production below the rate that would otherwise be possible. The regulatory requirements applied to the oil and natural gas industry increase the cost of doing business in the industry and consequently affect profitability. Additionally, Congress and federal and state agencies frequently revise environmental and worker health and safety laws and regulations, and any changes that result in more stringent and costly well drilling, construction, completion or water management activities, or waste handling, disposal, cleanup and remediation requirements for the oil and natural gas industry could have a significant impact on our operating costs and financial position. We may be unable to pass on such increased compliance costs to our customers. Moreover, accidental releases or spills may occur in the course of our operations, and we cannot assure you that we will not incur significant costs and liabilities as a result of such releases or spills, including any third-party claims for damage to property, natural resources or persons. While we believe that we are in material compliance with existing environmental laws and regulations and that such continued compliance with current requirements would not have a material adverse effect on our financial condition or results of operations, there is no assurance that this trend will continue in the future.
The following is a summary of the more significant existing environmental and health and safety laws and regulations, as amended from time to time, to which our business operations are subject and for which compliance may have a material adverse impact on our capital expenditures, results of operations or financial position.
Hazardous Substances and Waste
The Comprehensive Environmental Response, Compensation, and Liability Act, or CERCLA, and comparable state laws impose liability without regard to fault or the legality of the original conduct on certain classes of persons who are considered to be responsible for the release of a “hazardous substance” into the environment. These persons include current and prior owners or operators of the site where the release occurred and entities that disposed or arranged for the disposal of the hazardous substances found at the site. Under CERCLA, these “responsible persons” may be subject to joint and several, strict liability for the costs of responding to the hazardous substances that have been released into the environment, for damages to natural resources and for the costs of certain health studies. CERCLA also authorizes the EPA and, in some instances, third parties to act in response to threats to the public health or the environment and to seek to recover from the responsible classes of persons the costs they incur. It is not uncommon for neighboring landowners and other third parties to file claims for personal injury and property damage allegedly caused by the release of hazardous substances or other pollutants into the environment. We generate materials in the course of our operations that may be regulated as hazardous substances or other pollutants.
We also are subject to the requirements of the Resource Conservation and Recovery Act, or RCRA, and comparable state statutes, which impose strict requirements on the generation, storage, treatment, transportation and disposal of non-hazardous and hazardous wastes. Under the auspices of the EPA, most states administer some or all of the provisions of RCRA, sometimes in conjunction with their own, more stringent requirements. Drilling fluids, produced waters and most of the other wastes associated with the exploration, development and production of oil or natural gas, if properly handled, are exempt from regulation as hazardous waste under
93
Table of Contents
Subtitle C of RCRA. These wastes, instead, are regulated under RCRA’s less stringent nonhazardous waste provisions, state laws or other federal laws. However, it is possible that certain oil and natural gas exploration, development and production wastes now classified as nonhazardous wastes could be classified as hazardous wastes in the future. A loss of the RCRA exclusion for drilling fluids, produced waters and related wastes could result in an increase in our costs to manage and dispose of generated wastes, which could have a material adverse effect on our results of operations and financial position. In the course of our operations we generate petroleum hydrocarbon wastes and ordinary industrial wastes that may be regulated as hazardous wastes.
We currently own or lease, and have in the past owned or leased, properties that have been used for numerous years to explore and produce oil and natural gas. Although we have generally utilized operating and disposal practices of the industry at the time, petroleum hydrocarbons and wastes may have been disposed of or released at or from the properties owned or leased by us or at or from the other locations where these petroleum hydrocarbons and wastes have been taken for treatment or disposal. In addition, certain of these properties have been operated by third parties whose treatment and disposal or release of hydrocarbons and wastes was not under our control. These properties and wastes disposed thereon may be subject to CERCLA, RCRA and analogous state laws. Under these laws, we could be required to remove or remediate previously disposed wastes (including wastes disposed of or released by prior owners or operators), to clean up contaminated property (including contaminated groundwater) and to perform remedial operations to prevent future contamination.
Air Emissions
On April 17, 2012, the EPA approved final rules that subject all oil and natural gas operations (production, processing, transmission, storage and distribution) to regulation under the NSPS and NESHAPS programs. These rules also include NSPS standards for completions of hydraulically fractured gas wells. These standards include the REC techniques developed in the EPA’s Natural Gas STAR program along with pit flaring of gas not sent to the gathering line. The standards are applicable to certain newly drilled and fractured wells as well as certain existing wells that are refractured. Further, the regulations under NESHAPS include MACT standards for those glycol dehydrators and storage vessels at major sources of hazardous air pollutants not currently subject to MACT standards. We currently do not believe that compliance with these NSPS and NESHAPS requirements will have a materially adverse effect on our results of operations or financial condition. Nonetheless while these rules have been finalized, many of the rules’ provisions will be phased-in over time, with the more stringent requirements like REC not becoming effective until January 1, 2015. On January 14, 2015, the White House announced a goal to reduce methane emissions from the oil and gas sector by 40% to 45% from 2012 emission levels by 2025. That same day and in support of the effort, the EPA announced that it will release a proposed rule in the summer of 2015 that will directly regulate methane emissions from the oil and gas industry.
Climate Change
On December 15, 2009, the EPA published its findings that emissions of carbon dioxide, methane and other “greenhouse gases” present an endangerment to human health and the environment because emissions of such gases are, according to the EPA, contributing to warming of the earth’s atmosphere and other climatic changes. These findings by the EPA have allowed the agency to proceed with the adoption and implementation of regulations restricting emissions of greenhouse gases under existing provisions of the federal Clean Air Act.
Among other things, EPA regulations now require specified large greenhouse gas emitters in the United States including companies in the energy industry to annually report those emissions. Additionally, starting in 2011, new sources or modifications of existing sources of significant quantities of greenhouse gas emissions that are already subject to regulation as major sources of conventional pollutants are required to obtain permits—and to use best available control technology to control those emissions—pursuant to the Clean Air Act as a prerequisite to the development of that greenhouse gas emissions source. Such regulations may over time require us to incur costs to reduce emissions of greenhouse gases associated with our operations or could adversely affect demand for the oil and natural gas we produce.
94
Table of Contents
Additionally, from time to time over the past several years, the U.S. Congress has considered legislation to restrict or regulate emissions of greenhouse gases. In addition, a number of the states, either individually or through multi-state regional initiatives, address greenhouse gas emissions, primarily through the development of emission inventories or regional greenhouse gas cap and trade programs. Although most of the state-level initiatives have to date been focused on large sources of greenhouse gas emissions, such as electric power plants, it is possible that smaller sources could become subject to greenhouse gas-related regulation. Depending on the particular program, we could be required to control emissions or to purchase and surrender allowances for greenhouse gas emissions resulting from our operations. Any future federal laws or implementing regulations that may be adopted to address greenhouse gas emissions could require us to incur increased operating costs and could adversely affect demand for the oil and natural gas we produce.
Finally, it should be noted that some scientists have concluded that increasing concentrations of greenhouse gases in the Earth’s atmosphere may produce climate changes that have significant physical effects, such as increased frequency and severity of storms, floods and other climatic events. If any such effects were to occur, they could have an adverse effect on our exploration and production operations. Significant physical effects of climate change could also have an indirect effect on our financing and operations by disrupting the transportation or process-related services provided by midstream companies, service companies or suppliers with whom we have a business relationship. We may not be able to recover through insurance some or any of the damages, losses, or costs that may result from potential physical effects of climate change.
Water Discharges and Subsurface Injections
The Federal Water Pollution Control Act, or the Clean Water Act, and analogous state laws impose restrictions and strict controls regarding the discharge of pollutants, including oil and hazardous substances, into navigable waters. Pursuant to the Clean Water Act and analogous state laws, permits must be obtained to discharge pollutants into state waters or waters of the United States, including wetlands. The discharge of pollutants into regulated waters is prohibited, except in accordance with the terms of a permit issued by EPA or an analogous state agency. The term “waters of the United States” has been broadly defined to include certain inland water bodies, including certain wetlands and intermittent streams. On April 21, 2014, the EPA proposed a new definition of “waters of the United States” that, if finalized, would tend to broaden rather than narrow the scope. Spill prevention, control and countermeasure requirements under the Clean Water Act require appropriate containment berms and similar structures to help prevent the contamination of navigable waters in the event of a petroleum hydrocarbon tank spill, rupture or leak. In addition, the Clean Water Act and analogous state laws require individual permits or coverage under general permits for discharges of storm water runoff from certain types of facilities. The Clean Water Act also prohibits the discharge of dredge and fill material in regulated waters, including wetlands, unless authorized by permit issued by the U.S. Army Corps of Engineers. On March 31, 2015, the EPA released proposed pretreatment standards and effluent limitations applicable to the discharge of wastewater from hydraulic fracturing activities. Federal and state regulatory agencies can impose administrative, civil and criminal penalties, as well as require remedial or mitigation measures, for noncompliance with discharge permits or other requirements of the Clean Water Act and analogous state laws and regulations.
The Oil Pollution Act of 1990, or OPA, amends the Clean Water Act and establishes strict liability for owners and operators of facilities that are the site of a release of oil into waters of the United States. The OPA and its associated regulations impose a variety of requirements on responsible parties related to the prevention of oil spills and liability for cleanup costs and natural resource damages as well as a variety of public and private damages resulting from such spills. A “responsible party” under the OPA includes owners and operators of certain onshore facilities from which a release may affect waters of the United States.
Our oil and natural gas exploration and production operations generate produced water, drilling muds and other waste streams, some of which may be disposed by injection in underground wells situated in non-producing subsurface formations. The drilling and operation of these injection wells are regulated by the SDWA and
95
Table of Contents
analogous state and local laws. The Underground Injection Well Program under the SDWA requires that we obtain permits from the EPA or delegated state agencies for our disposal wells, establishes minimum standards for injection well operations, restricts the types and quantities of fluids that may be injected and prohibits the migration of fluid containing any contaminants into underground sources of drinking water. Leakage from the subsurface portions of the injection wells may cause degradation of freshwater, potentially resulting in cancellation of operations of a well, imposition of fines and penalties from governmental agencies, incurrence of expenditures for remediation of affected resources, and imposition of liability by landowners or other parties claiming damages for alternative water supplies, property damages, and personal injuries. While we believe that we have obtained the necessary permits from the applicable regulatory agencies for our underground injection wells and that we are in substantial compliance with permit conditions and federal and state rules, any changes in the laws or regulations or the inability or delay in obtaining permits for new injection wells in the future may affect our ability to dispose of produced waters and would ultimately increase the cost of our operations, which costs could be significant. Furthermore, in response to recent seismic events near underground injection wells used for the disposal of oil and gas-related wastewaters, federal and some state agencies have begun investigating whether such wells have caused increased seismic activity, and some states have shut down, imposed moratoria or implemented more stringent regulations on such injection wells. For example, in late 2014, the Texas Railroad Commission finalized a new rule requiring seismic monitoring of oil and gas wastewater injection wells. If new regulatory initiatives are implemented that restrict or prohibit the use of underground injection wells in areas where we rely upon the use of such wells in our operations, our costs to operate may significantly increase and our ability to conduct continue production may be delayed or limited, which could have a material adverse effect on our results of operations and financial position.
Endangered Species Act, Migratory Birds, Natural Resources Damages
The ESA and analogous state laws provides broad protection for species of fish, wildlife and plants that are listed as threatened or endangered in the United States, and may adversely impact exploration, development and production activities by restricting activities that may affect such species or their habitats. Similar protections are offered to migratory birds under the Migratory Bird Treaty Act. The ESA prohibits the harming of endangered or threatened species, provides for habitat protection, and imposes stringent civil and criminal penalties for noncompliance. Some of our facilities may be located in areas that are designated as habitat for endangered or threatened species. Complying with these protections provided for endangered or threatened species could cause us to incur additional costs or become subject to operating restrictions or bans in the affected areas.
Moreover, as a result of a settlement reached in 2011, the FWS is required to make a determination on whether to list numerous species as endangered or threatened under the ESA over the next several years. For example, on March 27, 2014, the FWS announced the listing of the lesser prairie chicken, whose habitat is over a five-state region, including Texas where we operate, as a threatened species under the ESA. However, the FWS also announced a final rule that will limit regulatory impacts on landowners and businesses from the listing if those landowners and businesses have entered into certain range-wide conservation planning agreements, such as those developed by the WAFWA, pursuant to which such parties agreed to take steps to protect the lesser prairie chicken’s habitat and to pay a mitigation fee if its actions harm the lesser prairie chicken’s habitat. The final designation of previously unprotected species in areas where we operate as threatened or endangered could cause us to incur increased costs arising from species protection measures or could result in limitations, delays, or prohibitions on our exploration and production activities that could have an adverse impact on our ability to develop and produce our reserves.
Activities on Federal Lands
Oil and natural gas exploration, development and production activities on federal lands, including Indian lands and lands administered by the federal Bureau of Land Management (“BLM”), are subject to the National Environmental Policy Act, as amended (“NEPA”). NEPA requires federal agencies, including the BLM, to evaluate major agency actions having the potential to significantly impact the environment. In the course of such
96
Table of Contents
evaluations, an agency will prepare an Environmental Assessment that assesses the potential direct, indirect and cumulative impacts of a proposed agency action and, if necessary, will prepare a more detailed Environmental Impact Statement that may be made available for public review and comment. We have minimal exploration and production activities on federal lands. However, for future or proposed exploration and development plans on federal lands, governmental permits or authorizations that trigger the requirements of NEPA. This process has the potential to delay or limit, or increase the cost of, the development of oil and natural gas projects. Authorizations to conduct activities on federal lands are also subject to protest, appeal or litigation, including also the sufficiency of the NEPA analysis, and such challenges may delay or halt projects.
Additionally, on March 26, 2015 the U.S. Department of the Interior Bureau of Land Management published a final rule imposing new requirements applicable to hydraulic fracturing operations conducted on federal lands. The final rule requires companies to publicly disclose the chemicals used in hydraulic fracturing operations after fracturing operations have been completed and includes provisions addressing well-bore integrity and wastewater management.
Workplace Health and Safety
We are subject to a number of federal and state laws and regulations, including the federal Occupational Safety and Health Act, or OSHA, and comparable state statutes, whose purpose is to protect the health and safety of workers. In addition, the OSHA hazard communication standard, the EPA community right-to-know regulations and comparable state statutes require that information be maintained concerning hazardous materials used or produced in our operations and that this information be provided to workers, state and local government authorities and citizens. We believe that we are in material compliance with all applicable laws and regulations relating to worker health and safety.
Legal Proceedings
We may, from time to time, be involved in litigation and claims arising out of our operations in the normal course of business. Except for the matter described below, we are not currently a party to any material legal proceeding. In addition, we are not aware of any material legal or governmental proceedings contemplated to be brought against us.
On February 2, 2015, T.B. Farms, Ltd., a Texas limited liability corporation (“T.B. Farms”), filed a petition in the 278th Judicial District Court for Madison County, Texas against Energy and Exploration Partners Operating, L.P., our wholly owned subsidiary (“ENXP Operating”), concerning a 122.5 acre oil and gas lease located in Madison County, Texas (the “Lease”) in which ENXP Operating owns an operating interest. T. B. Farms alleges that the Lease has terminated due to cessation in production. T.B Farms seeks a declaratory judgement that the Lease has terminated and that all the mineral interests held subject to the Lease have reverted to T.B. Farms. The suit seeks unspecified money damages, attorneys’ fees and costs of court. ENXP Operating has filed a response denying the allegations made by T.B. Farms. No trial date has been set, and the parties are now pursuing discovery. We believe this suit is without merit and intend to defend it vigorously.
Employees
As of March 31, 2015, we employed 80 people, including 8 employees and 2 interns in geology and geographic information systems, 22 employees in operations and engineering, 21 employees in accounting and finance, 14 employees in land/land administration and 13 employees in management, administration, legal and information technology. Our future success will depend partially on our ability to attract, retain and motivate qualified personnel. We are not a party to any collective bargaining agreements and have not experienced any strikes or work stoppages. We consider our relations with our employees to be satisfactory. From time to time we utilize the services of independent contractors to perform various field and other services.
97
Table of Contents
Offices
We currently lease approximately 25,868 square feet of office space in Fort Worth, Texas at Two City Place, Suite 1700, 100 Throckmorton, where our principal offices are located. The lease for our Fort Worth office expires in December 2015.
98
Table of Contents
Directors and Executive Officers
The following table sets forth information regarding our directors and executive officers as of April 15, 2015. There are no family relationships among any of our directors or executive officers.
| Name |
Age | Position | ||||
| B. Hunt Pettit |
44 | President and Chief Executive Officer, Director | ||||
| Brian C. Nelson |
44 | Executive Vice President and Chief Financial Officer, Director | ||||
| David L. Patty, Jr. |
44 | Executive Vice President—Land and Business Development, Director | ||||
| Tom D. McNutt |
45 | Executive Vice President, General Counsel and Secretary, Director | ||||
| John T. Richards |
61 | Executive Vice President and Chief Operating Officer, Director | ||||
| Jamie “Jim” M. Howe |
54 | Executive Vice President and Chief Accounting Officer | ||||
| Daniel J. Morrison |
49 | Director | ||||
Set forth below is the description of the backgrounds of our directors and executive officers.
B. Hunt Pettit, President and Chief Executive Officer, Director
Mr. Pettit has served as our President and Chief Executive Officer and Director since our formation in February 2006 and has over 19 years of experience in the oil and natural gas industry as an entrepreneur and landman. An early mover in the Eagle Ford shale, Mr. Pettit identified numerous opportunities across the play between 2008 and 2010. Under his leadership, we acquired and divested over 125,000 acres of leases in the Eagle Ford shale to numerous large independent oil and natural gas companies including Murphy E&P USA, Chesapeake Energy Corporation, Comstock Resources, Inc. and Hess Corporation. Prior to founding our company, Mr. Pettit served as Contract Land Manager for the Barnett shale project for David H. Arrington Oil & Gas, Inc. from May 2005 to February 2008. Mr. Pettit earned a Bachelor of General Studies in Biology, Chemistry and Philosophy from Texas Tech University.
Mr. Pettit has extensive knowledge of our operations and of the oil and natural gas industry. For these reasons, we believe Mr. Pettit is qualified to serve as a director of our company.
Brian C. Nelson, Executive Vice President and Chief Financial Officer, Director
Mr. Nelson has served as our Executive Vice President and Chief Financial Officer since September 2011 and became a Director of our company in April 2013. Mr. Nelson has 22 years of experience in the energy industry, including 13 years in oil and natural gas. Prior to joining us, he served as the Chief Financial Officer at ZaZa Energy, LLC from May 2011 to September 2011. From October 2010 to May 2011, Mr. Nelson served as Senior Vice President and Chief Financial Officer of Great Western Oil & Gas Company, LLC. From September 2002 to October 2010, Mr. Nelson served as Vice President of Finance of ATP Oil & Gas Corporation. From 2001 to 2002, he worked as an equity analyst with Frost Securities, Inc., covering exploration and production companies. Mr. Nelson earned a Master of Business Administration from Rice University and Bachelor of Arts in Economics from the University of Texas at Austin.
David L. Patty, Jr., Executive Vice President—Land and Business Development, Director
Mr. Patty has served as our Vice President—Land and Business Development since August 2010 and became a Director of our company in April 2013. Mr. Patty has over nine years of experience in the oil and natural gas industry with respect to acquisitions, divestitures, contract administration and operations. Mr. Patty worked under contract from July 2006 to April 2012 as a landman for David H. Arrington Oil and Gas, Inc.,
99
Table of Contents
Quicksilver Resources Inc. and DLP Resources LLC, serving in various positions while handling all aspects of the land and legal parameters of the exploration and development process from lease negotiations, title, due diligence, curative, urban well permitting, overseeing field brokers and acquisitions and divestitures. Mr. Patty earned a Juris Doctor from the University of Houston Law Center and a Bachelor of Arts in Government from the University of Texas at Austin.
Tom D. McNutt, Executive Vice President, General Counsel and Secretary, Director
Mr. McNutt has served as our Executive Vice President, General Counsel and Secretary since March 2012 and became a Director of our company in April 2013. Mr. McNutt has over 13 years of legal experience. From January 2009 to March 2012, Mr. McNutt was of counsel, and from June 2001 to January 2009, he was an associate, in the tax group of Bracewell & Giuliani, LLP. While at Bracewell & Giuliani, LLP Mr. McNutt advised numerous oil and natural gas clients on a variety of issues including international, federal and state tax issues and also designed and implemented tax efficient structures with respect to asset acquisitions and dispositions. Mr. McNutt earned a Master of Laws (LLM) in taxation from the New York University School of Law and a Juris Doctor from South Texas College of Law where he graduated cum laude. He also earned a Bachelor of Arts in Economics from the University of Texas at Austin.
John Richards, Executive Vice President and Chief Operating Officer, Director
Mr. Richards has served as our Executive Vice President and Chief Operating Officer since May 2013 and became a Director of our Company in August 2013. Mr. Richards has 36 years of technical, operations and management experience in the energy industry. Prior to joining us, Mr. Richards served as Partner at Valens Energy, LP, a consulting services firm he founded which focuses on well design and construction for drilling, completion and production operations. Prior to that, he served as Executive Vice President of Operations at ZaZa Energy from July 2010 to January 2013, where he established the operating group for the startup company. Prior to joining ZaZa Energy, Mr. Richards served as Engineering Advisor and Drilling Group Lead for EnCana Oil & Gas (USA), Inc. from April 2007 to June 2010. From 1981 to 2007, Mr. Richards served in multiple operational and managerial capacities with increasing responsibility, both domestically and internationally, with Anadarko Petroleum Corporation (UPRC/Champlin Petroleum). Mr. Richards received a B. S. in Mechanical Engineering from Louisiana Tech University.
Jamie “Jim” M. Howe, Executive Vice President and Chief Accounting Officer
Mr. Howe has served as our Executive Vice President and Chief Accounting Officer since September 2013. He has over 24 years of experience in several segments of the energy industry including exploration and production, midstream and oil field services. Prior to joining us, he served as Vice President of Copano Energy, and the Texas segment Controller, from November 2011 to June 2013. He worked for Crosstex Energy Services from 2004 until November 2011, initially as Director of Internal Audit and, beginning in 2006, as Vice President, Gas and Liquids Accounting. From 1998 to 2002, Mr. Howe was a manager in the energy industry consulting practice of Arthur Andersen LLP. Prior to joining Arthur Andersen, he worked at Baker Hughes and Pioneer Natural Resources in a variety of finance and accounting roles. Mr. Howe holds a Bachelor of Arts degree in English and Journalism from the University of Arkansas and is a Certified Public Accountant.
Daniel J. Morrison, Director
Mr. Morrison became a Director of our company in April 2014 and has served as Vice President— Corporate Development since October 2014. Mr. Morrison has spent over 27 years in a number of diverse roles in the oil and gas and financial services industries. From May 2012 to September 2014, he was Senior Analyst for RR Advisors, an energy-focused investment firm where he evaluated public and private investments in energy industry. His role with RR Advisors began after a 15-year career as a sell-side analyst for a number of firms, most recently Global Hunter Securities from February 2010 to May 2012. Mr. Morrison began his career
100
Table of Contents
as a reservoir engineer, initially for Exxon Company, USA, in a number of roles of increasing responsibility in Midland and Houston, with subsequent engagements with Merit Energy and J.W. Operating Company. Mr. Morrison graduated with a Bachelor of Science cum laude in Petroleum Engineering from Texas Tech University in 1987.
Board of Directors
Our board of directors currently consists of six members. Effective upon completion of this offering, we expect certain of our existing directors will resign and we will appoint additional independent directors such that a majority of the members of our board of directors will be independent in accordance with NYSE listing standards.
In evaluating director candidates, we have assessed whether a candidate possesses the integrity, judgment, knowledge, experience, skills and expertise that are likely to enhance the board’s ability to manage and direct our affairs and business, including, when applicable, to enhance the ability of committees of the board to fulfill their duties.
Following the completion of this offering, our directors will be divided into three classes serving staggered three-year terms. Class I, Class II and Class III directors will serve until our annual meetings of stockholders in 2016, 2017 and 2018, respectively. At each annual meeting of stockholders held after the initial classification, directors will be elected to succeed the class of directors whose terms have expired. This classification of our board of directors could have the effect of increasing the length of time necessary to change the composition of a majority of the board of directors. In general, at least two annual meetings of stockholders will be necessary for stockholders to effect a change in a majority of the members of the board of directors.
Pursuant to a stockholders agreement among us and the holders of our outstanding capital stock and warrants, Mr. Pettit and Highbridge have certain rights, but no obligations, to nominate directors following completion of this offering. So long as Mr. Pettit and his affiliates hold in the aggregate 10% or more of the outstanding shares of our common stock, Mr. Pettit has the right to nominate (i) three directors if he owns 20% or more, (ii) two directors if he owns 15% or more, and (iii) one director if he owns 10% or more. So long as Highbridge and its affiliates hold in the aggregate 10% or more of the outstanding shares of our common stock, Highbridge has the right to nominate one director. The stockholders agreement also provides that, following consummation of this offering, our board of directors will consist of the number of directors that Mr. Pettit and Highbridge are entitled to nominate pursuant to the agreement, plus such number of additional directors that are independent as required under NYSE rules. We may not decrease or increase the number of directors to a number less than or greater than the number of directors required to comply with the agreement without the consent of Highbridge (so long as Highbridge and its affiliates hold in the aggregate 10% or more of the outstanding shares of our common stock and Mr. Pettit (so long as Pettit and his affiliates and members of his immediate family hold in the aggregate 10% or more of the outstanding shares of our common stock). Upon completion of this offering Highbridge and its affiliates and Mr. Pettit and his affiliates will own % and % of our common stock, respectively.
Pursuant to the stockholders agreement, we must cause the individuals designated by Mr. Pettit and Highbridge to be nominated for election to the board of directors, solicit proxies in favor thereof, and at each meeting of the stockholders of the company at which directors are to be elected recommend that the stockholders elect to the board each such individual nominated for election at such meeting. Mr. Pettit and Highbridge and each of their affiliates have agreed to vote all of their shares entitled to vote in the election of directors and to take such other necessary actions to elect such desginees.
Committees of the Board of Directors
Upon the conclusion of this offering, we intend to have an audit committee, a compensation committee, a nominating and governance committee and a reserve committee of our board of directors, and we may have such
101
Table of Contents
other committees as the board of directors determines from time to time. We anticipate that each of the standing committees of the board of directors will have the composition and responsibilities described below.
Audit Committee
We will establish an audit committee in connection with the completion of this offering. We anticipate that our audit committee will initially consist of three independent directors who are financially literate, one of whom will be an “audit committee financial expert” as described in Item 407(d)(5) of Regulation S-K. Our audit committee will oversee, review, act on and report to our board of directors on various auditing and accounting matters, including: the selection of our independent accountants, the scope of our annual audits, fees to be paid to our independent accountants, the performance of our independent accountants and our accounting practices. In addition, the audit committee will oversee our compliance programs related to legal and regulatory requirements. Upon formation of the audit committee, we expect to adopt an audit committee charter defining the committee’s primary duties in a manner consistent with the rules of the SEC and NYSE standards.
Compensation Committee
We will establish a compensation committee in connection with the completion of this offering. We anticipate that our compensation committee will initially consist of three independent directors. Our compensation committee will establish salaries, incentives and other forms of compensation for officers and other employees. Our compensation committee will also administer our incentive compensation and benefit plans. Upon formation of the compensation committee, we expect to adopt a compensation committee charter defining the committee’s primary duties in a manner consistent with the rules of the SEC and NYSE standards.
Nominating and Governance Committee
We will establish a nominating and governance committee in connection with the completion of this offering. We anticipate that our nominating and corporate governance committee will initially consist of three independent directors. Our nominating and corporate governance committee will identify, evaluate and recommend qualified nominees to serve on our board of directors, develop and oversee our internal corporate governance processes and maintain a management succession plan. Upon formation of the nominating and governance committee, we expect to adopt a nominating and governance committee charter defining the committee’s primary duties in a manner consistent with the rules of the SEC and NYSE standards.
Reserve Committee
We will establish a reserve committee in connection with the completion of this offering. We anticipate that our reserve committee will initially consist of three independent directors. Our reserve committee will oversee the preparation by independent petroleum engineers of annual and any special reserve reports and/or audits of the estimated amounts of our hydrocarbon reserves and related information. Upon formation of the reserve committee, we expect to adopt a reserve committee charter defining the committee’s primary duties.
Compensation Committee Interlocks and Insider Participation
The directors serving on the compensation committee are not and will not at any time be one of our employees. None of our executive officers serve on the board of directors or compensation committee of a company that has an executive officer that serves on our board. No member of our board is an executive officer of a company in which one of our executive officers serves as a member of the board of directors or compensation committee of that company.
102
Table of Contents
Code of Business Conduct and Ethics
Our board of directors will adopt a code of business conduct and ethics applicable to our employees, directors and officers, in accordance with applicable U.S. federal securities laws and the corporate governance rules of the NYSE. Any waiver of this code may be made only by our board of directors and will be promptly disclosed as required by applicable U.S. federal securities laws and the corporate governance rules of the NYSE. Our code of business conduct and ethics will be available on our corporate website at www.enxp.com on or prior to the completion of this offering.
Corporate Governance Guidelines
Our board of directors will adopt corporate governance guidelines in accordance with the corporate governance rules of the NYSE. Our code of corporate governance guidelines will be available on our corporate website at www.enxp.com on or prior to the completion of this offering.
103
Table of Contents
Summary Compensation Table
As an emerging growth company, we have opted to comply with the executive compensation disclosure rules applicable to “smaller reporting companies” as such term is defined in the rules promulgated under the Securities Act, which require compensation disclosure for our principal executive officer and the two most highly compensated executive officers other than our principal executive officer during the 2014 fiscal year. Throughout this prospectus, these three officers are referred to as our named executive officers.
The following table shows information concerning the annual compensation for services provided to us by our named executive officers during the fiscal years ended December 31, 2014, 2013 and 2012.
| Name and Principal Position |
Year | Salary | Bonus | Stock Awards(1) |
All Other Compensation(2) |
Total | ||||||||||||||||||
| B. Hunt Pettit |
2014 | $ | 328,125 | $ | 500,000 | $ | — | $ | — | $ | 828,125 | |||||||||||||
| President and Chief Executive Officer |
2013 | $ | 265,856 | $ | — | $ | — | $ | — | $ | 265,856 | |||||||||||||
| 2012 | $ | 247,815 | $ | 100,000 | $ | — | $ | — | $ | 347,815 | ||||||||||||||
| Brian C. Nelson |
2014 | $ | 294,141 | $ | 415,000 | $ | — | $ | — | $ | 709,141 | |||||||||||||
| Executive Vice President and Chief Financial Officer |
2013 | $ | 251,892 | $ | — | $ | — | $ | — | $ | 251,892 | |||||||||||||
| 2012 | $ | 147,660 | $ | 100,000 | $ | 6,350,000 | $ | 84,375 | $ | 6,682,035 | ||||||||||||||
| Tom D. McNutt |
2014 | $ | 270,000 | $ | 375,000 | $ | — | $ | — | $ | 645,000 | |||||||||||||
| Executive Vice President, General Counsel and Secretary |
2013 | $ | 237,500 | $ | — | $ | — | $ | — | $ | 237,500 | |||||||||||||
| 2012 | $ | 150,000 | $ | 72,500 | $ | 1,270,000 | $ | 20,000 | $ | 1,512,500 | ||||||||||||||
| (1) | Reflects the grant date fair value of restricted shares of our common stock granted during 2012. In accordance with FASB ASC Topic 718, we recognized a grant date fair value of $127 per share with respect to these awards based on a third party valuation. The agreements governing the restricted stock awards were amended on November 16, 2012, December 1, 2013 and, for Mr. Nelson, on March 31, 2014 to modify the vesting dates and percentage of shares vesting at each vesting date as described under “—Grants of Plan-Based Awards” below. The modifications subsequent to the grant date had no impact on the fair value of the restricted shares. |
| (2) | Overriding royalty interests payments of $3,098, $570 and $570 were made to Messrs. Pettit, Nelson and McNutt, respectively, during 2013 and $897, $228 and $228, respectively, during 2014. See “—Overriding Royalty Interests.” No payments related to the overriding royalty interests were made during 2012. Compensation for consulting services of $84,375 and $20,000 prior to employment were made to Messrs. Nelson and McNutt during 2012, respectively. |
Employment Agreements
We will enter into employment agreements contemporaneously with the consummation of this offering with each of our named executive officers, the material terms of which are described below. Except as described below, each employment agreement will be executed with substantially similar terms and conditions.
Each employment agreement for our executives will have an initial -year term and will automatically renew and extend for additional one-year terms unless written notice of non-renewal is delivered by either party to the other not less than 30 days prior to the expiration of the then-existing term. Each named executive officer will be entitled to, among other things, paid vacation, customary employee benefits as offered by us and reimbursement of business expenses. Each executive will be eligible to participate in the 2012 Stock Incentive Plan. Each executive will agree to maintain and protect the confidentiality of our information during and after his employment with us and will agree not to compete with us during his employment, or to solicit away any of our employees during his employment and for six months after termination of his employment.
104
Table of Contents
The employment agreements with Messrs. Pettit, Nelson and McNutt will provide for annual base salaries of $ , $ and $ , respectively, subject to increase at our discretion, and an annual cash bonus, the amount of which shall be in the sole and absolute discretion of the compensation committee. Additionally, we will agree to nominate Mr. Pettit to serve on our board of directors and use our best efforts to cause him to be elected, appointed, or re-elected or re-appointed, as a director.
If the executive’s employment is terminated by us for cause (as defined in the employment agreement) or by the executive’s death or disability, or the executive voluntarily terminates his employment without good reason (as defined in the employment agreement), including a non-renewal by the executive, the executive will receive an amount consisting of the executive’s accrued and unpaid base salary and benefits payable under our benefit plan terms including equity plans (which we refer to collectively as accrued amounts) and, in the case of a termination due to the executive’s death or disability, an optional bonus at the discretion of the compensation committee. The executive will also be entitled to receive the following severance payments upon termination under the circumstances described below.
Termination by us without cause (excluding death or disability), including our failure to renew the employment agreement, or by the executive for good reason and no change in control (as defined in the employment agreement) occurred within the 24 month period immediately prior to the termination:
| • | all accrued amounts; |
| • | the greater of (i) a pro rata amount of the executive’s target bonus for the year in which the termination occurs or (ii) a bonus for the year in which the termination occurs as determined by the compensation committee; and |
| • | provided the executive complies with the confidentiality, non-compete and non-solicitation provisions contained in the employment agreement and executes a release, a lump sum severance payment equal to the sum of: |
| • | the executive’s base salary for the year in which the termination occurs (or, if greater, the executive’s base salary for the year immediately preceding the year in which the termination occurs); plus |
| • | an amount equal to the greater of (i) the bonus payable to the executive for the year in which termination occurs (provided that if a bonus for such year has not been determined as of the date of termination, then the amount of the bonus will be 100% of the executive’s target bonus for such year, to the extent a target bonus exists) or (ii) the bonus paid to the executive for the year immediately preceding the year in which the termination occurs. |
Termination by us without cause (excluding death or disability), including our failure to renew the employment agreement, or by the executive for good reason, within the 24-month period following a change in control:
| • | all accrued amounts; |
| • | an optional bonus, at the discretion of the compensation committee; |
| • | an amount equal to the greater of: |
| • | a pro rata amount of the executive’s target bonus for the year in which the termination occurs; or |
| • | a bonus for such year as may be determined by the compensation committee in its sole discretion; and |
| • | provided the executive complies with the confidentiality, non-compete and non-solicitation provisions contained in the employment agreement and executes a release, a lump sum severance payment equal to the sum of: |
105
Table of Contents
| • | times the greater of (i) the executive’s base salary in effect as of the date of termination (or, if greater, before any reduction during the change of control period) or (ii) the executive’s base salary in effect immediately before the change of control occurs; plus |
| • | times the greater of (i) the bonus payable for the year in which the termination occurs (provided that if a bonus for such year has not been determined as of the date of termination, then the bonus amount will be 100% of the executive’s target bonus for such year, to the extent a target bonus exists), (ii) the bonus paid to the executive for the year immediately preceding the year in which the termination occurs; or (iii) the bonus paid to the executive for the year immediately preceding the year in which the change of control occurs. |
The employment agreements generally define a change in control to mean any of the following events:
| • | any person or group becomes the “beneficial owner” (as defined in Rule 13d-3 under the Exchange Act), directly or indirectly, of more than 35% of the total voting power of our outstanding voting stock; |
| • | our merger with or consolidation into another entity and, immediately after giving effect to the merger or consolidation, one or both of the following occurs: (a) less than 50% of the total voting power of the outstanding voting stock of the surviving or resulting entity is then “beneficially owned” in the aggregate by our stockholders immediately prior to such merger or consolidation, or (b) the individuals who were members of our board of directors immediately prior to the execution of the agreement providing for the merger or consolidation do not constitute at least a majority of the members of the board of directors of the surviving or resulting entity; |
| • | we sell, assign, convey, transfer, lease or otherwise dispose of all or substantially all of our assets to a third party in one transaction or a series of related transactions; |
| • | individuals who constitute our board of directors cease for any reason to constitute at least a majority of our board of directors unless such persons were elected, appointed or nominated by a vote of at least a majority of our incumbent directors; or |
| • | the complete liquidation or dissolution of us. |
Grants of Plan-Based Awards
Share information in this section does not give effect to the -for-1 stock split that we will effect immediately prior to the completion of this offering.
On August 22, 2012, Brian C. Nelson was awarded 50,000 restricted shares of our common stock. Pursuant to the original award agreement, 50% of such restricted shares vested on the earlier of January 1, 2013 or the completion of our initial public offering, and the remaining 50% vested on January 1, 2013. On November 16, 2012, the award agreement was amended to provide for 100% vesting on the earlier of January 1, 2014 or the completion of our initial public offering. On December 1, 2013, the award agreement was amended to provide for 100% vesting on March 31, 2014 and was subsequently amended on March 31, 2014 to provide for 100% vesting on August 15, 2014.
On August 22, 2012, Tom D. McNutt was awarded 10,000 restricted shares of our common stock. Pursuant to the original award agreements, the restricted shares vested ratably in three equal installments: the first vesting date was the earlier of January 1, 2013 or the completion of our initial public offering, and the second and third vesting dates were the first and second anniversaries of the first vesting date. On November 16, 2012, the award agreements were amended to provide that the first vesting date would be the earlier of January 1, 2014 or the completion of our initial public offering with the second and third vesting dates depending on the timing of the first vesting date. On December 1, 2013, the award agreements were amended to provide for 100% vesting upon the completion of our initial public offering. The restricted shares also vest upon a change in control or death or disability. If Mr. McNutt’s employment terminates during the restricted period for any reason other than death or disability, his unvested shares are automatically forfeited.
106
Table of Contents
We did not grant any plan-based awards to our named executive officers during 2013 or 2014.
Outstanding Equity Awards at Fiscal Year-End
Share information in this section does not give effect to the -for-1 stock split that we will effect immediately prior to the completion of this offering.
The following table provides information concerning unvested restricted shares of our common stock held by our named executive officers as of December 31, 2014.
| Number of Restricted Shares That Have Not Vested(1) |
Market Value of Restricted Shares That Have Not Vested(2) |
|||||||
| B. Hunt Pettit |
— | $ | — | |||||
| Brian C. Nelson |
— | $ | — | |||||
| Tom D. McNutt |
10,000 | $ | 1,270,000 | |||||
| (1) | Mr. McNutt’s restricted shares will vest upon completion of this offering. |
| (2) | Reflects the grant date fair value of restricted shares of our common stock granted during 2012. In accordance with FASB ASC Topic 718, we recognized a grant date fair value of $127 per share with respect to these awards based on a third party valuation. The agreements governing the restricted stock awards were amended on November 16, 2012 and December 1, 2013 to modify the vesting dates and percentage of shares vesting at each vesting date as described under “—Grants of Plan-Based Awards” above. The modifications subsequent to the grant date had no impact on the fair value of the restricted shares. |
Overriding Royalty Interests
In August 2012, we completed the granting of overriding royalty interests in our acreage to our executive officers, including the named executive officers and certain other members of management. These overriding royalty interests entitle the holders to receive percentages of the net revenue associated with sales of oil and natural gas produced from our acreage, with no corresponding responsibility for payment of any expenses. These percentages range from 0% to 2.0% in the East Texas stacked play, 0% to 2.2% in the Permian Basin and 0% to 4.2% in the DJ Basin. With respect to our named executive officers, B. Hunt Pettit, Brian C. Nelson and Tom D. McNutt received overriding royalty interests ranging from 0% to 4.2%, 0% to 0.25% and 0% to 0.25% respectively. In 2013 and 2014, royalty payments to Messrs. Pettit, Nelson and McNutt were minimal, not exceeding approximately $3,000 each. As described under “Certain Relationships and Related Party Transactions—Corporate Reorganization,” certain other persons received overriding royalty interests in connection with our corporate reorganization. Since October 2012, we have not granted, and we do not intend to grant, additional overriding royalty interests with respect to our properties to our executive officers or other employees.
2012 Stock Incentive Plan
In connection with our corporate reorganization, we adopted our 2012 Stock Incentive Plan. We intend to amend and restate our 2012 Stock Incentive Plan in connection with the completion of this offering. The following is a summary of the amended and restated plan, which is filed as an exhibit to the registration statement of which this prospectus forms a part. The purpose of the plan is to enable us to attract and retain the types of employees, consultants and directors who will contribute to our long range success, provide incentives that align the interests of employees, consultants and directors with those of our stockholders and promote the success of our business.
Eligibility. Employees, consultants and directors of us and our affiliates are eligible to participate in the plan.
107
Table of Contents
Administration. Upon completion of this offering, our compensation committee will administer the plan and will generally be responsible for selecting participants from among eligible persons. Unless otherwise limited, the compensation committee will have broad discretion to administer the plan, including the power to determine to whom and when awards will be granted, to determine the amount of such awards (measured in cash, shares of common stock or otherwise), to prescribe the terms and conditions of each award, to accelerate the exercise terms of any award, to delegate duties under the plan and to execute all other responsibilities permitted or required under the plan.
Shares Available. The maximum aggregate number of shares of our common stock that may be reserved and available for delivery in connection with awards under the plan is , subject to adjustment in accordance with the terms of the plan, of which have been issued. Shares covered by awards that terminate by expiration, forfeiture, cancellation, or otherwise without the issuance of shares or are settled in cash will not count against this limit and can be regranted under the plan. Shares surrendered or withheld in payment of the exercise price of an option and shares withheld by us to satisfy any tax withholding obligation will count against the limit. Subject to adjustment in accordance with the terms of the plan, no more than shares may be subject to options or stock appreciation rights granted under the plan to any one participant during any one year period, and no more than shares may be subject to any other awards granted under the plan to any one participant during any one year period.
Terms of Options. The compensation committee may grant (a) incentive stock options that comply with Section 422 of the Code to our employees and (b) nonqualified options to any eligible person under the Plan. Except as described below, the exercise price for an option must not be less than the fair market value per share of common stock as of the date of grant and may be exercised on such terms as the compensation committee determines, but not later than ten years from the date of grant. For participants who own 10% or more of the voting power of our outstanding stock, the exercise price for an option must not be less than 110% of the fair market value per share of common stock as of the date of grant and is not exercisable after the expiration of five years from the date of grant.
Terms of Stock Appreciation Rights. SARs may be awarded in connection with or separate from an option. A SAR is the right to receive an amount equal to the excess of the fair market value of one share of our common stock on the date of exercise over the grant price of the SAR. SARs will be exercisable on such terms as the compensation committee determines. The term of an SAR will be for a period determined by the compensation committee but will not exceed ten years. SARs may be paid in cash, common stock or a combination of cash and common stock, as determined by the compensation committee in the award agreement.
Restricted Stock Awards. A restricted stock award is a grant of shares of common stock subject to a risk of forfeiture, restrictions on transferability and any other restrictions determined by the compensation committee. Except as otherwise provided under the terms of the plan or an award agreement, the holder of a restricted stock award may have rights as a stockholder, including the right to vote or to receive dividends (subject to any mandatory reinvestment or other requirements determined by the compensation committee). Unless otherwise determined by the compensation committee, a restricted stock award will be forfeited and reacquired by us upon termination of employment other than death or disability. Common stock distributed in connection with a stock split or stock dividend, and other property distributed as a dividend, may be subject to the same restrictions and risk of forfeiture as the restricted stock with respect to which the distribution was made.
Restricted Stock Units. Restricted stock units are rights to receive cash, common stock or a combination of cash and common stock at the end of a specified period. Restricted stock units may be subject to restrictions, including a risk of forfeiture, as determined by the compensation committee. Restricted stock units may be satisfied by cash, common stock or any combination of cash and common stock, as determined by the compensation committee. Unless otherwise determined by the compensation committee, restricted stock units will be forfeited upon termination of a participant’s employment other than death or disability. The compensation committee may, in its sole discretion, grant dividend equivalents with respect to restricted stock units.
108
Table of Contents
Performance Awards. The plan will provide for the grant of performance awards that may be granted in the form of cash, common stock or a combination of cash and common stock. Each performance award will set forth (a) the amount, including a target and maximum amount if applicable, the recipient may earn in the form of cash or shares of common stock or a formula for determining that amount, (b) the performance criteria and level of achievement versus the criteria that will determine the amount of cash payable or number of shares of our common stock to be granted, issued, retained and/or vested, (c) the performance period over which performance is to be measured, (d) the timing of any payments to be made, (e) restrictions on the transferability of the award and (f) such other terms and conditions as our compensation committee may determine. The maximum performance award payable to any one participant under the plan is shares of common stock, or cash equivalent thereof as determined by the compensation committee, and the maximum cash bonus that may be paid to any participant in any calendar year is $ million.
Director Compensation
We did not award any compensation to any non-employee director during 2012, 2013 or 2014. However, our board of directors believes that attracting and retaining qualified non-employee directors will be critical to the future value growth and governance. Our board of directors also believes that the compensation package for our non-employee directors should require a significant portion of the total compensation package to be equity-based to align the interests of these directors with our stockholders.
The following sets forth the compensation policy for our non-employee directors to be effective upon completion of this offering. Our non-employee director compensation policy is subject to annual review by our compensation committee.
Our board of directors has implemented a compensation policy applicable to all of our non-employee directors, which provides all non-employee directors the following compensation for board and committee services on an annual basis:
| • | Each non-employee director shall receive $ in cash, shares of our restricted common stock valued at $ that vest annually, $ in cash per meeting attended in person (capped at $ per year) and $ in cash per meeting held by telephone; |
| • | The chairman of each of the audit committee, the reserve committee and the compensation committee shall receive $ in cash and shares of our restricted common stock valued at $ that vest annually; |
| • | The chairman of the nominating and corporate governance committee shall receive $ in cash and shares of our restricted common stock valued at $ that vest annually; |
| • | Each member of the audit committee, the reserve committee and the compensation committee (other than the chairman) shall receive $ in cash, $ per meeting attended in person and $ in cash per meeting held by telephone; and |
| • | Each member of the nominating and corporate governance committee (other than the chairman) shall receive $ in cash, $ per meeting attended in person and $ in cash per meeting held by telephone |
Directors who are also our employees will not receive any additional compensation for their service on the board of directors.
We expect that each director will be reimbursed for (1) travel and miscellaneous expenses to attend meetings and activities of our board of directors or its committees; (2) travel and miscellaneous expenses related to such director’s participation in our general education and orientation program for directors; and (3) travel and miscellaneous expenses for each director’s spouse who accompanies a director to attend meetings and activities of our board of directors or any of our committees.
109
Table of Contents
CERTAIN RELATIONSHIPS AND RELATED PARTY TRANSACTIONS
Corporate Reorganization
We were incorporated on July 31, 2012 pursuant to the laws of the State of Delaware as Energy & Exploration Partners, Inc. to become a holding company for our business. In August 2012, we completed a series of reorganization transactions described below, which we refer to collectively as our corporate reorganization.
Prior to the completion of our corporate reorganization, our business was conducted through two entities directly or indirectly owned and controlled by Hunt Pettit, our founder, President and Chief Executive Officer: Energy & Exploration Partners, LLC, or ENXP LLC, which owns our existing acreage, and Energy & Exploration Partners Operating, LP, which was formed to conduct our drilling operations.
In 2011, Mr. Pettit and certain investors formed North American Shale Investment Fund, LP, or NASIF, to acquire net profits interests and overriding royalty interests in certain of our acreage. Mr. Pettit owned all of the equity interests in the general partner of NASIF, and the other investors owned all of the limited partner interests in NASIF. Mr. Pettit also owned all of the outstanding equity interests in North American Shale Investment Advisors, LLC, or NASIF Advisors, which was a party to an investment management agreement with NASIF. In addition to the net profits interests in our acreage owned by NASIF, certain investors, which we refer to as the DJ Basin investors, owned additional net profits interests in our DJ Basin acreage.
The purpose of the corporate reorganization was twofold: (1) as it related to the entities owned by Mr. Pettit through which our business was previously conducted, to reorganize those entities as a corporation for the purpose of effecting an initial public offering, and (2) to acquire the net profits interests in our acreage held by NASIF and the DJ Basin investors.
Our corporate reorganization consisted of the following transactions (share information in the following description does not give effect to the -for-1 stock split that we will effect immediately prior to the completion of this offering):
Contributions to Energy & Exploration Partners, Inc. Pursuant to a contribution agreement, on August 22, 2012, the following contributions were made to us:
| • | Mr. Pettit, our founder, President and Chief Executive Officer, and an affiliated entity contributed the following interests to us in exchange for 288,031 shares of our common stock: |
| • | all of the outstanding equity interests in ENXP, LLC; |
| • | all of the outstanding equity interests in Energy & Exploration Partners Operating, LP and in its general partner; and |
| • | all of the outstanding equity interests in the general partner of NASIF and in NASIF Advisors; |
| • | the limited partners of NASIF contributed all of the outstanding limited partner interests in NASIF to us in exchange for 99,999 shares of our common stock; and |
| • | certain of the DJ Basin investors contributed their net profits interests in our DJ Basin acreage to us in exchange for 8,470 shares of our common stock. |
The consideration for the contributions described above was determined through negotiations among us and the other parties to the contribution agreement. These negotiations were conducted primarily between our management, including our Chief Financial Officer and our General Counsel in consultation with Mr. Pettit, on one hand, and representatives of the largest limited partner of NASIF, on the other hand. These parties used common industry valuation methodologies, including analysis of available information regarding other transactions in our core areas, to assess the relative value of the net profits interests in our acreage held by NASIF compared to the value of our business as a whole. On the basis of these assessments, our management
110
Table of Contents
and the NASIF limited partners negotiated the percentage of our company’s equity to be received by the NASIF limited partners in exchange for their interests in NASIF. We then used the same principles to determine the amount of equity in our company to be offered to the DJ Basin investors in exchange for their net profits interests in our acreage. Mr. Pettit, as the sole direct or indirect equity owner of the companies that comprised our business prior to the reorganization, received the remainder of the equity in our company, other than the restricted stock awarded to our management as described below.
No value was attributed to Mr. Pettit’s interests in the general partner of NASIF and NASIF Advisors in the negotiation of the terms of the contribution agreement. Mr. Pettit acquired his interests in each of these entities upon their formation for de minimis capital contributions to the entities.
Immediately prior to the contributions described above, the limited partners of NASIF and the DJ Basin investors received overriding royalty interests in our acreage. For additional information regarding these overriding royalty interests and overriding royalty interests held by our executive officers, certain other members of our management and an entity affiliated with one of our non-employee directors, see “—Overriding Royalty Interests” and “Executive Compensation—Overriding Royalty Interests.” Additionally, we repurchased the net profits interests held by the DJ Basin investors that were not parties to the contribution agreement for total cash payments of $1.7 million.
Following the contributions described above, we assigned our interests in Energy & Exploration Partners Operating, LP and in its general partner to ENXP, LLC. Additionally, NASIF, its general partner and NASIF Advisors were merged into ENXP, LLC, the investment management agreement between NASIF and NASIF Advisors was terminated, and the net profits interests in our acreage previously held by NASIF and the DJ Basin investors were canceled.
ENXP, LLC assigned its general partnership interest in Energy & Exploration Partners, LP to an affiliated entity of Mr. Pettit for de minimis consideration. Energy & Exploration Partners, LP is a plaintiff in certain immaterial contract disputes related to certain oil and natural gas properties previously held by us and holds no other assets. Mr. Pettit owns all of the limited partnership interests in Energy & Exploration Partners, LP.
Restricted Stock Awards for Management. In connection with the transactions described above, we made awards to members of our senior management, other than Mr. Pettit, of 102,500 restricted shares of our common stock under our 2012 Stock Incentive Plan. See “Executive Compensation.”
In September 2012 and February 2013, Mr. Pettit contributed 22,500 and 2,500 shares, respectively, of our common stock back to us for no consideration, and we used those shares to grant restricted stock awards to certain members of our management under our 2012 Stock Incentive Plan.
Registration Rights Agreement. In connection with our corporate reorganization, we entered into a registration rights agreement with all of our stockholders, including management, receiving shares of common stock in the reorganization. Pursuant to the registration rights agreement, these stockholders have demand and piggyback registration rights under which we are required to use our reasonable best efforts to register the resale of shares of our common stock held by these stockholders or their permitted transferees under certain circumstances at our expense following a qualified public offering (defined in the same manner as such term is defined for the convertible notes). We amended the agreement in connection with the issuance of warrants to Highbridge and Apollo as described below to add Highbridge and Apollo as parties to the agreement and to grant them and their permitted transferees registration rights under the agreement, and further amended the agreement in connection with the offering of the convertible notes to make certain conforming changes.
Certain Transactions with Highbridge and Apollo
In April 2013, December 2013, January 2014 and March 2014, we issued to Highbridge and Apollo senior unsecured notes with principal amounts of $140 million, $25 million, $15 million and $45 million, respectively, for a total principal amount of senior unsecured notes issued of $225 million. In July 2012, we refinanced and
111
Table of Contents
replaced the senior secured notes, including a prepayment premium of approximately $52.6 million, with the net proceeds of our senior secured term loan and the issuance of our convertible notes.
In connection with the issuance of our senior unsecured notes in April 2013, we issued to Highbridge and Apollo warrants to purchase an aggregate of 269,231 shares of our mandatorily convertible preferred stock at an exercise price of $0.01 per share. In connection with the issuance of senior unsecured notes in March 2014, we issued to Highbridge and Apollo additional warrants to purchase an aggregate of 71,122 shares of our mandatorily convertible preferred stock at an exercise price of $0.01 per share. In July 2014, we amended the terms of certain of the warrants held by Highbridge to provide for the cash settlement of those warrants, as described under “Description of Capital Stock—Preferred Stock and Warrants to Purchase Preferred Stock.”
In August 2013, we entered into an agreement with Highbridge and Apollo for a $75 million senior secured term loan with funding subject to certain conditions, although we did not incur any borrowings under such term loan, which was terminated on July 22, 2014.
Highbridge and Apollo purchased an aggregate of $25 million of our convertible notes in the offering of the convertible notes on July 22, 2014. Additionally, Highbridge and Apollo were lenders under our senior secured term loan with respect to $70 million aggregate principal amount of the senior secured term loan on July 22, 2014.
For additional information regarding our senior unsecured notes, the warrants issued to Highbridge and Apollo, our convertible notes and our senior secured term loan, see “Management’s Discussion and Analysis of Financial Condition and Results of Operations—Liquidity and Capital Resources—Debt Facilities and Notes” and “Description of Capital Stock.”
Joint Investment in Well Development
On December 1, 2013, we entered into a joint operating agreement with Energy & Exploration Partners, LP for the purpose of developing two East Texas stacked play wells, the Su-Ling #1 and the Bonanza #1H. Energy & Exploration Partners, LP invested $200,000 in Su-Ling #1 and $400,000 in Bonanza #1H, with its working interest percentage in each well equal to the amount of the respective investment divided by the drilling and completion cost for the well. B. Hunt Pettit, our President, Chief Executive Officer and director is also the sole limited partner of Energy & Exploration Partners, LP and the sole member of its general partner, Septa Holdings LLC. Prior to entering into the joint operating agreement with Energy & Exploration Partners, LP, our board of directors approved the transaction with a view that there would be no further joint investments in operations with any of our officers, directors or employees.
Overriding Royalty Interests
In August 2012, we completed the granting of overriding royalty interests in our acreage to our executive officers, including the named executive officers, certain other members of management, the limited partners of NASIF and the DJ Basin investors. These overriding royalty interests entitle the holders to receive percentages of the net revenue associated with sales of oil and natural gas produced from our acreage, with no corresponding responsibility for payment of any expenses. These percentages range from 0% to 2.5% in the East Texas stacked play, 0% to 2.2% in the Permian and 0% to 4.2% in the DJ Basin. As described under “—Corporate Reorganization,” the limited partners of NASIF and the DJ Basin investors received overriding royalty interests in connection with our corporate reorganization. Oso + Toro (as defined under “Principal and Selling Stockholders”) received overriding royalty interests ranging from 0% to 0.85% and 0% to 0.57%, respectively. Since October 2012, we have not granted, and we do not intend to grant, additional overriding royalty interests with respect to our properties to our directors, executive officers or other employees.
112
Table of Contents
Procedures for Approval of Related Person Transactions
A “related party transaction” is a transaction, arrangement or relationship in which we or any of our subsidiaries was, is or will be a participant, the amount of which involved exceeded or exceeds $120,000, and in which any related person had, has or will have a direct or indirect material interest. A “related person” means:
| • | any person who is, or at any time during the applicable period was, one of our executive officers, directors or director nominees; |
| • | any person who is known by us to be the beneficial owner of more than 5.0% of our outstanding common stock; |
| • | any immediate family member of any of the foregoing persons, which means any child, stepchild, parent, stepparent, spouse, sibling, mother-in-law, father-in-law, son-in-law, daughter-in-law, brother-in-law or sister-in-law, or any person (other than a tenant or employee) sharing the household; and |
| • | any firm, corporation or other entity in which any of the foregoing persons is a partner or principal or in a similar position or in which such person has a 10.0% or greater beneficial ownership interest. |
We expect that our board of directors will adopt a written related party transactions policy prior to the completion of this offering. Pursuant to this policy, we expect that the audit committee will review all material facts of all related party transactions and either approve or disapprove entry into the related party transaction, subject to certain limited exceptions. We anticipate that the policy will provide that, in determining whether to approve or disapprove entry into a related party transaction, the audit committee shall take into account, among other factors, the following: (1) whether the related party transaction is on terms no less favorable than terms generally available to an unaffiliated third-party under the same or similar circumstances and (2) the extent of the related person’s interest in the transaction. Further, we expect the policy to require that all related party transactions required to be disclosed in our filings with the SEC be so disclosed in accordance with applicable laws, rules and regulations.
113
Table of Contents
PRINCIPAL AND SELLING STOCKHOLDERS
The table below sets forth information regarding the beneficial ownership of the common stock of Energy & Exploration Partners, Inc. as of March 31, 2015 by (1) each beneficial owner of more than 5% of our outstanding common stock, (2) each person who will be a director of Energy & Exploration Partners, Inc. upon completion of this offering, (3) each of our named executive officers, and (4) all executive officers and directors as a group. The table also sets forth information regarding the shares of common stock that will be sold by the selling stockholders in this offering. As of March 31, 2015, there were shares of our common stock outstanding, giving effect to the -for-1 stock split that will be effected immediately prior to completion of this offering, and we had outstanding warrants to purchase 340,353 shares of our mandatorily convertible preferred stock that, upon exercise of the warrants, would be convertible into shares of our common stock. Additionally, our convertible notes will be convertible at the option of the holders thereof into an aggregate of shares of our common stock upon the consummation of this offering assuming an initial public offering price per share of $ in this offering, and we expect that all such holders will convert their convertible notes. The ownership percentages after the offering are based on the issuance and sale by us of shares of common stock in the offering, assuming no exercise of the underwriters’ option to purchase additional shares, and the sale by the selling stockholders of shares of common stock in this offering. After the offering and the automatic exercise of outstanding warrants for shares of our common stock at the completion of this offering on a net basis assuming an initial public offering price of $ per share and the conversion of all outstanding convertible notes assuming an initial public offering price of $ per share, there will be shares of our common stock outstanding.
Beneficial ownership is determined in accordance with the rules of the SEC and includes voting or investment power with respect to the securities. Except as indicated by footnote, to our knowledge the persons named in the table below have sole voting and investment power with respect to all common stock shown as beneficially owned by them, subject to community property laws where applicable. Unless otherwise indicated, the address for each stockholder, director and executive officer listed is: Two City Place, Suite 1700, 100 Throckmorton, Fort Worth, Texas 76102.
| Name of Beneficial Owner |
Shares
of Common Stock Beneficially Owned Prior to this Offering |
Shares Offered Pursuant to this Prospectus |
Shares of Common Stock Beneficially Owned After this Offering | |||||||||
| Number | Percentage | Number | Percentage | |||||||||
| Selling Stockholders |
||||||||||||
| Directors and Named Executive Officers |
||||||||||||
| B. Hunt Pettit(1) |
46.84 | % | ||||||||||
| Brian C. Nelson |
9.70 | % | ||||||||||
| Tom D. McNutt(2) |
4.66 | % | ||||||||||
114
Table of Contents
| Name of Beneficial Owner |
Shares
of Common Stock Beneficially Owned Prior to this Offering |
Shares Offered Pursuant to this Prospectus |
Shares of Common Stock Beneficially Owned After this Offering | |||||||||
| Number | Percentage | Number | Percentage | |||||||||
| All directors and executive officers as a group |
||||||||||||
| (7 persons) |
69.52 | % | ||||||||||
| Other 5% Holders |
||||||||||||
| Oso + Toro(4) |
18.30 | % | ||||||||||
| Highbridge(5) |
29.79 | % | ||||||||||
| Apollo(6) |
19.08 | % | ||||||||||
| * | Less than 1% |
| (1) | Includes shares held by trusts for the benefit of Mr. Pettit and his spouse and children over which Mr. Pettit has sole voting power and dispositive power as sole trustee, and shares owned by H Pettit HC, Inc. of which Mr. Pettit is the sole stockholder, President and Secretary and sole director. |
| (2) | Includes shares held by trusts over which Mr. McNutt has sole voting power and dispositive power as sole trustee. Mr. McNutt has no beneficial interest in these trusts. |
| (3) | Consists of shares owned by Oso + Toro Multi Strategy Fund Series Interests of the SALI Multi-Series Fund II 3(c)(1), L.P. and shares owned by Oso + Toro Multi Strategy Fund (Tax Exempt) Segregated Portfolio of SALI Multi-Series Fund SPC, Ltd. The business address is 6836 Austin Center Boulevard, Suite 320, Austin, Texas 78731. Tom Nieman, the Chief Financial Officer of SALI Fund Management, LLC, the Investment Manager, and Justin Pawl, Partner and Managing Director of Covenant Multi Family Offices, LLC, the Investment Subadvisor, exercise joint voting and investment power with respect to the shares of our common stock owned by such entities. |
| (4) | Consists of shares issuable upon conversion of shares of preferred stock issuable upon exercise of warrants owned by Highbridge Principal Strategies—Mezzanine Partners II Delaware Subsidiary, LLC, shares issuable upon conversion of shares of preferred stock issuable upon exercise of warrants owned by Highbridge Principal Strategies—AP Mezzanine Partners II, L.P., shares issuable upon conversion of shares of preferred stock issuable upon exercise of warrants owned by ENXP Offshore, L.P., and shares issuable upon conversion of shares of preferred stock issuable upon exercise of warrants owned by ENXP Institutional, L.P. The business address is 40 West 57th Street, 33rd Floor, New York, New York 10019. The Highbridge Mezzanine Fund Investment Committee, comprised of Scott Kapnick, Scot French, Michael Patterson, Purnima Puri and Faith Rosenfeld, exercises voting and investment power with respect to the shares of our common stock owned by such entities. |
| (5) | Consists of shares issuable upon conversion of shares of preferred stock issuable upon exercise of warrants owned by Apollo Investment Corporation, shares issuable upon conversion of shares of preferred stock issuable upon exercise of warrants owned by Apollo Special Opportunities Managed Account, L.P., shares issuable upon conversion of shares of preferred stock issuable upon exercise of warrants owned by Apollo Centre Street Partnership, L.P., and shares owned by ANS U.S. Holdings Ltd. The business address is c/o Apollo Management, L.P., 9 W 57th Street, New York, New York 10019. Joseph Glatt, Vice President of Apollo, exercises voting and investment power with respect to the shares of our common stock owned by such entities. |
115
Table of Contents
Upon completion of this offering, the authorized capital stock of Energy & Exploration Partners, Inc. will consist of shares of common stock, $0.01 par value per share, of which shares will be issued and outstanding, and shares of preferred stock, $0.01 par value per share, of which no shares will be issued and outstanding.
The following description includes summaries of the material terms and provisions of our amended and restated certificate of incorporation and amended and restated bylaws. This description is qualified by reference to our amended and restated certificate of incorporation and amended and restated bylaws, which will be filed as exhibits to the registration statement of which this prospectus is a part, and to the provisions of applicable law.
Common Stock
Except as provided by law or in a preferred stock designation, holders of common stock are entitled to one vote for each share held of record on all matters submitted to a vote of the stockholders, will have the exclusive right to vote for the election of directors and do not have cumulative voting rights. Except as otherwise required by law, holders of common stock, as such, are not entitled to vote on any amendment to the certificate of incorporation (including any certificate of designations relating to any series of preferred stock) that relates solely to the terms of any outstanding series of preferred stock if the holders of such affected series are entitled, either separately or together with the holders of one or more other such series, to vote thereon pursuant to the amended and restated certificate of incorporation (including any certificate of designations relating to any series of preferred stock) or pursuant to the General Corporation Law of the State of Delaware. Subject to preferences that may be applicable to any outstanding shares or series of preferred stock, holders of common stock are entitled to receive ratably such dividends (payable in cash, stock or otherwise), if any, as may be declared from time to time by our board of directors out of funds legally available for dividend payments. All outstanding shares of common stock are fully paid and non-assessable, and the shares of common stock to be issued upon completion of this offering will be fully paid and non-assessable. The holders of common stock have no preferences or rights of conversion, exchange, pre-emption or other subscription rights. There are no redemption or sinking fund provisions applicable to the common stock. In the event of any liquidation, dissolution or winding-up of our affairs, holders of common stock will be entitled to share ratably in our assets that are remaining after payment or provision for payment of all of our debts and obligations and after liquidation payments to holders of outstanding shares of preferred stock, if any.
Preferred Stock and Warrants to Purchase Preferred Stock
Our amended and restated certificate of incorporation will authorize our board of directors, subject to any limitations prescribed by law, without further stockholder approval, to establish and to issue from time to time one or more classes or series of preferred stock, par value $0.01 per share, covering up to an aggregate of shares of preferred stock. Each class or series of preferred stock will cover the number of shares and will have the powers, preferences, rights, qualifications, limitations and restrictions determined by the board of directors, which may include, among others, dividend rights, liquidation preferences, voting rights, conversion rights, preemptive rights and redemption rights. Except as provided by law or in a preferred stock designation, the holders of preferred stock will not be entitled to vote at or receive notice of any meeting of stockholders.
In April 2013, we created two new series of our preferred stock, each with a par value of $0.01 per share, designated as the “Series A Mandatorily Convertible Preferred Stock” and the “Series B Mandatorily Convertible Preferred Stock.” In connection with the issuance of our senior unsecured notes in April 2013, we issued to Highbridge and Apollo warrants to purchase an aggregate of 269,231 shares of our Series A Mandatorily Convertible Preferred Stock and Series B Mandatorily Convertible Preferred Stock at an exercise price of $0.01 per share. In connection with the issuance of senior unsecured notes in March 2014, we issued to Highbridge and Apollo additional warrants to purchase an aggregate of 71,122 shares of our Series A Mandatorily Convertible
116
Table of Contents
Preferred Stock and Series B Mandatorily Convertible Preferred Stock at an exercise price of $0.01. Each share of the preferred stock is convertible at the option of the holder prior to a qualified public offering (defined in the same manner as such term is defined for the convertible notes ) and will convert automatically upon completion of a qualified public offering into shares of our common stock, or an aggregate of shares of our common stock. To the extent not previously exercised, at the completion of a qualified public offering, the warrants will automatically convert on a net basis into the number shares of our common stock into which the shares of preferred stock issuable upon exercise of the warrants would then be converted, less a number of shares equal to the aggregate exercise price divided by the initial public offering per share.
No shares of preferred stock will be outstanding upon completion of this offering.
Anti-Takeover Effects of Provisions of Our Certificate of Incorporation, Our Bylaws and Delaware Law
Some provisions of Delaware law and our amended and restated certificate of incorporation and our amended and restated bylaws, will contain provisions that could make the following transactions more difficult: acquisitions of us by means of a tender offer, a proxy contest or otherwise; or removal of our incumbent directors. These provisions may also have the effect of preventing changes in our management. It is possible that these provisions could make it more difficult to accomplish or could deter transactions that stockholders may otherwise consider to be in their best interest or in our best interests, including transactions that might result in a premium over the market price for our shares.
These provisions, summarized below, are expected to discourage coercive takeover practices and inadequate takeover bids. These provisions are also designed to encourage persons seeking to acquire control of us to first negotiate with us. We believe that the benefits of increased protection and our potential ability to negotiate with the proponent of an unfriendly or unsolicited proposal to acquire or restructure us outweigh the disadvantages of discouraging these proposals because, among other things, negotiation of these proposals could result in an improvement of their terms.
Section 203 of the Delaware General Corporation Law
We will be subject to the provisions of Section 203 of the General Corporation Law of the State of Delaware (“DGCL”) regulating corporate takeovers. In general, those provisions prohibit a Delaware corporation, including those whose securities are listed for trading on the NYSE, from engaging in any business combination with any interested stockholder for a period of three years following the date that the stockholder became an interested stockholder, unless:
| • | the transaction is approved by the board of directors before the date the interested stockholder attained that status; |
| • | upon consummation of the transaction that resulted in the stockholder becoming an interested stockholder, the interested stockholder owned at least 85% of the voting stock of the corporation outstanding at the time the transaction commenced; or |
| • | on or after such time the business combination is approved by the board of directors and authorized at a meeting of stockholders by at least two-thirds of the outstanding voting stock that is not owned by the interested stockholder. |
Section 203 defines “business combination” to include the following:
| • | any merger or consolidation involving the corporation and the interested stockholder; |
| • | any sale, transfer, pledge or other disposition of 10% or more of the assets of the corporation involving the interested stockholder; |
117
Table of Contents
| • | subject to certain exceptions, any transaction that results in the issuance or transfer by the corporation of any stock of the corporation to the interested stockholder; |
| • | any transaction involving the corporation that has the effect of increasing the proportionate share of the stock of any class or series of the corporation beneficially owned by the interested stockholder; or |
| • | the receipt by the interested stockholder of the benefit of any loans, advances, guarantees, pledges or other financial benefits provided by or through the corporation. |
In general, Section 203 defines an interested stockholder as any entity or person beneficially owning 15% or more of the outstanding voting stock of the corporation and any entity or person affiliated with or controlling or controlled by any of these entities or persons.
A Delaware corporation may “opt out” of Section 203 with an express provision in its original certificate of incorporation or an express provision in its certificate of incorporation or bylaws resulting from amendments approved by the holders of at least a majority of the corporation’s outstanding voting shares. We do not intend to “opt out” of the provisions of Section 203. The statute could prohibit or delay mergers or other takeover or change in control attempts and, accordingly, may discourage attempts to acquire us.
Amended and Restated Certificate of Incorporation and Amended and Restated Bylaws
Among other things, upon the completion of this offering, our amended and restated certificate of incorporation and amended and restated bylaws will:
| • | establish advance notice procedures with regard to stockholder proposals relating to the nomination of candidates for election as directors or new business to be brought before meetings of our stockholders. These procedures provide that notice of stockholder proposals must be timely given in writing to our corporate secretary prior to the meeting at which the action is to be taken. Generally, to be timely, notice must be received at our principal executive offices not less than 90 days nor more than 120 days prior to the first anniversary date of the annual meeting for the preceding year. Our amended and restated bylaws specify the requirements as to form and content of all stockholders’ notices. These requirements may preclude stockholders from bringing matters before the stockholders at an annual or special meeting; |
| • | provide our board of directors the ability to authorize undesignated preferred stock. This ability makes it possible for our board of directors to issue, without stockholder approval, preferred stock with voting or other rights or preferences that could impede the success of any attempt to change control of us. These and other provisions may have the effect of deferring hostile takeovers or delaying changes in control or management of our company; |
| • | provide that the authorized number of directors may be changed only by resolution of the board of directors; |
| • | provide that all vacancies, including newly created directorships, may, except as otherwise required by law, be filled by the affirmative vote of a majority of directors then in office, even if less than a quorum; |
| • | provide that any action required or permitted to be taken by the stockholders must be effected at a duly called annual or special meeting of stockholders and may not be effected by any consent in writing in lieu of a meeting of such stockholders, subject to the rights of the holders of any series of preferred stock; |
| • | provide that our certificate of incorporation and bylaws may be amended by the affirmative vote of the holders of at least two-thirds of our then outstanding common stock; and |
| • | provide that special meetings of our stockholders may only be called by the board of directors, the chief executive officer or the chairman of the board; |
| • | provide for our board of directors to be divided into three classes of directors, with each class as nearly equal in number as possible, serving staggered three year terms, other than directors who may be elected |
118
Table of Contents
| by holders of preferred stock, if any. For more information on the classified board of directors, please see “Management.” This system of electing and removing directors may tend to discourage a third party from making a tender offer or otherwise attempting to obtain control of us, because it generally makes it more difficult for stockholders to replace a majority of the directors; and |
| • | provide that our bylaws can be amended or repealed at any regular or special meeting of stockholders or by the board of directors. |
Limitation of Liability and Indemnification Matters
Our amended and restated certificate of incorporation will limit the liability of our directors for monetary damages for breach of their fiduciary duty as directors, except for liability that cannot be eliminated under the DGCL. Delaware law provides that directors of a company will not be personally liable for monetary damages for breach of their fiduciary duty as directors, except for liabilities:
| • | for any breach of their duty of loyalty to us or our stockholders; |
| • | for acts or omissions not in good faith or that involve intentional misconduct or a knowing violation of law; |
| • | for unlawful payment of dividend or unlawful stock repurchase or redemption, as provided under Section 174 of the DGCL; or |
| • | for any transaction from which the director derived an improper personal benefit. |
Any amendment, repeal or modification of these provisions will be prospective only and would not affect any limitation on liability of a director for acts or omissions that occurred prior to any such amendment, repeal or modification.
Our amended and restated certificate of incorporation and amended and restated bylaws will also provide that we will indemnify our directors and officers to the fullest extent permitted by Delaware law. Our amended and restated bylaws will also permit us to purchase insurance on behalf of any officer, director, employee or other agent for any liability arising out of that person’s actions as our officer, director, employee or agent, regardless of whether Delaware law would permit indemnification. We intend to enter into indemnification agreements with each of our current and future directors and officers. These agreements will require us to indemnify these individuals to the fullest extent permitted under Delaware law against liability that may arise by reason of their service to us, and to advance expenses incurred as a result of any proceeding against them as to which they could be indemnified. We believe that the limitation of liability provision in our amended and restated certificate of incorporation and the indemnification agreements will facilitate our ability to continue to attract and retain qualified individuals to serve as directors and officers.
Choice of Forum
Our amended and restated certificate of incorporation will provide that unless we consent in writing to the selection of an alternative forum, the Court of Chancery of the State of Delaware will be the sole and exclusive forum for:
| • | any derivative action or proceeding brought on our behalf; |
| • | any action asserting a claim of breach of a fiduciary duty owed by any of our directors, officers, employees or agents to us or our stockholders; |
| • | any action asserting a claim against us or any director or officer or other employee of ours arising pursuant to any provision of the DGCL or our amended and restated certificate of incorporation or bylaws; or |
| • | any action asserting a claim against us or any director or officer or other employee of ours governed by the internal affairs doctrine. |
119
Table of Contents
Our amended and restated certificate of incorporation will also provide that any person or entity purchasing or otherwise acquiring any interest in shares of our capital stock will be deemed to have notice of and to have consented to this choice of forum provision. It is possible that a court of law could rule that the choice of forum provision contained in our amended and restated certificate of incorporation is inapplicable or unenforceable if it is challenged in a proceeding or otherwise.
Transfer Agent and Registrar
We have appointed Computershare Trust Company, N.A. as the transfer agent and registrar for our common stock.
Listing
We have applied to list our common stock on the New York Stock Exchange under the symbol “ENXP.”
120
Table of Contents
SHARES ELIGIBLE FOR FUTURE SALE
Prior to this offering, there has been no public market for our common stock. Future sales of our common stock in the public market, or the availability of such shares for sale in the public market, could adversely affect market prices prevailing from time to time. As described below, only a limited number of shares, other than shares sold in this offering, will be available for sale shortly after this offering due to contractual and legal restrictions on resale. Nevertheless, sales of a substantial number of shares of our common stock in the public market after such restrictions lapse, or the perception that those sales may occur, could adversely affect the prevailing market price at such time and our ability to raise equity-related capital at a time and price we deem appropriate.
Sales of Restricted Shares
Upon the closing of this offering, we will have issued and outstanding an aggregate of shares of common stock. Of these shares, all of the shares of common stock to be sold in this offering will be freely tradable without restriction or further registration under the Securities Act, unless the shares are held by any of our “affiliates” as such term is defined in Rule 144 under the Securities Act. All remaining shares of common stock held by existing stockholders will be deemed “restricted securities” as such term is defined in Rule 144. The restricted securities were issued and sold by us in private transactions and are eligible for public sale only if registered under the Securities Act or if they qualify for an exemption from registration under Rule 144 or Rule 701 under the Securities Act, which rules are summarized below.
Under the provisions of Rule 144 and Rule 701 under the Securities Act, all of the shares of our common stock (excluding the shares to be sold in this offering) will be available for sale in the public market upon the expiration of the lock-up agreements, beginning 180 days after the date of this prospectus (subject to certain exceptions and extensions) and when permitted under Rule 144 or Rule 701.
Lock-up Agreements
We, all of our directors and executive officers and certain of our existing stockholders (including the selling stockholders) have agreed not to sell or otherwise transfer or dispose of any common stock for a period of 180 days from the date of this prospectus, subject to certain exceptions and extensions. See “Underwriting” for a description of these lock-up provisions.
Rule 144
In general, under Rule 144 as currently in effect, once we have been a reporting company subject to the reporting requirements of Section 13 or 15(d) of the Exchange Act for 90 days, a person (or persons whose shares are aggregated) who is not deemed to have been an affiliate of ours at any time during the three months preceding a sale, and who has beneficially owned restricted securities within the meaning of Rule 144 for at least six months (including any period of consecutive ownership of preceding non-affiliated holders) would be entitled to sell those shares, subject only to the availability of current public information about us. A non-affiliated person who has beneficially owned restricted securities within the meaning of Rule 144 for at least one year would be entitled to sell those shares without regard to the provisions of Rule 144.
In general, once we have been a reporting company subject to the reporting requirements of Section 13 or 15(d) of the Exchange Act for 90 days, a person (or persons whose shares are aggregated) who is deemed to be an affiliate of ours and who has beneficially owned restricted securities within the meaning of Rule 144 for at least six months would be entitled to sell within any three-month period a number of shares that does not exceed the greater of one percent of the then outstanding shares of our common stock or the average weekly trading volume of our common stock reported through the New York Stock Exchange during the four calendar weeks preceding the filing of notice of the sale. Such sales are also subject to certain manner of sale provisions, notice requirements and the availability of current public information about us.
121
Table of Contents
Rule 701
Employees, directors, officers, consultants or advisors who received shares from us in connection with a compensatory stock or option plan or other written compensatory agreement in accordance with Rule 701 before the effective date of the registration statement of which this prospectus is a part are entitled to sell such shares 90 days after the effective date of the registration statement in reliance on Rule 144 without having to comply with the holding period requirement of Rule 144 and, in the case of non-affiliates, without having to comply with the public information, volume limitation or notice filing provisions of Rule 144.
Stock Issued Under Employee Plans
We intend to file a registration statement on Form S-8 under the Securities Act to register stock issuable under our 2012 Stock Incentive Plan. This registration statement is expected to be filed following the effective date of the registration statement of which this prospectus is a part and will be effective upon filing. Accordingly, shares registered under such registration statement will be available for sale in the open market following the effective date, unless such shares are subject to vesting restrictions with us, Rule 144 restrictions applicable to our affiliates or the lock-up restrictions described above.
Registration Rights
We entered into a registration rights agreement in connection with our corporate reorganization pursuant to which we are required to use our reasonable best efforts to register the resale of shares of our common stock held by certain of our stockholders or their permitted transferees under certain circumstances at our expense. We amended the agreement in connection with the issuance of warrants to Highbridge and Apollo to add Highbridge and Apollo as parties to the agreement and to grant them and their permitted transferees registration rights under the agreement. See “Certain Relationships and Related Party Transactions—Corporate Reorganization” and “—Certain Transactions with Highbridge and Apollo.”
In addition, in connection with the issuance of the convertible notes, we entered into a registration rights agreement for the benefit of the holders of the convertible notes under which we are required to file a shelf registration statement that must be effective within 180 days after the closing of this this offering covering the resale of all shares of our common stock that are issued upon conversion of the convertible notes, other than the shares being sold in this offering.
122
Table of Contents
MATERIAL U.S. FEDERAL INCOME TAX CONSIDERATIONS FOR NON-U.S. HOLDERS
The following is a general discussion of the material U.S. federal income tax consequences of the acquisition, ownership and disposition of our common stock to a non-U.S. holder. For the purpose of this discussion, a non-U.S. holder is any beneficial owner of our common stock that is not for U.S. federal income tax purposes any of the following:
| • | an individual citizen or resident of the U.S.; |
| • | a corporation (or other entity treated as a corporation for U.S. federal income tax purposes) created or organized in the U.S. or under the laws of the United States or any state or the District of Columbia; |
| • | a partnership (or other entity treated as a partnership or other pass-through entity for U.S. federal income tax purposes); |
| • | an estate whose income is subject to U.S. federal income tax regardless of its source; or |
| • | a trust (x) whose administration is subject to the primary supervision of a court within the United States and which has one or more U.S. persons (as defined for U.S. federal income tax purposes) who have the authority to control all substantial decisions of the trust or (y) which has made a valid election to be treated as a U.S. person. |
If a partnership (or an entity treated as a partnership for U.S. federal income tax purposes) holds our common stock, the tax treatment of a partner in the partnership will generally depend on the status of the partner and upon the activities of the partnership. Accordingly, if you are treated as a partner of a partnership that holds our common stock you should consult your own tax advisor as to the particular U.S. federal income taxes applicable to you.
This discussion assumes that a non-U.S. holder will hold our common stock issued pursuant to the offering as a capital asset (generally, property held for investment) within the meaning of Section 1221 of the Internal Revenue Code of 1986, as amended (the “Code”). This discussion does not address all aspects of U.S. federal taxation (including alternative minimum, gift and estate tax) or any other U.S. federal tax laws, including Medicare taxes imposed on net investment income or any aspects of state, local or non-U.S. taxation. It does not consider any U.S. federal income tax considerations that may be relevant to non-U.S. holders that may be subject to special treatment under U.S. federal income tax laws, including, without limitation, U.S. expatriates, life insurance companies, tax-exempt or governmental organizations, dealers in securities or currency, banks or other financial institutions, investors whose functional currency is other than the U.S. dollar, “passive foreign investment companies,” “controlled foreign corporations,” persons who at any time hold more than 5% of the fair market value of any class of our stock and investors that hold our common stock as part of a hedge, straddle or conversion transaction. Furthermore, the following discussion is based on current provisions of the Code, Treasury Regulations and administrative and judicial interpretations thereof, all as in effect on the date hereof, and all of which are subject to change, possibly with retroactive effect.
We urge each prospective investor to consult a tax advisor regarding the U.S. federal, state, local and non-U.S. income and other tax consequences of acquiring, holding and disposing of shares of our common stock.
Distributions
We do not plan to make any distributions for the foreseeable future. However, if we do make distributions on our common stock, those payments will constitute dividends to the extent paid from our current or accumulated earnings and profits, as determined under U.S. federal income tax principles. To the extent those distributions exceed our current and accumulated earnings and profits, the distributions will first reduce a non-U.S. holder’s adjusted tax basis in their common stock (determined on a share by share basis), but not below zero, and then will be treated as gain from the sale of the common stock (subject to the rules discussed below under “—Gain on Disposition of Common Stock”).
123
Table of Contents
Any dividends (out of earnings and profits) paid to a non-U.S. holder of our common stock that are not effectively connected with a U.S. trade or business conducted by the non-U.S. holder generally will be subject to U.S. withholding tax either at a rate of 30% of the gross amount of the dividend or such lower rate as may be specified by an applicable tax treaty. To receive the benefit of a reduced treaty rate, a non-U.S. holder must provide us or our paying agent with a valid Internal Revenue Service (“IRS”) Form W-8BEN or Form W-8BEN-E (or other applicable form) certifying qualification for the reduced rate.
Dividends received by a non-U.S. holder that are effectively connected with a U.S. trade or business conducted by the non-U.S. holder (and if a treaty applies, are attributable to a U.S. permanent establishment of such non-U.S. holder) are exempt from such U.S. withholding tax. To obtain this exemption, the non-U.S. holder must provide us or our paying agent with a valid IRS Form W-8ECI properly certifying such exemption. Such effectively connected dividends, although not subject to withholding tax, will be subject to U.S. federal income tax on a net income basis at the same graduated rates generally applicable to U.S. persons, subject to any applicable tax treaty providing otherwise. In addition to the income tax described above, dividends received by corporate non-U.S. holders that are effectively connected with a U.S. trade or business of the corporate non-U.S. holder may be subject to a branch profits tax at a rate of 30% (or such lower rate as may be specified by an applicable tax treaty).
A non-U.S. holder of our common stock may obtain a refund of any excess amounts withheld if the non-U.S. holder is eligible for a reduced rate of U.S. withholding tax and an appropriate claim for refund is timely filed with the IRS.
Gain on Disposition of Common Stock
Subject to the discussion of backup withholding, below, a non-U.S. holder generally will not be subject to U.S. federal income tax on any gain realized upon the sale or other disposition of our common stock unless:
| • | the gain is effectively connected with a U.S. trade or business of the non-U.S. holder and, if required by an applicable tax treaty, is attributable to a U.S. permanent establishment maintained by such non-U.S. holder; |
| • | the non-U.S. holder is an individual who is present in the United States for a period or periods aggregating 183 days or more during the calendar year in which the sale or disposition occurs and certain other conditions are met; or |
| • | our common stock constitutes a “U.S. real property interest” by reason of our status as a U.S. real property holding corporation (a “USRPHC”) for U.S. federal income tax purposes at any time within the shorter of the five-year period preceding the disposition or the non-U.S. holder’s holding period for our common stock. |
Unless an applicable tax treaty provides otherwise, gain described in the first bullet point above will be recognized in an amount equal to the excess of the amount of cash and the fair market value of any other property received for the common stock over the non-U.S. holder’s basis in the common stock. Such gain or loss will be generally subject to U.S. federal income tax on a net income basis at the same graduated rates generally applicable to U.S. persons. In the case of a non-U.S. holder that is a foreign corporation, such gain may also be subject to a branch profits tax at a rate of 30% (or such lower rate as may be specified by an applicable tax treaty).
Gain described in the second bullet point above (which may be offset by U.S. source capital losses, provided that the non-U.S. holder has timely filed U.S. federal income tax returns with respect to such losses) will be subject to a flat 30% U.S. federal income tax (or such lower rate as may be specified by an applicable tax treaty).
With respect to the third bullet point above, we believe we are, and will remain for the foreseeable future, a USRPHC. If we are so classified, gain arising from the sale or other taxable disposition by a non-U.S. holder of our common stock will not be subject to tax if such class of stock is regularly traded on an established securities market, as defined by applicable Treasury Regulations, and such non-U.S. holder does not own, actually or constructively, more than 5% of such class of our stock at any time during the shorter of the five-year period ending on the date of the sale or exchange or the non-U.S. holder’s holding period for our common stock. We
124
Table of Contents
expect our common stock to be regularly traded on an established securities market, although we cannot guarantee it will be so traded. If gain on the sale or other taxable disposition of our stock were subject to taxation under the third bullet point above, the non-U.S. holder would be subject to regular U.S. federal income tax with respect to such gain in generally the same manner as a U.S. person and would have to file a U.S. income tax return reporting such gain or loss.
Non-U.S. holders should consult a tax advisor regarding potentially applicable income tax treaties that may provide for different rules.
Backup Withholding and Information Reporting
Generally, we must report annually to the IRS the amount of dividends paid to each non-U.S. holder, the name and address of the recipient, and the amount, if any, of tax withheld with respect to those dividends. A similar report is sent to each non-U.S. holder. These information reporting requirements apply regardless of whether withholding was reduced or eliminated. This information also may be made available under a specific treaty or agreement with the tax authorities of the country in which the non-U.S. holder resides or is established. Payment of the proceeds of a sale of our common stock within the United States or through certain U.S. financial intermediaries is also subject to information reporting, and depending on the circumstances may be subject to backup withholding unless the non-U.S. holder, certifies that it is a non-U.S. holder or furnishes an IRS Form W-8.
Payments of dividends to a non-U.S. holder may be subject to backup withholding (at the applicable rate) unless the non-U.S. holder establishes an exemption, for example, by properly certifying its non-U.S. status on an IRS Form W-8BEN or Form W-8BEN-E (or other applicable form). Notwithstanding the foregoing, backup withholding may apply if either we or our paying agent has actual knowledge, or reason to know, that the beneficial owner is a U.S. person that is not an exempt recipient.
Backup withholding is not an additional tax. Any amounts withheld under the backup withholding rules may be claimed as a refund or a credit against a non-U.S. holder’s U.S. federal income tax liability, provided that the required information is timely furnished to the IRS. Non-U.S. holders should consult their own tax advisors regarding the application of backup withholding in their particular circumstances and the availability of, and procedures for, obtaining an exemption from backup withholding.
Additional Withholding Tax Relating to Foreign Accounts
Withholding at a rate of 30% will generally be required on dividends in respect of, and, after December 31, 2016, gross proceeds from the sale or other disposition of, our common stock held by or through certain foreign financial institutions (including investment funds) that do not qualify for an exemption from these rules, unless the institution either (i) enters into, and complies with, an agreement with the IRS to undertake certain diligence and to report, on an annual basis, information with respect to interests in, and accounts maintained by, the institution that are owned by certain U.S. persons and by certain non-U.S. entities that are wholly or partially owned by U.S. persons and to withhold 30% on certain payments, or (ii) if required under an intergovernmental agreement between the United States and an applicable foreign country, undertakes such diligence and reports such information to its local tax authority, which will exchange such information with the U.S. authorities. An intergovernmental agreement between the United States and an applicable foreign country, or future United States Treasury regulations, may modify these requirements. Accordingly, the entity through which our common stock is held will affect the determination of whether such withholding is required. Similarly, dividends in respect of, and gross proceeds from the sale of, our common stock held by an investor that is a non-financial non-U.S. entity that does not qualify under certain exemptions will be subject to withholding at a rate of 30%, unless such entity either (i) certifies to us that such entity does not have any “substantial United States owners” or (ii) provides certain information regarding the entity’s “substantial United States owners,” which we will in turn provide to the IRS as required. We will not pay any additional amounts to holders in respect of any amounts withheld. Non-U.S. holders are encouraged to consult their tax advisors regarding the possible implications of these provisions on their investment in our common stock.
125
Table of Contents
Citigroup Global Markets Inc., Credit Suisse Securities (USA) LLC, RBC Capital Markets, LLC, Merrill Lynch, Pierce, Fenner & Smith Incorporated and UBS Securities LLC are acting as joint book-running managers of this offering and as representative of each of the underwriters named below. Subject to the terms and conditions set forth in an underwriting agreement among us, the selling stockholders and the representative, we and the selling stockholders have agreed to sell to the underwriters, and each of the underwriters has agreed, severally and not jointly, to purchase from us and the selling stockholders, the number of shares of common stock set forth opposite its name below.
| Underwriter |
Number of Shares | |
| Citigroup Global Markets Inc. |
||
| Credit Suisse Securities (USA) LLC |
||
| RBC Capital Markets, LLC |
||
| Merrill Lynch, Pierce, Fenner & Smith Incorporated |
||
| UBS Securities LLC |
||
| Scotia Capital (USA) Inc. |
||
| Stephens Inc. |
||
| Seaport Global Securities LLC |
||
|
| ||
| Total |
||
|
|
Subject to the terms and conditions set forth in the underwriting agreement, the underwriters have agreed, severally and not jointly, to purchase all of the shares sold under the underwriting agreement if any of these shares are purchased, other than the shares covered by the option described below unless and until this option is exercised.
We and the selling stockholders have agreed to indemnify the underwriters against certain liabilities, including liabilities under the Securities Act, and to contribute to payments the underwriters may be required to make for certain liabilities.
The underwriters are offering the shares, subject to prior sale, when, as and if issued to and accepted by them, subject to approval of legal matters by their counsel, including the validity of the shares, and other conditions contained in the underwriting agreement, such as the receipt by the underwriters of officer’s certificates and legal opinions. The underwriters reserve the right to withdraw, cancel or modify offers to the public and to reject orders in whole or in part.
The selling stockholders are “underwriters” within the meaning of the Securities Act and may be subject to certain statutory liabilities under the Securities Act.
Commissions and Discounts
The underwriters have advised us and the selling stockholders that they propose to offer the shares of common stock directly to the public at the public offering price set forth on the cover page of this prospectus and to dealers at the public offering price less a selling concession not in excess of $ per share. The underwriters also may allow, and dealers may reallow, a concession not in excess of $ per share to brokers and dealers. After the offering, the underwriters may change the offering price and the other selling terms.
126
Table of Contents
The following table shows the public offering price, underwriting discount and proceeds before expenses to us and the proceeds to the selling stockholders. The information assumes either no exercise or full exercise by the underwriters of their option to purchase additional shares.
| Per Share |
Without Over-allotment Exercise |
With Over-allotment Exercise | ||||
| Public offering price |
||||||
| Underwriting discount paid by us |
||||||
| Underwriting discount paid by selling stockholders |
||||||
| Proceeds, before expenses, to us |
||||||
| Proceeds to selling stockholders |
In addition to the underwriting discounts and commissions to be paid by us, we have agreed to reimburse the underwriters for certain of their out-of-pocket expenses incurred in connection with this offering, including travel, legal, document production and distribution and database and research expenses and the reasonable fees and disbursements of underwriters’ independent counsel, which we estimate to be approximately $ million. We estimate that the total expenses of the offering payable by us, including compensation paid to the underwriters other than underwriting discounts and commissions, will be approximately $ million.
Option to Purchase Additional Shares
We have granted to the underwriters an option to purchase up to an aggregate of additional shares of common stock at the public offering price less the underwriting discount. The underwriters may exercise this option solely for the purpose of covering over-allotments, if any, made in connection with the offering of the shares of common stock offered by this prospectus. The underwriters may exercise that option for 30 days. If any shares are purchased pursuant to this option, the underwriters will severally purchase shares in approximately the same proportion as set forth in the table above.
Lock-Up Agreements
We, each of our executive officers and directors and certain of our existing stockholders (including the selling stockholders) have agreed not to do, or publicly announce an intention to do, any of the following, directly or indirectly, for 180 days after the date of this prospectus without the prior written consent of Citigroup Global Markets Inc.:
| • | offer, sell, contract to sell, pledge or otherwise dispose of, or enter into any transaction which is designed to or might reasonably be expected to result in the disposition of, shares of our common stock or any securities convertible into, exercisable or exchangeable for shares of our common stock (regardless whether the transaction is settled in securities, cash or otherwise); |
| • | file or participate in the filing of a registration statement with the SEC in respect of shares of our common stock or any securities convertible into, exercisable or exchangeable for shares of our common stock; or |
| • | establish or increase a put equivalent position or liquidate or decrease a call equivalent position within the meaning of Section 16 of the Exchange Act in respect of shares of our common stock or any securities convertible into, exercisable or exchangeable for shares of our common stock |
The restrictions described above do not apply to (1) the issuance of common stock by us to the underwriters pursuant to this offering, (2) the issuance of restricted stock by us in the ordinary course of business pursuant to our 2012 Stock Incentive Plan, (3) the issuance of shares of common stock by us upon the exercise of certain outstanding options, (4) bona fide gifts, other than by us, or transfers by will or intestacy, (5) transfers, other than by us, to any trust for the direct or indirect benefit of the stockholder or the immediate family of the stockholder and (6) transfers, other than by us, to limited partners or stockholders of the stockholder. In the case of (3), (4), (5) and (6) above, (a) the transferee must deliver a signed lock-up agreement for the balance of the 180-day
127
Table of Contents
period, (b) the transfer must not involve a disposition for value, (c) the transfer must not be publicly reportable under any law and (d) the stockholder must not otherwise voluntarily effect any public filing, report or announcement regarding such transfer.
If (1) during the last 17 days of the 180-day period, we issue an earnings release or material news or a material event relating to us occurs or (2) prior to the expiration of the 180-day period, we announce that we will release earnings results or become aware that material news or a material event will occur during the 16-day period beginning on the last day of the 180-day period, then the restrictions above will continue to apply until the expiration of the 18-day period beginning on the date of the issuance of the earnings release or the occurrence of the material news or material event, as the case may be, unless Citigroup Global Markets Inc. waives, in writing, such extension.
Additionally, the terms of the convertible notes provide that, for 180 days after the pricing date of this offering, each holder of convertible notes will not:
| • | directly or indirectly sell or offer to sell any shares of common stock issued upon conversion of the common stock or related securities (other than, shares offered hereby) either beneficially owned or owned of record; |
| • | enter into any swap, hedge or similar arrangement or agreement that transfers, in whole or in part, the economic risk of ownership of such shares of common stock or related securities, regardless of whether any such transaction is to be settled in securities, in cash or otherwise; or |
| • | publicly announce any intention to do any of the foregoing. |
New York Stock Exchange Listing
We have applied to list our common stock on the New York Stock Exchange under the symbol “ENXP.” In order to meet the requirements for listing on that exchange, the underwriters have undertaken to sell a minimum number of shares to a minimum number of beneficial owners as required by that exchange.
Prior to this offering, there has been no public market for our common stock. The initial public offering price is determined by negotiations between us and the representative. Among the factors to be considered in determining the initial public offering price will be the information set forth in this prospectus; our history, present state of development and future prospects; an assessment of our management, its past and present operations and the prospects for and timing of future revenues; the history of and future prospects for our industry in general; our sales, earnings and certain other financial and operating information in recent periods; and the price-earnings ratios, price-sales ratios, market prices of securities, valuation multiples and certain financial and operating information of companies engaged in activities similar to ours.
An active trading market for the shares may not develop. It is also possible that after the offering the shares will not trade in the public market at or above the initial public offering price.
Price Stabilization, Short Positions and Penalty Bids
Until the distribution of the shares is completed, SEC rules may limit underwriters and selling group members from bidding for and purchasing our common stock. However, the representative may engage in transactions that stabilize the price of the common stock, such as bids or purchases to peg, fix or maintain that price.
In connection with the offering, the underwriters may purchase and sell our common stock in the open market. These transactions may include over-allotment and stabilizing transactions, passive market making and purchases to cover syndicate short positions created in connection with this offering. Short sales involve the sale
128
Table of Contents
by the underwriters of a greater number of shares than they are required to purchase in the offering. “Covered” short sales are sales made in an amount not greater than the underwriters’ option to purchase additional shares described above. The underwriters may close out any covered short position by either exercising their option to purchase additional shares or purchasing shares in the open market. In determining the source of shares to close out the covered short position, the underwriters will consider, among other things, the price of shares available for purchase in the open market as compared to the price at which they may purchase shares through the option to purchase additional shares. “Naked” short sales are sales in excess of the option to purchase additional shares. The underwriters must close out any naked short position by purchasing shares in the open market. A naked short position is more likely to be created if the underwriters are concerned that there may be downward pressure on the price of our common stock in the open market after pricing that could adversely affect investors who purchase in the offering. Stabilizing transactions consist of various bids for or purchases of shares of common stock made by the underwriters in the open market prior to the completion of the offering.
The underwriters also may impose a penalty bid, whereby the underwriters may reclaim selling concessions allowed to syndicate members or other broker-dealers in respect of the common stock sold in the offering for their account if the underwriters repurchase the shares in stabilizing or covering transactions.
These activities may stabilize, maintain or otherwise affect the market price of the common stock, which may be higher than the price that might otherwise prevail in the open market. The underwriters may conduct these transactions on the New York Stock Exchange, in the over-the-counter market or otherwise.
Neither we nor any of the underwriters make any representation or prediction as to the direction or magnitude of any effect that the transactions described above may have on the price of our common stock. In addition, neither we nor any of the underwriters make any representation that the representative will engage in these transactions or that these transactions, once commenced, will not be discontinued without notice.
Electronic Distribution
In connection with the offering, certain of the underwriters or securities dealers may distribute prospectuses by electronic means, such as e-mail.
Other Relationships
The underwriters and their respective affiliates are full service financial institutions engaged in various activities, which may include securities trading, commercial and investment banking, financial advisory, investment management, investment research, principal investment, hedging, financing and brokerage activities. Certain of the underwriters and their respective affiliates have, from time to time, performed, and may in the future perform, various financial advisory and investment banking services for us, for which they received or will receive customary fees and expenses. Citigroup Global Markets Inc., Credit Suisse Securities (USA) LLC and Global Hunter Securities, LLC/Seaport Global Securities LLC acted as joint book-running managers and initial purchasers in the offering of our convertible notes and as joint book-runners and joint lead arrangers for our senior secured term loan. Additionally, an affiliate of Credit Suisse Securities (USA) LLC is the administrative agent and collateral agent and a lender under our senior secured term loan.
In the ordinary course of their various business activities, the underwriters and their respective affiliates may make or hold a broad array of investments and actively trade debt and equity securities (or related derivative securities) and financial instruments (including bank loans) for their own account and for the accounts of their customers, and such investment and securities activities may involve our securities and/or instruments. The underwriters and their respective affiliates may also make investment recommendations and/or publish or express independent research views in respect of such securities or instruments and may at any time hold, or recommend to clients that they acquire, long and/or short positions in such securities and instruments.
129
Table of Contents
Notice to Prospective Investors in the European Economic Area
In relation to each Member State of the European Economic Area which has implemented the Prospectus Directive (each, a “Relevant Member State”), with effect from and including the date on which the Prospectus Directive is implemented in that Relevant Member State (the “Relevant Implementation Date”), no offer of shares may be made to the public in that Relevant Member State other than:
| A. | to any legal entity which is a qualified investor as defined in the Prospectus Directive; |
| B. | to fewer than 100 or, if the Relevant Member State has implemented the relevant provision of the 2010 PD Amending Directive, 150, natural or legal persons (other than qualified investors as defined in the Prospectus Directive), as permitted under the Prospectus Directive, subject to obtaining the prior consent of the representative; or |
| C. | in any other circumstances falling within Article 3(2) of the Prospectus Directive, provided that no such offer of shares shall require us or the representative to publish a prospectus pursuant to Article 3 of the Prospectus Directive or supplement a prospectus pursuant to Article 16 of the Prospectus Directive. |
Each person in a Relevant Member State (other than a Relevant Member State where there is a Permitted Public Offer) who initially acquires any shares or to whom any offer is made will be deemed to have represented, acknowledged and agreed that (A) it is a “qualified investor” within the meaning of the law in that Relevant Member State implementing Article 2(1)(e) of the Prospectus Directive, and (B) in the case of any shares acquired by it as a financial intermediary, as that term is used in Article 3(2) of the Prospectus Directive, the shares acquired by it in the offering have not been acquired on behalf of, nor have they been acquired with a view to their offer or resale to, persons in any Relevant Member State other than “qualified investors” as defined in the Prospectus Directive, or in circumstances in which the prior consent of the Subscribers has been given to the offer or resale. In the case of any shares being offered to a financial intermediary as that term is used in Article 3(2) of the Prospectus Directive, each such financial intermediary will be deemed to have represented, acknowledged and agreed that the shares acquired by it in the offer have not been acquired on a non-discretionary basis on behalf of, nor have they been acquired with a view to their offer or resale to, persons in circumstances which may give rise to an offer of any shares to the public other than their offer or resale in a Relevant Member State to qualified investors as so defined or in circumstances in which the prior consent of the representative has been obtained to each such proposed offer or resale.
We, the representative and its affiliates will rely upon the truth and accuracy of the foregoing representation, acknowledgement and agreement.
This prospectus has been prepared on the basis that any offer of shares in any Relevant Member State will be made pursuant to an exemption under the Prospectus Directive from the requirement to publish a prospectus for offers of shares. Accordingly any person making or intending to make an offer in that Relevant Member State of shares which are the subject of the offering contemplated in this prospectus may only do so in circumstances in which no obligation arises for us or any of the underwriters to publish a prospectus pursuant to Article 3 of the Prospectus Directive in relation to such offer. Neither we nor the underwriters have authorized, nor do they authorize, the making of any offer of shares in circumstances in which an obligation arises for us or the underwriters to publish a prospectus for such offer.
For the purpose of the above provisions, the expression “an offer to the public” in relation to any shares in any Relevant Member State means the communication in any form and by any means of sufficient information on the terms of the offer and the shares to be offered so as to enable an investor to decide to purchase or subscribe the shares, as the same may be varied in the Relevant Member State by any measure implementing the Prospectus Directive in the Relevant Member State and the expression “Prospectus Directive” means Directive 2003/71/EC (including the 2010 PD Amending Directive, to the extent implemented in the Relevant Member States) and includes any relevant implementing measure in the Relevant Member State and the expression “2010 PD Amending Directive” means Directive 2010/73/EU.
130
Table of Contents
Notice to Prospective Investors in the United Kingdom
In addition, in the United Kingdom, this document is being distributed only to, and is directed only at, and any offer subsequently made may only be directed at persons who are “qualified investors” (as defined in the Prospectus Directive) (i) who have professional experience in matters relating to investments falling within Article 19 (5) of the Financial Services and Markets Act 2000 (Financial Promotion) Order 2005, as amended (the “Order”) and/or (ii) who are high net worth companies (or persons to whom it may otherwise be lawfully communicated) falling within Article 49(2)(a) to (d) of the Order (all such persons together being referred to as “relevant persons”). This document must not be acted on or relied on in the United Kingdom by persons who are not relevant persons. In the United Kingdom, any investment or investment activity to which this document relates is only available to, and will be engaged in with, relevant persons.
Notice to Prospective Investors in Switzerland
The shares may not be publicly offered in Switzerland and will not be listed on the SIX Swiss Exchange (“SIX”) or on any other stock exchange or regulated trading facility in Switzerland. This document has been prepared without regard to the disclosure standards for issuance prospectuses under art. 652a or art. 1156 of the Swiss Code of Obligations or the disclosure standards for listing prospectuses under art. 27 ff. of the SIX Listing
Rules or the listing rules of any other stock exchange or regulated trading facility in Switzerland. Neither this document nor any other offering or marketing material relating to the shares or the offering may be publicly distributed or otherwise made publicly available in Switzerland.
Neither this document nor any other offering or marketing material relating to the offering, us, the shares have been or will be filed with or approved by any Swiss regulatory authority. In particular, this document will not be filed with, and the offer of shares will not be supervised by, the Swiss Financial Market Supervisory Authority FINMA (“FINMA”), and the offer of shares has not been and will not be authorized under the Swiss Federal Act on Collective Investment Schemes (“CISA”). The investor protection afforded to acquirers of interests in collective investment schemes under the CISA does not extend to acquirers of shares.
Notice to Prospective Investors in the Dubai International Financial Centre
This prospectus supplement relates to an Exempt Offer in accordance with the Offered Securities Rules of the Dubai Financial Services Authority (“DFSA”). This prospectus supplement is intended for distribution only to persons of a type specified in the Offered Securities Rules of the DFSA. It must not be delivered to, or relied on by, any other person. The DFSA has no responsibility for reviewing or verifying any documents in connection with Exempt Offers. The DFSA has not approved this prospectus supplement nor taken steps to verify the information set forth herein and has no responsibility for the prospectus supplement. The shares to which this prospectus supplement relates may be illiquid and/or subject to restrictions on their resale. Prospective purchasers of the shares offered should conduct their own due diligence on the shares. If you do not understand the contents of this prospectus supplement you should consult an authorized financial advisor.
Notice to Prospective Investors in Hong Kong, Singapore, and Japan
The shares may not be offered or sold by means of any document other than (i) in circumstances which do not constitute an offer to the public within the meaning of the Companies Ordinance (Cap.32, Laws of Hong Kong), or (ii) to “professional investors” within the meaning of the Securities and Futures Ordinance (Cap.571, Laws of Hong Kong) and any rules made thereunder, or (iii) in other circumstances which do not result in the document being a “prospectus” within the meaning of the Companies Ordinance (Cap.32, Laws of Hong Kong), and no advertisement, invitation or document relating to the shares may be issued or may be in the possession of any person for the purpose of issue (in each case whether in Hong Kong or elsewhere), which is directed at, or the contents of which are likely to be accessed or read by, the public in Hong Kong (except if permitted to do so
131
Table of Contents
under the laws of Hong Kong) other than with respect to shares which are or are intended to be disposed of only to persons outside Hong Kong or only to “professional investors” within the meaning of the Securities and Futures Ordinance (Cap. 571, Laws of Hong Kong) and any rules made thereunder.
This prospectus has not been registered as a prospectus with the Monetary Authority of Singapore. Accordingly, this prospectus and any other document or material in connection with the offer or sale, or invitation for subscription or purchase, of the shares may not be circulated or distributed, nor may the shares be offered or sold, or be made the subject of an invitation for subscription or purchase, whether directly or indirectly, to persons in Singapore other than (i) to an institutional investor under Section 274 of the Securities and Futures Act, Chapter 289 of Singapore (the “SFA”), (ii) to a relevant person, or any person pursuant to Section 275(1A), and in accordance with the conditions, specified in Section 275 of the SFA or (iii) otherwise pursuant to, and in accordance with the conditions of, any other applicable provision of the SFA.
Where the shares are subscribed or purchased under Section 275 by a relevant person which is: (a) a corporation (which is not an accredited investor) the sole business of which is to hold investments and the entire share capital of which is owned by one or more individuals, each of whom is an accredited investor; or (b) a trust (where the trustee is not an accredited investor) whose sole purpose is to hold investments and each beneficiary is an accredited investor, shares, debentures and units of shares and debentures of that corporation or the beneficiaries’ rights and interest in that trust shall not be transferable for 6 months after that corporation or that trust has acquired the shares under Section 275 except: (1) to an institutional investor under Section 274 of the SFA or to a relevant person, or any person pursuant to Section 275(1A), and in accordance with the conditions, specified in Section 275 of the SFA; (2) where no consideration is given for the transfer; or (3) by operation of law.
The securities have not been and will not be registered under the Financial Instruments and Exchange Law of Japan (the Financial Instruments and Exchange Law) and each underwriter has agreed that it will not offer or sell any securities, directly or indirectly, in Japan or to, or for the benefit of, any resident of Japan (which term as used herein means any person resident in Japan, including any corporation or other entity organized under the laws of Japan), or to others for re-offering or resale, directly or indirectly, in Japan or to a resident of Japan, except pursuant to an exemption from the registration requirements of, and otherwise in compliance with, the Financial Instruments and Exchange Law and any other applicable laws, regulations and ministerial guidelines of Japan.
132
Table of Contents
The validity of the shares of common stock offered by this prospectus will be passed upon for Energy & Exploration Partners, Inc. by Bracewell & Giuliani LLP, Houston, Texas. Certain legal matters in connection with this offering will be passed upon for the underwriters by Mayer Brown LLP, Houston, Texas.
The consolidated financial statements of Energy & Exploration Partners, Inc. as of December 31, 2014 and December 31, 2013 and for the years ended December 31, 2014, December 31, 2013 and December 31, 2012 included in this prospectus and the related registration statement have been audited by Hein & Associates LLP, an independent registered public accounting firm, as stated in their report appearing elsewhere herein, and are included in reliance upon such report and upon the authority of such firm as experts in auditing and accounting.
The consolidated financial statements of TreadStone Energy Partners, LLC as of December 31, 2013 and December 31, 2012 and for the years ended December 31, 2013 and December 31, 2012 included in this prospectus and the related registration statement have been audited by LaPorte, A Professional Accounting Corporation, an independent registered public accounting firm, as stated in their report appearing elsewhere herein, and are included in reliance upon such report and upon the authority of such firm as experts in auditing and accounting.
The information included in this prospectus regarding our estimated quantities of reserves of oil and natural gas, the future net revenues from those reserves and their present value as of December 31, 2014, December 31, 2013 and December 31, 2012 is based on reports prepared by Cawley, Gillespie & Associates, Inc., independent reserve engineers, which reports are included as exhibits to the registration statement of which this prospectus is a part. These estimates are included in this prospectus in reliance upon the authority of such firm as experts in these matters.
WHERE YOU CAN FIND MORE INFORMATION
We have filed with the SEC a registration statement on Form S-1 (including the exhibits, schedules and amendments thereto) under the Securities Act, with respect to the shares of our common stock offered hereby. This prospectus does not contain all of the information set forth in the registration statement and the exhibits and schedules thereto. For further information with respect to us and the common stock offered hereby, we refer you to the registration statement and the exhibits and schedules filed therewith. Statements contained in this prospectus as to the contents of any contract, agreement or any other document are summaries of the material terms of this contract, agreement or other document. With respect to each of these contracts, agreements or other documents filed as an exhibit to the registration statement, reference is made to the exhibits for a more complete description of the matter involved. A copy of the registration statement, and the exhibits and schedules thereto, may be inspected without charge at the public reference facilities maintained by the SEC at 100 F Street NE, Washington, D.C. 20549. Copies of these materials may be obtained, upon payment of a duplicating fee, from the Public Reference Section of the SEC at 100 F Street NE, Washington, D.C. 20549. Please call the SEC at 1-800-SEC-0330 for further information on the operation of the public reference facility. The SEC maintains a website that contains reports, proxy and information statements and other information regarding registrants that file electronically with the SEC. The address of the SEC’s website is http://www.sec.gov.
After we have completed this offering, we will file annual, quarterly and current reports, proxy statements and other information with the SEC. After completion of this offering, we expect our website to be located at http://www.enxp.com, and we expect to make our periodic reports and other information filed with or furnished to the SEC available, free of charge, through our website, as soon as reasonably practicable after those reports and other information are electronically filed with or furnished to the SEC. Information on our website or any
133
Table of Contents
other website is not incorporated by reference into this prospectus and does not constitute a part of this prospectus. You may read and copy any reports, statements or other information on file at the public reference rooms. You can also request copies of these documents, for a copying fee, by writing to the SEC, or you can review these documents on the SEC’s website, as described above. In addition, we will provide electronic or paper copies of our filings free of charge upon request.
134
Table of Contents
| Page | ||||
| Energy & Exploration Partners, Inc. |
||||
| Unaudited Pro Forma Combined and Consolidated Financial Statements: |
||||
| F-2 | ||||
| Unaudited Pro Forma Combined and Consolidated Balance Sheet as of December 31, 2014 |
F-4 | |||
| F-5 | ||||
| Notes to Unaudited Pro Forma Combined and Consolidated Financial Statements |
F-6 | |||
| Consolidated Financial Statements as of December 31, 2014 and 2013 and for the years ended December 31, 2014, 2013 and 2012: |
||||
| Report of Independent Registered Public Accountants |
F-7 | |||
| F-8 | ||||
| F-9 | ||||
| F-10 | ||||
| F-11 | ||||
| F-12 | ||||
| TreadStone Energy Partners, LLC |
||||
| Unaudited Financial Statements as of June 30, 2014 and for the six months ended June 30, 2014 and 2013 |
||||
| F-66 | ||||
| F-67 | ||||
| F-68 | ||||
| F-69 | ||||
| F-70 | ||||
| Financial Statements as of December 31, 2013 and 2012 and for the years ended December 31, 2013, and 2012 |
||||
| F-79 | ||||
| F-81 | ||||
| F-82 | ||||
| F-83 | ||||
| F-84 | ||||
| F-85 | ||||
F-1
Table of Contents
ENERGY & EXPLORATION PARTNERS, INC.
NOTES TO UNAUDITED PRO FORMA COMBINED AND CONSOLIDATED FINANCIAL STATEMENTS
Introduction
The unaudited pro forma combined and consolidated balance sheet and statement of operations as of December 31, 2014, and for the year ended December 31, 2014 give effect to certain of the transactions described below as if they had occurred on December 31, 2014 in the case of the unaudited pro forma combined and consolidated balance sheet and all of the transactions described below as if they had occurred on January 1, 2014 in the case of the unaudited pro forma combined and consolidated statements of operations.
The unaudited pro forma consolidated balance sheet reflects the following significant assumptions and transactions:
| • | the conversion of the Company’s $375.0 million principal amount of 8% convertible subordinated notes due in 2019 (the “Notes”), including the derivative embedded features, into shares of the Company’s common stock upon completion of this offering, assuming an initial offering price of $ per share and that conversion rights are exercised with respect to all of the convertible notes; and |
| • | the automatic conversion of the outstanding warrants into shares of the Company’s common stock upon completion of this offering. |
The unaudited pro forma consolidated statements of operations reflect the following significant assumptions and transactions:
| • | the acquisition of oil and gas leasehold and producing oil and natural gas wells (the “Ft. Trinidad acquisition”) from TreadStone Energy Partners, LLC (“TreadStone”) for a purchase price of $700.1 million net of post-closing adjustments as of December 31, 2014, and the assumption of certain current assets and liabilities; |
| • | the issuance of a $775.0 million senior secured term loan due 2019; |
| • | the issuance of $375.0 million principal amount of 8% convertible subordinated notes due in 2019 (the “Notes”), including the derivative embedded features; |
| • | the conversion of the Notes into shares of the Company’s common stock upon completion of this offering, assuming an initial offering price of $ per share and that conversion rights are exercised with respect to all of the convertible notes; |
| • | the extinguishment of the Company’s outstanding senior unsecured notes; and |
| • | the automatic conversion of the outstanding warrants into shares of the Company’s common stock upon completion of this offering. |
The unaudited pro forma combined and consolidated statement of operations include the historical consolidated statements of operations of Energy & Exploration Partners, Inc (“ENXP” or the “Company”) and TreadStone giving effect to the transactions described above. Certain historical statement of operations amounts of TreadStone have been reclassified to conform to the financial statement presentation of ENXP. Nonrecurring transactions of $75.5 million of loss on the extinguishment of debt related to the retirement of the Company’s outstanding senior unsecured notes, including a prepayment penalty of $52.6 million, and $ million of loss on extinguishment of debt related to the conversion of the outstanding Notes into shares of the Company’s common stock, have been excluded from the unaudited pro forma combined and consolidated statement of operations.
F-2
Table of Contents
The unaudited pro forma combined and consolidated financial statements are presented for illustrative purposes only and are not necessarily indicative of the consolidated financial position or consolidated results of operations of the Company that would have been reported had the transactions occurred on the dates indicated, nor do they represent a forecast of the consolidated financial position or consolidated results of operations of the Company at any future date.
The unaudited pro forma combined and consolidated financial statements, including the notes thereto, should be read in conjunction with (a) the historical consolidated financial statements, including the notes thereto, and other information of the Company as of and for the year ended December 31, 2014 included elsewhere in this prospectus, and (b) the historical financial statements of TreadStone as of and for the six months ended June 30, 2014 included elsewhere in this prospectus.
See the accompanying notes to these unaudited pro forma combined and consolidated financial statements.
F-3
Table of Contents
ENERGY & EXPLORATION PARTNERS, INC
UNAUDITED PRO FORMA COMBINED AND CONSOLIDATED
BALANCE SHEET
AS OF DECEMBER 31, 2014
(In thousands)
| ENXP Historical |
Debt and Warrant Conversion at IPO(a) |
As Adjusted |
||||||||||
| ASSETS | ||||||||||||
| Current assets: |
||||||||||||
| Cash and cash equivalents |
62,014 | — | 62,014 | |||||||||
| Accounts receivable-oil and natural gas sales |
22,263 | — | 22,263 | |||||||||
| Accounts receivable-other |
6,443 | — | 6,443 | |||||||||
| Prepaid expenses |
673 | — | 673 | |||||||||
| Derivative asset |
42,228 | — | 42,228 | |||||||||
|
|
|
|
|
|
|
|||||||
| Total current assets |
133,621 | — | 133,621 | |||||||||
|
|
|
|
|
|
|
|||||||
| Property, plant, and equipment: |
||||||||||||
| Unproved oil and natural gas properties |
80,937 | — | 80,937 | |||||||||
| Proved oil and natural gas properties |
1,100,203 | — | 1,100,203 | |||||||||
| Other property and equipment |
2,262 | — | 2,262 | |||||||||
| Less: Accumulated depreciation, depletion, and amortization |
(85,670 | ) | — | (85,670 | ) | |||||||
|
|
|
|
|
|
|
|||||||
| Net property, plant, and equipment |
1,097,732 | — | 1,097,732 | |||||||||
|
|
|
|
|
|
|
|||||||
| Long-term assets: |
||||||||||||
| Debt issuance costs, net of amortization |
36,093 | (21,456 | ) | 14,637 | ||||||||
| Long-term deposits |
461 | — | 461 | |||||||||
| Deferred tax assets |
15,131 | — | 15,131 | |||||||||
| Derivative asset |
20,873 | — | 20,873 | |||||||||
| Other long-term assets |
4,085 | — | 4,085 | |||||||||
|
|
|
|
|
|
|
|||||||
| Total long-term assets . |
76,643 | (21,456 | ) | 55,187 | ||||||||
|
|
|
|
|
|
|
|||||||
| TOTAL ASSETS |
1,307,996 | (21,456 | ) | 1,286,540 | ||||||||
|
|
|
|
|
|
|
|||||||
| LIABILITIES AND STOCKHOLDERS’ EQUITY | ||||||||||||
| Current liabilities: |
||||||||||||
| Accounts payable |
51,355 | — | 51,355 | |||||||||
| Accrued and other liabilities |
50,606 | — | 50,606 | |||||||||
| Accrued interest |
13,416 | — | 13,416 | |||||||||
| Asset retirement obligations |
248 | — | 248 | |||||||||
| Current income tax liabilities |
493 | — | 493 | |||||||||
| Current notes payable |
7,750 | — | 7,750 | |||||||||
| Deferred tax liabilities |
15,131 | — | 15,131 | |||||||||
| Other current liabilites |
60 | — | 60 | |||||||||
|
|
|
|
|
|
|
|||||||
| Total current liabilities |
139,059 | — | 139,059 | |||||||||
|
|
|
|
|
|
|
|||||||
| Long-term liabilities: |
||||||||||||
| Asset retirement obligations |
4,892 | — | 4,892 | |||||||||
| Derivative liability |
36,697 | (36,697 | ) | — | ||||||||
| Notes payable, net of discount |
1,097,988 | (323,772 | ) | 774,216 | ||||||||
| Other non-current liabilities |
159 | — | 159 | |||||||||
|
|
|
|
|
|
|
|||||||
| Total long-term liabilities |
1,139,736 | (360,469 | ) | 779,267 | ||||||||
|
|
|
|
|
|
|
|||||||
| Commitments and contingencies |
||||||||||||
| Stockholders’ equity: |
||||||||||||
| Preferred stock |
— | — | — | |||||||||
| Common stock |
5 | |||||||||||
| Additional paid-in capital |
47,752 | |||||||||||
| Accumulated earnings (deficit) |
(18,556 | ) | ||||||||||
|
|
|
|
|
|
|
|||||||
| Total stockholders’ equity |
29,201 | |||||||||||
|
|
|
|
|
|
|
|||||||
| TOTAL LIABILITIES AND STOCKHOLDERS’ EQUITY |
1,307,996 | |||||||||||
|
|
|
|
|
|
|
|||||||
See the accompanying notes to these unaudited pro forma combined and consolidated financial statements.
F-4
Table of Contents
ENERGY & EXPLORATION PARTNERS, INC.
UNAUDITED PRO FORMA COMBINED AND CONSOLIDATED
STATEMENT OF OPERATIONS
YEAR ENDED DECEMBER 31, 2014
(In thousands, except share and per share amounts)
| ENXP Historical |
Treadstone Historical |
Acquisition Adjustments |
Debt Issuance Adjustments |
Adjusted Balance |
||||||||||||||||||||||||||||
| Revenues: |
||||||||||||||||||||||||||||||||
| Oil and natural gas sales |
145,381 | 117,437 | (980 | ) | (b | ) | — | 261,838 | ||||||||||||||||||||||||
| Realized losses on commodity hedging instruments |
— | (10,634 | ) | 10,634 | (c | ) | — | — | ||||||||||||||||||||||||
| Unrealized losses on commodity hedging instruments |
— | 3,444 | (3,444 | ) | (c | ) | — | — | ||||||||||||||||||||||||
| Other revenue |
— | 904 | (904 | ) | (c | ) | — | — | ||||||||||||||||||||||||
|
|
|
|
|
|
|
|
|
|
|
|||||||||||||||||||||||
| Total revenue |
145,381 | 111,151 | 5,306 | — | 261,838 | |||||||||||||||||||||||||||
| Operating expenses: |
||||||||||||||||||||||||||||||||
| Lease operating expense |
26,713 | 11,604 | (1,316 | ) | (b | )(c) | — | 37,001 | ||||||||||||||||||||||||
| Production taxes |
7,009 | 5,666 | (38 | ) | (b | ) | — | 12,637 | ||||||||||||||||||||||||
| General and administrative expense |
19,278 | 2,553 | (191 | ) | (c | ) | — | 21,640 | ||||||||||||||||||||||||
| Depreciation, depletion and |
66,237 | 20,983 | 10,069 | (d | ) | — | 97,289 | |||||||||||||||||||||||||
|
|
|
|
|
|
|
|
|
|
|
|||||||||||||||||||||||
| Total operating expenses |
119,237 | 40,806 | 8,524 | — | 168,567 | |||||||||||||||||||||||||||
|
|
|
|
|
|
|
|
|
|
|
|||||||||||||||||||||||
| Income (loss) from operations: |
26,144 | 70,345 | (3,218 | ) | — | 93,271 | ||||||||||||||||||||||||||
| Other income (expense): |
||||||||||||||||||||||||||||||||
| Interest and other income |
147 | — | — | — | 147 | |||||||||||||||||||||||||||
| Loss on early extinguishment of debt |
(75,517 | ) | — | — | 75,517 | (f | ) | — | ||||||||||||||||||||||||
| Interest expense |
(78,386 | ) | (359 | ) | 359 | (g | ) | 21,982 | (h | ) | (56,404 | ) | ||||||||||||||||||||
| Gain (loss) on derivatives |
106,196 | — | (7,190 | ) | (c | ) | (37,994 | ) | (e | ) | 61,012 | |||||||||||||||||||||
| Gain on sales of assets |
14,249 | — | — | — | 14,249 | |||||||||||||||||||||||||||
|
|
|
|
|
|
|
|
|
|
|
|||||||||||||||||||||||
| Total other income (expense) |
(33,311 | ) | (359 | ) | (6,831 | ) | 59,505 | 19,004 | ||||||||||||||||||||||||
|
|
|
|
|
|
|
|
|
|
|
|||||||||||||||||||||||
| Income (loss) before income tax benefit (expense) |
(7,167 | ) | 69,986 | (10,049 | ) | 59,505 | 112,275 | |||||||||||||||||||||||||
| Income tax benefit (expense) |
980 | — | 3,582 | (i | ) | (21,214 | ) | (i | ) | (16,652 | ) | |||||||||||||||||||||
|
|
|
|
|
|
|
|
|
|
|
|||||||||||||||||||||||
| Net income (loss) |
(6,187 | ) | 69,986 | (6,467 | ) | 38,291 | 95,623 | |||||||||||||||||||||||||
|
|
|
|
|
|
|
|
|
|
|
|||||||||||||||||||||||
| Income (loss) per share of common stock |
||||||||||||||||||||||||||||||||
| Basic |
$ | (12.09 | ) | $ | (a | ) | ||||||||||||||||||||||||||
| Diluted |
$ | (12.09 | ) | $ | (a | ) | ||||||||||||||||||||||||||
| Weighted—average common shares outstanding |
||||||||||||||||||||||||||||||||
| Basic |
511,796 | (a | ) | |||||||||||||||||||||||||||||
| Diluted |
511,796 | (a | ) | |||||||||||||||||||||||||||||
See the accompanying notes to these unaudited pro forma combined and consolidated financial statements.
F-5
Table of Contents
ENERGY & EXPLORATION PARTNERS, INC.
UNAUDITED PRO FORMA COMBINED AND CONSOLIDATED FINANCIAL STATEMENTS
Notes to Unaudited Pro Forma Combined and Consolidated Financial Statements
| a. | Adjustments to reflect the conversion of the outstanding Notes into shares of the Company’s common stock upon completion of this offering, assuming an initial public offering price of $ per share and that conversion rights are exercised with respect to all of the outstanding Notes. The Company expects that conversion rights will be exercised with respect to all of the Notes because it has the option to redeem any Notes not converted at a redemption price equal to 100% of the principal amount of the Notes redeemed, plus accrued interest. |
Adjustments to record the loss on extinguishment of Notes and derivative liability surrendered in exchange for common stock. The fair value of the common stock exchanged for the Notes and derivative liability exceeded the net carrying amount of the debt and derivative liability resulting in a $ million loss on conversion to common stock.
Adjustments to record the automatic conversion of the Company’s warrants into shares of common stock upon completion of this offering.
| b. | Eliminate revenues and expenses that were included in the historical results of operations for TreadStone related to properties not acquired by the Company. |
| c. | Reclassification to conform to the Company’s presentation. |
| d. | Adjustment to depreciation, depletion and amortization (“DD&A”) to recognize depletion on acquired assets and to adjust the Company’s historical DD&A to reflect the revised combined depletion rate under the full cost method of accounting. |
| e. | Adjustment to eliminate the gain on embedded derivative included in the historical results of operation of the Company due to the conversion of the Notes and derivative liability into shares of common stock. |
| f. | Eliminate non-recurring expenses related to the Company’s loss on extinguishment of debt. |
| g. | Eliminate interest expense included in the historical results of operations for TreadStone related to debt not assumed by the Company. |
| h. | Adjustment to interest expense to reflect the new financing, including borrowings under the senior secured term loan, amortization of discount and debt issuance costs using the effective interest method, the extinguishment of the Company’s previously outstanding senior unsecured notes and the conversion of the Notes into shares of the Company’s common stock. Since current LIBOR rates are below the 1% floor included in the senior secured term loan a 1/8th. percent change in market rates will not impact the Company’s net income. |
| i. | Adjustment to recognize income tax effect of the pro forma adjustments based on the Company’s 35.6% statutory rate. |
F-6
Table of Contents
REPORT OF INDEPENDENT REGISTERED PUBLIC ACCOUNTING FIRM
To the Board of Directors and Stockholders of:
Energy & Exploration Partners, Inc.
We have audited the accompanying consolidated balance sheets of Energy & Exploration Partners, Inc., as described in Note 2, (the “Company”) as of December 31, 2014 and 2013, and the related consolidated statements of operations, stockholders’ equity, and cash flows for each of the three years in the period ended December 31, 2014. These consolidated financial statements are the responsibility of the Company’s management. Our responsibility is to express an opinion on these consolidated financial statements based on our audits.
We conducted our audits in accordance with the standards of the Public Company Accounting Oversight Board (United States). Those standards require that we plan and perform the audit to obtain reasonable assurance about whether the consolidated financial statements are free of material misstatement. The Company is not required to have, nor were we engaged to perform, an audit of its internal control over financial reporting. Our audits included consideration of internal control over financial reporting as a basis for designing audit procedures that are appropriate in the circumstances, but not for the purpose of expressing an opinion on the effectiveness of the Company’s internal control over financial reporting. Accordingly, we express no such opinion. An audit also includes examining, on a test basis, evidence supporting the amounts and disclosures in the consolidated financial statements, assessing the accounting principles used and significant estimates made by management, as well as evaluating the overall financial statement presentation. We believe that our audits provide a reasonable basis for our opinion.
In our opinion, the consolidated financial statements referred to above present fairly, in all material respects, the financial position of Energy & Exploration Partners, Inc. as of December 31, 2014 and 2013, and the results of its operations and cash flows for each of the three years in the period ended December 31, 2014, in conformity with U.S. generally accepted accounting principles.
/s/ Hein & Associates LLP
Dallas, Texas
April 29, 2015
F-7
Table of Contents
ENERGY & EXPLORATION PARTNERS, INC.
CONSOLIDATED BALANCE SHEETS
(In thousands, except par value and share amounts)
| December 31, 2013 |
December 31, 2014 |
|||||||
| ASSETS | ||||||||
| Current assets: |
||||||||
| Cash and cash equivalents |
$ | 3,569 | $ | 62,014 | ||||
| Accounts receivable-oil and natural gas sales |
4,816 | 22,263 | ||||||
| Accounts receivable-other |
— | 6,443 | ||||||
| Deferred tax assets |
271 | — | ||||||
| Prepaid expenses |
617 | 673 | ||||||
| Derivative asset . |
— | 42,228 | ||||||
|
|
|
|
|
|||||
| Total current assets |
9,273 | 133,621 | ||||||
|
|
|
|
|
|||||
| Property, plant, and equipment: |
||||||||
| Unproved oil and natural gas properties |
89,086 | 80,937 | ||||||
| Proved oil and natural gas properties |
158,955 | 1,100,203 | ||||||
| Other property and equipment |
979 | 2,262 | ||||||
| Less: Accumulated depreciation, depletion and amortization |
(19,763 | ) | (85,670 | ) | ||||
|
|
|
|
|
|||||
| Net property, plant, and equipment |
229,257 | 1,097,732 | ||||||
|
|
|
|
|
|||||
| Long-term assets: |
||||||||
| Debt issuance costs, net of amortization of $179 and $2,550, respectively |
1,782 | 36,093 | ||||||
| Long-term deposits |
87 | 461 | ||||||
| Deferred tax assets |
— | 15,131 | ||||||
| Derivative asset . |
— | 20,873 | ||||||
| Other long-term assets |
3,174 | 4,085 | ||||||
|
|
|
|
|
|||||
| Total long-term assets |
5,043 | 76,643 | ||||||
|
|
|
|
|
|||||
| TOTAL ASSETS |
$ | 243,573 | $ | 1,307,996 | ||||
|
|
|
|
|
|||||
| LIABILITIES AND STOCKHOLDERS’ EQUITY | ||||||||
| Current liabilities: |
||||||||
| Accounts payable |
$ | 29,319 | $ | 51,355 | ||||
| Accrued and other liabilities |
12,133 | 50,606 | ||||||
| Accrued interest |
58 | 13,416 | ||||||
| Derivative liabilities |
543 | — | ||||||
| Asset retirement obligations |
655 | 248 | ||||||
| Current income tax liabilities |
1,298 | 493 | ||||||
| Current notes payable |
— | 7,750 | ||||||
| Deferred tax liabilities |
— | 15,131 | ||||||
| Other current liabilities |
44 | 60 | ||||||
|
|
|
|
|
|||||
| Total current liabilities |
44,050 | 139,059 | ||||||
|
|
|
|
|
|||||
| Long-term liabilities: |
||||||||
| Asset retirement obligations |
637 | 4,892 | ||||||
| Deferred tax liabilities |
271 | — | ||||||
| Derivative liabilities |
14 | 36,697 | ||||||
| Notes payable, net of discount of $16,006 and $61,712, respectively |
168,336 | 1,097,988 | ||||||
| Other non-current liabilities |
— | 159 | ||||||
|
|
|
|
|
|||||
| Total long-term liabilities |
169,258 | 1,139,736 | ||||||
|
|
|
|
|
|||||
| Commitments and contingencies (Note 13) |
||||||||
| Stockholders’ equity: |
||||||||
| Preferred stock, $0.01 par value; 750,000 shares authorized; no shares issued or outstanding |
— | — | ||||||
| Common stock, $0.01 par value; 1,200,000 shares authorized; 510,530 and 515,609 shares issued and outstanding, respectively |
5 | 5 | ||||||
| Additional paid-in capital |
42,629 | 47,752 | ||||||
| Accumulated deficit |
(12,369 | ) | (18,556 | ) | ||||
|
|
|
|
|
|||||
| Total stockholders’ equity |
30,265 | 29,201 | ||||||
|
|
|
|
|
|||||
| TOTAL LIABILITIES AND STOCKHOLDERS’ EQUITY |
$ | 243,573 | $ | 1,307,996 | ||||
|
|
|
|
|
|||||
See accompanying notes to these consolidated financial statements.
F-8
Table of Contents
ENERGY & EXPLORATION PARTNERS, INC.
CONSOLIDATED STATEMENTS OF OPERATIONS
(In thousands, except share and per share amounts)
| Year Ended December 31, | ||||||||||||
| 2012 | 2013 | 2014 | ||||||||||
| Revenues: |
||||||||||||
| Oil and natural gas sales |
$ | 216 | $ | 16,437 | $ | 145,381 | ||||||
| Operating expenses: |
||||||||||||
| Lease operating expense |
11 | 3,215 | 26,713 | |||||||||
| Production taxes |
14 | 866 | 7,009 | |||||||||
| Full-cost ceiling impairment |
3,957 | 8,447 | — | |||||||||
| General and administrative expense |
10,538 | 16,888 | 19,278 | |||||||||
| Depreciation, depletion and amortization |
469 | 6,917 | 66,237 | |||||||||
|
|
|
|
|
|
|
|||||||
| Total operating expenses |
14,989 | 36,333 | 119,237 | |||||||||
|
|
|
|
|
|
|
|||||||
| Income (loss) from operations |
(14,773 | ) | (19,896 | ) | 26,144 | |||||||
| Other income (expense): |
||||||||||||
| Interest and other income. |
10 | 53 | 147 | |||||||||
| Loss on early extinguishment of debt |
(985 | ) | (3,677 | ) | (75,517 | ) | ||||||
| Interest expense |
(2,842 | ) | (17,211 | ) | (78,386 | ) | ||||||
| Gain (loss) on derivatives |
— | (662 | ) | 106,196 | ||||||||
| Gain on sales of assets |
34,738 | 14,275 | 14,249 | |||||||||
|
|
|
|
|
|
|
|||||||
| Total other income (expense), net |
30,921 | (7,222 | ) | (33,311 | ) | |||||||
|
|
|
|
|
|
|
|||||||
| Income (loss) before income tax benefit (expense) |
16,148 | (27,118 | ) | (7,167 | ) | |||||||
| Income tax benefit (expense) |
(7,414 | ) | 5,351 | 980 | ||||||||
|
|
|
|
|
|
|
|||||||
| Net income (loss) |
$ | 8,734 | $ | (21,767 | ) | $ | (6,187 | ) | ||||
|
|
|
|
|
|
|
|||||||
| Basic and dilutive: |
||||||||||||
| Net income (loss) attributable to common stock—Basic and diluted |
$ | 20.12 | $ | (43.12 | ) | $ | (12.09 | ) | ||||
| Weighted average shares of common stock outstanding—Basic and diluted |
434,187 | 504,796 | 511,796 | |||||||||
See accompanying notes to these consolidated financial statements.
F-9
Table of Contents
ENERGY & EXPLORATION PARTNERS, INC.
CONSOLIDATED STATEMENTS OF STOCKHOLDERS’ EQUITY
(In thousands, except share amounts)
| Member’s equity of Energy & Exploration(1) |
Controlling interest of NASIF(2) |
Non-controlling interests of NASIF(3) |
Common stock shares |
Common stock, par value |
Preferred stock |
Additional paid in capital |
Retained earnings (deficit) |
Total equity deficit |
||||||||||||||||||||||||||||
| TOTAL STOCKHOLDERS’ EQUITY |
||||||||||||||||||||||||||||||||||||
| January 1, 2012 |
$ | 4,471 | $ | — | $ | 10,465 | — | $ | — | $ | — | $ | — | $ | — | $ | 14,936 | |||||||||||||||||||
| Distributions |
(150 | ) | — | — | — | — | — | — | — | (150 | ) | |||||||||||||||||||||||||
| Net loss prior to reorganization |
(571 | ) | — | (92 | ) | — | — | — | — | — | (663 | ) | ||||||||||||||||||||||||
| Formation |
— | — | — | 1,000 | — | — | — | — | — | |||||||||||||||||||||||||||
| Reorganization |
(3,750 | ) | — | (10,373 | ) | 396,500 | 4 | — | 15,301 | — | 1,182 | |||||||||||||||||||||||||
| Equity owner contribution |
— | — | — | (22,500 | ) | — | — | — | — | — | ||||||||||||||||||||||||||
| Share-based compensation awards |
— | — | — | 125,000 | 1 | — | 3,861 | — | 3,862 | |||||||||||||||||||||||||||
| Net income after reorganization |
— | — | — | — | — | — | — | 9,397 | 9,397 | |||||||||||||||||||||||||||
|
|
|
|
|
|
|
|
|
|
|
|
|
|
|
|
|
|
|
|||||||||||||||||||
| TOTAL STOCKHOLDERS’ EQUITY |
||||||||||||||||||||||||||||||||||||
| December 31, 2012 |
$ | — | $ | — | $ | — | 500,000 | $ | 5 | $ | — | $ | 19,162 | $ | 9,397 | $ | 28,564 | |||||||||||||||||||
| Equity owner contribution |
— | — | — | (2,500 | ) | — | — | — | — | — | ||||||||||||||||||||||||||
| Share-based compensation |
— | — | — | 13,030 | — | — | 9,704 | — | 9,704 | |||||||||||||||||||||||||||
| Warrant issuance |
— | — | — | — | — | — | 13,763 | — | 13,763 | |||||||||||||||||||||||||||
| Net loss |
— | — | — | — | — | — | — | (21,767 | ) | (21,767 | ) | |||||||||||||||||||||||||
|
|
|
|
|
|
|
|
|
|
|
|
|
|
|
|
|
|
|
|||||||||||||||||||
| TOTAL STOCKHOLDERS’ EQUITY |
||||||||||||||||||||||||||||||||||||
| December 31, 2013 |
$ | — | $ | — | $ | — | 510,530 | $ | 5 | $ | — | $ | 42,629 | $ | (12,369 | ) | $ | 30,265 | ||||||||||||||||||
| Share-based compensation |
— | — | — | 5,079 | — | — | 1,477 | — | 1,477 | |||||||||||||||||||||||||||
| Warrant issuance |
— | — | — | — | — | — | 3,646 | — | 3,646 | |||||||||||||||||||||||||||
| Net loss |
— | — | — | — | — | — | — | (6,187 | ) | (6,187 | ) | |||||||||||||||||||||||||
|
|
|
|
|
|
|
|
|
|
|
|
|
|
|
|
|
|
|
|||||||||||||||||||
| TOTAL STOCKHOLDERS’ EQUITY (DEFICIT) |
||||||||||||||||||||||||||||||||||||
| December 31, 2014 |
$ | — | $ | — | $ | — | 515,609 | $ | 5 | $ | — | $ | 47,752 | $ | (18,556 | ) | $ | 29,201 | ||||||||||||||||||
|
|
|
|
|
|
|
|
|
|
|
|
|
|
|
|
|
|
|
|||||||||||||||||||
| (1) | Represents members equity of Energy & Exploration Partners, LLC, Energy & Exploration Partners Operating GP, LLC and Energy & Exploration Partners Operating, LP |
| (2) | Represents members equity of North American Shale Investment Fund GP, LP, North American Shale GP, LLC and North American Shale Investment Advisors, LLC |
| (3) | Represents non-controlling interests of North American Shale Investment Fund GP, LP, North American Shale GP, LLC and North American Shale Investment Advisors, LLC. |
See accompanying notes to these consolidated financial statements.
F-10
Table of Contents
ENERGY & EXPLORATION PARTNERS, INC.
CONSOLIDATED STATEMENTS OF CASH FLOWS
(In thousands)
| Year Ended December 31, | ||||||||||||
| 2012 | 2013 | 2014 | ||||||||||
| Cash flows from operating activities: |
||||||||||||
| Net income (loss) |
$ | 8,734 | (21,767 | ) | (6,187 | ) | ||||||
| Adjustments to reconcile net income (loss) to net cash provided by (used in) operating activities: |
||||||||||||
| Gain on sales of oil and natural gas assets |
(34,738 | ) | (14,275 | ) | (14,249 | ) | ||||||
| Full-cost ceiling impairment |
3,957 | 8,447 | — | |||||||||
| Depreciation, depletion and amortization |
469 | 6,917 | 66,237 | |||||||||
| Non-cash interest, discount and amortization of debt costs |
(417 | ) | 4,590 | 32,024 | ||||||||
| Share based compensation expense |
3,862 | 9,704 | 957 | |||||||||
| Loss on early extinguishment of debt |
985 | 3,677 | 74,418 | |||||||||
| Change in fair value of derivatives |
— | 557 | (101,651 | ) | ||||||||
| Deferred tax assets |
— | 1,116 | — | |||||||||
| Adjustments to working capital to arrive at net cash provided by (used in) operating activities: |
||||||||||||
| Accounts receivable |
(740 | ) | (3,139 | ) | (23,439 | ) | ||||||
| Prepaid expenses and other assets |
(3,799 | ) | 3,206 | (22 | ) | |||||||
| Income taxes |
(1,116 | ) | — | — | ||||||||
| Accounts payable- related party |
2 | (2 | ) | — | ||||||||
| Current income tax liability |
8,536 | (7,238 | ) | (805 | ) | |||||||
| Accounts payable, accrued and other liabilities |
3,193 | 28,153 | 46,477 | |||||||||
|
|
|
|
|
|
|
|||||||
| Net cash provided by (used in) operating activities |
(11,072 | ) | 19,946 | 73,760 | ||||||||
| Cash flows from investing activities: |
||||||||||||
| Chesapeake acquisition |
— | (68,875 | ) | — | ||||||||
| Ft. Trinidad acquisition |
— | — | (700,168 | ) | ||||||||
| Oil and natural gas capital expenditures |
(55,126 | ) | (115,174 | ) | (207,173 | ) | ||||||
| Proceeds from the sale of oil and gas properties, net of transaction costs |
75,155 | 19,875 | 19,843 | |||||||||
| Acquisition of furniture, fixtures, and equipment |
(577 | ) | (268 | ) | (1,329 | ) | ||||||
| Deposit for lease acquisition |
(6,500 | ) | — | — | ||||||||
| Purchase of security deposits |
(41 | ) | (40 | ) | — | |||||||
|
|
|
|
|
|
|
|||||||
| Net cash provided by (used in) investing activities |
12,911 | (164,482 | ) | (888,827 | ) | |||||||
| Cash flows from financing activities: |
||||||||||||
| Distributions to equity owners |
(150 | ) | — | — | ||||||||
| Proceeds from notes payable, net of debt service deposits funded and discounts |
30,286 | 160,241 | 1,195,375 | |||||||||
| Payments on notes payable, net of debt service deposits returned |
(22,493 | ) | (17,284 | ) | (228,875 | ) | ||||||
| Prepayment penalty on notes payable |
— | (2,779 | ) | (52,576 | ) | |||||||
| Payments of deferred offering costs |
(1,714 | ) | (340 | ) | (1,474 | ) | ||||||
| Payments of debt issuance costs |
(1,292 | ) | (1,961 | ) | (38,938 | ) | ||||||
| Repayments of investment deposits |
(1,520 | ) | — | — | ||||||||
| Repurchase of warrants |
(125 | ) | — | — | ||||||||
|
|
|
|
|
|
|
|||||||
| Net cash provided by financing activities |
2,992 | 137,877 | 873,512 | |||||||||
|
|
|
|
|
|
|
|||||||
| Net change in cash and cash equivalents |
4,831 | (6,659 | ) | 58,445 | ||||||||
| Cash and cash equivalents at beginning of period |
5,397 | 10,228 | 3,569 | |||||||||
|
|
|
|
|
|
|
|||||||
| Cash and Cash equivalents at end of period |
$ | 10,228 | $ | 3,569 | 62,014 | |||||||
|
|
|
|
|
|
|
|||||||
| Supplemental disclosure of cash flow information: |
||||||||||||
| Cash paid for interest |
$ | 2,178 | $ | 15,846 | $ | 33,004 | ||||||
|
|
|
|
|
|
|
|||||||
| Cash paid for taxes |
$ | — | $ | 709 | ||||||||
|
|
|
|
|
|
|
|||||||
| Non-cash investing and financing activities: |
||||||||||||
| Payment-in-kind interest |
— | 1,342 | 1,983 | |||||||||
|
|
|
|
|
|
|
|||||||
| Contribution of shares by equity owner |
$ | 2,858 | $ | — | — | |||||||
|
|
|
|
|
|
|
|||||||
| Original issue discount on notes payable |
$ | — | $ | 4,200 | 89,316 | |||||||
|
|
|
|
|
|
|
|||||||
| Warrants issued in conjunction with notes payable |
$ | — | $ | 13,763 | 3,646 | |||||||
|
|
|
|
|
|
|
|||||||
| Asset Retirement Obligations |
$ | 15 | $ | 1,292 | 3,553 | |||||||
|
|
|
|
|
|
|
|||||||
See accompanying notes to these consolidated financial statements.
F-11
Table of Contents
ENERGY & EXPLORATION PARTNERS, INC.
NOTES TO CONSOLIDATED FINANCIAL STATEMENTS
1. Organization
Energy & Exploration Partners, Inc. (together with our consolidated subsidiaries, “ENXP,” “the Company,” “we,” “our,” “us” or similar terms) was incorporated pursuant to the laws of the State of Delaware in July 2012. ENXP is an independent exploration and production company focused on the acquisition, exploration, development and exploitation of unconventional oil and natural gas resources. The Company has undeveloped leasehold acres in two basins: the East Texas Basin where the Company is pursuing opportunities in the Lower Cretaceous formations of the Buda, Georgetown, Edwards and Glen Rose (the Buda-Rose play), the Woodbine sandstone, the Good Land limestone and the Eagle Ford shale, collectively referred to as the East Texas stacked play; and the Denver-Julesburg Basin in Wyoming, referred to as the DJ Basin. The Company focuses on liquids-rich resource plays and believes that a substantial portion of its acreage is oil-prone. The Company plans to continue to pursue additional leasehold acquisitions in its East Texas stacked play core area and pursue other emerging opportunities.
2. Summary of Significant Accounting Policies
Corporate Reorganization
On August 22, 2012, the Company’s equity owner contributed all of his interest in Energy & Exploration Partners, LLC, Energy & Exploration Partners Operating, LP, and Energy & Exploration Partners Operating GP, LLC to Energy & Exploration Partners, Inc., for the majority of the common stock of Energy & Exploration Partners, Inc.
On August 22, 2012, investment depositors, for whom the Company had previously recorded a deposit liability of $10.4 million contributed their outstanding net profits interests to the Company in exchange for common stock of Energy & Exploration Partners, Inc.
In July and August 2012, and by August 22, 2012, investment depositors, for whom the Company had previously recorded a deposit liability of $1.2 million, contributed their outstanding net profits interests to the Company in exchange for common stock. The Company also returned $1.7 million in cash to depositors, for whom it had previously recorded a deposit liability of $1.5 million, in exchange for a release of its obligation to provide returns under the Company’s letter agreements with them.
On August 22, 2012, the Company assigned its ownership interests in Energy & Exploration Partners Operating, LP, Energy & Exploration Partners Operating GP, LLC, North American Shale GP, LLC, North American Shale Investment Advisors, LLC, North American Shale Investment Fund GP, LP, and North American Shale Investment Fund, LP to Energy & Exploration Partners, LLC which rolled up to Energy & Exploration Partners, Inc.
On September 6, 2012, North American Shale GP, LLC, North American Shale Investment Advisors, LLC, North American Shale Investment Fund GP, LP, and North American Shale Investment Fund, LP, Indy Exploration I, LLC, Indy Exploration II, LLC and Indy Exploration III, LLC were merged into Energy & Exploration Partners, LLC, a subsidiary of the Company and subsequently dissolved.
As the membership interests of Energy & Exploration Partners, LLC, Energy & Exploration Partners Operating, LP and the controlling and non-controlling membership interests of NASIF were all entities under the common control of the majority owner of the Company, the contributions of these memberships and interests for shares of the Company’s common stock were not considered business combinations. Accordingly, the assets and liabilities contributed are presented in the consolidated financial statements on a basis reflecting their ownership by the Company as of the beginning of the earliest period presented, at their historical cost. In addition, certain
F-12
Table of Contents
investors in Energy & Exploration Partners, LLC’s activities in the Niobrara area contributed their investments, which were recorded as liability for investment deposits by Energy & Exploration Partners, LLC, to the Company for common stock. These investments were not considered to be a business by the Company and thus were not a business combination. Accordingly, the contribution was recorded at the amount Energy & Exploration Partners, LLC had historically recorded for the investment deposit liability. The assets and liabilities of Energy & Exploration Partners, LP which were each recorded at $0, were not contributed to the Company.
Basis of Presentation
ENXP’s consolidated financial statements have been prepared in accordance with United States generally accepted accounting principles (“U.S. GAAP”). All significant intercompany transactions and account balances have been eliminated. As a company with less than $1.0 billion in revenue during its last fiscal year, the Company qualifies as an emerging growth company as defined in the recently enacted Jumpstart Our Business Startups Act of 2012, or the JOBS Act. An emerging growth company may take advantage of exemptions from various reporting requirements that are applicable to public companies that are not an “emerging growth company.”
Accounting Estimates
The accompanying consolidated financial statements are prepared in conformity with U.S. GAAP, which requires management to make estimates and assumptions that affect the reported amounts of assets and liabilities and disclosure of contingent assets and liabilities at the date of the financial statements and the reported amounts of revenues and expenses during the reporting periods. Actual results could differ from those estimates.
Significant assumptions are required in the quantification and valuation of proved oil and natural gas reserves, which as described herein may affect the amount at which oil and natural gas properties are recorded and related depreciation, depletion, amortization and impairment are calculated. Other significant estimates include but are not limited to asset retirement obligations, fair value of derivative financial instruments, fair value of equity-based compensation, and deferred tax assets and liabilities. The Company evaluates its estimates and assumptions on a regular basis. Changes in facts and circumstances or additional information may result in revised estimates, and actual results could differ from these estimates.
Cash and Cash Equivalents
Cash and cash equivalents include investments with original maturities of three months or less at the date of acquisition. The Company considers all highly liquid debt instruments purchased with an original maturity of three months or less to be cash equivalents. The Company determines the appropriate classification of its investments in cash and cash equivalents at the time of purchase and reevaluates such designation at each balance sheet date.
Revenue Recognition and Accounts Receivable
ENXP’s oil and natural gas are sold by the Company as the operator and its operating partners, for properties in which the Company has an interest, to various purchasers. The Company recognizes oil and natural gas revenues based on the quantities of its proportionate share of such production at market prices.
Accounts receivable are generated from the sale of oil and natural gas to various customers. The Company’s accounts receivable are uncollateralized and are generally due within 30 days of the invoice date. No interest is charged on past-due balances. Payments made on all accounts receivable are applied to the earliest unpaid items. Management periodically reviews accounts receivable. The allowance for doubtful accounts is established through provisions charged against income and is maintained at a level believed adequate by management to absorb estimated bad debts based on historical experience and current economic conditions. As of December 31,
F-13
Table of Contents
2013 and 2014, the Company did not have any reserves for doubtful accounts, and did not incur any expenses related to bad debts in any period presented.
Unevaluated Oil and Natural Gas Properties
The Company acquires unevaluated leasehold interests in oil and natural gas leasehold acreage for the purpose of exploiting. All costs identifiable with acquisition of these leasehold interests are capitalized.
Unevaluated property acquisition costs primarily include leasehold costs paid to secure oil and natural gas mineral leases, but may also include broker and legal expenses, geological and geophysical expenses and capitalized internal costs associated with developing oil and natural gas prospects on these properties.
Costs associated with unevaluated properties are excluded from the full cost pool until the Company has made a determination as to the existence of proved reserves or until an evaluation that an impairment has occurred is made. The Company reviews its unevaluated properties at the end of each quarter to determine whether the costs incurred should be transferred to the full cost pool and thereby subject to amortization.
Full Cost Accounting
The Company utilizes the full-cost method of accounting for its investments in oil and natural gas properties. Under this method, all costs associated with the acquisition, exploration, development and abandonment of oil and natural gas properties and reserves, including unproved and unevaluated property costs, are capitalized as incurred and accumulated in a single cost center representing the Company’s activities, which are undertaken exclusively in the United States. Such costs include lease acquisition costs, geological and geophysical expenditures, lease rentals on undeveloped properties, costs of drilling both productive and non-productive wells, capitalized interest on qualifying projects and general and administrative expenses directly related to acquisition, exploration and development activities, but do not include any costs related to production, selling or general corporate administrative activities which are expensed as incurred.
Capitalized costs related to unproved properties will be retained as unevaluated properties until such time that such properties are evaluated and proved reserves may be assigned or until such time when the Company determines that impairment has occurred. The Company capitalizes interest, if debt is outstanding, on capital expenditures related to its unevaluated properties and wells in process of being drilled until such properties are ready for their intended use. When proved reserves are discovered, the related acquisition costs and drilling costs are transferred into the amortization base, whereby properties are amortized at the beginning of the quarter in which they are classified as proved. Additionally the Company includes the costs of drilling exploratory dry holes and the related leasehold costs in the amortization base immediately upon determination that such wells are non-commercial.
All capitalized costs of oil and natural gas properties included in the amortization base are amortized using the units-of-production method based on production estimates of total proved reserve quantities. In addition to costs associated with evaluated properties, the amortization base includes estimated future development costs to be incurred in developing proved reserves as well as estimated plugging and abandonment costs.
Under the full-cost method of accounting, the Company is required to periodically perform a ceiling test which determines a limit on the book value of its oil and natural gas properties. If the net capitalized cost of oil and natural gas properties including capitalized asset retirement costs, net of related deferred income taxes, exceeds (i) the present value of estimated future net revenues from proved reserves discounted at 10%, (ii) plus cost of unproved oil and natural gas properties not being amortized, (iii) plus the lower of cost or estimated fair value of unproved oil and natural gas properties included in the amortization base, net of related tax effects (“Cost Ceiling”), the excess is charged to expense and reflected as additional accumulated depreciation, depletion, and amortization. Any such write-downs are not recoverable or reversible in future periods.
F-14
Table of Contents
Other Property and Equipment
Other property and equipment are stated at cost less accumulated depreciation. Depreciation is calculated using the straight-line method over the estimated useful lives (ranging from 3 to 10 years) of the respective assets. The costs of normal maintenance and repairs are charged to expense as incurred unless they extend the useful life of the asset. Material expenditures that increase the life of an asset are capitalized and depreciated over the estimated remaining useful life of the asset. The cost of equipment sold, or otherwise disposed of, and the related accumulated depreciation are removed from the accounts and any gain or loss is reflected in current operations.
Currently, the Company owns land, certain computer software, hardware and other office-related equipment. Depreciation expense related to other property and equipment was $162,000 for each of the years ended December 31, 2012 and 2013 and $313,000 for the year ended December 31, 2014.
Oil and Natural Gas Reserve Quantities
The estimates of oil and natural gas reserves as of December 31, 2012, 2013 and 2014 are based on reports prepared by Cawley, Gillespie & Associates, Inc. (“CG&A”), independent reservoir engineers.
Estimates of proved reserves are based on the quantities of oil and natural gas that engineering and geological analyses demonstrate, with reasonable certainty, to be recoverable from established reservoirs in the future under current operating and economic parameters. CG&A prepares the reserve and economic evaluation of the Company’s properties, utilizing information provided to it by management and other information available, including information from the operator of the property.
Asset Retirement Obligations
The Company has obligations under its lease agreements and federal regulations to remove equipment and facilities from leased acreage and return such land to its original condition. In general, the Company’s future asset retirement obligations (“ARO”) relate to future costs associated with plugging and abandonment of its oil and natural gas wells, removal of equipment and facilities from leased acreage and returning such land to its original condition. The ARO is recorded as a liability at its estimated present value in the period in which it is incurred with a corresponding increase in the carrying amount of the related oil and gas property on the balance sheet. Periodic accretion of the discounted value of the estimated liability is recorded as an expense in the consolidated statement of operations. The amounts recognized are based on non-recurring level 3 fair value inputs, including future retirement costs, future well life, inflation factors and the credit-adjusted risk-free interest rate. Revisions to the liability can occur due to changes in its estimate or if federal or state regulators enact new plugging and abandonment requirements. At the time of actual plugging and abandonment of the Company’s oil and natural gas wells, any gains or losses associated with the operation in the amortization base to the extent that the actual costs are different from the estimated liability are included.
Derivatives and hedging
The Company’s risk management program is intended to reduce its exposure to commodity prices and to assist with stabilizing cash flows. Accordingly, the Company utilizes derivative financial instruments to manage its exposure to commodity price fluctuations. These transactions are primarily in the form of either swaps with fixed settlements or collars (calls and puts). The Company has not designated any of its derivative instruments as hedges; therefore, the derivatives are carried at fair value on the consolidated balance sheets as assets or liabilities and all changes in fair value are recorded as gains and losses in the statements of operations. See Note 9—Derivative Financial Instruments for additional information related to derivative instruments.
F-15
Table of Contents
Share-Based Compensation
The Company follows Accounting Standards Codification (“ASC”) 718, Compensation- Stock Compensation, which requires the measurement and recognition of compensation expense for all share-based payment awards, including restricted stock units, based on estimated grant date fair values. Restricted stock units are valued using the market price of our common shares on the date of grant. The Company records compensation expense, net of estimated forfeitures, over the requisite service period.
Income Taxes
Effective April 13, 2012, Energy & Exploration Partners, LLC terminated its election to report as an S Corporation and became a C Corporation for federal income tax reporting purposes. Subsequently, the Company accounts for income taxes using the asset and liability method. Deferred tax assets and liabilities arise from expected future tax consequences related to temporary differences between book carrying amounts and tax bases of assets and liabilities. Deferred tax assets and liabilities are measured using enacted tax rates anticipated being applied to taxable income in years in which temporary differences and carry forwards are expected to be recovered or settled. The effect on deferred tax assets and liabilities, specific to a change in tax rates, is recognized in income in the period that includes the enactment date. Valuation allowances are established when necessary to reduce the deferred tax asset to the amount more likely than not to be recovered.
Additionally, the Company is required to determine whether it is more likely than not (a likelihood of more than 50%) that a tax position will be sustained upon examination, including resolution of any related appeals or litigation processes, based on the technical merits of the position in order to record any financial statement benefit. If that step is satisfied, then the tax position to determine the amount of benefit to recognize in the financial statements is measured. The tax position is measured at the largest amount of benefit that has greater than a 50% likelihood of being realized upon ultimate settlement. Any interest or penalties would be recognized as a component of income tax expense.
The Company applies significant judgment in evaluating its tax positions and estimating its provision for income taxes. During the ordinary course of business, there are many transactions and calculations for which the ultimate tax determination is uncertain. The actual outcome of future tax consequences may differ significantly from these estimates, which could impact the Company’s financial position, results of operations and cash flows. The Company, does not have any uncertain tax positions and, as such, did not record a liability as of December 31, 2012, 2013, or 2014.
The tax years 2011 through 2013 remain open to examination by the federal and state taxing jurisdictions in which the Company operates.
Other Long-Term Assets
Other long-term assets consist primarily of deferred offering costs related to the Company’s planned initial public offering (“IPO”). Upon closing of the IPO, the proceeds of the offering, net of the offering costs, will be recorded as common stock at par value and additional paid-in capital. In any case where the IPO process is terminated, or where capitalized costs do not provide future value in the IPO process, the offering costs will be charged to expense.
Earnings per Share
The Company reports basic earnings per common share, which excludes the effect of potentially dilutive securities, and diluted earnings per common share, which includes the effect of all potentially dilutive securities, unless their impact is anti-dilutive.
F-16
Table of Contents
Financial Instruments
The carrying amounts reported on the balance sheet for cash and cash equivalents, deposits, accounts receivable, prepaid expenses, accounts payable, accrued liabilities, royalties payable, advances from joint interest owners, dividends payable and other current liabilities approximate fair values, due to the short-term maturity of these instruments.
The carrying amounts of derivative instruments reported on the consolidated balance sheets are the estimated fair value of the Company’s derivative instruments. See Note 9—Derivative Financial Instruments for additional information related to the Company’s derivative instruments.
Credit and Market Risk
The Company is exposed to counterparty risk from the purchasers of its oil and natural gas, its operating partners, its derivative counterparties and its joint venture partners. Oil and natural gas and joint interest receivables are generally unsecured. As of December 31, 2014, three customers made up approximately 89% of our revenues and each individually accounted for more than 10% of our revenue. Enterprise Crude Oil LLC, Texican Crude & Hydrocarbons, LLC and Shell Trading Company (US) made up approximately 35%, 28% and 26%, respectively of our revenues. As of December 31, 2014, three customers made up approximately 82% of our accounts receivable and each individually accounted for more than 10% of our accounts receivable. Enterprise Crude Oil LLC, Texicana Crude Hydrocarbons, LLC and BP Energy Company made up 31%, 39% and 12%, respectively of our accounts receivable. The inability or failure of the Company’s significant purchasers, derivative counterparties, or partners to meet their obligations or their insolvency or liquidation may adversely affect the Company’s financial results.
During 2013 and 2014, the Company had cash deposits in certain banks that at times exceeded the maximum insured by the Federal Deposit Insurance Corporation. The Company monitors the financial condition of the banks and has experienced no losses on these accounts.
Environmental Expenditures
The Company is subject to extensive federal, state and local environmental laws and regulations. These laws regulate the discharge of materials into the environment and may require the Company to remove or mitigate the environmental effects of the disposal or release of petroleum or chemical substances at various sites. Environmental expenditures are expensed or capitalized depending on their future economic benefit. Expenditures that relate to an existing condition caused by past operations and that have no future economic benefits are expensed. Liabilities for expenditures of a non-capital nature are recorded when environmental assessment and/or remediation is probable, and the costs can be reasonably estimated. Such liabilities are generally not discounted unless the timing of cash payments for the liability or component is fixed or reliably determinable.
Liabilities for loss contingencies, including environmental remediation costs arising from claims, assessments, litigation, fines, and penalties and other sources, are recorded when it is probable that a liability has been incurred and the amount of the assessment and/or remediation can be reasonably estimated. Recoveries of environmental remediation costs from third parties, which are probable of realization, are separately recorded and are not offset against the related environmental liability.
The Company believes it is in compliance with all applicable federal, state and local regulations associated with its properties. Accordingly, no environmental remediation liability or loss associated with the Company’s properties was recorded as of December 31, 2013 and 2014.
F-17
Table of Contents
Recent Accounting Pronouncements
In May 2014, the Financial Accounting Standards Board (“FASB”) issued Accounting Standards Update (“ASU”) 2014-09, Revenue from Contracts with Customers. ASU 2014-09 amends the guidance for revenue recognition to replace numerous, industry-specific requirements. The core principle of the amendment is that an entity should recognize revenue for the transfer of goods or services equal to the amount that it expects to be entitled to receive for those goods or services. The amendment implements a five-step process for customer contract revenue recognition that focuses on transfer of control, as opposed to transfer of risk and rewards. The amendment also requires enhanced disclosures regarding the nature, amount, timing and uncertainty of revenues and cash flows arising from contracts with customers. The amendments are effective for reporting periods beginning after December 15, 2016, and early adoption is prohibited. Entities can transition to the standard either retrospectively to each period presented or as a cumulative-effect adjustment as of the date of adoption. The Company has not determined the impact the adoption of ASU 2014-09 will have on its consolidated financial statements or the method it will utilize upon adoption during the first quarter of 2017.
In August 2014, the FASB issued ASU 2014-15, Presentation of Financial Statements - Going Concern. The new standard requires management to assess an entity’s ability to continue as a going concern and to provide related disclosures in certain circumstances. Under the new guidance, disclosures are required when conditions give rise to substantial doubt about an entity’s ability to continue as a going concern within one year from the financial statement issuance date. The guidance is effective for annual periods ending after December 15, 2016, and all annual and interim periods thereafter. Early application is permitted. The adoption of this guidance will not have any impact on the Company’s financial position and results of operations and, the Company does not expect any impact on its disclosures.
In November 2014, the FASB issued ASU 2014-16, Derivatives and Hedging (Topic 815): Determining Whether the Host Contract in a Hybrid Financial Instrument Issued in the Form of a Share is More Akin to Debt or to Equity. ASU 2014-16 provides guidance to entities about how to determine the nature of the host contract by considering all terms and features of the hybrid financial instrument. It is effective for fiscal years, and interim periods within those fiscal years, beginning after December 15, 2015, with early adoption permitted. The Company does not expect this ASU to have a material effect on the Company’s financial statements.
In November 2014, the FASB issued ASU 2014-17, Business Combinations (Topic 805): Pushdown Accounting. ASU 2014-17 provides guidance on whether and at what threshold an acquired entity can apply pushdown accounting in its separate financial statements. It is effective on November 18, 2014. The Company does not expect this ASU to have a material effect on the Company’s financial statements.
In January 2015, the FASB issued ASU 2015-01, Income Statement—Extraordinary and Unusual Items (Subtopic 225-20): Simplifying Income Statement Presentation by Eliminating the Concept of Extraordinary Items. ASU 2015-01 eliminates the concept of extraordinary items from GAAP. It is effective for fiscal years, and interim periods within those fiscal years, beginning after December 15, 2015, with early adoption permitted. The Company does not expect this ASU to have a material effect on the Company’s financial statements.
In April 2015, the FASB issued ASU 2015-03, “Simplifying the Presentation of Debt Issuance Costs.” ASU 2015-03 requires that debt issuance costs related to a recognized debt liability be presented in the balance sheet as a direct deduction from the carrying amount of that debt liability, consistent with debt discounts. The ASU is effective for annual periods beginning after December 15, 2015, and interim periods within those annual periods. The adoption of this pronouncement will result in a change in the presentation of debt issuance costs on our financials at the effective date.
F-18
Table of Contents
3. Acquisitions
2012 Acquisitions
On April 5, 2012, ENXP entered into a purchase and sale agreement with a Texas exploration and production company to purchase a series of undeveloped leasehold acreage in Grimes County, Texas. The gross purchase price of this transaction was $5.3 million.
On April 10, 2012, EX Operating LLC, executed a lease purchase agreement to purchase certain oil and gas leases in Lynn County, Texas and delivered a deposit of $1.0 million. On May 15, 2012, EX Operating LLC then assigned all of its rights, title and interest in and to the lease purchase agreement to Energy & Exploration Partners, LLC for $1.0 million, and Energy & Exploration Partners, LLC purchased the leases effective as of April 10, 2012 for $1.9 million.
On July 24, 2012, the Company acquired a series of undeveloped leasehold acreage in Walker County, Texas. The gross purchase price of this transaction was approximately $2.0 million.
On September 10, 2012, ENXP entered into a purchase and sale agreement with Chesapeake pursuant to which ENXP agreed to purchase 100% of Chesapeake’s acreage in the Eaglebine. The agreement initially provided for a closing date of October 31, 2012. The Company exercised its right to extend the closing date of the sale to February 14, 2013 by paying $3.5 million, $3.0 million and $3.5 million on September 10, 2012, October 30, 2012, and January 2, 2013 respectively. On April 8, 2013, the sale was closed and the Company acquired a 100% operated working interest in Chesapeake’s acreage in the Eaglebine in exchange for approximately $93.0 million.
On September 25, 2012, ENXP acquired undeveloped leasehold acreage in Madison County, Texas. The gross purchase price of this transaction was approximately $2.3 million.
2013 Acquisitions
On April 8, 2013, ENXP closed on its purchase and sale agreement with Chesapeake Energy Corporation, (“Chesapeake”) and acquired generally a 100% operated working interest in Chesapeake’s acreage in the Eaglebine for approximately $93.0 million (the “Chesapeake Acquisition”), consisting of approximately $75.0 million in cash and a subordinated promissory note in the principal amount of $18.0 million with Chesapeake. See Note 7—Note Payable for additional discussion on the $18.0 million subordinated unsecured note with Chesapeake. The acquired properties consisted primarily of leasehold acreage, and included nine producing wells, one well awaiting a pipeline connection and one non-producing well. Of the $93.0 million purchase price, $6.9 million represented evaluated properties and the remaining $86.1 million represented unevaluated properties.
In connection with the Chesapeake Acquisition, ENXP executed an Assignment of Contracts and Assumption Agreement with Energia Tejas, LLC (“Energia”). In accordance with the agreement, for a purchase price of $0.9 million the Company acquired Energia’s interests in oil and gas leases, excluding their overriding royalty interests, in the AMI created by the AMI, Participation, and Lease Purchase Agreement dated June 1, 2010 between Chesapeake and Energia.
2014 Acquisitions
On July 22, 2014, effective April 1, 2014, the Company and TreadStone Energy Partners, LLC, a Delaware limited liability company, closed on a transaction for the Company to purchase oil and gas leasehold, a salt water disposal system, 3D seismic and producing wells in Houston and Madison Counties, Texas, (the “Ft. Trinidad acquisition”) for a cash purchase price of $700.1 million, including post-closing adjustments.
F-19
Table of Contents
The acquisition was accounted for as a business combination in accordance with the Accounting Standards Codification (“ASC”) No. 805 “Business Combinations” which, among other things, requires assets acquired and liabilities assumed to be measured at their acquisition date fair values.
The following table summarizes the consideration paid to acquire the properties and the amounts of the assets acquired and liabilities assumed as of the initial closing on the acquisition date and post-closing adjustments recognized as of December 31, 2014 (in thousands):
Purchase Price
| Purchase price—net cash consideration |
$ | 700,168 | ||
| Liabilities assumed: |
||||
| Accounts payable and other liabilities |
6,628 | |||
| Long-term asset retirement obligations |
2,894 | |||
|
|
|
|||
| Total purchase price plus liabilities assumed |
$ | 709,690 | ||
|
|
|
Estimated Fair Value of Assets Acquired and Assumed
| Proved oil and natural gas properties |
$ | 708,944 | ||
| Accounts receivable—other |
451 | |||
| Long term assets—deposits |
295 | |||
|
|
|
|||
| Attributable to assets acquired and assumed |
$ | 709,690 | ||
|
|
|
The estimated fair value of the proved oil and natural gas properties acquired was determined using non-recurring Level 3 input assumptions as to future commodity prices, projections of estimated quantities of oil and natural gas reserves, expectations for the timing and amount of future development costs, operating costs, abandonment costs, projections of future rates of production, expected recovery rates and risks adjusted discount rates.
The fair value of the asset retirement obligations was determined using non-recurring Level 3 inputs. The significant unobservable inputs to this fair value measurement include estimates of plugging, abandonment and remediation costs, inflation rate and well life.
Contemporaneous with the closing of the Ft. Trinidad acquisition, the Company completed a financing consisting of a $775 million senior secured term loan and the issuance of $375 million of convertible notes. See Note 7—Notes Payable for additional discussion on these notes. The Company used a portion of the net proceeds of the debt issuances to fund the Ft. Trinidad acquisition and to refinance and replace its previously outstanding senior unsecured notes. The Ft. Trinidad acquisition, the debt issuances and the debt retirement are all reflected in the pro forma financial information included below. The following unaudited pro forma combined results of operations are provided for the years ended December 31, 2013 and 2014 as though the transactions occurred as of the beginning of the earliest period presented, or January 1, 2013.
F-20
Table of Contents
The unaudited pro forma combined and condensed consolidated statement of operations are presented for illustrative purposes only and are not necessarily indicative of the consolidated financial position or consolidated results of operations of the Company that would have been reported had the transactions occurred on the dates indicated, nor do they represent a forecast of the consolidated results of operations of the Company at any future date. Additionally, non-recurring debt extinguishment costs of $75.5 million, including a prepayment penalty, have been excluded from the pro forma results.
| Year ended December 31, | ||||||||
| 2013 | 2014 | |||||||
| Revenue |
$ | 100,422 | $ | 261,838 | ||||
| Net income (loss) |
(62,974) | 26,677 | ||||||
| Loss available to common shareholders |
(62,974) | 26,677 | ||||||
| Pro forma net income (loss) per common share |
||||||||
| Basic |
$ | (124.75 | ) | $ | 52.12 | |||
| Diluted |
$ | (124.75 | ) | $ | 31.93 | |||
The following adjustments were made in the preparation of the pro forma combined and condensed consolidated statement of operations:
| • | Revenues and operating expenses for the Ft. Trinidad properties were derived from the historical records of the seller. |
| • | Depreciation, depletion and amortization expense was estimated using the full-cost method and determined by including the purchase price allocation, future development costs, production and reserves for the acquired assets. |
| • | Accretion expense was computed using the Company’s estimate of asset retirement obligations for the acquired assets using calculation methods described in Note 6—Asset Retirement Obligations. |
| • | Interest expense was computed using contractual interest rates on the new convertible notes and senior secured term loan and includes amortization of debt discounts and debt issuance costs. See Note 7—Notes Payable for additional discussion on the terms of the convertible notes and the senior secured term loan. |
For the year ended December 31, 2014, the Company recognized, in its statement of operations, $107.7 million of oil, natural gas and natural gas liquid sales and $10.7 million of net field operating income (oil, natural gas and natural gas liquids revenues less lease operating expense, workover expense, production taxes, depletion expense, interest expense and income taxes) related to the properties acquired in the Ft. Trinidad acquisition. The Company incurred a de minimus amount of acquisition related costs.
F-21
Table of Contents
4. Oil and Natural Gas Properties and Equipment
The following table presents a summary of the Company’s oil and natural gas properties and related accumulated depletion and impairment as of December 31, 2013 and 2014 (in thousands):
| December 31, | ||||||||
| 2013 | 2014 | |||||||
| Subject to depletion |
$ | 158,955 | $ | 1,100,203 | ||||
|
|
|
|
|
|||||
| Not subject to depletion: |
||||||||
| Exploration and extension wells in progress |
404 | 8,477 | ||||||
| Other capital costs: |
||||||||
| Incurred in 2014 |
— | 28,829 | ||||||
| Incurred in 2013 |
70,142 | 40,877 | ||||||
| Incurred in 2012 |
8,389 | 2,754 | ||||||
| Incurred in 2011 and prior |
10,151 | — | ||||||
|
|
|
|
|
|||||
| Total not subject to depletion |
89,086 | 80,937 | ||||||
|
|
|
|
|
|||||
| Gross oil and natural gas properties |
248,041 | 1,181,140 | ||||||
| Less accumulated depletion and impairment(1) |
(19,368 | ) | (84,999 | ) | ||||
|
|
|
|
|
|||||
| Net oil and natural gas properties |
$ | 228,673 | $ | 1,096,141 | ||||
|
|
|
|
|
|||||
| (1) | Accumulated depletion and impairment as of December 31, 2013 and 2014 include full cost ceiling impairment expense of approximately $12.4 million. |
Investments in unevaluated oil and natural gas properties and exploration and development projects for which depletion expense is not currently recognized, and for which exploration or development activities are in progress, qualify for interest capitalization. The capitalized interest is determined by multiplying the Company’s weighted-average borrowing cost on debt by the average amount of qualifying costs incurred that are excluded from the full cost pool; however, the amount of capitalized interest cannot exceed the amount of gross interest expense incurred in any given period. The capitalized interest amounts are recorded as additions to unevaluated oil and natural gas properties on the consolidated balance sheets. As the costs excluded are transferred to the full cost pool, the associated capitalized interest is also transferred to the full cost pool. For the years ended December 31, 2013 and 2014, the Company capitalized interest costs of $3.8 million and $11.2 million, respectively.
The Company capitalizes certain general and administrative costs, including share based compensation costs, related to individuals directly involved in the Company’s acquisition, exploration and development activities based on the percentage of their time devoted to such activities. These costs include employee compensation and related benefits. For the years ended December 31, 2013 and 2014, the Company capitalized general and administrative costs of $3.6 million and $8.3 million, respectively.
Impairment and Abandonment of Unevaluated Properties
ENXP’s unproved and unevaluated properties are assessed at a minimum on an annual basis on an individual prospect level for possible impairment based upon changes in operating or economic conditions.
Unproved and unevaluated properties are nonproducing and do not have estimable cash flow streams. Therefore, the Company estimates the fair value of these properties by obtaining, when available, information about recent market transactions in the vicinity of the prospects and adjusts the market data as needed to give consideration to the proximity of the prospects to known fields and reservoirs, the extent of geological and
F-22
Table of Contents
geophysical data on the prospects, the assignment of proved reserves, intent to drill, remaining lease terms, recent drilling results in the vicinity of the prospects, and other risk-related factors such as drilling and completion costs, estimated product prices and other economic factors. Based on these assessments, the Company includes the cost of such properties whose carrying value exceeds its estimated value with other evaluated properties to be amortized and subject to the full-cost ceiling impairment of oil and natural gas properties. The Company categorizes the measurement of fair value of unproved properties as Level 3 non-recurring measurements.
During the years ended December 31, 2013 and 2014, the Company transferred $18.5 million and $27.3 million, respectively, of unevaluated property costs to the full cost pool related to impaired value, primarily due to a decline in fair value of certain leases related to the remaining expiring lease terms.
Full-Cost Ceiling Impairment of Oil and Natural Gas Properties
Under the full cost method of accounting for oil and natural gas properties, net capitalized costs of oil and natural gas properties are limited to the lower of unamortized costs less related deferred income taxes or the Cost Ceiling, with any excess above the cost center ceiling charged to the statement of operations as a full-cost ceiling impairment. Properties included in the total net capitalized costs include, but are not limited to, proved properties, unproved evaluated properties and unevaluated properties deemed to have been impaired.
ENXP’s net capitalized costs at December 31, 2014 did not exceed the ceiling amount. As a result, the Company did not record an impairment related to the full cost ceiling test at December 31, 2014. The Company recorded a full cost ceiling test impairment of $4.0 million and $8.4 million for the years ended December 31, 2012 and 2013.
5. Significant Sales of Assets
Net gains on sales of assets for the years ended December 31, 2012, 2013 and 2014 are as follows (in thousands):
| Year ended December 31, | ||||||||||||
| 2012 | 2013 | 2014 | ||||||||||
| Gain on sale of assets |
$ | 34,738 | $ | 14,275 | $ | 14,249 | ||||||
2012 Sales and Conveyances
The Company, as sellers, closed on multiple property conveyances with a third-party operator, Halcón Resources, Inc. (“Halcón”), to develop the Company’s undeveloped leasehold acreage in the prospect area principally focused on the Eaglebine formation. The proceeds of these transactions were approximately $45.4 million for a sale of a 65% working interest in the undeveloped leasehold acreage in an area collectively known as Area of Mutual Interest #1 (“AMI #1”) and an 80% working interest in the undeveloped leasehold acreage in an area collectively known as Area of Mutual Interest #2 (“AMI #2”).
On August 23, 2012, the Company entered into a purchase and sale agreement with CEU Huntsville, LLC, (“Huntsville”), a subsidiary of Exelon Generation Company, LLC, to sell a 10% non-operated working interest in its Eaglebine acreage in AMI #1 and a 5% non-operated working interest in AMI #2. Pursuant to the first closing of this agreement, the Company conveyed acreage in AMI #1 for $24.7 million and received an additional $0.8 million as reimbursement for the buyer’s 10% share of a well. The agreement provides for future closings of additional acreage. Following the final closings with both Halcón and Huntsville, the Company retained a 25% working interest in AMI #1 and a 15% working interest in AMI #2. For future acquisitions, Huntsville can elect to participate in AMI #1 or AMI #2 by paying its pro-rata 10% share of all acreage costs in AMI #1 and its pro-rata 5% share of all acreage costs plus $100 per net mineral acre in AMI #2. In addition to the cash proceeds received from both closings, if the buyer achieves a specified rate of return, it will re-convey 30% of the working
F-23
Table of Contents
interests it holds in wells and acreage in both AMI #1 and AMI #2 back to the Company. On August 24, 2012, ENXP made a payment of $5.0 million, or 20% of the proceeds, net of broker fee, from this sale, to its lender to be applied against its outstanding principal balance, pursuant to provisions of its Guggenheim Credit Facility. On September 28, 2012 ENXP made an additional conveyance under this agreement for $7.9 million and on October 5, 2012, a payment of $1.5 million from this sale was made to the Company’s lender to be applied against its outstanding principal balance, pursuant to provisions of the Guggenheim Credit Facility.
In December 2012, the Company conveyed additional working interests in newly acquired undeveloped leasehold acreage in AMI #2. Funding by Huntsville for gross proceeds of $1.5 million was received by the Company on January 16, 2013, of which $0.6 million related to acquired interests and $0.9 million related to reimbursements of costs.
2013 Sales and Conveyances
Pursuant to the Company’s agreement with Halcón Resources, Inc. (“Halcón”), working interests conveyed to Halcón were subject to a contingent payment of $1,000 per net acre conveyed, subject to the commerciality of one or two wells drilled and completed within the area of mutual interest created pursuant to the agreement (“AMI #1”). See 2012 Sales and Conveyances above for further discussion on this transaction. During the year ended December 31, 2013, one of the wells became commercial and Halcón elected to pay one-half of the contingent payment, or $14.6 million to the Company. The Company follows the full cost method of accounting for its oil and gas properties. Generally, under this method, sales are accounted for as adjustments to capital costs, with no gains or losses realized unless such adjustments would significantly alter the relationship between capitalized costs and proved reserves to such cost center. As this contingent payment is part of a previous sale which significantly altered the relationship between the basis in the Company’s properties in AMI#1 and the Company’s de minims proved reserves at the time of sale, the proceeds of $14.6 million net of $0.4 million in fees associated with the receipt of the proceeds is shown as a gain on the statement of operations at December 31, 2013. The remaining half of the contingent payment, or $14.6 million was paid to the Company in 2014. See 2014 Sales and Conveyances below.
On June 25, 2013, the Company sold its 100% interest in its evaluated and unevaluated Niobrara assets located in Weld County, Colorado for consideration of $5.5 million, subject to customary purchase price adjustments. ENXP did not recognize any gain or loss on this sale as the Company follows the full cost method of accounting for its evaluated oil and gas properties. Generally under this method, gains or losses are not realized for the sale or abandonment of evaluated properties but are however, accounted for as adjustments of capitalized costs unless such adjustments would significantly alter the relationship between capitalized costs and proved reserves of oil and gas attributable to such cost center.
2014 Sales and Conveyances
Pursuant to the Company’s agreement with Halcón Resources, Inc. (“Halcón”) in 2013 described above, on March 31, 2014, Halcón elected to pay the remaining $14.6 million of the contingent payment by May 15, 2014. The Company received the contingent payment in May 2014 and has shown the payment received of $14.6 million net of $0.4 million in costs associated with this payment as a gain on the statement of operations at December 31, 2014.
During June 2014, the Company completed the disposition of certain oil and gas leaseholds in Houston and Robertson Counties, Texas, to several oil and gas companies for sales proceeds of approximately $5.4 million in cash. The sales proceeds were recorded as a reduction to the capital costs in the full cost pool in accordance with the Company’s methodology in accounting for its oil and gas properties as described above.
F-24
Table of Contents
6. Asset Retirement Obligations
The Company recognizes the fair value of a liability for an asset retirement obligation (“ARO”) in the period in which it is incurred and if a reasonable estimate of fair value can be made. The asset retirement obligation is capitalized as part of the carrying amount of the long-lived asset. The Company determines its asset retirement obligations on its oil and natural gas properties by calculating the present value of estimated cash flows related to the estimated liability. The fair value of the liability is measured on a non-recurring basis using primarily Level 3 inputs. The significant unobservable inputs to this fair value measurement include estimates of plugging, abandonment and remediation costs, inflation rate and well life. The inputs are calculated based on historical data as well as current estimated costs. See Note 10—Fair Value Measures for additional discussion.
The following table summarizes the changes in the Company’s ARO for the year ended December 31, 2013 and the year ended December 31, 2014 (in thousands).
| December 31, 2013 |
December 31, 2014 |
|||||||
| Liability for asset retirement obligations, beginning of period |
$ | 16 | $ | 1,292 | ||||
| Additions |
133 | 408 | ||||||
| Acquisitions |
205 | 2,894 | ||||||
| Change in estimate(1) |
840 | 251 | ||||||
| Accretion expense |
98 | 295 | ||||||
|
|
|
|
|
|||||
| Liability for asset retirement obligations, end of period |
1,292 | 5,140 | ||||||
| Less: current asset retirement obligations |
(655 | ) | (248 | ) | ||||
|
|
|
|
|
|||||
| Long-term asset retirement obligations |
$ | 637 | $ | 4,892 | ||||
|
|
|
|
|
|||||
| (1) | Change in estimate is primarily due to changes in estimated economic lives and plugging and abandonment costs. |
7. Notes Payable
The following table summarizes the Company’s debt as of December 31, 2013 and December 31, 2014 (in thousands):
| December 31, 2013 |
December
31, 2014(6) |
|||||||
| Senior unsecured note—Tranche A(1) |
$ | 124,731 | $ | — | ||||
| Senior unsecured note—Tranche B(2) |
24,263 | — | ||||||
| Subordinated unsecured note—Chesapeake(3) |
19,342 | 21,325 | ||||||
| Convertible notes(4) |
— | 323,772 | ||||||
| Senior secured term loan(5) |
— | 752,891 | ||||||
|
|
|
|
|
|||||
| Total long term notes payable |
168,336 | 1,097,988 | ||||||
| Add: Current portion of senior secured term loan |
— | 7,750 | ||||||
|
|
|
|
|
|||||
| Total notes payable |
$ | 168,336 | $ | 1,090,238 | ||||
|
|
|
|
|
|||||
| (1) | Amount is net of unamortized discount of $15.3 million at December 31, 2013. See “Senior Unsecured Notes” below for more details. |
| (2) | Amount is net of unamortized discount of $0.8 million at December 31, 2013. See “Senior Unsecured Notes” below for more details. |
| (3) | Amount includes cumulative paid in kind interest of $1.3 million and $3.3 million at December 31, 2013 and 2014, respectively. See “Subordinated Unsecured Note—Chesapeake Note” below for more details. |
| (4) | Amount is net of unamortized discount of $51.2 million at December 31, 2014 related to the fair value of embedded derivatives related to the conversion and change of control features of the notes. See “Convertible Notes” below for more detail. |
F-25
Table of Contents
| (5) | Amount is net of unamortized discount of $10.5 million at December 31, 2014. See “Senior Secured Term Loan” below for more detail. |
| (6) | See Note 13—Commitments and Contingencies for a five year maturity schedule. |
Senior Unsecured Note
On April 8, 2013, ENXP issued $140.0 million of senior unsecured notes (the “Tranche A notes”) with an original issue discount of 3%, or $4.2 million, to affiliates of Highbridge Principal Strategies, LLC, (“Highbridge”), and affiliates of Apollo Investment Corporation, (“Apollo”). These notes were to mature on April 8, 2018.
On December 12, 2013, ENXP entered into the first supplement to its senior unsecured notes agreement and issued $25.0 million of senior unsecured notes (the “Tranche B notes”) with an original issue discount of 3%, or $0.8 million, to Highbridge and Apollo. These notes were to mature on December 12, 2018.
On January 31, 2014, ENXP entered into the second supplement to its senior unsecured notes agreement and issued $15.0 million of senior unsecured notes (the “Tranche C notes”) with an original issue discount of 8%, or $1.2 million, to Highbridge and Apollo. These notes were to mature on December 12, 2018.
On March 27, 2014, ENXP entered into the third supplement to its senior unsecured notes agreement and issued $60.0 million of senior unsecured notes (the “Tranche D notes”) to Highbridge and Apollo. The Company issued an aggregate of $45.0 million of senior unsecured notes with an original issue discount of 4%, or $1.8 million, in the initial funding on March 27, 2014 and had an option, subject to achievement of certain conditions precedent, to issue additional notes in the aggregate amount of $15.0 million in future periods, but no later than September 30, 2014. The initial March 2014 funding of Tranche D notes were to mature on March 27, 2019.
In July 2014, the Company refinanced and replaced its senior unsecured notes, with the net proceeds of the convertible notes offering, along with the net proceeds from the senior secured term loan. The transactions were accounted for as an extinguishment of debt for accounting purposes. The Company incurred a loss on extinguishment of debt of approximately $75.5 million relating to a $52.6 million prepayment penalty and the expensing of $22.9 million of unamortized discounts and debt issuance costs.
In connection with the issuance of the Tranche A and D notes, the Company issued to Highbridge and Apollo warrants to purchase an aggregate of 340,353 shares of its mandatory convertible preferred stock at an exercise price of $0.01 per share. 269,231 shares related to the issuance of the Tranche A notes in April 2013 and 71,122 shares related to the issuance of the Tranche D notes in March 2014. To objectively determine the fair market value of these warrants, ENXP engaged a third party valuation specialist to determine the fair market value of the series A and B preferred stock on the issue date of April 8, 2013 and March 27, 2014, respectively. Based on the Probability-Weighted Expected Return (“PWERM”) approach, the fair value of our series A and B preferred stock, on a minority, non-marketable basis, as of April 8, 2013 and March 27, 2014 was determined to be $51.12 per share and $51.27 per share resulting in a fair value of $13.8 million and $3.6 million for the warrants issued, respectively. These amounts were recorded as a discount to the value of the notes. The fair value on these warrants were measured at a fair value on a non-recurring basis using Level 3 inputs. Each share of the preferred stock is convertible at the option of the holder prior to the Company’s initial public offering and will convert automatically upon completion of the initial public offering into one share of the Company’s common stock for an aggregate issuance of 340,353 common shares upon conversion of all preferred shares. To the extent not previously exercised, at the completion of the initial public offering, the warrants will automatically be exercised on a net basis for the number shares of the Company’s common stock calculated as the shares of preferred stock issuable upon exercise of the warrants that would have been converted less a number of shares equal to the aggregate exercise price divided by the initial public offering price per share.
F-26
Table of Contents
Term Loan
In August 2013, ENXP entered into an agreement with Highbridge and Apollo for a $75 million Term Loan. In July 2014, the Company terminated the Term Loan agreement. The Company had not drawn any amounts on the term loan prior to termination.
Subordinated Unsecured Note—Chesapeake Note
In connection with the Chesapeake acquisition during April 2013, ENXP issued an $18.0 million subordinated unsecured note to Chesapeake. The Chesapeake note matures on the earlier of (i) October 8, 2018, (ii) the closing of the Company’s initial public offering or (iii) six months after the date of repayment of the Company’s senior debt (as defined in the Chesapeake note) in full. The Chesapeake note bears interest at 10% per annum until the senior debt (as defined in the Chesapeake note) is paid in full and 15% thereafter. Until the senior debt (as defined in the Chesapeake note) is paid in full, all interest shall be paid in kind (“PIK”), with any such PIK interest being added to the principal balance of this note at the end of each quarter. The principal balance of this note plus all accrued and unpaid interest is expected to be paid within three business days after the maturity date. At December 31, 2014, including PIK interest, $21.3 million was payable on the Chesapeake note.
Convertible Notes
On July 22, 2014, contemporaneously with the closing of the Ft. Trinidad acquisition and the senior secured term loan, the Company issued $375 million of its 8.0% convertible subordinated notes due 2019 (the “Notes”) in a private placement transaction. The net proceeds of the Notes offering, along with the net proceeds from the senior secured term loan, were used to fund the Ft. Trinidad acquisition and to refinance and replace the Company’s senior unsecured notes.
The $375.0 million principal amount of Notes were issued net of $22.4 million debt origination costs and $74.7 million fair value of embedded derivative. The Notes contain a conversion feature allowing holders to convert all or part of the Notes into shares of the Company’s common stock upon the closing of a qualified public offering. The Notes also contain a put option feature allowing holders to require the Company to repurchase for cash all or a part of the outstanding Notes if the Company undergoes a change of control. The embedded features meet the definition of a derivative under U.S. GAAP and require bifurcation and are accounted for as a separate combined embedded derivative. Therefore, initially the embedded derivative was recorded on the balance sheet as a derivative liability at its estimated fair value of $74.7 million and created a discount on the Notes that will be amortized over the life of the Notes using the effective interest rate method. The fair value of the embedded derivative will be measured and recorded at fair value each subsequent reporting period and changes in fair value will be recognized in the statement of operations as a gain or loss on derivative. See Note 9—Derivative Financial Instruments and Note 10—Fair Value Measures for additional information on the fair value and gains or losses on the embedded derivative.
The Notes bear interest at a rate of 8.0% per annum subject to semi-annual increases of 0.50% beginning on July 1, 2015 if a preliminary prospectus under the Securities Act with a bona fide price range in connection with a qualified public offering (as defined below) has not been filed by each such date and, in each case, the qualified public offering has not priced within 60 days after the date of such scheduled interest rate increase.
Holders of the Notes may elect to convert their notes into shares of the Company’s common stock at a specified conversion price in connection with the closing of a qualified public offering. A qualified public offering is defined as the first public offering of the Company’s common stock in which the aggregate gross proceeds to the Company and any selling stockholders equals or exceeds $400.0 million and following which the Company’s common stock is listed on a U.S. national securities exchange.
F-27
Table of Contents
The number of shares of common stock issuable upon conversion of the Notes will be the greater of:
| • | the number of shares of common stock determined by dividing (1) the principal amount of the Notes converted by (2) a conversion price that is equal to a specified percentage of the public offering price per share in the qualified public offering that decreases over time, which percentage will be 90% assuming a qualified public offering is consummated on or before December 31, 2014; and |
| • | a number of shares of common stock that represents a percentage of the Company’s outstanding shares of common stock immediately prior to the consummation of a qualified public offering (giving effect to the conversion of the Notes and all other securities that are convertible into shares of the Company’s common stock, but before the issuance by the Company of shares in the qualified public offering) that is equal to (1) the principal amount of the Notes converted divided by (2) $900 million. |
Holders of the Notes may elect to convert their Notes during the period commencing on the first business day after the filing of a registration statement for a qualified public offering and ending on a date not less than 30 business days thereafter to be set by the Company. Following the completion of a qualified public offering, the Company intends to redeem any Notes not converted at a price equal to 100% of the principal amount of the Notes redeemed, plus accrued interest.
Holders of the Notes have certain registration rights with respect to the shares of common stock issuable upon conversion of the Notes, including piggyback registration rights that permit holders to sell up to an aggregate 36% of those shares of common stock in a qualified public offering.
The Company was in compliance with all debt covenants at December 31, 2014.
Senior Secured Term Loan
On July 22, 2014, contemporaneously with the closing of the Ft. Trinidad acquisition and the offering of the Notes, the Company entered into the agreement governing the senior secured term loan with a group of institutional lenders and borrowed $775.0 million under the senior secured term loan. The senior secured term loan matures on January 22, 2019 and provided for an original principal amount of $775.0 million issued at an original issue discount of 1.5%, or $11.6 million, and included debt issuance costs of approximately $16.2 million, including a 2.125% arrangement fee of $15.7 million, on $740.0 million of the principal amount. Subject to certain conditions, including obtaining the participation of existing or prospective lenders, the Company may incur incremental term loans in an amount up to $175.0 million. The proceeds from the senior secured term loan were used, together with the proceeds of the Notes, to pay the purchase price for the Ft. Trinidad acquisition and to refinance and replace the Company’s existing senior unsecured notes.
The Company’s wholly owned subsidiary, Energy & Exploration Partners, LLC (“ENXP LLC”), is the borrower under the senior secured term loan. The Company and each of ENXP LLC’s subsidiaries guarantee the obligations of ENXP LLC under the senior secured term loan. The Company’s obligations under the senior secured term loan are secured by a pledge of its equity interests in ENXP LLC and substantially all of ENXP LLC’s and its subsidiaries’ assets, including a perfected mortgage lien on oil and gas properties that represent at least 80% of the present value in the Company’s reserve report.
The senior secured term loan bears interest at variable rates, at the Company’s option, (x) based on the greater of (a) the London interbank offered rate times the statutory reserves and (b) 1% (in either case the “Adjusted LIBOR”), plus 6.75%, or (y) the greatest of (a) the prime rate, (b) the federal funds effective rate plus 1/2 of 1%, and (c) the Adjusted LIBOR for one month, plus 5.75%. The Company is required to repay the senior secured term loan quarterly, in the principal amount of $1.9 million, plus accrued and unpaid interest, with the balance due at maturity.
F-28
Table of Contents
The Company may prepay the senior secured term loan, in whole or in part, at any time subject to an applicable premium (i) in year 1, of 2% of the principal repaid, (ii) in year 2, of 1% of the principal repaid, and (iii) on and after the second anniversary of the closing date, no premium. Subject to certain exceptions, the Company is required to prepay any loans outstanding under the senior secured term loan by an amount equal to: (x) 100% of the net cash proceeds of certain asset dispositions, (y) 50% of the excess cash flow for any fiscal year, subject to reduction to 25% or 0% in the event certain leverage ratios are achieved and (z) 100% of the net cash proceeds of the issuance of unpermitted debt. The Company and ENXP LLC may also repurchase the senior secured term loan from one or more lenders in the open market or pursuant to Dutch auction procedures, subject to the satisfaction of certain conditions.
Subject to certain exceptions and baskets, the agreement governing the senior secured term loan contains customary restrictive covenants that, among other things
| • | limit the Company’s incurrence of additional indebtedness, other than the Chesapeake note, the Convertible note, any intercompany indebtedness currently existing and any permitted refinance indebtedness other than certain exceptions; |
| • | prohibit the granting of liens, other than certain permitted liens; |
| • | limit the Company’s ability to make or permit to remain outstanding any investments in or to any person subject to certain exceptions; |
| • | prohibit mergers, consolidations and sales of all or a part of the Company’s assets, or issue equity interest in any subsidiary, or purchase, lease or otherwise acquire all or any substantial part of the assets of any other persons subject to certain exceptions; |
| • | prohibit the declaration or agreement to declare or make directly or indirectly, any restricted payment, or incur any obligation to do so subject to certain provisions and exceptions; |
| • | require the Company to meet a maximum leverage ratio of (x) 4.50 to 1.00 for the fiscal quarters ending December 31, 2014 through and including September 30, 2015 and (y) 3.00 to 1.00 for the fiscal quarter ending December 31, 2015 and each fiscal quarter thereafter, tested on a quarterly basis; and |
| • | require the Company to enter into commodity derivative instruments for a minimum of 40% and maximum of 80% of anticipated production from its proved reserves. |
The agreement provides for customary events of default, subject to applicable grace periods. The Company was in compliance with all debt covenants at December 31, 2014.
Debt Issuance Costs
ENXP capitalizes certain direct costs associated with the issuance of long-term debt and amortizes to interest expense using the effective interest method such costs over the lives of the respective debt. During 2014, the Company incurred $38.9 million in costs associated with the issuance of its outstanding debt and expensed $4.6 million of debt issuance costs. At December 31, 2013 and 2014, the Company had approximately $1.8 million and $36.1 million, respectively, of debt issuance costs remaining that are being amortized over the lives of the respective debt agreement terms.
8. Share Based Compensation
On August 22, 2012, the Company’s sole director approved the ENXP 2012 Stock Incentive Plan (“the Plan”). The Plan enables the Board of Directors to award incentive and non-qualified stock options, restricted stock, unrestricted stock and restricted stock units to the Company’s officers, employees, directors, consultants, and key persons, including prospective employees conditioned on their employment. The maximum number of shares that may be issued under the Plan is 225,000, and as of December 31, 2014, 81,891 shares were available for future grants.
F-29
Table of Contents
During the year 2014, the terms on the Tranche 1, 2, 3 and 4 awards were modified and additional shares (Tranche 5) were granted. The modification included an extension of vesting dates and a change to the percentage of shares vesting at each vesting date. The Company did not incur any incremental costs related to this modification. The following table summarizes the number of share awards and vesting dates for restricted shares granted:
| Tranche 1 | Tranche 2 | Tranche 3 | Tranche 4 | Tranche 5 | ||||||
| Shares awarded |
50,000 | 65,000 | 17,900 | 5,130 | 5,079 | |||||
| First Vesting Date |
August 15, 2014 | IPO Date | IPO Date | IPO Date | IPO Date | |||||
| Second Vesting Date |
— | — | First IPO Anniversary | First IPO Anniversary | First IPO Anniversary | |||||
| Third Vesting Date |
— | — | — | — | Second IPO Anniversary |
Compensation recognized for grants vesting under the Plan was $3.9 million, $9.7 million and $1.5 million for the years ended December 31, 2012, 2013 and 2014, respectively. During the year ended December 31, 2014, $1.0 million of the recognized compensation was recorded as share-based compensation and included in “General and administrative expenses” in the condensed consolidated statement of operations and $0.5 million of the recognized compensation was recorded a capitalized employee related internal costs related to acquisition development and exploration activity and initially included in “Unproved oil and natural gas properties” on the condensed consolidated balance sheet. Once unevaluated properties are evaluated all related unevaluated property costs, including capitalized share based compensation, are transferred into “Proved oil and natural gas properties” to be amortized.
Total unrecognized compensation expense related to unvested options expected to be recognized over the remaining weighted vesting period of 16 months was $0.5 million at December 31, 2014.
A summary of the status of our non-vested shares issued under the Plan and the change during the year ended December 31, 2014 is presented below:
| Number of Shares |
Weighted Average Grant-Date Fair Value |
|||||||
| Non-vested at December 31, 2012 |
125,000 | $ | 127.00 | |||||
| Granted |
25,530 | 41.54 | ||||||
| Vested |
— | — | ||||||
| Cancelled |
— | — | ||||||
| Forfeited |
(12,500 | ) | 127.00 | |||||
|
|
|
|
|
|||||
| Non-vested at December 31, 2013 |
138,030 | 111.19 | ||||||
| Granted |
5,079 | 25.93 | ||||||
| Vested |
(50,000 | ) | 127.00 | |||||
| Cancelled |
— | — | ||||||
| Forfeited |
— | — | ||||||
|
|
|
|
|
|||||
| Non-vested at December 31, 2014 . . |
93,109 | 98.05 | ||||||
|
|
|
|
|
|||||
9. Derivative Financial Instruments
Embedded Derivative Related to Notes
The Notes contain a conversion feature allowing holders to convert all or part of the Notes into shares of the Company’s common stock upon the closing of a qualified public offering. The Notes also contain a put option feature allowing holders to require the Company to repurchase for cash all or part of the outstanding Notes if the Company undergoes a change of control. These embedded features require bifurcation and are accounted for as a separate combined embedded derivative. The embedded derivative is carried on the consolidated balance sheet at
F-30
Table of Contents
fair value as a liability and changes in fair value are recorded as a gain or loss in the statement of operations in the period in which they occur.
Commodity Derivative Contracts
ENXP initiated a commodity derivative policy during 2013 to utilize various derivative instruments to hedge its exposure to oil and natural gas price fluctuations. Additionally, ENXP’s Note purchase agreement and senior secured term loan agreement currently require the Company to enter into commodity derivative instruments for a minimum of 40% and maximum of 80% of anticipated production from its proved developed producing reserves. During 2013 and 2014, the Company entered into arrangements for fixed price swaps and costless collars (puts and calls) to hedge future oil and natural gas prices and comply with its debt instruments’ covenant requirements. ENXP has not designated any of its derivative instruments as hedges; therefore, the derivatives are carried at fair value on the consolidated balance sheets as assets or liabilities and all changes in fair value are recorded as gains and losses in the statements of operations in the periods in which they occur. See Note 10—Fair Value Measures for information on the fair value of the Company’s derivative instruments.
ENXP’s commodity derivative instruments expose the Company to credit risk in the event of nonperformance by counterparties. It is the Company’s policy to enter into commodity derivative contracts only with counterparties that are creditworthy financial institutions deemed by management as competent and competitive market makers. ENXP evaluates the credit standing of such counterparties by reviewing their credit rating. The counterparties to the Company’s current derivative agreements have investment grade ratings.
At December 31, 2014, ENXP had the following open crude oil derivative contracts:
| Contract Price ($/Bbl or MMBtu) Weighted Average Price |
||||||||||||||||||||||||||||
| Year |
Months | Type of Contract |
Pricing Index |
Volume (Bbl/d or MMBtu/d) |
Swap | Floor | Ceiling | |||||||||||||||||||||
| Crude Oil |
||||||||||||||||||||||||||||
| 2015 |
Jan – Dec | Collar | LLS | 200 | $ | 81.00 | $ | 98.43 | ||||||||||||||||||||
| 2015 |
Jan – Dec | Collar | WTI | 3,650 | $ | 79.06 | $ | 99.39 | ||||||||||||||||||||
| 2015 |
Jan – Dec | Swap | WTI | 2,500 | $ | 67.80 | ||||||||||||||||||||||
| 2016 |
Jan – Dec | Collar | LLS | 200 | $ | 71.75 | $ | 100.43 | ||||||||||||||||||||
| 2016 |
Jan – Dec | Swap | WTI | 2,500 | $ | 67.80 | ||||||||||||||||||||||
| 2016 |
Jan – Dec | Collar | WTI | 2,500 | $ | 79.25 | $ | 98.96 | ||||||||||||||||||||
| 2017 |
Jan – Dec | Swap | WTI | 2,500 | $ | 67.20 | ||||||||||||||||||||||
| 2018 |
Jan – Dec | Swap | WTI | 2,500 | $ | 67.20 | ||||||||||||||||||||||
Between January 1st and April 7th, 2015, we received a total of $34.5 million in cash from the settlement of restructuring of several of our commodity derivative positions.
F-31
Table of Contents
Pursuant to the accounting standard that permits netting of assets and liabilities where the right of offset exists, ENXP presents the fair value of oil and natural gas derivative financial instruments on a net basis by counterparty and commodity. The gross values, prior to netting of assets and liabilities subject to master netting arrangements, and the net amounts presented in the consolidated balance sheets as of December 31, 2013 and December 31, 2014 are as follows (in thousands):
| As of December 31, 2013 | ||||||||||||
| Balance Sheet Location |
Gross Amounts Recognized |
Gross Amounts Offset on the Balance Sheets |
Net Amounts Presented on the Balance Sheets |
|||||||||
| Assets |
||||||||||||
| Current asset—Derivative asset |
$ | 33 | $ | (33 | ) | $ | — | |||||
| Long-term assets—Derivative asset |
401 | (401 | ) | — | ||||||||
|
|
|
|
|
|
|
|||||||
| Total |
434 | (434 | ) | — | ||||||||
| Liabilities |
||||||||||||
| Current liability—Derivative liability |
576 | (33 | ) | 543 | ||||||||
| Long-term liability—Derivative liability |
415 | (401 | ) | 14 | ||||||||
|
|
|
|
|
|
|
|||||||
| Total |
991 | (434 | ) | 557 | ||||||||
|
|
|
|
|
|
|
|||||||
| Net liability |
$ | 557 | $ | — | $ | 557 | ||||||
|
|
|
|
|
|
|
|||||||
| As of December 31, 2014 | ||||||||||||
| Balance Sheet Location |
Gross Amounts Recognized |
Gross Amounts Offset on the Balance Sheets |
Net Amounts Presented on the Balance Sheets |
|||||||||
| Assets |
||||||||||||
| Current asset—Derivative asset |
$ | 42,726 | $ | (498 | ) | $ | 42,228 | |||||
| Long-term assets—Derivative asset |
28,207 | (7,334 | ) | 20,873 | ||||||||
|
|
|
|
|
|
|
|||||||
| Total |
70,933 | (7,832 | ) | 63,101 | ||||||||
| Liabilities |
||||||||||||
| Current liability—Derivative liability |
498 | (498 | ) | — | ||||||||
| Long-term liability—Derivative liability(1) |
7,334 | (7,334 | ) | — | ||||||||
|
|
|
|
|
|
|
|||||||
| Total |
7,832 | (7,832 | ) | — | ||||||||
|
|
|
|
|
|
|
|||||||
| Net asset |
$ | 63,101 | $ | — | $ | 63,101 | ||||||
|
|
|
|
|
|
|
|||||||
| (1) | Excludes $36.7 million related to embedded derivative liability not subject to a master netting agreement. |
F-32
Table of Contents
The following table summarizes the location and amounts of the Company’s realized gains and losses and changes in fair value of derivatives in the consolidated statements of operations (in thousands):
| For the year ended December 31, |
||||||||||||||
| Derivatives not designated as hedging contracts |
Location of gain or (loss) recognized in |
2012 | 2013 | 2014 | ||||||||||
| Oil Contracts: |
||||||||||||||
| Change in fair value of commodity contracts |
Other income (expense)—Gain (loss) on derivatives |
$ | — | $ | (557 | ) | $ | 63,657 | ||||||
| Realized loss on commodity contracts |
Other income (expense)—Gain (loss) on derivatives |
— | (105 | ) | 4,526 | |||||||||
|
|
|
|
|
|
|
|||||||||
| Total gain (loss) on derivatives—oil |
$ | — | $ | (662 | ) | $ | 68,183 | |||||||
| Natural gas contracts: |
||||||||||||||
| Change in fair value of commodity contracts |
Other income (expense)—Gain (loss) on derivatives |
$ | — | $ | — | $ | — | |||||||
| Realized loss on commodity contracts |
Other income (expense)—Gain (loss) on derivatives |
— | — | 19 | ||||||||||
|
|
|
|
|
|
|
|||||||||
| Total gain (loss) on derivatives—gas |
$ | — | $ | — | $ | 19 | ||||||||
|
|
|
|
|
|
|
|||||||||
| Embedded derivative: |
||||||||||||||
| Change in fair value of embedded derivative |
Other income (expense)—Gain (loss) on derivatives |
$ | — | $ | — | $ | 37,994 | |||||||
|
|
|
|
|
|
|
|||||||||
| Total loss on embedded derivative |
— | — | $ | 37,994 | ||||||||||
| Total gain (loss) on derivatives |
$ | — | $ | (662 | ) | $ | 106,196 | |||||||
|
|
|
|
|
|
|
|||||||||
10. Fair Value Measures
The Company follows a framework for measuring fair value, which outlines a fair value hierarchy based on the quality of inputs used to measure fair value and enhances disclosure requirements for fair value measurements.
Fair value is defined as the price that would be received to sell an asset or paid to transfer a liability in an orderly transaction between market participants at the measurement date. The Company uses market data, or assumptions that market participants would use, to value the asset or liability. These assumptions include market risk and the risks inherent in the inputs to the valuation technique. These inputs can be readily observable, market corroborated or generally unobservable.
The Company primarily applies the market approach for recurring fair value measurements and attempt to use the best available information. Accounting standards establish a fair value hierarchy that prioritizes the inputs used to measure fair value. This hierarchy gives the highest priority to unadjusted quoted prices in active markets for identical assets or liabilities, a Level 1 measurement, and lowest priority to unobservable inputs, a Level 3 measurement. The three levels of fair value hierarchy are as follows:
| • | Level 1 inputs: Unadjusted quoted prices in active markets for identical assets or liabilities accessible to the reporting entity at the measurement date. At December 31, 2012, 2013 and 2014, the Company had no Level 1 measurement. |
| • | Level 2 inputs: Pricing inputs other than quoted prices in active markets included in Level 1, which are either directly or indirectly observable as of the reporting date. Level 2 includes those financial instruments that are valued using models or other valuation methodologies. These models are primarily industry-standard models that consider various assumptions, including quoted forward prices for commodities, time value, volatility factors and current market and contractual prices for the underlying |
F-33
Table of Contents
| instruments, as well as other relevant economic measures. Where observable inputs are available, directly or indirectly, for substantially the full term of the asset or liability, the instrument is categorized in Level 2. |
| • | Level 3 inputs: Unobservable inputs for the asset or liability used to measure fair value to the extent that observable inputs are not available, thereby allowing for situations in which there is little, if any, market activity for the asset or liability at measurement date. These inputs may be used with internally developed methodologies that result in management’s best estimate of fair value. |
Asset and Liabilities Measured at Fair Value on a Recurring Basis
Commodity derivative contracts—ENXP accounts for commodity derivatives at fair value on a recurring basis. The Company’s commodity derivative instruments consist of swaps and costless collars. See Note 9—Derivative Financial Instruments for additional information on the Company’s derivatives. At December 31, 2013 and 2014, the Company estimated the fair value of its derivative instruments based on published forward commodity price curves as of the date of the estimate, less discounts to recognize present values using a pricing model which also considered market volatility, counterparty credit risk and additional criteria in determining discount rates. The discount rate used in the discounted cash flow projections was based on published LIBOR rates, Eurodollar futures rates and interest swap rates. The counterparty credit risk was determined by calculating the difference between the derivative counterparty’s bond rate and published bond rates. The Company considers these inputs Level 2 assumptions.
Embedded derivative—The Company’s Notes include embedded features that require bifurcation and are accounted for as a separate combined embedded derivative. See Note 7—Notes Payable for additional information on the embedded derivative. The Company has estimated the fair market value of the embedded derivatives of the Notes as the difference between the fair market value of the Notes with all contractual features and the fair market value of the Notes without the contractual features associated with the embedded derivative, in both cases using relevant market data. In the case of the fair market value of the Notes with all contractual features, the Hybrid Method was used utilizing probability-weighted expected return method combined with the option price method. In the case of the fair market value of the Notes without those contractual features associated with the embedded derivative, a discounted cash flow approach was used. The key valuation assumptions used consist of the Company’s equity value, Management’s estimate of various exit scenarios and their probabilities, and expected volatility based on peer companies and adjusted for leverage. The Company considers these inputs Level 3 assumptions.
F-34
Table of Contents
The following tables summarize by level within the fair value hierarchy, the Company’s financial assets and liabilities that were accounted for at fair value on a recurring basis as of December 31, 2013 and 2014 (in thousands):
| Fair Value Measurements Using: | ||||||||||||||||
| Quoted Prices in Active Markets (Level 1) |
Significant Other Observable Inputs (Level 2) |
Significant Unobservable Inputs (Level 3) |
Total | |||||||||||||
| December 31, 2013 |
||||||||||||||||
| Liabilities: |
||||||||||||||||
| Commodity derivative contracts—current(1) |
$ | — | $ | (543 | ) | $ | — | $ | (543 | ) | ||||||
| Commodity derivative contracts—long-term(1) |
— | (14 | ) | — | (14 | ) | ||||||||||
|
|
|
|
|
|
|
|
|
|||||||||
| Total Liabilities |
$ | — | $ | (557 | ) | $ | — | $ | (557 | ) | ||||||
|
|
|
|
|
|
|
|
|
|||||||||
| December 31, 2014 |
||||||||||||||||
| Assets: |
||||||||||||||||
| Commodity derivative contracts—current(1) |
$ | — | $ | 42,228 | $ | — | $ | 42,228 | ||||||||
| Commodity derivative contracts—long-term(1) |
— | 20,873 | — | 20,873 | ||||||||||||
|
|
|
|
|
|
|
|
|
|||||||||
| Total Assets |
$ | — | $ | 63,101 | $ | — | $ | 63,101 | ||||||||
|
|
|
|
|
|
|
|
|
|||||||||
| Liabilities: |
||||||||||||||||
| Embedded derivative—long-term |
$ | — | $ | — | $ | (36,697 | ) | $ | (36,697 | ) | ||||||
|
|
|
|
|
|
|
|
|
|||||||||
| Total Liabilities |
$ | — | $ | — | $ | (36,697 | ) | $ | (36,697 | ) | ||||||
|
|
|
|
|
|
|
|
|
|||||||||
| (1) | Since the Company does not use hedge accounting for its commodity derivative contracts, any gains and losses on its assets and liabilities are included in “Gain (loss) on derivatives” in the accompanying condensed consolidated statements of operations. |
The following table summarizes the change in fair value of the Company’s embedded derivative measured using significant Level 3 unobservable inputs for the year ended December 31, 2014 (in thousands):
| Year Ended December 31, 2014 |
||||
| Beginning of period . |
$ | — | ||
| Initial recognition |
74,691 | (1) | ||
| Change in fair value of derivative . |
(37,994 | ) | ||
|
|
|
|||
| End of period |
$ | 36,697 | ||
|
|
|
|||
| Change in fair value included in Gain (loss) on derivatives related to derivative still held at the end of the reporting period |
$ | (37,994 | ) | |
|
|
|
|||
| (1) | Embedded derivative bifurcated from the Notes at the date of issuance. See Note 7—Notes Payable. |
Asset and Liabilities Measured at Fair Value on a Nonrecurring Basis
The Company estimates the fair value of its ARO based on historical costs, discounted cash flow projections using numerous estimates, assumptions and judgments regarding such factors as the existence of a legal obligation for an ARO, amounts and timing of settlements, the credit-adjusted risk-free rate to be used, inflation rates as well as management’s expectation of future cost environments. As there are no corroborating market activity to support the assumptions, the Company has designated these liabilities as Level 3. A reconciliation of the beginning and ending balances of the Company’s ARO is presented in Note 6—Asset Retirement Obligations.
F-35
Table of Contents
Other Fair Value Measurements
ENXP has other financial instruments consisting primarily of cash, cash equivalents, short-term receivables and payables that approximate fair value due to the nature of the instrument and the relative short maturities.
The Company estimates the fair value of its proved oil and natural gas properties acquired based on future commodity prices, projections of estimated quantities of oil and natural gas reserves, expectations for the timing and amount of future development costs, operating costs, abandonment costs, projections of future rates of production, expected recovery rates and risks adjusted discount rates. The Company has designated these inputs as Level 3. See Note 3—Acquisitions for additional information on the fair value of acquired proved oil and natural gas properties.
11. Income Taxes
Income tax benefit (provision)
The Company estimates its federal and state income tax benefit (provision) based on current tax law. The reported tax benefit (provision) differs from the amounts currently receivable or payable because certain income and expense items are recognized in different time periods for financial reporting purposes than for income tax purposes. The following is a summary of the Company’s benefit (provision) for income taxes (in thousands):
| Year Ended December 31, |
||||||||||||
| 2012 | 2013 | 2014 | ||||||||||
| Current |
||||||||||||
| Federal |
$ | (8,297) | $ | 8,073 | $ | (161) | ||||||
| State |
(233) | 20 | (234) | |||||||||
|
|
|
|
|
|
|
|||||||
| (8,530) | 8,093 | (395) | ||||||||||
|
|
|
|
|
|
|
|||||||
| Deferred |
||||||||||||
| Federal |
1,052 | (838) | (183) | |||||||||
| State |
64 | (278) | 183 | |||||||||
|
|
|
|
|
|
|
|||||||
| 1,116 | (1,116) | — | ||||||||||
|
|
|
|
|
|
|
|||||||
| Income tax benefit (expense)(1) |
$ | (7,414) | $ | 6,977 | $ | (395) | ||||||
|
|
|
|
|
|
|
|||||||
| (1) | Excludes $1.6 million of tax penalties and interest incurred during the year ended December 31, 2013 related to delinquent tax filings for the 2012 tax year and $1.4 million benefit related to the reversal of a portion of the accrued tax penalties and interest resulting from an abatement granted by the internal revenue service during the year ended December 31, 2014. |
F-36
Table of Contents
The Company’s income tax benefit (provision) is based on its results of operations. The Company has recorded deferred federal and state income tax assets and liabilities attributable to the differences in the basis in its assets for U.S. GAAP and for federal and state taxation purposes upon our conversion to a C Corporation. A reconciliation of the statutory federal tax provision to the Company’s income tax provision in the accompanying financial statements is as follows (in thousands):
| Year Ended December 31, |
||||||||||||
| 2012 | 2013 | 2014 | ||||||||||
| Statutory federal benefit (provision) (35%) |
$ | (5,653) | $ | 10,060 | $ | 2,027 | ||||||
| Statutory state income tax provision, net of federal tax benefit |
(114) | (168) | (420) | |||||||||
| Federal tax provision attributed to period we were not directly subject to federal taxation |
(464) | — | — | |||||||||
| Surtax exemption on NOL carry back |
— | (160) | (161) | |||||||||
| Change in valuation allowance . |
(2,201) | (129) | ||||||||||
| Recognition of temporary differences upon change in tax status |
(1,161) | — | — | |||||||||
| Tax effect of expenses not deductible for federal or state taxation |
(22) | (554) | (1,712) | |||||||||
|
|
|
|
|
|
|
|||||||
| Income tax benefit (expense) before tax penalties and interests |
$ | (7,414) | $ | 6,977 | $ | (395) | ||||||
| Penalties and interests(1) |
— | (1,626) | 1,375 | |||||||||
|
|
|
|
|
|
|
|||||||
| Income tax benefit (expense) |
$ | (7,414) | $ | 5,351 | $ | 980 | ||||||
|
|
|
|
|
|
|
|||||||
| (1) | Penalties and interest on 2012 late tax filing for the year ended December 31, 2013 and reversal of a portion of the accrued penalties and interest on 2012 late tax filing resulting from an abatement granted by the internal revenue service during the year ended December 31, 2014. |
The Company recognizes interest and penalties accrued to unrecognized benefits in income tax benefit (expense) in its consolidated statements of operations. For the years ended December 31, 2012, 2013, and 2014, the Company recognized no interest and penalties related to unrecognized benefits.
As of December 31, 2014, the Company has available, to reduce future taxable income, a United States net operating loss carryforward (NOLs) of approximately $173.6 million, portions of which begin to expire in the year 2033.
The Company assesses the recoverability of its deferred tax assets each period by considering whether it is more likely than not that all or a portion of the deferred tax assets will not be realized. The Company considers all available evidence (both positive and negative) in determining whether a valuation allowance is required and adjusts the valuation allowance as required based on information available together with managements judgment regarding the appropriate level of valuation allowance to be provided against existing deferred tax assets. At the end of the year ended December 31, 2014, the Company has increased the valuation allowance by $0.1 million based on current expectations related to realizability of its net deferred tax assets.
On September 13, 2013, the United States Treasury Department and the Internal Revenue Service issued final tangible property regulations (the tangible property regulations) under provisions that include IRC Sections 162, 167 and 263(a). The tangible property regulations apply to amounts paid to acquire, produce or improve tangible property, as well as dispositions of such property. The general effective date of the tangible property regulations are for tax years beginning on or after January 1, 2014. Based on the Company’s analysis to date management does not anticipate the impacts of the tangible property regulations to be material to the Company’s consolidated financial position or its results of operations, or both.
F-37
Table of Contents
Deferred Tax Assets/Liabilities
The tax effects of temporary differences between reported earnings and taxable earnings consisted of the following (in thousands):
| December 31, | ||||||||||||
| 2012 | 2013 | 2014 | ||||||||||
| Deferred Tax Assets (liabilities): |
||||||||||||
| Current |
||||||||||||
| Asset retirement obligations |
6 | 234 | 88 | |||||||||
| Derivative gains and losses |
— | 190 | (15,054 | ) | ||||||||
| Other (net)—accrued expenses |
(145 | ) | (103 | ) | (157 | ) | ||||||
|
|
|
|
|
|
|
|||||||
| Current deferred tax assets (liabilities), |
(139 | ) | 321 | (15,123 | ) | |||||||
|
|
|
|
|
|
|
|||||||
| Valuation allowance |
— | (50 | ) | (8 | ) | |||||||
|
|
|
|
|
|
|
|||||||
| Current deferred tax assets (liabilities) |
(139 | ) | 271 | (15,131 | ) | |||||||
|
|
|
|
|
|
|
|||||||
| Non-Current |
||||||||||||
| Asset retirement obligations |
— | 227 | (82 | ) | ||||||||
| Derivative gains and losses |
— | 5 | (20,739 | ) | ||||||||
| Oil & gas properties |
533 | (10,827 | ) | (24,953 | ) | |||||||
| Net operating loss carryforwards |
— | 8,297 | 60,756 | |||||||||
| Share-based compensation |
722 | 4,118 | 2,400 | |||||||||
| Other (net) |
— | 60 | 395 | |||||||||
|
|
|
|
|
|
|
|||||||
| Non-current deferred tax assets, net |
1,255 | 1,880 | 17,777 | |||||||||
|
|
|
|
|
|
|
|||||||
| Valuation allowance |
— | (2,151 | ) | (2,646 | ) | |||||||
|
|
|
|
|
|
|
|||||||
| Non-current deferred tax assets (liabilities) |
1,255 | (271 | ) | 15,131 | ||||||||
|
|
|
|
|
|
|
|||||||
| Total deferred tax assets |
1,116 | — | — | |||||||||
|
|
|
|
|
|
|
|||||||
12. Earnings Per Share
Earnings (Loss) Per Share. The two-class method of computing net earnings per share is required for those entities that have participating securities. The two-class method is an earnings allocation formula that determines net earnings per share for participating securities according to dividends declared (or accumulated) and participation rights in undistributed earnings. ENXP’s restricted shares of common stock, See Note 8—Share Based Compensation for additional discussion, are participating securities under ASC 260, Earnings Per Share, because they may participate in undistributed earnings with common stock.
F-38
Table of Contents
The following table shows the computation of basic and diluted net loss per share for the years ended December 31, 2012, 2013 and 2014 (in thousands, except for share and per share amounts):
| Year Ended December 31, | ||||||||||||
| 2012 | 2013 | 2014 | ||||||||||
| Net gain (loss) |
$ | 8,734 | $ | (21,767 | ) | $ | (6,187 | ) | ||||
|
|
|
|
|
|
|
|||||||
| Weighted average number of shares used to calculate basic and per share: |
||||||||||||
| Weighted average number of unrestricted outstanding |
397,500 | 372,500 | 422,500 | |||||||||
| Effect of unvested restricted stock awards |
36,687 | 132,296 | 89,296 | |||||||||
|
|
|
|
|
|
|
|||||||
| Denominator for basic loss per common share |
434,187 | 504,796 | 511,796 | |||||||||
| Dilutive effect of warrants(1) |
— | — | — | |||||||||
|
|
|
|
|
|
|
|||||||
| Denominator for diluted loss per common share |
434,187 | 504,796 | 511,796 | |||||||||
|
|
|
|
|
|
|
|||||||
| Net gain (loss) per common share: |
||||||||||||
| Basic |
$ | 20.12 | $ | (43.12 | ) | $ | (12.09 | ) | ||||
| Diluted |
$ | 20.12 | $ | (43.12 | ) | $ | (12.09 | ) | ||||
| (1) | The potentially dilutive impact of the warrants to purchase 196,944 and 323,595 shares of our mandatory redeemable preferred stock for the years ended December 31, 2013 and 2014, respectively, were excluded from this calculation as they were antidilutive. |
13. Commitments and Contingencies
The Company had the following contractual obligations and commitments as of December 31, 2014 (in thousands):
| Obligations and Commitments Due By Period | ||||||||||||||||||||||||||||
| Total | 2015 | 2016 | 2017 | 2018 | 2019 | Thereafter | ||||||||||||||||||||||
| Convertible Notes |
$ | 375,000 | $ | — | $ | — | $ | — | $ | — | $ | 375,000 | $ | — | ||||||||||||||
| Senior Secured Term Loan |
771,125 | 7,750 | 7,750 | 7,750 | 7,750 | 740,125 | — | |||||||||||||||||||||
| Subordinated Unsecured Chesapeake note(1) |
30,798 | — | — | — | 30,798 | — | — | |||||||||||||||||||||
| Other contractual obligations(2) |
8,273 | 6,241 | 1,894 | 101 | 37 | — | — | |||||||||||||||||||||
|
|
|
|
|
|
|
|
|
|
|
|
|
|
|
|||||||||||||||
| Total contractual obligations |
$ | 1,185,196 | $ | 13,991 | $ | 9,644 | $ | 7,851 | $ | 38,585 | $ | 1,115,125 | $ | — | ||||||||||||||
|
|
|
|
|
|
|
|
|
|
|
|
|
|
|
|||||||||||||||
| (1) | Includes $12.8 million of interest paid or to be paid in kind. |
| (2) | Other contractual obligations include operating lease obligations related to office space, certain vehicles, and office equipment, and commitments for development of utility infrastructure. |
Rental expense pursuant to office leases amounted to $0.2 million, $0.3 million and $0.5 million for the years ended December 31, 2012 , 2013 and 2014, respectively. Other contractual obligations contain various expiration dates through 2019.
Litigation
ENXP, from time to time, is involved in various claims, lawsuits, and disputes with third parties, actions involving allegations of fraud, discrimination, or breach of contract incidental to operations of its business. Except for the matter described below, the Company is not currently involved in any litigation which management believes could have a materially adverse effect on its financial condition or results of operations.
F-39
Table of Contents
On February 2, 2015, T.B. Farms, Ltd., a Texas limited liability corporation (“T.B. Farms”), filed a petition in the 278th Judicial District Court for Madison County, Texas against Energy and Exploration Partners Operating, L.P., a wholly owned subsidiary of the Company (“ENXP Operating”), concerning a 122.5 acre oil and gas lease located in Madison County, Texas (the “Lease”) in which ENXP Operating owns an operating interest. T. B. Farms alleges that the Lease has terminated due to cessation in production. T.B Farms seeks a declaratory judgement that the Lease has terminated and that all the mineral interests held subject to the Lease have reverted to T.B. Farms. The suit seeks unspecified money damages, attorneys’ fees and costs of court. ENXP Operating has filed a response denying the allegations made by T.B. Farms. No trial date has been set, and the parties are now pursuing discovery. The Company believes this suit is without merit and intends to defend it vigorously.
14. Related Party Transactions
On December 1, 2013, the Company entered into a joint operating agreement with Energy & Exploration Partners, LP for the purpose of developing two Eaglebine wells, the Su-Ling #1 and the Bonanza # IH. Energy & Exploration Partners, LP invested $200,000 in Su-Ling #1 and $400,000 in Bonanza #lH, with its working interest percentage in each well equal to the amount of the respective investment divided by the drilling and completion cost for the well. B. Hunt Pettit, the Company’s President, Chief Executive Officer and director is also the sole limited partner of Energy & Exploration Partners, LP and the sole member of its general partner, Septa Holdings LLC. Prior to entering into the joint operating agreement with Energy & Exploration Partners, LP, the Company’s board of directors approved the transaction with a view that there would be no further joint investments in operations with any of its officers, directors or employees.
During December 2014, the Company received a refundable deposit of $1.1 million from an entity controlled by, for the benefit of, B. Hunt Pettit related to a transaction that was not pursued. The deposit was refunded during April 2015.
15. Subsequent Events
Management has evaluated subsequent events through April 29, 2015, the date these condensed consolidated financial statements were available to be issued. No events or transactions other than those already described in these financial statements have occurred subsequent to the balance sheet date that might require recognition or disclosure in the condensed consolidated financial statements.
16. Supplemental oil and natural gas reserves and standardized measure information (Unaudited)
General
Prior to the first quarter of 2012, the Company was primarily engaged in the purchase and sale of leasehold acreage, and did not recognize reserve quantities or production. However, during 2012 the Company adopted a business strategy and commenced participation in drilling and producing activities that resulted in proved reserves and production during the years ended December 31, 2013 and 2014.
Geographic Area of Operation
The Company’s proved reserves are located within the United States onshore, and the following disclosures about costs incurred, results of operations and proved reserves are on a total-company basis.
F-40
Table of Contents
Capitalized Costs
The total amount of capitalized costs related to oil and natural gas producing activities and the total amount of related accumulated depletion, depreciation and accretion are as follows (in thousands):
| As of December 31, | ||||||||
| 2013 | 2014 | |||||||
| Capitalized Costs |
||||||||
| Unproved Properties(1) |
$ | 89,086 | $ | 80,937 | ||||
| Proved Properties(1)(2) |
158,955 | 1,100,203 | ||||||
|
|
|
|
|
|||||
| 248,041 | 1,181,140 | |||||||
| Accumulated depletion, depreciation and amortization(2) |
(19,368 | ) | (84,999 | ) | ||||
|
|
|
|
|
|||||
| $ | 228,673 | $ | 1,096,141 | |||||
|
|
|
|
|
|||||
| (1) | Costs associated with unproved properties relates to the Company’s costs in leasehold interests. During the years ended December 31, 2013 and 2014, the Company recognized leasehold impairment expense of $18.5 million and $27.3 million, respectively, and transferred the impairment costs from unproved properties to proved properties. |
| (2) | For the periods ended December 31, 2013 and 2014, the Company performed the full-cost ceiling test in accordance with the full-cost method of accounting to determine if its proved properties exceeded the ceiling limitation. As a result, the Company recognized full-cost ceiling impairments of $8.4 million during the year ended December 31, 2013. The Company did not recognize full-cost ceiling impairment during the year ended December 31, 2014. |
Capitalized Costs, Not Subject to Amortization
Costs not subject to amortization relate to unproved properties which are excluded from amortizable capital costs until it is determined that proved reserves can be assigned to such properties or until such time as the Company has made an evaluation that impairment has occurred. Subject to industry conditions, evaluation of most of these properties is expected to be completed within one to five years. The following table provides a summary of costs that are not being amortized as of December 31, 2014, by the year in which the costs were incurred (in thousands):
| Year Incurred | As of December 31, 2014 |
|||||||||||||||||||
| 2011
& Prior |
2012 | 2013 | 2014 | |||||||||||||||||
| Costs excluded from amortization by year incurred: |
||||||||||||||||||||
| Acquisition costs |
$ | — | $ | 2,696 | $ | 37,392 | $ | 17,610 | $57,698 | |||||||||||
| Exploration costs. . |
— | — | 363 | 8,114 | 8,477 | |||||||||||||||
| Capitalized interest |
— | 58 | 3,485 | 11,219 | 14,762 | |||||||||||||||
|
|
|
|
|
|
|
|
|
|
|
|||||||||||
| Total costs not subject to amortization |
$ | — | $ | 2,754 | $ | 41,240 | $ | 36,943 | $80,937 | |||||||||||
|
|
|
|
|
|
|
|
|
|
|
|||||||||||
F-41
Table of Contents
Costs Incurred In Oil and Gas Property Acquisition, Exploration and Development Activities
The following costs were incurred in oil and gas acquisition, exploration, and development activities (in thousands):
| 2012 | 2013 | 2014 | ||||||||||
| Costs incurred: |
||||||||||||
| Unproved property acquisition costs(1) |
$ | 3,971 | $ | 66,708 | $ | 28,829 | ||||||
| Proved property acquisition costs |
— | 6,883 | 708,980 | |||||||||
| Exploration costs |
— | 100,795 | 119,443 | |||||||||
| Development costs |
— | 42,022 | 86,098 | |||||||||
|
|
|
|
|
|
|
|||||||
| $ | 3,971 | $ | 216,408 | 943,350 | ||||||||
|
|
|
|
|
|
|
|||||||
| (1) | Includes seismic cost of $5.7 million and $1.7 million incurred during the years ended December 31, 2013 and 2014, respectively. |
Depreciation, Depletion, Amortization and Accretion
Depreciation, depletion, amortization and accretion expense per barrel of oil equivalent (“Boe”) of products sold during the period ending December 31, 2014, 2013 and 2012 was $31.30 per Boe, $35.34 per Boe and $93.49 per Boe, respectively.
Oil and Natural Gas Reserve Information
The Company has adopted certain amendments to the Extractive Activities – Oil and Gas topic of the Codification that updated and aligned the FASB’s reserve estimation and disclosure requirements for oil and natural gas companies with the reserve estimation and disclosure requirements that were adopted by the SEC in December 2008. In accordance with these rules, the Company uses the average of first-day-of-the-month commodity prices over the preceding 12-month period when estimating quantities of proved reserves. Similarly, such prices are used to calculate the standardized measure of discounted future cash flows and values used in the ceiling test impairment.
There are numerous uncertainties in estimating quantities of proved reserves and in providing the future rates of production expenditures. The following reserve data represent estimates only and are inherently imprecise and may be subject to substantial revisions as additional information such as reservoir performance, additional drilling, technological advancements and other factors become available. Decreases in the prices of oil and natural gas could have an adverse effect on the carrying value of the Company’s proved reserves, reserve volumes and our revenues, profitability and cash flow.
As of December 31, 2014, all of the Company’s reserves were owned by its wholly-owned subsidiary, Energy and Exploration Partners, LLC.
F-42
Table of Contents
The following sets forth estimated quantities of the Company’s net proved and proved developed oil and natural gas reserves:
| Oil (Bbls)(1) | NGL (Bbls)(1)(8) |
Natural Gas (Mcf)(1)(8) |
Oil Equivalent (Boe)(2) |
|||||||||||||
| Proved reserves as of December 31, 2011(3) |
— | — | — | — | ||||||||||||
| Extensions and discoveries(4) |
25,556 | 384 | 52,827 | 34,744 | ||||||||||||
| Revisions of previous estimates |
— | — | — | — | ||||||||||||
| Purchase of minerals in place |
— | — | — | — | ||||||||||||
| Sales of reserves |
— | — | — | — | ||||||||||||
| Production |
(2,247 | ) | (384 | ) | (3,903 | ) | (3,281 | ) | ||||||||
|
|
|
|
|
|
|
|
|
|||||||||
| Proved reserves as of December 31, 2012 |
23,309 | — | 48,924 | 31,463 | ||||||||||||
| Extensions and discoveries(4) |
5,761,777 | 470 | 6,513,374 | 6,847,809 | ||||||||||||
| Revisions of previous estimates(5) |
(16,567 | ) | — | (29,679 | ) | (21,514 | ) | |||||||||
| Purchase of minerals in place(6) |
256,300 | 4,544 | 801,269 | 394,389 | ||||||||||||
| Sales of reserves(7) |
(4,581 | ) | 109 | (16,970 | ) | (7,300 | ) | |||||||||
| Production |
(161,579 | ) | (5,123 | ) | (128,603 | ) | (188,136 | ) | ||||||||
|
|
|
|
|
|
|
|
|
|||||||||
| Proved reserves as of December 31, 2013 |
5,858,659 | — | 7,188,315 | 7,056,711 | ||||||||||||
| Extension and discoveries(4) |
2,563,581 | 358,137 | 2,068,170 | 3,266,413 | ||||||||||||
| Revisions of previous estimates(5) |
(1,274,025 | ) | 525,611 | (3,630,459 | ) | (1,353,491 | ) | |||||||||
| Purchase of minerals in place(6) |
29,944,578 | 4,379,204 | 26,302,159 | 38,707,475 | ||||||||||||
| Sales of reserves |
— | — | — | — | ||||||||||||
| Production |
(1,598,070 | ) | (258,490 | ) | (1,440,871 | ) | (2,096,705 | ) | ||||||||
|
|
|
|
|
|
|
|
|
|||||||||
| Proved reserves as of December 31, 2014 |
35,494,723 | 5,004,462 | 30,487,314 | 45,580,404 | ||||||||||||
|
|
|
|
|
|
|
|
|
|||||||||
| Year-end proved developed reserves: |
||||||||||||||||
| 2011 |
— | — | — | — | ||||||||||||
| 2012 |
23,309 | — | 48,924 | 31,463 | ||||||||||||
| 2013 |
1,946,997 | — | 2,896,678 | 2,429,776 | ||||||||||||
| 2014 |
13,947,580 | 2,146,616 | 12,992,742 | 18,259,653 | ||||||||||||
| Year-end proved undeveloped reserves: |
||||||||||||||||
| 2011 |
— | — | — | — | ||||||||||||
| 2012 |
— | — | — | — | ||||||||||||
| 2013 |
3,911,662 | — | 4,291,637 | 4,626,935 | ||||||||||||
| 2014 |
21,547,143 | 2,857,846 | 17,494,572 | 27,320,751 | ||||||||||||
| (1) | Estimated reserves as of December 31, 2012, 2013 and 2014 are based on the unweighted arithmetic average of first-day-of- the-month commodity prices over the period January through December for each applicable period in accordance with current definitions and guidelines set forth by the SEC and the FASB. |
| (2) | Boe is determined using the ratio of six thousand cubic feet (“Mcf”) of natural gas to one barrel (“Bbl”) of crude oil. |
| (3) | The Company had no proved reserves in 2011 or prior. |
| (4) | Discoveries and extensions during the years ended December 31, 2012, 2013 and 2014 were primarily discoveries resulting from our participation in the drilling of three gross successful exploratory wells during 2012, fifteen gross productive exploratory wells during 2013 and eight gross productive exploratory wells during 2014. |
| (5) | Revisions of previous estimates of reserves during the year ended December 31, 2013 were primarily from a reduction in reserve estimates of 1 gross (0.25 net) non-operated well that began production in late 2012 and subsequently declined at a faster rate than anticipated. Revisions of previous estimates for the year ended December 31, 2014 for oil and natural gas were primarily due to a reduction in the number of proven undeveloped horizontal Woodbine locations. Additionally, the segregation of NGL’s from natural gas during 2014 resulted in an upward revision to NGLs and an offsetting downward revision to natural gas. |
| (6) | The purchase of minerals in place during the year ended December 31, 2013 was related to the Company’s acquisition of acreage in the Eaglebine from Chesapeake, including interests in proved developed oil and natural gas reserves. The purchase of minerals in place during the year ended December 31, 2014 was related to the Company’s Ft. Trinidad acquisition from TreadStone Energy Partners, LLC. |
| (7) | Sales of reserves during the year ended December 31, 2013 were a result of the sale of our DJ Basin assets located in Weld County, Colorado, which included 2 gross (0.09 net) wells. |
| (8) | The Company’s natural gas reserves include immaterial NGL reserves during 2012 and 2013. |
F-43
Table of Contents
Standardized Measure of Discounted Future Net Cash Flows
The following presents the standardized measure of discounted future net cash flows related to the Company’s proved oil and natural gas reserves together with changes therein, as defined by the FASB as of December 31, 2014, 2013 and 2012. Future cash inflows represent expected revenues from production of period-end quantities of proved reserves based on the unweighted arithmetic average of first-day-of-the-month commodity prices for January through December of each annual period. All prices are adjusted by lease for quality, transportation fees, energy content and regional price differentials. The average adjusted commodity prices related to the oil are $91.68 per barrel, $95.16 per barrel and $93.71 per barrel for the periods ended December 31 2012, 2013 and 2014, respectively. The average adjusted commodity prices related to the natural gas are $3.34 per Mcf, $3.39 per Mcf and $4.04 per Mcf for the periods ended December 31 2012, 2013 and 2014, respectively. The average adjusted commodity price related to NGLs is $31.35 for the period ended December 31, 2014.
Future cash inflows were reduced by estimated future production and development costs based on current costs with no escalation to determine pre-tax cash inflows. Additionally, immaterial estimated future abandonment costs for the year ended December 31, 2013 were not included in the estimate of future cash flows. Estimated future abandonment costs for the year-ended December 31, 2012 were not material and were not included in the estimate of future cash flows. Future income taxes were computed by applying the statutory tax rate to the excess of net cash inflows over our tax basis in the associated proved oil and natural gas properties. Net operating loss carryforwards were also considered in the future income tax calculation. Future net cash inflows after income taxes were discounted using a 10% annual discount rate to arrive at the Standardized Measure.
| December 31, | ||||||||||||
| 2012 | 2013 | 2014 | ||||||||||
| (in thousands) | ||||||||||||
| Future cash inflows |
$ | 2,300 | $ | 581,835 | $ | 3,606,184 | ||||||
| Future production costs |
(1,019 | ) | (161,665 | ) | (762,687 | ) | ||||||
| Future development costs |
— | (125,725 | ) | (375,841 | ) | |||||||
| Future income tax expense |
(372 | ) | (72,975 | ) | (484,499 | ) | ||||||
|
|
|
|
|
|
|
|||||||
| Net future cash flows before discount |
909 | 221,470 | 1,983,157 | |||||||||
| Annual discount of 10% for estimated timing of cash flows |
(271 | ) | (107,584 | ) | (769,059 | ) | ||||||
|
|
|
|
|
|
|
|||||||
| Standardized measure of discounted future net cash flows |
$ | 638 | $ | 113,886 | $ | 1,214,098 | ||||||
|
|
|
|
|
|
|
|||||||
The following are the principal sources of changes in the standardized measure of discounted future net cash flows of the Company for each of the three years in the period ended December 31 (in thousands):
| December 31, | ||||||||||||
| 2012 | 2013 | 2014 | ||||||||||
| Beginning of year |
$ | — | $ | 638 | $ | 113,886 | ||||||
| Sales of oil and natural gas produced, net of production costs |
(191 | ) | (12,357 | ) | (111,659 | ) | ||||||
| Purchase of minerals in place |
— | 12,018 | 1,378,890 | |||||||||
| Change in estimated future development costs, net of development costs incurred |
— | — | 35,915 | |||||||||
| Sales of minerals in place |
— | (213 | ) | — | ||||||||
| Extensions and discoveries |
1,066 | 149,360 | 92,557 | |||||||||
| Change in income taxes, net |
(237 | ) | (34,922 | ) | (233,883 | ) | ||||||
| Changes in prices and costs |
— | (494 | ) | (52,118 | ) | |||||||
| Revisions of previous estimates |
— | (977 | ) | (27,490 | ) | |||||||
| Accretion of discount |
— | 88 | 14,905 | |||||||||
| Changes in production rates and other |
— | 745 | 3,095 | |||||||||
|
|
|
|
|
|
|
|||||||
| End of the year |
$ | 638 | $ | 113,886 | $ | 1,214,098 | ||||||
|
|
|
|
|
|
|
|||||||
F-44
Table of Contents
* * * * * * *
17. Quarterly Financial Data (Unaudited)
The following table summarizes results for each of the four quarters in the years ended December 31, 2014, 2013 and 2012 (in thousands, except for share and per share amounts):
| Quarters Ended | ||||||||||||||||
| March 31 | June 30 | September 30 | December 31 | |||||||||||||
| 2014 |
||||||||||||||||
| Revenues |
$ | 11,614 | $ | 9,634 | $ | 61,994 | $ | 62,139 | ||||||||
| Operating loss |
$ | (608 | ) | $ | (1,921 | ) | $ | 22,322 | $ | 6,351 | ||||||
| Net income (loss) |
$ | 7,775 | $ | (11,057 | ) | $ | (79,759 | ) | $ | 76,854 | ||||||
| Net income (loss) per common share (1): |
||||||||||||||||
| Basic |
$ | 15.23 | $ | (21.66 | ) | $ | (156.23 | ) | $ | 149.07 | ||||||
| Diluted |
$ | 9.93 | $ | (21.66 | ) | $ | (156.23 | ) | $ | 89.79 | ||||||
| Weighted average common shares outstanding: |
||||||||||||||||
| Basic |
510,530 | 510,530 | 510,530 | 515,554 | ||||||||||||
| Diluted |
782,887 | 510,530 | 510,530 | 855,907 | ||||||||||||
| Quarters Ended | ||||||||||||||||
| March 31 | June 30 | September 30 | December 31 | |||||||||||||
| 2013 |
||||||||||||||||
| Revenues |
$ | 137 | $ | 1,805 | $ | 5,043 | $ | 9,452 | ||||||||
| Operating loss |
$ | (13,240 | ) | $ | (4,516 | ) | $ | (1,077 | ) | $ | (1,063 | ) | ||||
| Net income (loss) |
$ | 150 | $ | (9,582 | ) | $ | (6,158 | ) | $ | (6,177 | ) | |||||
| Net income (loss) per common share (1): |
||||||||||||||||
| Basic and diluted |
$ | 0.30 | $ | (19.08 | ) | $ | (12.20 | ) | $ | (12.06 | ) | |||||
| Weighted average common shares outstanding: |
||||||||||||||||
| Basic and diluted |
500,000 | 502,113 | 504,886 | 512,051 | ||||||||||||
| Quarters Ended | ||||||||||||||||
| March 31 | June 30 | September 30 | December 31 | |||||||||||||
| 2012 |
||||||||||||||||
| Revenues |
$ | 30 | $ | 81 | $ | 39 | $ | 66 | ||||||||
| Operating loss |
$ | (680 | ) | $ | (1,003 | ) | $ | (6,177 | ) | $ | (6,913 | ) | ||||
| Net income (loss) |
$ | (1,206 | ) | $ | 1,590 | $ | 13,893 | $ | (5,543 | ) | ||||||
| Net income (loss) per common share (1): |
||||||||||||||||
| Basic and diluted |
$ | 3.03 | $ | 4.00 | $ | 31.51 | $ | 11.09 | ||||||||
| Weighted average common shares outstanding: |
||||||||||||||||
| Basic and diluted |
397,500 | 397,500 | 440,951 | 500,000 | ||||||||||||
| (1) | The sum of the individual quarterly net loss amounts per share may not agree with year-to-date net loss per share as each quarterly computation is based on the net income or loss for that quarter and the weighted-average number of shares outstanding during that quarter. |
F-45
Table of Contents
TREADSTONE ENERGY PARTNERS, LLC
JUNE 30, 2014 AND DECEMBER 31, 2013
| June 30, 2014 |
December 31, 2013 |
|||||||
| (Unaudited) | ||||||||
| Assets |
||||||||
| Current Assets |
||||||||
| Cash and Cash Equivalents |
$ | 12,340,501 | $ | 6,845,661 | ||||
| Oil and Gas Sales Receivable |
27,009,854 | 14,599,245 | ||||||
| Accounts Receivable |
920,425 | 610,521 | ||||||
| Commodity Derivative Instruments at Fair Value |
6,360 | — | ||||||
| Prepaid Expenses and Other Current Assets |
100,817 | 154,737 | ||||||
|
|
|
|
|
|||||
| Total Current Assets |
40,377,957 | 22,210,164 | ||||||
|
|
|
|
|
|||||
| Property and Equipment |
||||||||
| Full Cost Used for Oil and Gas Properties: |
||||||||
| Proved Properties Being Amortized |
192,278,805 | 139,656,920 | ||||||
| Unproved Properties Not Subject to Amortization |
18,101,073 | 410,217 | ||||||
| Other Property and Equipment |
73,649 | 73,649 | ||||||
|
|
|
|
|
|||||
| 210,453,527 | 140,140,786 | |||||||
| Less: Accumulated Depreciation, Depletion, and Amortization |
(38,888,186 | ) | (21,534,715 | ) | ||||
|
|
|
|
|
|||||
| Total Property and Equipment, Net |
171,565,341 | 118,606,071 | ||||||
|
|
|
|
|
|||||
| Other Assets |
||||||||
| Deposits |
— | 8,136 | ||||||
|
|
|
|
|
|||||
| Total Other Assets |
— | 8,136 | ||||||
|
|
|
|
|
|||||
| Total Assets |
$ | 211,943,298 | $ | 140,824,371 | ||||
|
|
|
|
|
|||||
| Liabilities and Members’ Capital |
||||||||
| Current Liabilities |
||||||||
| Accounts Payable and Accrued Expenses |
$ | 21,020,894 | $ | 11,162,543 | ||||
| Revenue and Royalties Payable |
12,636,301 | 7,538,126 | ||||||
| Commodity Derivative Instruments at Fair Value |
8,166,094 | 3,443,968 | ||||||
|
|
|
|
|
|||||
| Total Current Liabilities |
41,823,289 | 22,144,637 | ||||||
|
|
|
|
|
|||||
| Long-Term Liabilities |
||||||||
| Notes Payable |
19,000,000 | 23,400,000 | ||||||
| Commodity Derivative Instruments at Fair Value |
1,558,691 | — | ||||||
| Asset Retirement Obligations |
4,454,301 | 4,265,600 | ||||||
|
|
|
|
|
|||||
| Total Long-Term Liabilities |
25,012,992 | 27,665,600 | ||||||
|
|
|
|
|
|||||
| Total Liabilities |
66,836,281 | 49,810,237 | ||||||
|
|
|
|
|
|||||
| Members’ Capital |
145,107,017 | 91,014,134 | ||||||
|
|
|
|
|
|||||
| Total Liabilities and Members’ Capital |
$ | 211,943,298 | $ | 140,824,371 | ||||
|
|
|
|
|
|||||
See accompanying notes to these financial statements.
F-66
Table of Contents
TREADSTONE ENERGY PARTNERS, LLC
STATEMENTS OF OPERATIONS
(Unaudited)
| Three Months
Ended June 30, |
Six Months
Ended June 30, |
|||||||||||||||
| 2014 | 2013 | 2014 | 2013 | |||||||||||||
| Revenue |
||||||||||||||||
| Oil and Gas Revenue, Net of Royalties |
$ | 60,589,211 | $ | 17,192,505 | $ | 98,470,472 | $ | 28,648,032 | ||||||||
| Realized Losses on Commodity Derivative Instruments |
(3,188,631 | ) | (14,904 | ) | (4,045,771 | ) | (14,904 | ) | ||||||||
|
|
|
|
|
|
|
|
|
|||||||||
| Total Revenue |
57,400,580 | 17,177,601 | 94,424,701 | 28,633,128 | ||||||||||||
|
|
|
|
|
|
|
|
|
|||||||||
| Operating Expenses |
||||||||||||||||
| Lease Operating Expenses |
6,316,482 | 2,027,905 | 9,674,565 | 3,230,347 | ||||||||||||
| Depreciation, Depletion, and Amortization |
10,553,906 | 3,896,983 | 17,353,471 | 8,327,334 | ||||||||||||
| Production Taxes |
2,933,084 | 820,394 | 4,749,115 | 1,358,694 | ||||||||||||
| Acquisition Expenses |
83,700 | 784,384 | 190,861 | 1,717,193 | ||||||||||||
| Accretion Expenses |
32,064 | 25,194 | 63,698 | 46,959 | ||||||||||||
| General and Administrative |
784,913 | 892,485 | 1,709,017 | 1,554,046 | ||||||||||||
|
|
|
|
|
|
|
|
|
|||||||||
| Total Operating Expenses |
20,704,149 | 8,447,345 | 33,740,727 | 16,234,573 | ||||||||||||
|
|
|
|
|
|
|
|
|
|||||||||
| Operating Income |
36,696,431 | 8,730,256 | 60,683,974 | 12,398,555 | ||||||||||||
|
|
|
|
|
|
|
|
|
|||||||||
| Other Income (Expense) |
||||||||||||||||
| Interest Expense |
(129,712 | ) | (191,437 | ) | (316,634 | ) | (287,212 | ) | ||||||||
| Unrealized Gains (Losses) on Commodity Derivative Instruments |
(4,944,285 | ) | 898,513 | (6,274,457 | ) | (42,350 | ) | |||||||||
|
|
|
|
|
|
|
|
|
|||||||||
| Total Other Income (Expense) |
(5,073,997 | ) | 707,076 | (6,591,091 | ) | (329,562 | ) | |||||||||
|
|
|
|
|
|
|
|
|
|||||||||
| Net Income |
$ | 31,622,434 | $ | 9,437,332 | $ | 54,092,883 | $ | 12,068,993 | ||||||||
|
|
|
|
|
|
|
|
|
|||||||||
See accompanying notes to these financial statements.
F-67
Table of Contents
TREADSTONE ENERGY PARTNERS, LLC
STATEMENTS OF CHANGES IN MEMBERS’ CAPITAL
| Series A Units |
Series
B Units |
Member Contributions |
Retained Earnings |
Total | ||||||||||||||||
| Balance, December 31, 2012 |
41,913 | 637 | $ | 42,450,000 | $ | 1,236,329 | $ | 43,686,329 | ||||||||||||
| Net Income for the Period |
— | — | — | 12,068,993 | 12,068,993 | |||||||||||||||
|
|
|
|
|
|
|
|
|
|
|
|||||||||||
| Balance, June 30, 2013 |
41,913 | 637 | 42,450,000 | 13,305,322 | 55,755,322 | |||||||||||||||
| Net Income for the Period |
— | — | — | 35,258,812 | 35,258,812 | |||||||||||||||
|
|
|
|
|
|
|
|
|
|
|
|||||||||||
| Balance, December 31, 2013 |
41,913 | 637 | 42,450,000 | 48,564,134 | 91,014,134 | |||||||||||||||
| Net Income for the Period |
— | — | — | 54,092,883 | 54,092,883 | |||||||||||||||
|
|
|
|
|
|
|
|
|
|
|
|||||||||||
| Balance, June 30, 2014 |
41,913 | 637 | $ | 42,450,000 | $ | 102,657,017 | $ | 145,107,017 | ||||||||||||
|
|
|
|
|
|
|
|
|
|
|
|||||||||||
See accompanying notes to these financial statements.
F-68
Table of Contents
TREADSTONE ENERGY PARTNERS, LLC
STATEMENTS OF CASH FLOWS
(Unaudited)
| Three Months Ended June 30, |
Six Months Ended June 30, |
|||||||||||||||
| 2014 | 2013 | 2014 | 2013 | |||||||||||||
| Cash Flows from Operating Activities |
||||||||||||||||
| Net Income |
$ | 31,622,434 | $ | 9,437,332 | $ | 54,092,883 | $ | 12,068,993 | ||||||||
| Adjustments to Reconcile Net lncome to Net Cash Provided by Operating Activities |
||||||||||||||||
| Depreciation, Depletion, and Amortization |
10,553,906 | 3,896,983 | 17,353,471 | 8,327,334 | ||||||||||||
| Accretion Expense |
32,064 | 25,194 | 63,698 | 46,959 | ||||||||||||
| Unrealized Losses (Gains) on Commodity Derivative Instruments |
4,944,285 | (898,513 | ) | 6,274,457 | 42,350 | |||||||||||
| Increase in Oil and Gas Sales Receivable |
(9,964,536 | ) | (2,296,662 | ) | (12,410,609 | ) | (1,971,008 | ) | ||||||||
| Increase in Accounts Receivable |
(890,238 | ) | (193,442 | ) | (309,904 | ) | (76,080 | ) | ||||||||
| (Increase) Decrease in Prepaid Expenses and Other Current Assets |
(25,407 | ) | (68,730 | ) | 53,920 | 193,347 | ||||||||||
| Increase in Accounts Payable and Accrued Expenses |
9,576,485 | 1,000,720 | 9,193,995 | 667,699 | ||||||||||||
| Increase in Revenue and Royalties Payable |
4,044,065 | 1,418,133 | 5,098,175 | 2,040,251 | ||||||||||||
|
|
|
|
|
|
|
|
|
|||||||||
| Net Cash Provided by Operating Activities |
49,893,058 | 12,321,015 | 79,410,086 | 21,339,845 | ||||||||||||
|
|
|
|
|
|
|
|
|
|||||||||
| Cash Flows from Investing Activities |
||||||||||||||||
| Acquisition and Development of Oil and Gas Properties |
(44,286,082 | ) | (18,035,574 | ) | (69,523,382 | ) | (36,069,339 | ) | ||||||||
| Decrease in Deposits |
1,394 | — | 8,136 | 25,000 | ||||||||||||
|
|
|
|
|
|
|
|
|
|||||||||
| Net Cash Used in Investing Activities |
(44,284,688 | ) | (18,035,574 | ) | (69,515,246 | ) | (36,044,339 | ) | ||||||||
|
|
|
|
|
|
|
|
|
|||||||||
| Cash Flows from Financing Activities |
||||||||||||||||
| Proceeds from Notes Payable |
6,700,000 | 8,000,000 | 6,900,000 | 14,900,000 | ||||||||||||
| Repayments on Notes Payable |
(11,100,000 | ) | — | (11,300,000 | ) | — | ||||||||||
| (Decrease) Increase in Advances from Working Interest Owners |
(270,216 | ) | 36,827 | — | 41,074 | |||||||||||
|
|
|
|
|
|
|
|
|
|||||||||
| Net Cash (Used in) Provided by Financing Activities |
(4,670,216 | ) | 8,036,827 | (4,400,000 | ) | 14,941,074 | ||||||||||
|
|
|
|
|
|
|
|
|
|||||||||
| Net Increase in Cash and Cash Equivalents |
938,154 | 2,322,268 | 5,494,840 | 236,580 | ||||||||||||
| Cash and Cash Equivalents, Beginning |
11,402,347 | 3,614,149 | 6,845,661 | 5,699,837 | ||||||||||||
|
|
|
|
|
|
|
|
|
|||||||||
| Cash and Cash Equivalents, Ending |
$ | 12,340,501 | $ | 5,936,417 | $ | 12,340,501 | $ | 5,936,417 | ||||||||
|
|
|
|
|
|
|
|
|
|||||||||
| Supplemental Disclosures of Cash Flow Information |
||||||||||||||||
| Cash Paid for Interest |
$ | 129,712 | $ | 8,297 | $ | 316,634 | $ | 251,177 | ||||||||
| Non Cash Asset Retirement Obligations Capitalized |
125,003 | 300,008 | 125,003 | 350,007 | ||||||||||||
| Non Cash Accruals for Capital Expenditures |
664,356 | 670,696 | 664,356 | 916,703 | ||||||||||||
See accompanying notes to these financial statements.
F-69
Table of Contents
TREADSTONE ENERGY PARTNERS, LLC
NOTES TO FINANCIAL STATEMENTS
Note 1. Summary of Significant Accounting Policies
Treadstone Energy Partners, LLC (the Company), is an independent oil and gas company engaged primarily in the acquisition, exploration, development, and production of crude oil and natural gas in the State of Texas. The Company was formed as a Delaware limited liability company on February 24, 2011.
Basis of Presentation
The accompanying financial statements have been prepared on the accrual basis of accounting in accordance with accounting principles generally accepted in the United States of America (GAAP).
Cash and Cash Equivalents
For the purpose of the statement of cash flows, the Company considers all highly liquid investments with a maturity of three months or less to be cash equivalents. As of June 30, 2014 and December 31, 2013, the Company did not have any short-term investments classified as cash equivalents.
Accounts Receivable
Accounts receivable consist of uncollateralized oil and natural gas revenues due under normal trade terms, as well as amounts due from working interest owners of oil and gas properties for their share of expenses paid on their behalf by the Company. Management reviews receivables periodically and reduces the carrying amount by a valuation allowance that reflects management’s best estimate of the amount that may not be collectible. As of June 30, 2014 and December 31, 2013, the valuation allowance was $-0-.
Oil and Gas Producing Activities
The Company follows the full cost method of accounting for oil and gas properties. Under the full cost method, all costs associated with property acquisition, exploration, and development activities are capitalized. Capitalized costs include lease acquisitions, geological and geophysical work, delay rentals, costs of drilling, completing, and equipping successful and unsuccessful oil and gas wells, and directly related costs.
Once evaluated, all capitalized costs of oil and gas properties, including the estimated future costs to develop proved reserves and the estimated cost of dismantlement and abandonment, net of salvage value, are amortized on the units-of-production method using estimates of proved reserves. Investments in unproved properties and major development projects are not amortized until proved reserves associated with the projects can be determined or until impairment occurs. If the results of an assessment indicate that properties are impaired, the amount of the impairment is added to the capitalized costs to be amortized.
Costs associated with unproved properties and properties under development are excluded from the full cost amortization base until the properties have been evaluated. Unproved properties are transferred into the full cost pool subject to amortization when management determines that a field has been evaluated through drilling operations or a thorough geologic evaluation.
In addition, the capitalized costs are subject to a “ceiling test”, which basically limits such costs to the aggregate of the “estimated present value”, discounted at a ten percent (10%) interest rate of future net revenues from proved reserves, based on current economic and operating conditions, plus the lower of cost or fair market value of unproved properties.
F-70
Table of Contents
TREADSTONE ENERGY PARTNERS, LLC
NOTES TO FINANCIAL STATEMENTS
Note 1. Summary of Significant Accounting Policies (Continued)
Oil and Gas Producing Activities (Continued)
Sales of proved and unproved properties are accounted for as adjustments of capitalized costs with no gain or loss recognized, unless such adjustments would significantly alter the relationship between capitalized costs and proved reserves of oil and gas, in which case the gain or loss is recognized in income. Abandonment of properties is accounted for as adjustments of capitalized costs with no loss recognized.
The Company follows the guidance of Financial Accounting Standards Board (FASB) Accounting Standards Update (ASU) No. 2010-03, Extractive Activities—Oil and Gas (Topic) 932. This ASU provides estimation and disclosure requirements for oil and gas reserves, designed to align them with the requirements of the Securities and Exchange Commission (SEC). The guidance, among other purposes, is primarily intended to provide investors with a more meaningful and comprehensive understanding of oil and gas producing activities, updating the definition of proved oil and gas reserves to indicate that entities must use the average, first-day-of-the-month price during the 12-month period before the ending date of the period covered by the report, disclosing geographical areas that represent a certain percentage of proved reserves, updating the reserve estimation requirements for changes in practice and technology that have occurred over the past several decades, and requiring an entity to disclose separately the amounts and quantities for consolidated and equity method investments.
Depreciation, depletion, and amortization (DD&A) is computed on the units-of- production method. DD&A expense includes the amounts computed on capitalized future plugging and abandonment costs. Depreciation, depletion, and amortization expense for the Company’s oil and gas properties totaled $10,553,906, $3,894,914, $17,353,471 and $8,325,264, respectively, for the three and six months ended June 30, 2014 and 2013.
Other Property and Equipment
Other property and equipment, which includes office furniture and equipment, is depreciated using the straight-line method over the estimated useful lives of the assets ranging from three to ten years. Gain or loss on retirement, sale, or other disposition of these assets is included in income in the period of disposition. Costs of major repairs that extend the useful life are capitalized. Costs for maintenance and repairs are expensed as incurred.
Revenue Recognition
The Company recognizes oil and gas revenue from its interests in producing wells using the sales method. Under this method, revenues are recognized based on actual volumes of oil and gas produced and delivered to purchasers. As a result, the Company accrues revenue relating to production for which the Company has not yet received payment.
Hedging Agreements
The Company manages the potential impact of changes in the price of oil and natural gas by entering into derivative commodity instruments (hedges), but does not use them for speculative purposes.
The Company accounts for hedging agreements in accordance with Financial Accounting Standards Board (FASB) Accounting Standards Codification (ASC) 815. ASC 815 requires the Company to recognize all derivative instruments on the balance sheet as either an asset or liability, measured at fair value, and requires that changes in a derivative’s fair value be realized currently in earnings, unless hedge accounting criteria are met.
F-71
Table of Contents
TREADSTONE ENERGY PARTNERS, LLC
NOTES TO FINANCIAL STATEMENTS
Note 1. Summary of Significant Accounting Policies (Continued)
Hedging Agreements (Continued)
The Company’s hedges are specifically referenced to the NYMEX index prices received for its designated production. Estimating the fair value of derivatives requires complex calculations incorporating estimates of future prices, discount rates, and price movements. As a result, the Company obtains the fair value of its commodity derivatives from the counterparties to those contracts. Because the counterparties are market makers, they are able to provide a literal market value, or what they would be willing to settle such contracts for as of the given date.
Asset Retirement Obligations
The Company accounts for future plugging and abandonment costs in accordance with FASB ASC 410. ASC 410 requires legal obligations associated with the retirement of long-lived assets (i.e., future plugging and abandonment costs) to be recognized at their fair value at the time the obligations are incurred. Upon initial recognition of the liability, that cost is capitalized as part of the carrying amount of the related long-lived asset. The estimate of future plugging and abandonment costs is highly subjective. Management’s current estimate of the Company’s share of such future costs is approximately $4,454,301 and $4,265,600, as of June 30, 2014 and December 31, 2013, respectively.
Long-Lived Assets
The Company continually evaluates the recoverability of the carrying value of its long-lived assets, primarily property and equipment. When certain events and circumstances indicate the cost of an asset or assets may be impaired, the Company recognizes a write-down to estimated fair value, which is obtained from quoted prices or expected discounted cash flows from the related assets. There were no impairment losses recognized during the three and six months ended June 30, 2014 and 2013.
Concentration of Credit Risk
Substantially all accounts receivable result from uncollateralized natural gas and oil sales or working interest billings to third parties in the oil and gas industry. This concentration of customers may impact overall credit risk, as these entities may be similarly affected by changes in economic and other conditions. The Company maintains its cash and cash equivalents in a commercial bank. Management does not believe a significant credit risk exists at June 30, 2014 and December 31, 2013.
Use of Estimates
The preparation of financial statements in conformity with accounting principles generally accepted in the United States of America requires management to make estimates and assumptions that affect the reported amounts of assets and liabilities at the date of the financial statements and the reported amounts of revenues and expenses during the reporting period. Actual results could differ from those estimates. Material estimates that are particularly susceptible to significant change in the near term include the determination of depreciation, depletion, and amortization, asset retirement obligations, and the valuation of oil and gas properties.
The Company’s oil and gas reserve quantities are the basis for the calculation of depreciation, depletion, and amortization, and impairment of oil and gas properties. Inputs for the Company’s reserve estimates are determined internally. Management emphasizes that reserve estimates are inherently imprecise and that estimates of reserves of non-producing properties and more recent discoveries are more imprecise than those for properties with long production histories.
F-72
Table of Contents
TREADSTONE ENERGY PARTNERS, LLC
NOTES TO FINANCIAL STATEMENTS
Note 1. Summary of Significant Accounting Policies (Continued)
Use of Estimates (Continued)
In addition to the uncertainties inherent in the reserve estimation process, these amounts are affected by historical and projected prices for oil and natural gas which have typically been volatile. It is reasonably possible that the Company’s oil and gas reserve estimates may materially change in subsequent years.
Income Taxes
The Company is treated as a partnership for income tax purposes and, as such, the members are taxed separately on their distributive share of the Company’s income, whether or not that income is actually distributed.
The Company follows the guidance of the Income Taxes Topic of FASB ASC 740. ASC 740 prescribes a recognition threshold and measurement attribute for financial statement recognition and measurement of a tax position taken or expected to be taken in a tax return, and also provides guidance on various related matters such as derecognition, interest, penalties, and disclosures required. The Company recognizes interest and penalties, if any, related to unrecognized tax benefits in income tax expense.
As stated above, taxable income or loss of the Company is included in the tax returns of its members. The Company files a U.S. federal income tax return, and a state franchise tax return in Texas. Returns filed in these jurisdictions for tax years ended on or after December 31, 2010 are subject to examination by the relevant taxing authorities. The Company is not currently under examination by any taxing authority.
The Company’s management has determined that there were no uncertain tax positions as of June 30, 2014 and December 31, 2013.
Note 2. Significant Customers
During the three and six months ended June 30, 2014, two customers made up approximately 91% of the Company’s revenue and 92% of accounts receivable.
During the three and six months ended June 30, 2013, one customer made up approximately 92% of the Company’s revenue and 85% of accounts receivable.
Note 3. Unproved Properties
The Company is currently participating in oil and gas exploration and development activities. Unproved property costs and exploration costs have been excluded in computing amortization of the full cost pool, as a determination cannot be made about the extent of additional oil reserves that should be classified as proved reserves as a result of these projects. The cost of unproved leases which become productive is reclassified to proved properties when proved reserves are discovered on the property. Unproved oil and gas interests are carried at the lower of cost or estimated fair market value.
F-73
Table of Contents
TREADSTONE ENERGY PARTNERS, LLC
NOTES TO FINANCIAL STATEMENTS
Note 3. Unproved Properties (Continued)
The following table reflects the net changes in unproved property costs:
| June 30, 2014 |
December 31, 2013 |
|||||||
| Beginning Balance |
$ | 410,217 | $ | 9,918,310 | ||||
| Additions to Capitalized Property Costs Pending the Determination of Proved Reserves |
27,526,272 | 410,217 | ||||||
| Reclassifications to Properties Being Amortized Based on the Determination of Proved Reserves |
(9,835,416 | ) | (9,918,310 | ) | ||||
|
|
|
|
|
|||||
| Ending Balance |
$ | 18,101,073 | $ | 410,217 | ||||
|
|
|
|
|
|||||
The Company has approximately $410,217 of unproved property costs remaining from 2013 included in the balance as of June 30, 2014. The Company expects to complete its evaluation of these costs in 2014.
Note 4. Acquisitions of Oil and Gas Properties
The Company follows the guidance of FASB ASC 805, Business Combinations, when accounting for acquisition costs incurred on the purchase of a working interest in oil and gas properties. As such, acquisition costs are expensed as incurred. Acquisition expenses totaled $83,700, $784,384, $190,861, and $1,717,193, for the three and six months ended June 30, 2014 and 2013, respectively.
Note 5. Notes Payable
Notes payable at June 30, 2014 and December 31, 2013, consisted of the following:
| June 30, 2014 |
December 31, 2013 |
|||||||
| Revolving Loan Agreement for up to $100,000,000, interest at LIBOR (2.53% average rate at June 30, 2014), principal due at maturity February 5, 2017, periodic interest payments, secured by all of the Company’s current and future oil and gas properties and interests, and all derivative instruments. |
$ | 19,000,000 | $ | 23,400,000 | ||||
|
|
|
|
|
|||||
| Total |
$ | 19,000,000 | $ | 23,400,000 | ||||
|
|
|
|
|
|||||
|
Maturities are as follows as of June 30, 2014:
|
||||||||
| 2017 |
$ | 19,000,000 | ||||||
|
|
|
|||||||
Interest expense, including loan origination fees, for the three and six months ended June 30, 2014 and 2013, totaled $129,712, $191,437, $316,634, and $287,212, respectively.
The Company is subject to certain restrictive financial covenants under the credit facility, including a positive working capital requirement of greater than or equal to 1.0 to 1.0, and a Debt to EBITDAX ratio less than or equal to 4.0 to 1.0, all as defined in the Credit Agreement. The credit facility also includes customary restrictions with respect to liens, indebtedness, loans and investments, material changes in the Company’s business, asset sales or leases or transfers of assets, restricted payments, such as distributions and dividends, mergers or consolidations, and transactions with affiliates. At June 30, 2014, the Company was in compliance with the covenants.
F-74
Table of Contents
TREADSTONE ENERGY PARTNERS, LLC
NOTES TO FINANCIAL STATEMENTS
Note 6. Fair Value Measurement
The Company values its financial instruments as required by FASB ASC 825. The carrying amounts of cash, receivables, commodity derivative instruments, and notes payable approximate fair value. The Company estimates the fair value of its notes payable generally using discounted cash flow analysis based on the Company’s current borrowing rates for similar types of debt. The carrying amounts of the Company’s financial instruments generally approximate their fair values at June 30, 2014 and December 31, 2013.
FASB ASC 820, among other matters, establishes a fair value hierarchy that prioritizes the inputs to valuation techniques used to measure fair value.
The three levels of the fair value hierarchy are described below:
Level 1—Quoted prices are available in active markets for identical investments as of the reporting date. The types of investments in Level 1 include listed equity and debt securities.
Level 2—Pricing inputs are other than quoted prices in active markets, which are either directly or indirectly observable as of the reporting date, and fair value is determined through the use of models or other valuation methodologies. Investments which are generally included in this category include less liquid and restricted equity securities and over-the-counter derivatives.
Level 3—Pricing inputs are unobservable for the investment and include situations where there is little, if any, market activity for the investment. The inputs into the determination of fair value require significant management judgment or estimation. Investments that are included in this category generally include general and limited partnership interests in corporate private equity funds and funds of hedge funds.
In some instances, the inputs used to measure fair value may fall into different levels of the fair value hierarchy. In such instances, an investment’s level within the fair value hierarchy is based on the lowest level of input that is significant to the fair value measurement.
The preceding methods described may produce a fair value calculation that may not be indicative of the net realizable value or reflective of future fair values. Furthermore, although the Company believes its valuation methods are appropriate and consistent with other market participants, the use of different methodologies or assumptions to determine the fair value of certain financial instruments could result in a different fair value measurement at the reporting date. There have been no changes in the methodologies used during the periods presented.
The valuation of the Company’s assets measured on a recurring basis by the above fair value hierarchy at June 30, 2014 and December 31, 2013, is as follows:
| June 30, 2014 | ||||||||||||||||
| Total | Level 1 | Level 2 | Level 3 | |||||||||||||
| Assets |
||||||||||||||||
| Commodity Derivative Instruments |
$ | 6,360 | $ | — | $ | 6,360 | $ | — | ||||||||
|
|
|
|
|
|
|
|
|
|||||||||
| Liabilities |
||||||||||||||||
| Commodity Derivative Instruments |
$ | 9,724,785 | $ | — | $ | 9,724,785 | $ | — | ||||||||
|
|
|
|
|
|
|
|
|
|||||||||
F-75
Table of Contents
TREADSTONE ENERGY PARTNERS, LLC
NOTES TO FINANCIAL STATEMENTS
Note 6. Fair Value Measurement (Continued)
| December 31, 2013 | ||||||||||||||||
| Total | Level 1 | Level 2 | Level 3 | |||||||||||||
| Assets |
$ | — | $ | — | $ | — | $ | — | ||||||||
|
|
|
|
|
|
|
|
|
|||||||||
| Liabilities |
||||||||||||||||
| Commodity Derivative Instruments |
$ | 3,443,968 | $ | — | $ | 3,443,968 | $ | — | ||||||||
|
|
|
|
|
|
|
|
|
|||||||||
Note 7. Commodity Derivative Instruments
The cash settlements of commodity derivative instruments are recorded into revenue. Outstanding instruments not qualifying for hedge accounting treatment are recorded on the balance sheet at fair value, and changes in fair value are recognized in earnings as unrealized gains or losses. As the result of instruments settled, the Company recognized net derivative losses of $3,188,631, $14,904, $4,045,771, and $14,904, respectively, during the three and six month periods ended June 30, 2014 and 2013. In addition, the Company recognized unrealized net derivative (losses) gains of ($4,944,285), $898,513, ($6,274,457), and ($42,350), respectively, during the three and six month periods ended June 30, 2014 and 2013.
As of June 30, 2014, the Company had the following oil and gas derivative contracts still in place:
| June 30, 2014 | ||||||||||||
| Production Period |
Instrument Type |
Volume | Price | |||||||||
| Crude Oil: |
||||||||||||
| 2014 |
Swap | 54,000 Bbls | $ | 89.80 | ||||||||
| 2014 |
Swap | 276,000 Bbls | $ | 90.50 | ||||||||
| 2014 |
Swap | 210,000 Bbls | $ | 95.80 | ||||||||
| 2015 |
Swap | 456,000 Bbls | $ | 88.20 | ||||||||
| Natural Gas: |
||||||||||||
| 2014 |
Swap | 120,000 Mmbtu | $ | 4.19 | ||||||||
| 2014 |
Swap | 36,000 Mmbtu | $ | 4.46 | ||||||||
At June 30, 2014 and December 31, 2013, the Company recognized gross assets of $6,360 and $-0-, respectively, and gross liabilities of $9,724,785 and $3,443,968, respectively, related to the estimated fair value of these derivative instruments. Derivatives expected to settle for gains in the next twelve months totaled $6,360 and $-0-, at June 30, 2014 and December 31, 2013, respectively. Derivatives expected to settle for losses in the next twelve months totaled $8,166,094 and $3,443,968, at June 30, 2014 and December 31, 2013, respectively. All of the Company’s commodity derivative instruments expire by December 31, 2015.
F-76
Table of Contents
TREADSTONE ENERGY PARTNERS, LLC
NOTES TO FINANCIAL STATEMENTS
Note 8. Asset Retirement Obligations
The Company accounts for plugging and abandonment costs in accordance with FASB ASC 410.
A reconciliation of the beginning and ending aggregate carrying amount of asset retirement obligations is as follows:
| June 30, 2014 |
December 31, 2013 |
|||||||
| Beginning Balance |
$ | 4,265,600 | $ | 3,340,403 | ||||
| Liabilities Incurred |
125,003 | 1,458,518 | ||||||
| Liabilities Settled |
— | — | ||||||
| Liabilities Associated with Sales of Properties |
— | — | ||||||
| Accretion Expense |
63,698 | 97,883 | ||||||
| Revisions |
— | (631,204 | ) | |||||
|
|
|
|
|
|||||
| Estimated Ending Balance |
$ | 4,454,301 | $ | 4,265,600 | ||||
|
|
|
|
|
|||||
In the course of its normal business affairs, the Company is subject to possible loss contingencies arising from federal, state, and local environmental, health, and safety laws and regulations and third-party litigation. There are no matters which, in the opinion of management, will have a material adverse effect on the financial position, results of operations, or cash flows of the Company.
The Company leases office space from unrelated parties. Future payments required on the lease agreements as of June 30, 2014, are as follows:
| Amount | ||||
| 2014 |
$ | 76,028 | ||
| 2015 |
257,103 | |||
| 2016 |
257,103 | |||
| 2017 |
257,103 | |||
| 2018 |
257,103 | |||
| Thereafter |
214,254 | |||
|
|
|
|||
| Total |
$ | 1,318,694 | ||
|
|
|
|||
Note 10. Members’ Equity
In connection with the formation of the Company, Kayne Anderson Energy Fund V, L.P., Kayne Anderson Energy Fund V QP, L.P. (collectively Kayne) and Treadstone Energy Partners Management, LLC (Management) entered into a limited liability company agreement and unit purchase agreement dated March 1, 2011. Pursuant to these agreements, the Company may issue an aggregate of 49,250 Series A and 750 Series B common membership units at $1,000 per unit to Kayne and Management, respectively.
Upon request, members are required to make pro-rata capital contributions to the Company based on the respective contribution percentage of each member. Net income (loss) is allocated to the members in accordance with the LLC agreement, as appropriate. Amounts distributed to each member shall be allocated and distributed in accordance with the applicable sharing percentages per the LLC agreement based on a structured payout schedule. As of June 30, 2014 and December 31, 2013, there have been no distributions made to members.
F-77
Table of Contents
TREADSTONE ENERGY PARTNERS, LLC
NOTES TO FINANCIAL STATEMENTS
Note 11. Employee Benefit Plan
The Company maintains a 401(k) profit sharing plan which covers all employees over the age of 21. Employees are eligible to participate following a three month waiting period. The employer match is 3% under the safe harbor plan. The Company may also make a discretionary profit sharing contribution to the plan. The Company made contributions totaling $10,606, $8,700, $21,031, and $17,263, respectively, for the three and six months ended June 30, 2014 and 2013.
Note 12. Subsequent Events
Management has evaluated subsequent events through August 26, 2014, the date these financial statements were available to be issued. No events have occurred that would have a material effect on the financial statements as of that date except as disclosed below.
On July 22, 2014, the Company completed the sale of its Ft. Trinidad properties to Energy & Exploration Partners, Inc. This transaction was effective as of April 1, 2014 and included approximately 18,300 net acres of oil and gas leasehold in Houston and Madison Counties, Texas, and thirty-six net producing wells for a cash purchase price of $715 million, subject to customary purchase price adjustments. The Company repaid all outstanding notes payable and all commodity derivative instruments were settled. The Company is in the process of determining the gain as a result of this transaction.
F-78
Table of Contents

|
LaPorte, APAC 5100 Village Walk | Suite 300 Covington, LA 70433 985.892.5850 | Fax 985.892.5956 LaPorte.com |
To the Members
Treadstone Energy Partners, LLC
Report on the Financial Statements
We have audited the accompanying financial statements of Treadstone Energy Partners, LLC (the Company) which comprise the balance sheets as of December 31, 2013 and 2012, and the related statements of operations, changes in members’ capital, and cash flows for the years then ended, and the related notes to the financial statements.
Management’s Responsibility for the Financial Statements
Management is responsible for the preparation and fair presentation of these financial statements in accordance with accounting principles generally accepted in the United States of America; this includes the design, implementation, and maintenance of internal control relevant to the preparation and fair presentation of financial statements that are free from material misstatement, whether due to fraud or error.
Auditor’s Responsibility
Our responsibility is to express an opinion on these financial statements based on our audits. We conducted our audits in accordance with auditing standards generally accepted in the United States of America. Those standards require that we plan and perform the audits to obtain reasonable assurance about whether the financial statements are free of material misstatement.
An audit involves performing procedures to obtain audit evidence about the amounts and disclosures in the financial statements. The procedures selected depend on the auditor’s judgment, including the assessment of the risks of material misstatement of the financial statements, whether due to fraud or error. In making those risk assessments, the auditor considers internal control relevant to the entity’s preparation and fair presentation of the financial statements in order to design audit procedures that are appropriate in the circumstances, but not for the purpose of expressing an opinion on the effectiveness of the entity’s internal control. Accordingly, we express no such opinion. An audit also includes evaluating the appropriateness of accounting policies used and the reasonableness of significant accounting estimates made by management, as well as evaluating the overall presentation of the financial statements.
We believe that the audit evidence we have obtained is sufficient and appropriate to provide a basis for our audit opinion.

F-79
Table of Contents
Opinion
In our opinion, the financial statements referred to above present fairly, in all material respects, the financial position of Treadstone Energy Partners, LLC as of December 31, 2013 and 2012, and the results of its operations and its cash flows for the years then ended, in accordance with accounting principles generally accepted in the United States of America.

A Professional Accounting Corporation
Covington, LA
March 19, 2014
F-80
Table of Contents
TREADSTONE ENERGY PARTNERS, LLC
DECEMBER 31, 2013 AND 2012
| 2012 | 2013 | |||||||
| Assets |
||||||||
| Current Assets |
||||||||
| Cash and Cash Equivalents |
$ | 5,699,837 | $ | 6,845,661 | ||||
| Oil and Gas Sales Receivable |
4,755,082 | 14,599,245 | ||||||
| Accounts Receivable |
97,791 | 610,521 | ||||||
| Prepaid Expenses and Other Current Assets |
397,717 | 154,737 | ||||||
|
|
|
|
|
|||||
| Total Current Assets |
10,950,427 | 22,210,164 | ||||||
|
|
|
|
|
|||||
| Property and Equipment |
||||||||
| Full Cost Used for Oil and Gas Properties: |
||||||||
| Proved Properties Being Amortized |
38,720,051 | 139,656,920 | ||||||
| Unproved Properties Not Subject to Amortization |
9,918,310 | 410,217 | ||||||
| Other Property and Equipment |
73,649 | 73,649 | ||||||
|
|
|
|
|
|||||
| 48,712,010 | 140,140,786 | |||||||
| Less: Accumulated Depreciation, Depletion, and Amortization |
(5,403,864 | ) | (21,534,715 | ) | ||||
|
|
|
|
|
|||||
| Total Property and Equipment, Net |
43,308,146 | 118,606,071 | ||||||
|
|
|
|
|
|||||
| Other Assets |
||||||||
| Deposits |
30,345 | 8,136 | ||||||
|
|
|
|
|
|||||
| Total Other Assets |
30,345 | 8,136 | ||||||
|
|
|
|
|
|||||
| Total Assets |
$ | 54,288,918 | $ | 140,824,371 | ||||
|
|
|
|
|
|||||
| Liabilities and Members’ Capital |
||||||||
| Current Liabilities |
||||||||
| Accounts Payable and Accrued Expenses |
$ | 5,685,253 | $ | 11,162,543 | ||||
| Revenue and Royalties Payable |
1,576,933 | 7,538,126 | ||||||
| Commodity Derivative Instruments at Fair Value |
— | 3,443,968 | ||||||
|
|
|
|
|
|||||
| Total Current Liabilities |
7,262,186 | 22,144,637 | ||||||
|
|
|
|
|
|||||
| Long-Term Liabilities |
||||||||
| Notes Payable |
— | 23,400,000 | ||||||
| Asset Retirement Obligations |
3,340,403 | 4,265,600 | ||||||
|
|
|
|
|
|||||
| Total Long-Term Liabilities |
3,340,403 | 27,665,600 | ||||||
|
|
|
|
|
|||||
| Total Liabilities |
10,602,589 | 49,810,237 | ||||||
|
|
|
|
|
|||||
| Members’ Capital |
43,686,329 | 91,014,134 | ||||||
|
|
|
|
|
|||||
| Total Liabilities and Members’ Capital |
$ | 54,288,918 | $ | 140,824,371 | ||||
|
|
|
|
|
|||||
The accompanying notes are an integral part of these financial statements.
F-81
Table of Contents
TREADSTONE ENERGY PARTNERS, LLC
FOR THE YEARS ENDED DECEMBER 31, 2013 AND 2012
| 2012 | 2013 | |||||||
| Revenue |
||||||||
| Oil and Gas Revenue, Net of Royalties |
$ | 14,477,992 | $ | 86,392,442 | ||||
| Realized Losses on Commodity Derivative Instruments |
— | (2,542,662 | ) | |||||
|
|
|
|
|
|||||
| Total Revenue |
14,477,992 | 83,849,780 | ||||||
|
|
|
|
|
|||||
| Operating Expenses |
||||||||
| Lease Operating Expenses |
1,769,074 | 8,317,074 | ||||||
| Depreciation, Depletion, and Amortization |
5,380,620 | 16,130,852 | ||||||
| Production Taxes |
658,027 | 4,126,417 | ||||||
| Acquisition Expenses |
1,548,893 | 1,066,178 | ||||||
| Accretion Expenses |
5,054 | 97,883 | ||||||
| General and Administrative |
2,452,838 | 2,742,830 | ||||||
|
|
|
|
|
|||||
| Total Operating Expenses |
11,814,506 | 32,481,234 | ||||||
|
|
|
|
|
|||||
| Operating Income |
2,663,486 | 51,368,546 | ||||||
|
|
|
|
|
|||||
| Other Income (Expense) |
||||||||
| Interest Expense |
— | (596,773 | ) | |||||
| Unrealized Losses on Commodity Derivative Instruments |
— | (3,443,968 | ) | |||||
|
|
|
|
|
|||||
| Total Other Income (Expense) |
— | (4,040,741 | ) | |||||
|
|
|
|
|
|||||
| Net Income |
$ | 2,663,486 | $ | 47,327,805 | ||||
|
|
|
|
|
|||||
The accompanying notes are an integral part of these financial statements.
F-82
Table of Contents
TREADSTONE ENERGY PARTNERS, LLC
STATEMENTS OF CHANGES IN MEMBERS’ CAPITAL
FOR THE YEARS ENDED DECEMBER 31, 2013 AND 2012
| Series A Units |
Series B Units |
Member Contributions |
Retained Earnings |
Total | ||||||||||||||||
| Balance, December 31, 2011 |
8,620 | 130 | $ | 8,650,000 | $ | (1,427,157 | ) | $ | 7,222,843 | |||||||||||
| Net Income |
— | — | — | 2,663,486 | 2,663,486 | |||||||||||||||
| Contributions from Members |
33,293 | 507 | 33,800,000 | — | 33,800,000 | |||||||||||||||
|
|
|
|
|
|
|
|
|
|
|
|||||||||||
| Balance, December 31, 2012 |
41,913 | 637 | 42,450,000 | 1,236,329 | 43,686,329 | |||||||||||||||
| Net Income |
— | — | — | 47,327,805 | 47,327,805 | |||||||||||||||
| Contributions from Members |
— | — | — | — | — | |||||||||||||||
|
|
|
|
|
|
|
|
|
|
|
|||||||||||
| Balance, December 31, 2013 |
41,913 | 637 | $ | 42,450,000 | $ | 48,564,134 | $ | 91,014,134 | ||||||||||||
|
|
|
|
|
|
|
|
|
|
|
|||||||||||
The accompanying notes are an integral part of these financial statements.
F-83
Table of Contents
TREADSTONE ENERGY PARTNERS, LLC
FOR THE YEARS ENDED DECEMBER 31, 2013 AND 2012
| 2012 | 2013 | |||||||
| Cash Flows from Operating Activities |
||||||||
| Net Income |
$ | 2,663,486 | $ | 47,327,805 | ||||
| Adjustments to Reconcile Net lncome to Net Cash |
||||||||
| Depreciation, Depletion, and Amortization |
5,380,620 | 16,130,852 | ||||||
| Accretion Expense |
5,054 | 97,883 | ||||||
| Unrealized Losses on Commodity Derivative Instruments |
— | 3,443,968 | ||||||
| Increase in Oil and Gas Sales Receivable |
(4,666,110 | ) | (9,844,163 | ) | ||||
| (Increase) Decrease in Accounts Receivable |
32,501 | (512,730 | ) | |||||
| Decrease in Prepaid Expenses and Other Current Assets |
483,290 | 242,979 | ||||||
| Increase in Accounts Payable and Accrued Expenses |
4,864,050 | 5,477,290 | ||||||
| Increase in Revenue and Royalties Payable |
1,527,453 | 5,961,193 | ||||||
|
|
|
|
|
|||||
| Net Cash Provided by Operating Activities |
10,290,344 | 68,325,077 | ||||||
|
|
|
|
|
|||||
| Cash Flows from Investing Activities |
||||||||
| Acquisition and Development of Oil and Gas Properties |
(40,184,418 | ) | (90,601,462 | ) | ||||
| Decrease in Deposits |
797,390 | 22,209 | ||||||
|
|
|
|
|
|||||
| Net Cash Used in Investing Activities |
(39,387,028 | ) | (90,579,253 | ) | ||||
|
|
|
|
|
|||||
| Cash Flows from Financing Activities |
||||||||
| Proceeds from Notes Payable |
— | 27,000,000 | ||||||
| Repayments on Notes Payable |
— | (3,600,000 | ) | |||||
| Member Contributions |
33,800,000 | — | ||||||
|
|
|
|
|
|||||
| Net Cash Provided by Financing Activities |
33,800,000 | 23,400,000 | ||||||
|
|
|
|
|
|||||
| Net Increase in Cash and Cash Equivalents |
4,703,316 | 1,145,824 | ||||||
| Cash and Cash Equivalents, Beginning |
996,521 | 5,699,837 | ||||||
|
|
|
|
|
|||||
| Cash and Cash Equivalents, Ending |
$ | 5,699,837 | $ | 6,845,661 | ||||
|
|
|
|
|
|||||
| Supplemental Disclosures of Cash Flow Information |
||||||||
| Interest Paid |
$ | — | $ | 503,773 | ||||
| Non Cash Asset Retirement Obligations Capitalized |
3,194,524 | 827,314 | ||||||
| Non Cash Accruals for Capital Expenditures |
423,226 | 1,000,000 | ||||||
The accompanying notes are an integral part of these financial statements.
F-84
Table of Contents
TREADSTONE ENERGY PARTNERS, LLC
Note 1. Summary of Significant Accounting Policies
Treadstone Energy Partners, LLC (the Company), is an independent oil and gas company engaged primarily in the acquisition, exploration, development, and production of crude oil and natural gas in the State of Texas. The Company was formed as a Delaware limited liability company on February 24, 2011.
Basis of Presentation
The accompanying financial statements have been prepared on the accrual basis of accounting in accordance with accounting principles generally accepted in the United States of America (GAAP).
Cash and Cash Equivalents
For the purpose of the statement of cash flows, the Company considers all highly liquid investments with a maturity of three months or less to be cash equivalents. As of December 31, 2013 and 2012, the Company did not have any short-term investments classified as cash equivalents.
Accounts Receivable
Accounts receivable consist of uncollateralized oil and natural gas revenues due under normal trade terms, as well as amounts due from working interest owners of oil and gas properties for their share of expenses paid on their behalf by the Company. Management reviews receivables periodically and reduces the carrying amount by a valuation allowance that reflects management’s best estimate of the amount that may not be collectible. As of December 31, 2013 and 2012, the valuation allowance was $-0-.
Oil and Gas Producing Activities
The Company follows the full cost method of accounting for oil and gas properties. Under the full cost method, all costs associated with property acquisition, exploration, and development activities are capitalized. Capitalized costs include lease acquisitions, geological and geophysical work, delay rentals, costs of drilling, completing and equipping successful and unsuccessful oil and gas wells, and directly related costs.
Once evaluated, all capitalized costs of oil and gas properties, including the estimated future costs to develop proved reserves and the estimated cost of dismantlement and abandonment, net of salvage value, are amortized on the units-of-production method using estimates of proved reserves. Investments in unproved properties and major development projects are not amortized until proved reserves associated with the projects can be determined or until impairment occurs. If the results of an assessment indicate that properties are impaired, the amount of the impairment is added to the capitalized costs to be amortized.
Costs associated with unproved properties and properties under development are excluded from the full cost amortization base until the properties have been evaluated. Unproved properties are transferred into the full cost pool subject to amortization when management determines that a field has been evaluated through drilling operations or a thorough geologic evaluation.
In addition, the capitalized costs are subject to a “ceiling test”, which basically limits such costs to the aggregate of the “estimated present value”, discounted at a ten percent (10%) interest rate of future net revenues from proved reserves, based on current economic and operating conditions, plus the lower of cost or fair market value of unproved properties.
F-85
Table of Contents
TREADSTONE ENERGY PARTNERS, LLC
NOTES TO FINANCIAL STATEMENTS
Note 1. Summary of Significant Accounting Policies (Continued)
Oil and Gas Producing Activities (Continued)
Sales of proved and unproved properties are accounted for as adjustments of capitalized costs with no gain or loss recognized, unless such adjustments would significantly alter the relationship between capitalized costs and proved reserves of oil and gas, in which case the gain or loss is recognized in income. Abandonment of properties is accounted for as adjustments of capitalized costs with no loss recognized.
The Company follows the guidance of Financial Accounting Standards Board (FASB) Accounting Standards Update (ASU) No. 2010-03, Extractive Activities—Oil and Gas (Topic) 932. This ASU provides estimation and disclosure requirements for oil and gas reserves, designed to align them with the requirements of the Securities and Exchange Commission (SEC). The guidance, among other purposes, is primarily intended to provide investors with a more meaningful and comprehensive understanding of oil and gas producing activities, updating the definition of proved oil and gas reserves to indicate that entities must use the average, first-day-of-the-month price during the 12-month period before the ending date of the period covered by the report, disclosing geographical areas that represent a certain percentage of proved reserves, updating the reserve estimation requirements for changes in practice and technology that have occurred over the past several decades, and requiring an entity to disclose separately the amounts and quantities for consolidated and equity method investments. The Company has applied this guidance to its financial statements for the years ended December 31, 2013 and 2012.
Depreciation, depletion, and amortization (DD&A) is computed on the units-of-production method. DD&A expense includes the amounts computed on capitalized future plugging and abandonment costs. Depreciation, depletion, and amortization expense for the Company’s oil and gas properties totaled $16,118,049 and $5,368,202, for the years ended December 31, 2013 and 2012, respectively.
Other Property and Equipment
Other property and equipment, which includes office furniture and equipment, is depreciated using the straight-line method over the estimated useful lives of the assets ranging from three to ten years. Gain or loss on retirement, sale, or other disposition of these assets is included in income in the period of disposition. Costs of major repairs that extend the useful life are capitalized. Costs for maintenance and repairs are expensed as incurred. Depreciation expense for other property and equipment totaled $12,803 and $12,418, for the years ended December 31, 2013 and 2012, respectively.
Revenue Recognition
The Company recognizes oil and gas revenue from its interests in producing wells using the sales method. Under this method, revenues are recognized based on actual volumes of oil and gas produced and delivered to purchasers. As a result, the Company accrues revenue relating to production for which the Company has not yet received payment.
Hedging Agreements
The Company manages the potential impact of changes in the price of oil and natural gas by entering into derivative commodity instruments (hedges), but does not use them for speculative purposes.
The Company accounts for hedging agreements in accordance with Financial Accounting Standards Board (FASB) Accounting Standards Codification (ASC) 815. ASC 815 requires the Company to recognize all
F-86
Table of Contents
TREADSTONE ENERGY PARTNERS, LLC
NOTES TO FINANCIAL STATEMENTS
Note 1. Summary of Significant Accounting Policies (Continued)
Hedging Agreements (Continued)
derivative instruments on the balance sheet as either an asset or liability, measured at fair value, and requires that changes in a derivative’s fair value be realized currently in earnings, unless hedge accounting criteria are met.
The Company’s hedges are specifically referenced to the NYMEX index prices received for its designated production. Estimating the fair value of derivatives requires complex calculations incorporating estimates of future prices, discount rates, and price movements. As a result, the Company obtains the fair value of its commodity derivatives from the counterparties to those contracts. Because the counterparties are market makers, they are able to provide a literal market value, or what they would be willing to settle such contracts for as of the given date.
Asset Retirement Obligations
The Company accounts for future plugging and abandonment costs in accordance with FASB ASC 410. ASC 410 requires legal obligations associated with the retirement of long-lived assets (i.e., future plugging and abandonment costs) to be recognized at their fair value at the time the obligations are incurred. Upon initial recognition of the liability, that cost is capitalized as part of the carrying amount of the related long-lived asset. The estimate of future plugging and abandonment costs is highly subjective. Management’s current estimate of the Company’s share of such future costs is approximately $4,265,600 and $3,340,403, as of December 31, 2013 and 2012, respectively.
Long-Lived Assets
The Company continually evaluates the recoverability of the carrying value of its long-lived assets, primarily property and equipment. When certain events and circumstances indicate the cost of an asset or assets may be impaired, the Company recognizes a write-down to estimated fair value, which is obtained from quoted prices or expected discounted cash flows from the related assets. There were no impairment losses recognized during the years ended December 31, 2013 and 2012.
Concentration of Credit Risk
Substantially all accounts receivable result from uncollateralized natural gas and oil sales or joint interest billings to third parties in the oil and gas industry. This concentration of customers may impact overall credit risk, as these entities may be similarly affected by changes in economic and other conditions. The Company maintains its cash and cash equivalents in a commercial bank. Management does not believe a significant credit risks exist at December 31, 2013 and 2012.
Income Taxes
The Company is treated as a partnership for income tax purposes and, as such, the members are taxed separately on their distributive share of the Company’s income, whether or not that income is actually distributed.
The Company follows the guidance of the Income Taxes Topic of FASB ASC 740. ASC 740 prescribes a recognition threshold and measurement attribute for financial statement recognition and measurement of a tax position taken or expected to be taken in a tax return, and also provides guidance on various related matters such as derecognition, interest, penalties, and disclosures required. The Company recognizes interest and penalties, if any, related to unrecognized tax benefits in income tax expense.
F-87
Table of Contents
TREADSTONE ENERGY PARTNERS, LLC
NOTES TO FINANCIAL STATEMENTS
Note 1. Summary of Significant Accounting Policies (Continued)
Income Taxes (Continued)
As stated above, taxable income or loss of the Company is included in the tax returns of its members. The Company files a U.S. federal income tax return, and a state franchise tax return in Texas. Returns filed in these jurisdictions for tax years ended on or after December 31, 2011 are subject to examination by the relevant taxing authorities. The Company is not currently under examination by any taxing authority.
The Company’s management has determined that there were no uncertain tax positions as of December 31, 2013 and 2012.
Use of Estimates
The preparation of financial statements in conformity with accounting principles generally accepted in the United States of America requires management to make estimates and assumptions that affect the reported amounts of assets and liabilities at the date of the financial statements and the reported amounts of revenues and expenses during the reporting period. Actual results could differ from those estimates. Material estimates that are particularly susceptible to significant change in the near term include the determination of depreciation, depletion, and amortization, asset retirement obligations, and the valuation of oil and gas properties.
The Company’s oil and gas reserve quantities are the basis for the calculation of depreciation, depletion, and amortization, and impairment of oil and gas properties. Inputs for the Company’s reserve estimates are determined internally. Management emphasizes that reserve estimates are inherently imprecise and that estimates of reserves of non-producing properties and more recent discoveries are more imprecise than those for properties with long production histories.
In addition to the uncertainties inherent in the reserve estimation process, these amounts are affected by historical and projected prices for oil and natural gas which have typically been volatile. It is reasonably possible that the Company’s oil and gas reserve estimates may materially change in subsequent years.
Reclassifications
Certain previously presented amounts have been reclassified to conform to the current financial statement presentation.
Note 2. Significant Customers
During the year ended December 31, 2013, one customer made up 92% of the Company’s revenue and 86% of accounts receivable.
During the year ended December 31, 2012, one customer made up 93% of the Company’s revenue and 93% of accounts receivable.
Note 3. Unproved Properties
The Company is currently participating in oil and gas exploration and development activities. Unproved property costs and exploration costs have been excluded in computing amortization of the full cost pool, as a determination cannot be made about the extent of additional oil reserves that should be classified as proved reserves as a result of these projects. The cost of unproved leases which become productive is reclassified to
F-88
Table of Contents
TREADSTONE ENERGY PARTNERS, LLC
NOTES TO FINANCIAL STATEMENTS
Note 3. Unproved Properties (Continued)
proved properties when proved reserves are discovered on the property. Unproved oil and gas interests are carried at the lower of cost or estimated fair market value.
The following table reflects the net changes in unproved property costs during the years ended December 31, 2013 and 2012:
| 2012 | 2013 | |||||||
| Beginning Balance |
$ | 5,352,287 | $ | 9,918,310 | ||||
| Additions to Capitalized Property Costs Pending the Determination of Proved Reserves |
6,901,412 | 410,217 | ||||||
| Reclassifications to Properties Being Amortized Based on the Determination of Proved Reserves |
(2,335,389 | ) | (9,918,310 | ) | ||||
|
|
|
|
|
|||||
| Ending Balance |
$ | 9,918,310 | $ | 410,217 | ||||
|
|
|
|
|
|||||
The Company has approximately $401,217 of unproved property costs remaining from 2012 included in the balance as of December 31, 2013. The Company expects to complete its evaluation of these costs in 2014.
Note 4. Acquisitions of Oil and Gas Properties
In February 2013, the Company acquired oil and gas properties totaling approximately $4,398,600. In October 2012, the Company acquired certain oil and gas properties for total cash consideration of $16,629,567, which was based on the contract acquisition price of $17,900,000, net of revenues, expenses, and certain other purchase price adjustments agreed to with the seller from the effective date through the closing date.
The Company follows the guidance of FASB ASC 805, Business Combinations, when accounting for acquisition costs incurred on the purchase of a working interest in oil and gas properties. As such, acquisition costs are expensed as incurred. Acquisition expenses from the above transactions totaled $1,066,178 and $1,548,893, for the years ended December 31, 2013 and 2012, respectively.
Note 5. Notes Payable
Notes payable at December 31, 2013 and 2012, consisted of the following:
| 2012 | 2013 | |||||||
| Revolving Loan Agreement for up to $100,000,000, interest at LIBOR (2.73% average rate at December 31, 2013), principal due at maturity February 5, 2017, periodic interest payments, secured by all of the Company’s current and future oil and gas properties and interests, and all hedging instruments. |
$ | — | $ | 23,400,000 | ||||
|
|
|
|
|
|||||
| Total |
$ | — | $ | 23,400,000 | ||||
|
|
|
|
|
|||||
Maturities are as follows for the twelve months ended December 31st:
| 2017 |
$ | 23,400,000 | ||
|
|
|
Interest expense, including loan origination fees, for the years ended December 31, 2013 and 2012, totaled $596,773 and $-0-, respectively.
F-89
Table of Contents
TREADSTONE ENERGY PARTNERS, LLC
NOTES TO FINANCIAL STATEMENTS
Note 5. Notes Payable (Continued)
The Company is subject to certain restrictive financial covenants under the credit facility, including a positive working capital requirement of greater than or equal to 1.0 to 1.0, and a Debt to EBITDAX ratio less than or equal to 4.0 to 1.0, all as defined in the Credit Agreement. The credit facility also includes customary restrictions with respect to liens, indebtedness, loans and investments, material changes in the Company’s business, asset sales or leases or transfers of assets, restricted payments, such as distributions and dividends, mergers or consolidations, and transactions with affiliates. At December 31, 2013, the Company was in compliance with the covenants.
Note 6. Fair Value of Financial Instruments
The Company values its financial instruments as required by FASB ASC 825. The carrying amounts of cash, receivables, commodity derivative instruments, and notes payable approximate fair value. The Company estimates the fair value of its notes payable generally using discounted cash flow analysis based on the Company’s current borrowing rates for similar types of debt. The carrying amounts of the Company’s financial instruments generally approximate their fair values at December 31, 2013 and 2012.
FASB ASC 820, among other matters, establishes a fair value hierarchy that prioritizes the inputs to valuation techniques used to measure fair value.
The three levels of the fair value hierarchy are described below:
Level 1—Quoted prices are available in active markets for identical investments as of the reporting date. The types of investments in Level 1 include listed equity and debt securities.
Level 2—Pricing inputs are other than quoted prices in active markets, which are either directly or indirectly observable as of the reporting date, and fair value is determined through the use of models or other valuation methodologies. Investments which are generally included in this category include less liquid and restricted equity securities and over-the-counter derivatives.
Level 3—Pricing inputs are unobservable for the investment and include situations where there is little, if any, market activity for the investment. The inputs into the determination of fair value require significant management judgment or estimation. Investments that are included in this category generally include general and limited partnership interests in corporate private equity funds, and funds of hedge funds.
In some instances, the inputs used to measure fair value may fall into different levels of the fair value hierarchy. In such instances, an investment’s level within the fair value hierarchy is based on the lowest level of input that is significant to the fair value measurement.
The preceding methods described may produce a fair value calculation that may not be indicative of the net realizable value or reflective of future fair values. Furthermore, although the Company believes its valuation methods are appropriate and consistent with other market participants, the use of different methodologies or assumptions to determine the fair value of certain financial instruments could result in a different fair value measurement at the reporting date. There have been no changes in the methodologies used during the years ended December 31, 2013 and 2012.
F-90
Table of Contents
TREADSTONE ENERGY PARTNERS, LLC
NOTES TO FINANCIAL STATEMENTS
Note 6. Fair Value of Financial Instruments (Continued)
The valuation of the Company’s assets measured on a recurring basis by the above fair value hierarchy at December 31, 2013, is as follows:
| Total | Level 1 | Level 2 | Level 3 | |||||||||||||
| Assets |
$ | — | $ | — | $ | — | $ | — | ||||||||
|
|
|
|
|
|
|
|
|
|||||||||
| Liabilities |
||||||||||||||||
| Commodity Derivative Instruments |
$ | 3,443,968 | $ | — | $ | 3,443,968 | $ | — | ||||||||
|
|
|
|
|
|
|
|
|
|||||||||
The Company had no assets or liabilities measured on a recurring basis by the above fair value hierarchy at December 31, 2012.
Note 7. Commodity Derivative Instruments
The cash settlements of commodity derivative instruments are recorded into revenue. Outstanding instruments not qualifying for hedge accounting treatment are recorded on the balance sheet at fair value, and changes in fair value are recognized in earnings as unrealized gains or losses. As the result of instruments settled during the year, the Company recognized net derivative losses of $2,542,662 and $-0-, respectively, for the years ended December 31, 2013 and 2012. In addition, for the years ended December 31, 2013 and 2012, the Company recognized and $3,443,968 and $-0-, respectively, in unrealized net derivative losses.
As of December 31, 2013, the Company had the following oil and gas derivative contracts still in place:
| Production Period |
Instrument Type |
Volume | Price | |||||||||
| Crude Oil: |
||||||||||||
| 2014 |
Swap | 552,000 Bbls | $ | 90.50 | ||||||||
| 2014 |
Swap | 108,000 Bbls | $ | 89.80 | ||||||||
| Natural Gas: |
||||||||||||
| 2014 |
Swap | 240,000 Mmbtu | $ | 4.19 | ||||||||
At December 31, 2013, the Company recognized gross assets of $-0-, and gross liabilities of $3,443,968, related to the estimated fair value of these derivative instruments. Hedges expected to settle for gains in the next twelve months totaled $-0-, at December 31, 2013. Hedges expected to settle for losses in the next twelve months totaled $3,443,968, at December 31, 2013. All of the Company’s commodity derivative instruments expire by December 31, 2014. There were no commodity derivative instruments in place at December 31, 2012.
F-91
Table of Contents
TREADSTONE ENERGY PARTNERS, LLC
NOTES TO FINANCIAL STATEMENTS
Note 8. Asset Retirement Obligations
The Company accounts for plugging and abandonment costs in accordance with FASB ASC 410.
A reconciliation of the beginning and ending aggregate carrying amount of asset retirement obligations is as follows:
| 2012 | 2013 | |||||||
| Beginning Balance |
$ | 158,135 | $ | 3,340,403 | ||||
| Liabilities Incurred |
3,194,524 | 1,458,518 | ||||||
| Liabilities Settled |
— | — | ||||||
| Liabilities Associated with Sales of Properties |
(17,310 | ) | — | |||||
| Accretion Expense |
5,054 | 97,883 | ||||||
| Revisions |
— | (631,204 | ) | |||||
|
|
|
|
|
|||||
| Estimated Ending Balance |
$ | 3,340,403 | $ | 4,265,600 | ||||
|
|
|
|
|
|||||
Note 9. Commitments and Contingencies
In the course of its normal business affairs, the Company is subject to possible loss contingencies arising from federal, state, and local environmental, health, and safety laws and regulations and third-party litigation. There are no matters which, in the opinion of management, will have a material adverse effect on the financial position, results of operations, or cash flows of the Company.
The Company leases office space from an unrelated party. The lease expires August 31, 2014. Future payments required on the lease agreement as of December 31, 2013, are as follows:
| December 31, |
Amount | |||
| 2014 |
$ | 88,472 | ||
|
|
|
|||
Note 10. Members’ Equity
In connection with the formation of the Company, Kayne Anderson Energy Fund V, L.P., Kayne Anderson Energy Fund V QP, L.P. (collectively Kayne), and Treadstone Energy Partners Management, LLC (Management) entered into a limited liability company agreement and unit purchase agreement dated March 1, 2011. Pursuant to these agreements, the Company may issue an aggregate of 49,250 Series A and 750 Series B common membership units at $1,000 per unit to Kayne and Management, respectively.
Upon request, members are required to make pro rata capital contributions to the Company based on the respective contribution percentage of each member. Net income (loss) is allocated to the members in accordance with the LLC agreement, as appropriate. Amounts distributed to each member shall be allocated and distributed in accordance with the applicable sharing percentages per the LLC agreement based on a structured payout schedule. As of December 31, 2013, there have been no distributions made to members.
Note 11. Employee Benefit Plan
The Company maintains a 401(k) Profit Sharing Plan which covers all employees over the age of 21. Employees are eligible to participate following a three month waiting period. The employer match is 3% under the safe harbor plan. The Company may also make a discretionary profit sharing contribution to the Plan. The Company made contributions totaling $37,363 and $29,750, for the years ended December 31, 2013 and 2012, respectively.
F-92
Table of Contents
TREADSTONE ENERGY PARTNERS, LLC
NOTES TO FINANCIAL STATEMENTS
Note 12. Subsequent Events
Management has evaluated subsequent events through March 19, 2014, the date these financial statements were available to be issued, in accordance with FASB ASC 855, and determined that there were no material subsequent events that required recognition or additional disclosure in these financial statements.
Note 13. Supplemental Information (Unaudited)
Proved Oil and Gas Reserves
Proved oil and gas reserves were estimated by internal petroleum engineers. Proved oil and gas reserves are those quantities of oil and gas, which, by analysis of geoscience and engineering data, can be estimated with reasonable certainty to be economically producible—from a given date forward, from known reservoirs, and under existing economic conditions, operating methods, and government regulations—prior to the time at which contracts providing the right to operate expire, unless evidence indicates that renewal is reasonably certain, regardless of whether deterministic or probabilistic methods are used for the estimation.
The reserves were based on the following assumptions:
| • | Future revenues were based on the average first-day-of-the-month oil and gas prices. Future price changes were included only to the extent provided by existing contractual agreements. |
| • | Production and development costs were computed using year-end costs assuming no change in present economic conditions. |
| • | Future net cash flows were discounted at an annual rate of 10%. |
Uncertainties are inherent in estimating quantities of proved reserves, including many factors beyond the Company’s control. Reserve engineering is a process of estimating subsurface accumulations of oil and gas that cannot be measured in an exact manner, and the accuracy of any reserve estimate is a function of the quality of available data and its interpretation. As a result, estimates by different engineers often vary, sometimes significantly. In addition to the physical factors, such as the results of drilling, testing, and production subsequent to the date of an estimate, economic factors, such as changes in product prices or development and production expenses, may require revision of such estimates. Accordingly, oil and gas quantities ultimately recovered will vary from reserve estimates. These estimates do not include probable or possible reserves. The information provided does not represent management’s estimate of its expected future cash flows or value of proved oil and gas reserves.
All of the Company’s reserves are located in the United States.
F-93
Table of Contents
TREADSTONE ENERGY PARTNERS, LLC
NOTES TO FINANCIAL STATEMENTS
Note 13. Supplemental Information (Unaudited) (Continued)
Proved Oil and Gas Reserves (Continued)
The following summarizes the Company’s estimated total proved reserves at December 31, 2013 and 2012:
| Oil (MBBLS) |
Gas (MMCF) |
NGL (MBBLS) |
MBOE | |||||||||||||
| Estimated at December 31, 2011 |
30 | 73 | — | 42 | ||||||||||||
| Revisions of Previous Estimates |
21 | 270 | 66 | |||||||||||||
| Purchases of Reserves |
46 | 926 | — | 200 | ||||||||||||
| Discoveries and Extensions(1) |
1,541 | 2,830 | — | 2,013 | ||||||||||||
| Production |
(132 | ) | (222 | ) | — | (169 | ) | |||||||||
|
|
|
|
|
|
|
|
|
|||||||||
| Estimated at December 31, 2012 |
1,506 | 3,877 | — | 2,152 | ||||||||||||
| Revisions of Previous Estimates |
1,686 | 373 | — | 1,748 | ||||||||||||
| Purchases of Reserves |
— | — | — | — | ||||||||||||
| Discoveries and Extensions(1) |
17,205 | 16,094 | 2,754 | 22,642 | ||||||||||||
| Production |
(792 | ) | (1,194 | ) | (89 | ) | (1,080 | ) | ||||||||
|
|
|
|
|
|
|
|
|
|||||||||
| Estimated at December 31, 2013 |
19,605 | 19,150 | 2,665 | 25,462 | ||||||||||||
|
|
|
|
|
|
|
|
|
|||||||||
| (1) | Discoveries and extensions during the years ended December 31, 2012 and 2013 were primarily the result of applying hydraulic fracturing technology to recomplete four gross wells during 2012 and drill/recomplete twenty-four gross wells during 2013. |
| Oil (MBBLS) |
Gas (MMCF) |
NGL (MBBLS) |
MBOE | |||||||||||||
| Proved Developed Reserves: |
||||||||||||||||
| December 31, 2012 |
787 | 2,438 | — | 1,193 | ||||||||||||
| December 31,2013 |
3,909 | 5,309 | 670 | 5,464 | ||||||||||||
| Proved Undeveloped Reserves: |
||||||||||||||||
| December 31, 2012 |
719 | 1,439 | — | 959 | ||||||||||||
| December 31, 2013 |
15,696 | 13,841 | 1,995 | 19,998 | ||||||||||||
At December 31, 2013, the date of the most recent reserve report, the approximate undiscounted and discounted (using a discount rate of 10%) future net cash flows before income taxes related to the Company’s proved oil and gas reserves were $1,459,372,000 and $858,350,000, respectively.
Capitalized Costs Relating to Oil and Gas Producing Activities
The following is a summary of capitalized costs at December 31, 2013 and 2012:
| 2012 | 2013 | |||||||
| Proved Properties |
$ | 38,720,051 | $ | 139,656,920 | ||||
| Unproved Properties |
9,918,310 | 410,217 | ||||||
|
|
|
|
|
|||||
| 48,638,361 | 140,067,137 | |||||||
| Accumulated Depreciation, Depletion and Amortization |
(5,384,120 | ) | (21,502,169 | ) | ||||
|
|
|
|
|
|||||
| Net Capitalized Costs |
$ | 43,254,241 | $ | 118,564,968 | ||||
|
|
|
|
|
|||||
F-94
Table of Contents
TREADSTONE ENERGY PARTNERS, LLC
NOTES TO FINANCIAL STATEMENTS
Note 13. Supplemental Information (Unaudited) (Continued)
Costs Incurred in Oil and Gas Producing Activities
Following is a summary of costs incurred in oil and gas property acquisition, exploration, and development activities for 2013 and 2012:
| 2012 | 2013 | |||||||
| Acquisitions |
$ | 19,576,546 | $ | 4,507,491 | ||||
| Exploration |
— | — | ||||||
| Development |
19,793,171 | 86,111,085 | ||||||
|
|
|
|
|
|||||
| Costs Incurred |
$ | 39,369,717 | $ | 90,618,576 | ||||
|
|
|
|
|
|||||
Standardized Measure of Discounted Future Net Cash Flows Relating to Reserves
The following information has been developed utilizing procedures prescribed by FASB ASC 932. It may be useful for certain comparative purposes, but should not be solely relied upon in evaluating the Company or its performance. Further, information contained in the following table should not be considered as representative of realistic assessments of future cash flows, nor should the Standardized Measure of Discounted Future Net Cash Flows be viewed as representative of the current value of the Company.
Under the Standardized Measure, future cash inflows were estimated by applying the 12-month average pricing of oil and gas relating to the Company’s proved reserves to the year-end quantities of those reserves. Future development and production costs represent the estimated future expenditures (based on year-end costs) to be incurred in developing and producing the proved reserves, assuming continuation of existing economic conditions. In addition, asset retirement obligation are included with future production and development costs. There are no future income tax expenses because the Company is a non-taxable entity.
The following is a summary of the standardized measure of discounted future net cash flows as of December 31, 2013 and 2012:
| 2012 | 2013 | |||||||
| (dollars in thousands) | ||||||||
| Future Cash Inflows |
$ | 172,789 | $ | 2,200,117 | ||||
| Future Production Costs |
(40,993 | ) | (435,277 | ) | ||||
| Future Development Costs |
(36,014 | ) | (305,468 | ) | ||||
|
|
|
|
|
|||||
| Future Net Cash Flows |
95,782 | 1,459,372 | ||||||
| 10% Annual Discount for Estimated |
||||||||
| Timing of Cash Flows |
(23,514 | ) | (601,022 | ) | ||||
|
|
|
|
|
|||||
| Standardized Measure of Discounted |
||||||||
| Future Net Cash Flows |
$ | 72,268 | $ | 858,350 | ||||
|
|
|
|
|
|||||
F-95
Table of Contents
TREADSTONE ENERGY PARTNERS, LLC
NOTES TO FINANCIAL STATEMENTS
Note 13. Supplemental Information (Unaudited) (Continued)
Standardized Measure of Discounted Future Net Cash Flows Relating to Reserves (Continued)
The following reconciles the change in the standardized measure of discounted future net cash flows applicable to proved oil and gas reserves:
| 2012 | 2013 | |||||||
| (dollars in thousands) | ||||||||
| Beginning of Year |
$ | 1,139 | $ | 72,268 | ||||
| Sales of Oil and Gas Produced, Net of Production Cost |
(12,051 | ) | (73,949 | ) | ||||
| Net Changes in Prices and Production Costs |
138 | 26,297 | ||||||
| Extensions, Discoveries, and Improved Recovery, Less Related Costs |
75,153 | 727,999 | ||||||
| Development Costs Incurred During the Year Which Were Previously Estimated |
— | 31,584 | ||||||
| Net Change in Estimated Future Development Costs |
— | 1,066 | ||||||
| Revisions to Previous Quantity Estimates |
2,104 | 86,713 | ||||||
| Net Change from Purchases and Sales of Minerals in Place |
— | — | ||||||
| Accretion of Discount |
5,766 | 6,858 | ||||||
| Other |
19 | (20,486 | ) | |||||
|
|
|
|
|
|||||
| End of Year |
$ | 72,268 | $ | 858,350 | ||||
|
|
|
|
|
|||||
F-96
Table of Contents
GLOSSARY OF SELECTED OIL AND NATURAL GAS TERMS
We are in the business of exploring for and producing oil and natural gas. Oil and natural gas exploration is a specialized industry. Many of the terms used to describe our business are unique to the oil and natural gas industry. The following is a description of the meanings of some of the oil and natural gas industry terms used in this document.
3D seismic data. Geophysical data that depicts the subsurface strata in three dimensions.
Area of mutual interest or AMI. A geographic location in which more than one oil and/or natural gas company has a stake. The area of mutual interest is defined by the contract that describes the geographic area contained in the area of mutual interest, the rights each party has (such as the percentage of interest allocated to each company), the length of time during which the contract will be in effect, and how the contract provisions are to be implemented.
Analogous reservoir. Analogous reservoirs, as used in resource assessments, have similar rock and fluid properties, reservoir conditions (depth, temperature, and pressure) and drive mechanisms, but are typically at a more advanced stage of development than the reservoir of interest and thus may provide concepts to assist in the interpretation of more limited data and estimation of recovery. When used to support proved reserves, analogous reservoir refers to a reservoir that shares all of the following characteristics with the reservoir of interest: (i) the same geological formation (but not necessarily in pressure communication with the reservoir of interest; (ii) the same environment of deposition; (iii) similar geologic structure; and (iv) the same drive mechanism.
Basin. A large natural depression on the earth’s surface in which sediments accumulate.
Bbl. One stock tank barrel, or 42 U.S. gallons liquid volume, of oil or other liquid hydrocarbons.
Boe. Barrels of oil equivalent, with 6,000 cubic feet of natural gas being equivalent to one barrel of oil.
Btu or British thermal unit. The quantity of heat required to raise the temperature of one pound of water by one degree Fahrenheit.
Completion. The installation of permanent equipment for the production of oil or natural gas.
Deterministic method. The method of estimating reserves or resources is called deterministic when a single value for each parameter (from the geoscience, engineering or economic data) in the reserves calculation is used in the reserves estimation procedure.
Developed acreage. The number of acres that are allocated or assignable to productive wells or wells capable of production.
Development costs. Capital costs incurred in the acquisition, exploration, development and revisions of proved oil and natural gas reserves divided by proved reserve additions.
Development well. A well drilled within the proved boundaries of an oil or natural gas reservoir with the intention of completing the stratigraphic horizon known to be productive.
Dry hole. A well found to be incapable of producing hydrocarbons in sufficient quantities such that proceeds from the sale of such production exceeds production expenses and taxes.
A-1
Table of Contents
Economically producible or viable. The term economically producible or economically viable, as it relates to a resource, means a resource that generates revenue that exceeds, or is reasonably expected to exceed, the costs of the operation. The value of the products that generate revenue shall be determined at the terminal point of oil and natural gas producing activities.
Estimated ultimate recovery or EUR. Estimated ultimate recovery is the sum of reserves remaining as of a given date and cumulative production as of that date.
Exploitation. Optimizing oil and natural gas production from producing properties or establishing additional reserves in producing areas through additional drilling or the application of new technology.
Exploratory well. A well drilled to find and produce oil or natural gas reserves not classified as proved, to find a new reservoir in a field previously found to be productive of oil or natural gas in another reservoir or to extend a known reservoir.
Field. An area consisting of either a single reservoir or multiple reservoirs all grouped on or related to the same individual geological structural feature and/or stratigraphic condition.
Gross acres or gross wells. The total acres or wells, as the case may be, in which a working interest is owned.
Held by production acreage. Acreage covered by a mineral lease that perpetuates a company’s right to operate a property as long as the property produces a minimum paying quantity of oil or gas.
Horizontal well. A well in which a portion of the well has been drilled horizontally within a productive or potentially productive formation. This operation usually results in the ability of the well to produce higher volumes than a vertical well drilled in the same formation.
Hydraulic fracturing. The technique of improving a well’s production or injection rates by pumping a mixture of fluids into the formation and rupturing the rock, creating an artificial channel. As part of this technique, sand or other material may also be injected into the formation to keep the channel open, so that fluids or natural gases may more easily flow through the formation.
Injection. A well which is used to place liquids or natural gases into the producing zone during secondary/tertiary recovery operations to assist in maintaining reservoir pressure and enhancing recoveries from the field.
MBoe. Thousand barrels of oil equivalent.
Mcf. Thousand cubic feet of natural gas.
MMBoe. Million barrels of oil equivalent.
MMBtu. Million British Thermal Units.
Net acres or net wells. The sum of the fractional working interests owned in gross acres or wells, as the case may be.
NYMEX. New York Mercantile Exchange.
Overriding royalty interest. A fractional, undivided interest or right of participation in the oil or natural gas, or in the proceeds from the sale of the oil or natural gas, produced from a specified tract or tracts, which is limited in duration to the terms of an existing lease and which is not subject to any portion of the expense of development, operation or maintenance.
A-2
Table of Contents
Pad. A temporary drilling location generally consisting of 4-5 acres that is cleared, leveled and surfaced over for siting a drilling rig, trucks and various other equipment required for drilling and completion activities.
Possible oil and natural gas reserves or Possible reserves. Possible oil and natural gas reserves are reserves that are less certain to be recovered than probable reserves.
When deterministic methods are used, the total quantities ultimately recovered from a project have a low probability of exceeding proved plus probable plus possible reserves. When probabilistic methods are used, there should be at least a 10% probability that the total quantities ultimately recovered will equal or exceed the proved plus probable plus possible reserves estimates. Possible reserves may be assigned to areas of a reservoir adjacent to probable reserve where data control and interpretations of available data are progressively less certain. Possible reserves also include incremental quantities associated with a greater percentage of recovery of the hydrocarbons in place than the recovery quantities assumed for probable reserves.
Possible reserves may be assigned where geoscience and engineering data identify directly adjacent portions of a reservoir within the same accumulation that may be separated from proved areas by faults with displacement less than formation thickness or other geological discontinuities and that have not been penetrated by a wellbore, and the registrant believes that such adjacent portions are in communication with the known (proved) reservoir. Possible reserves may be assigned to areas that are structurally higher or lower than the proved area if these areas are in communication with the proved reservoir.
Probabilistic method. The method of estimation of reserves or resources is called probabilistic when the full range of values that could reasonably occur for each unknown parameter (from the geoscience and engineering data) is used to generate a full range of possible outcomes and their associated probabilities of occurrence.
Probable oil and natural gas reserves or Probable reserves. Probable oil and natural gas reserves are reserves that are less certain to be recovered than proved reserves but that, together with proved reserves, are as likely as not to be recovered.
When deterministic methods are used, it is as likely as not that actual remaining quantities recovered will exceed the sum of estimated proved plus probable reserves. When probabilistic methods are used, there should be at least a 50% probability that the actual quantities recovered will equal or exceed the proved plus probable reserves estimates. Probable reserves may be assigned to areas of a reservoir adjacent to proved reserves where data control or interpretations of available data are less certain, even if the interpreted reservoir continuity of structure or productivity does not meet the reasonable certainty criterion. Probable reserves may be assigned to areas that are structurally higher than the proved area if these areas are in communication with the proved reservoir. Probable reserves estimates also include potential incremental quantities associated with a greater percentage recovery of the hydrocarbons in place than assumed for proved reserves.
Productive well. A well that is producing or is capable of production, including natural gas wells awaiting pipeline connections to commence deliveries and oil wells awaiting connection to production facilities.
Prospect. A specific geographic area which, based on supporting geological, geophysical or other data and also preliminary economic analysis using reasonably anticipated prices and costs, is deemed to have potential for the discovery of commercial hydrocarbons.
Proved oil and natural gas reserves or Proved reserves. Proved oil and natural gas reserves are those quantities of oil and natural gas, which, by analysis of geoscience and engineering data, can be estimated with reasonable certainty to be economically producible from a given date forward, from known reservoirs, and under existing economic conditions, operating methods, and government regulation prior to the time at which contracts
A-3
Table of Contents
providing the right to operate expire, unless evidence indicates that renewal is reasonably certain, regardless of whether deterministic or probabilistic methods are used for estimation. The project to extract the hydrocarbons must have commenced, or the operator must be reasonably certain that it will commence the project, within a reasonable time.
The area of the reservoir considered as proved includes all of the following: (i) the area identified by drilling and limited by fluid contacts, if any; and (ii) adjacent undrilled portions of the reservoir that can, with reasonable certainty, be judged to be continuous with it and to contain economically producible oil and natural gas on the basis of available geoscience and engineering data.
In the absence of data on fluid contacts, proved quantities in a reservoir are limited by the lowest known hydrocarbons as seen in a well penetration unless geoscience, engineering or performance data and reliable technology establish a lower contact with reasonable certainty. Where direct observation from well penetrations has defined a highest known oil elevation and the potential exists for an associated gas cap, proved oil reserves may be assigned in the structurally higher portions of the reservoir only if geoscience, engineering or performance data and reliable technology establish the higher contact with reasonable certainty.
Reserves which can be produced economically through application of improved recovery techniques (including, but not limited to, fluid injection) are included in the proved classification when: (i) successful testing by a pilot project in an area of the reservoir with properties no more favorable than in the reservoir as a whole, the operation of an installed program in the reservoir or an analogous reservoir or other evidence using reliable technology establishes the reasonable certainty of the engineering analysis on which the project or program was based; and (ii) the project has been approved for development by all necessary parties and entities, including governmental entities.
Existing economic conditions include prices and costs at which economic producibility from a reservoir is to be determined. The price shall be the twelve-month first day of the month historical average price during the twelve-month period prior to the ending date of the period covered by the report, determined as an unweighted arithmetic average of the first-day-of-the-month price for each month within such period, unless prices are defined by contractual arrangements, excluding escalations based upon future conditions.
Proved undeveloped reserves. Proved undeveloped oil and natural gas reserves are reserves that are expected to be recovered from new wells on undrilled acreage, or from existing wells where a relatively major expenditure is required for recompletion. Reserves on undrilled acreage are limited to those drilling units offsetting productive units that are reasonably certain of production when drilled. Proved reserves for other undrilled units are claimed only where it can be demonstrated with certainty that there is continuity of production from the existing productive formation. Estimates for proved undeveloped reserves will not be attributable to any acreage for which an application of fluid injection or other improved recovery technique is contemplated, unless such techniques have been proved effective by actual tests in the area and in the same reservoir.
Reasonable certainty. If deterministic methods are used, reasonable certainty means a high degree of confidence that the quantities will be recovered. If probabilistic methods are used, there should be at least a 90% probability that the quantities actually recovered will equal or exceed the estimate. A high degree of confidence exists if the quantity is much more likely to be achieved than not, and, as changes due to increased availability of geoscience (geological, geophysical and geochemical), engineering and economic data are made to estimated ultimate recovery with time, reasonably certain estimated ultimate recovery is much more likely to increase or remain constant than to decrease.
Reliable technology. Reliable technology is a grouping of one or more technologies (including computational methods) that has been field tested and has been demonstrated to provide reasonably certain results with consistency and repeatability in the formation being evaluated or in an analogous formation.
A-4
Table of Contents
Reserves. Reserves are estimated remaining quantities of oil and natural gas and related substances anticipated to be economically producible, as of a given date, by application of development projects to known accumulations. In addition, there must exist, or there must be a reasonable expectation that there will exist, the legal right to produce or a revenue interest in the production, installed means of delivering oil and natural gas or related substances to market and all permits and financing required to implement the project.
Reservoir. A porous and permeable underground formation containing a natural accumulation of producible oil and/or natural gas that is confined by impermeable rock or water barriers and is individual and separate from other reservoirs.
Resource play. These plays develop over long periods of time, well-by-well, in large-scale operations. They typically have lower than average long-term decline rates and lower geological and commercial development risk than conventional plays. Unlike most conventional exploration and development, resource plays are relatively predictable in timing, costs, production rates and reserve additions which can provide steady long-term reserves and production growth.
Resources. Resources are quantities of oil and natural gas estimated to exist in naturally occurring accumulations. A portion of the resources may be estimated to be recoverable and another portion may be considered unrecoverable. Resources include both discovered and undiscovered accumulations.
Stratigraphic horizon. A sealed geologic container capable of retaining hydrocarbons that was formed by changes in rock type or pinch-outs, unconformities, or sedimentary features such as reefs.
Undeveloped acreage. Lease acreage on which wells have not been drilled or completed to a point that would permit the production of commercial quantities of oil or natural gas regardless of whether or not such acreage contains proved reserves.
Undeveloped oil and natural gas reserves or Undeveloped reserves. Undeveloped oil and natural gas reserves are reserves of any category that are expected to be recovered from new wells on undrilled acreage, or from existing wells where a relatively major expenditure is required for recompletion. Reserves on undrilled acreage shall be limited to those directly offsetting development spacing areas that are reasonably certain of production when drilled, unless evidence using reliable technology exists that establishes reasonable certainty of economic producibility at greater distances. Undrilled locations can be classified as having undeveloped reserves only if a development plan has been adopted indicating that they are scheduled to be drilled within five years, unless the specific circumstances justify a longer time. Under no circumstances shall estimates for undeveloped reserves be attributable to any acreage for which an application of fluid injection or other improved recovery technique is contemplated, unless such techniques have been proved effective by actual projects in the same reservoir or an analogous reservoir, or by other evidence using reliable technology establishing reasonable certainty.
Working interest. The operating interest that gives the owner the right to drill, produce and conduct operating activities on the property and receive a share of production.
Workover. The repair or stimulation of an existing production well for the purpose of restoring, prolonging or enhancing the production of hydrocarbons.
A-5
Table of Contents
Shares
Energy & Exploration Partners, Inc.
Common Stock
$ Per Share
PROSPECTUS
, 2015
Citigroup
Credit Suisse
RBC Capital Markets
BofA Merrill Lynch
UBS Investment Bank
Scotia Howard Weil
Stephens Inc.
Seaport Global
Table of Contents
PART II
INFORMATION NOT REQUIRED IN PROSPECTUS
ITEM 13. Other Expenses of Issuance and Distribution
The following table sets forth an itemized statement of the amounts of all expenses (excluding underwriting discounts) payable by us in connection with the registration of our common stock offered hereby. With the exception of the Registration Fee, FINRA Filing Fee and New York Stock Exchange listing fee, the amounts set forth below are estimates.
| SEC Registration Fee |
$ | 51,520 | ||
| FINRA Filing Fee |
60,500 | |||
| New York Stock Exchange listing fee |
* | |||
| Accounting fees and expenses |
* | |||
| Auditor fees and expenses |
* | |||
| Legal fees and expenses |
* | |||
| Printing and engraving expenses |
* | |||
| Transfer agent and registrar fees |
* | |||
| Miscellaneous |
* | |||
|
|
|
|||
| Total |
* | |||
|
|
|
| * | To be provided by amendment. |
ITEM 14. Indemnification of Directors and Officers
Our amended and restated certificate of incorporation will provide that a director will not be liable to the corporation or its stockholders for monetary damages for breach of fiduciary duty as a director, except for liability (1) for any breach of the director’s duty of loyalty to the corporation or its stockholders, (2) for acts or omissions not in good faith or which involved intentional misconduct or a knowing violation of the law, (3) under section 174 of the DGCL for unlawful payment of dividends or improper redemption of stock or (4) for any transaction from which the director derived an improper personal benefit. In addition, if the DGCL is amended to authorize the further elimination or limitation of the liability of directors, then the liability of a director of the corporation, in addition to the limitation on personal liability provided for in our certificate of incorporation, will be limited to the fullest extent permitted by the amended DGCL.
Section 145 of the DGCL provides that a corporation may indemnify directors and officers as well as other employees and individuals against expenses, including attorneys’ fees, judgments, fines and amounts paid in settlement in connection with specified actions, suits and proceedings whether civil, criminal, administrative, or investigative, other than a derivative action by or in the right of the corporation, if they acted in good faith and in a manner they reasonably believed to be in or not opposed to the best interests of the corporation and, with respect to any criminal action or proceeding, had no reasonable cause to believe their conduct was unlawful. A similar standard is applicable in the case of derivative actions, except that indemnification extends only to expenses, including attorneys’ fees, incurred in connection with the defense or settlement of such action and the statute requires court approval before there can be any indemnification where the person seeking indemnification has been found liable to the corporation. The statute provides that it is not exclusive of other indemnification that may be granted by a corporation’s certificate of incorporation, bylaws, disinterested director vote, stockholder vote, agreement or otherwise.
Our amended and restated certificate of incorporation and bylaws will contain indemnification rights for our directors and our officers. Specifically, our amended and restated certificate of incorporation and amended and restated bylaws will provide that we shall indemnify, and advance expenses to, our officers and directors to the fullest extent authorized by the DGCL.
II-1
Table of Contents
We will enter into written indemnification agreements with our directors and officers. Under these proposed agreements, if an officer or director makes a claim of indemnification to us, a majority of the independent directors, independent legal counsel or stockholders, as applicable in accordance with the terms of the agreement, must review the relevant facts and make a determination whether the officer or director has met the standards of conduct under Delaware law that would permit (under Delaware law) and require (under the indemnification agreement) us to indemnify the officer or director.
Further, we may maintain insurance on behalf of our officers, and directors against expense, liability or loss asserted incurred by them in their capacities as officers and directors, and on behalf of some of our employees for certain liabilities.
ITEM 15. Recent Sales of Unregistered Securities
In connection with our formation on July 31, 2012, we issued 1,000 shares of our common stock, par value $0.01 per share, to Hunt Pettit in exchange for consideration of $1,000.
On August 22, 2012, in connection with our corporate reorganization, we issued an aggregate of 396,500 shares of our common stock to a group of accredited investors in exchange for certain interests owned by them.
During the period from August 22, 2012 to October 1, 2014, we issued an aggregate of 155,609 restricted shares of our common stock to certain members of our management under our 2012 Stock Incentive Plan pursuant to Restricted Stock Award Agreements. Hunt Pettit contributed 25,000 of his shares of common stock back to us for no consideration, and these shares were used by us to make some of the restricted share awards.
On April 8, 2013 we issued to Highbridge and Apollo notes in the principal amount of $140 million and warrants to purchase an aggregate of 269,231 shares of our Series A Mandatorily Convertible Preferred Stock and Series B Mandatorily Convertible Preferred Stock at an exercise price of $0.01 per share, which we refer to as our mandatorily convertible preferred stock. On December 12, 2013, we issued to Highbridge and Apollo notes in the principal amount of $25 million. On January 31, 2014, we issued to Highbridge and Apollo notes in the principal amount of $15 million. On March 27, 2014, we issued to Highbridge and Apollo notes in the principal amount of $45 million and warrants to purchase an aggregate of 71,122 shares of our mandatorily convertible preferred stock at an exercise price of $0.01 per share.
On July 22, 2014, we issued $375,000,000 in aggregate principal amount of our 8.0% convertible subordinated notes due 2019, which we refer to as convertible notes, in a private placement transaction to qualified institutional buyers in reliance on Rule 144A under the Securities Act of 1933, as amended, which we refer to as the Securities Act. The convertible notes are convertible into shares of our common stock in connection with a qualified, registered public offering of our common stock.
The foregoing issuances of securities did not involve any underwriters, underwriting discounts or commissions, or any public offering, and we believe the issuances were exempt from the registration requirements of the Securities Act pursuant to Section 4(a)(2) thereunder, and in the case of the restricted shares awarded to certain members of management, pursuant to Rule 701 under the Securities Act, and in the case of the convertible notes, pursuant to Rule 144A under the Securities Act.
ITEM 16. Exhibits and Financial Statement Schedules
(a) Exhibits
A list of exhibits filed as part of this registration statement is set forth in the Index to Exhibits, which is incorporated herein by reference.
II-2
Table of Contents
ITEM 17. Undertakings
The undersigned registrant hereby undertakes to provide to the underwriters at the closing specified in the underwriting agreement certificates in such denominations and registered in such names as required by the underwriters to permit prompt delivery to each purchaser.
Insofar as indemnification for liabilities arising under the Securities Act may be permitted to directors, officers and controlling persons of the registrant pursuant to the foregoing provisions, or otherwise, the registrant has been advised that in the opinion of the Securities and Exchange Commission such indemnification is against public policy as expressed in the Securities Act and is, therefore, unenforceable. In the event that a claim for indemnification against such liabilities (other than the payment by the registrant of expenses incurred or paid by a director, officer or controlling person of the registrant in the successful defense of any action, suit or proceeding) is asserted by such director, officer or controlling person in connection with the securities being registered, the registrant will, unless in the opinion of its counsel the matter has been settled by controlling precedent, submit to a court of appropriate jurisdiction the question whether such indemnification by it is against public policy as expressed in the Securities Act and will be governed by the final adjudication of such issue.
The undersigned registrant hereby undertakes that:
(1) For purposes of determining any liability under the Securities Act, the information omitted from the form of prospectus filed as part of this registration statement in reliance upon Rule 430A and contained in a form of prospectus filed by the registrant pursuant to Rule 424(b)(1) or (4) or 497(h) under the Securities Act shall be deemed to be part of this registration statement as of the time it was declared effective.
(2) For the purpose of determining any liability under the Securities Act, each post-effective amendment that contains a form of prospectus shall be deemed to be a new registration statement relating to the securities offered therein, and the offering of such securities at that time shall be deemed to be the initial bona fide offering thereof.
II-3
Table of Contents
SIGNATURES
Pursuant to the requirements of the Securities Act of 1933, the registrant has duly caused this amendment no. 3 to the registration statement to be signed on its behalf by the undersigned, thereunto duly authorized in the City of Fort Worth, State of Texas, on April 29, 2015.
| ENERGY & EXPLORATION PARTNERS, INC. | ||
| By: |
/s/ B. Hunt Pettit | |
| Name: | B. Hunt Pettit | |
| Title: | President and Chief Executive Officer | |
Pursuant to the requirements of the Securities Act of 1933, this amendment no. 3 to the registration statement has been signed by the following persons in the capacities and on the date indicated.
| Signature |
Title |
Date | ||
| /s/ B. Hunt Pettit B. Hunt Pettit |
President, Chief Executive Officer and Director (principal executive officer) |
April 29, 2015 | ||
| * Brian C. Nelson |
Executive Vice President, Chief Financial Officer and Director (principal financial officer) | April 29, 2015 | ||
| * Jamie M. Howe |
Executive Vice President and Chief Accounting Officer (principal accounting officer) | April 29, 2015 | ||
| * David L. Patty, Jr. |
Director | April 29, 2015 | ||
| * Tom D. McNutt |
Director | April 29, 2015 | ||
| * John T. Richards |
Director | April 29, 2015 | ||
| *By | /s/ B. Hunt Pettit |
|||||
| B. Hunt Pettit Attorney-in-Fact |
||||||
II-4
Table of Contents
POWER OF ATTORNEY
Daniel J. Morrison appoints B. Hunt Pettit and Tom D. McNutt, and each of them, any of whom may act without the joinder of the other, as his true and lawful attorneys-in-fact and agents, with full power of substitution and resubstitution, for him and in his name, place and stead, in any and all capacities, to sign any and all amendments (including post-effective amendments) to this Registration Statement and any Registration Statement (including any amendment thereto) for this offering that is to be effective upon filing pursuant to Rule 462(b) under the Securities Act of 1933, as amended, and to file the same, with all exhibits thereto, and all other documents in connection therewith, with the Securities and Exchange Commission, granting unto said attorneys-in-fact and agents full power and authority to do and perform each and every act and thing requisite and necessary to be done, as fully to all intents and purposes as he might or would do in person, hereby ratifying and confirming all that said attorneys-in-fact and agents or any of them or their or his substitute or substitutes, may lawfully do or cause to be done by virtue hereof.
| /s/ Daniel J. Morrison Daniel J. Morrison |
Director | April 29, 2015 | ||
II-5
Table of Contents
INDEX TO EXHIBITS
| Exhibit |
Description | |||
| 1.1* | Form of Underwriting Agreement | |||
| 2.1**† | Purchase and Sale Agreement dated as of June 13, 2014 between Energy & Exploration Partners, LLC and TreadStone Energy Partners, LLC | |||
| 2.2† | Amended and Restated Purchase and Sale Agreement dated as of October 8, 2012 among Energy & Exploration Partners, LLC, Chesapeake Exploration, L.L.C., Arcadia Resources, L.P. and Jamestown Resources L.L.C. (incorporated herein by reference to Exhibit 2.12 to Amendment No. 1 to the Company’s Registration Statement on Form S-1 (Registration No. 333-183808) filed October 17, 2012) | |||
| 2.3† | First Amendment to Amended and Restated Purchase and Sale Agreement dated as of December 28, 2012 among Energy & Exploration Partners, LLC, Chesapeake Exploration, L.L.C., Arcadia Resources, L.P. and Jamestown Resources L.L.C. (incorporated herein by reference to Exhibit 2.17 to Amendment No. 3 to the Company’s Registration Statement on Form S-1 (Registration No. 333-183808) filed May 13, 2013) | |||
| 2.4† | Second Amendment to Amended and Restated Purchase and Sale Agreement dated as of April 8, 2013 among Energy & Exploration Partners, LLC, Chesapeake Exploration, L.L.C., Arcadia Resources, L.P. and Jamestown Resources L.L.C. (incorporated herein by reference to Exhibit 2.18 to Amendment No. 3 to the Company’s Registration Statement on Form S-1 (Registration No. 333-183808) filed May 13, 2013) | |||
| 2.5† | Purchase and Sale Agreement dated as of March 5, 2012 between Energy & Exploration Partners, LLC and Halcón Energy Properties, Inc. (formerly RWG Energy, Inc.) (incorporated herein by reference to Exhibit 2.2 to the Company’s Registration Statement on Form S-1 (Registration No. 333-183808) filed September 10, 2012) | |||
| 2.6† | First Amendment to Purchase and Sale Agreement dated as of April 19, 2012 between Energy & Exploration Partners, LLC and Halcón Energy Properties, Inc. (incorporated herein by reference to Exhibit 2.3 to the Company’s Registration Statement on Form S-1 (Registration No. 333-183808) filed September 10, 2012) | |||
| 2.7 | Second Amendment to Purchase and Sale Agreement dated as of May 10, 2012 between Energy & Exploration Partners, LLC and Halcón Energy Properties, Inc. (incorporated herein by reference to Exhibit 2.4 to the Company’s Registration Statement on Form S-1 (Registration No. 333-183808) filed September 10, 2012) | |||
| 2.8† | Third Amendment to Purchase and Sale Agreement dated as of May 24, 2012 between Energy & Exploration Partners, LLC and Halcón Energy Properties, Inc. (incorporated herein by reference to Exhibit 2.5 to the Company’s Registration Statement on Form S-1 (Registration No. 333-183808) filed September 10, 2012) | |||
| 2.9† | Fourth Amendment to Purchase and Sale Agreement dated as of June 21, 2012 between Energy & Exploration Partners, LLC and Halcón Energy Properties, Inc. (incorporated herein by reference to Exhibit 2.6 to the Company’s Registration Statement on Form S-1 (Registration No. 333-183808) filed September 10, 2012) | |||
| 2.10 | Fifth Amendment to Purchase and Sale Agreement dated as of July 16, 2012 between Energy & Exploration Partners, LLC and Halcón Energy Properties, Inc. (incorporated herein by reference to Exhibit 2.7 to the Company’s Registration Statement on Form S-1 (Registration No. 333-183808) filed September 10, 2012) | |||
II-6
Table of Contents
| Exhibit |
Description | |||
| 2.11† | Sixth Amendment to Purchase and Sale Agreement dated as of July 31, 2012 between Energy & Exploration Partners, LLC and Halcón Energy Properties, Inc. (incorporated herein by reference to Exhibit 2.8 to the Company’s Registration Statement on Form S-1 (Registration No. 333-183808) filed September 10, 2012) | |||
| 2.12 | Seventh Amendment to Purchase and Sale Agreement dated as of August 29, 2012 between Energy & Exploration Partners, LLC and Halcón Energy Properties, Inc. (incorporated herein by reference to Exhibit 2.9 to the Company’s Registration Statement on Form S-1 (Registration No. 333-183808) filed September 10, 2012) | |||
| 2.13 | Eighth Amendment to Purchase and Sale Agreement dated as of September 13, 2012 between Energy & Exploration Partners, LLC and Halcón Energy Properties, Inc. (incorporated herein by reference to Exhibit 2.13 to Amendment No. 1 to the Company’s Registration Statement on Form S-1 (Registration No. 333-183808) filed October 17, 2012) | |||
| 2.14† | Ninth Amendment to Purchase and Sale Agreement dated as of September 17, 2012 between Energy & Exploration Partners, LLC and Halcón Energy Properties, Inc. (incorporated herein by reference to Exhibit 2.14 to Amendment No. 1 to the Company’s Registration Statement on Form S-1 (Registration No. 333-183808) filed October 17, 2012) | |||
| 2.15† | Letter Agreement dated as of October 10, 2012 between Energy & Exploration Partners, LLC and Halcón Energy Properties, Inc. re Notice of Acquisition of Mineral Interest in AMI 1 (incorporated herein by reference to Exhibit 2.15 to Amendment No. 1 to the Company’s Registration Statement on Form S-1 (Registration No. 333-183808) filed October 17, 2012) | |||
| 2.16† | Letter Agreement dated as of October 12, 2012 between Energy & Exploration Partners, LLC and Halcón Energy Properties, Inc. re Notice of Acquisition of Mineral Interest in AMI 2 (incorporated herein by reference to Exhibit 2.16 to Amendment No. 1 to the Company’s Registration Statement on Form S-1 (Registration No. 333-183808) filed October 17, 2012) | |||
| 2.17 | Letter Agreement dated as of March 4, 2013 between Energy & Exploration Partners, LLC and Halcón Energy Properties, Inc. (incorporated herein by reference to Exhibit 2.19 to Amendment No. 3 to the Company’s Registration Statement on Form S-1 (Registration No. 333-183808) filed May 13, 2013) | |||
| 2.18† | Purchase and Sale Agreement dated as of August 23, 2012 between Energy & Exploration Partners, LLC and CEU Huntsville, LLC (incorporated herein by reference to Exhibit 2.11 to the Company’s Registration Statement on Form S-1 (Registration No. 333-183808) filed September 10, 2012) | |||
| 2.19 | Contribution Agreement dated as of August 22, 2012 among Energy & Exploration Partners, Inc., Hunt Pettit, H Pettit HC, Inc., the Fund Limited Partners identified therein, the Niobrara Investors identified therein and Energy & Exploration Partners, LLC (incorporated herein by reference to Exhibit 2.1 to the Company’s Registration Statement on Form S-1 (Registration No. 333-183808) filed September 10, 2012) | |||
| 3.1* | Form of Amended and Restated Certificate of Incorporation of Energy & Exploration Partners, Inc. | |||
| 3.2* | Form of Amended and Restated Bylaws of Energy & Exploration Partners, Inc. | |||
| 3.3 | Certificate of Designations of Series A Mandatorily Convertible Preferred Stock of Energy & Exploration Partners, Inc. (incorporated herein by reference to Exhibit 3.3 to Amendment No. 3 to the Company’s Registration Statement on Form S-1 (Registration No. 333-183808) filed May 13, 2013) | |||
II-7
Table of Contents
| Exhibit |
Description | |||
| 3.4 | Certificate of Designations of Series B Mandatorily Convertible Preferred Stock of Energy & Exploration Partners, Inc. (incorporated herein by reference to Exhibit 3.4 to Amendment No. 3 to the Company’s Registration Statement on Form S-1 (Registration No. 333-183808) filed May 13, 2013) | |||
| 3.5 | Certificate of Amendment to Certificate of Designations of Series A Mandatorily Converted Preferred Stock of Energy & Exploration Partners, Inc. dated March 26, 2014 (incorporated herein by reference to Exhibit 3.5 to Amendment No. 5 to the Company’s Registration Statement on Form S-1 (Registration No. 333-183808) filed April 4, 2014) | |||
| 3.6 | Certificate of Amendment to Certificate of Designations of Series B Mandatorily Converted Preferred Stock of Energy & Exploration Partners, Inc. dated March 26, 2014 (incorporated herein by reference to Exhibit 3.6 to Amendment No. 5 to the Company’s Registration Statement on Form S-1 (Registration No. 333-183808) filed April 4, 2014) | |||
| 3.7** | Certificate of Amendment to Certificate of Designations of Series A Mandatorily Converted Preferred Stock of Energy & Exploration Partners, Inc. dated July 22, 2014 | |||
| 3.8** | Certificate of Amendment to Certificate of Designations of Series B Mandatorily Converted Preferred Stock of Energy & Exploration Partners, Inc. dated July 22, 2014 | |||
| 4.1** | Indenture dated as of July 22, 2014 among Energy & Exploration Partners, Inc. and U.S. Bank National Association, as trustee, relating to the 8.0% Convertible Subordinated Notes due 2019 (including form of Note) | |||
| 4.2** | Registration Rights Agreement dated as of July 22, 2014 among Energy & Exploration Partners, Inc. and Citigroup Global Markets Inc., Credit Suisse Securities (USA) LLC and Global Hunter Securities, LLC/Sea Port Group Securities, LLC | |||
| 4.3** | Second Amended and Restated Registration Rights Agreement dated as of July 10, 2014 among Energy & Exploration Partners, Inc. and its stockholders and warrantholders named therein | |||
| 4.4** | Second Amended and Restated Stockholders Agreement dated as of July 10, 2014 among Energy & Exploration Partners, Inc. and its stockholders and warrantholders named therein | |||
| 4.5 | Form of Warrant to Purchase Series A Preferred Stock (incorporated herein by reference to Exhibit 4.1 to Amendment No. 3 to the Company’s Registration Statement on Form S-1 (Registration No. 333-183808) filed May 13, 2013) | |||
| 4.6 | Form of Warrant to Purchase Series B Preferred Stock (incorporated herein by reference to Exhibit 4.2 to Amendment No. 3 to the Company’s Registration Statement on Form S-1 (Registration No. 333-183808) filed May 13, 2013) | |||
| 4.7** | Form of Amendment to Warrant to Purchase Series A Preferred Stock | |||
| 4.8** | Form of Amendment to Warrant to Purchase Series B Preferred Stock | |||
| 4.9** | Form of Second Amendment to Warrant to Purchase Series B Preferred Stock | |||
| 5.1* | Opinion of Bracewell & Giuliani LLP as to the legality of the securities being registered | |||
| 10.1** | Credit Agreement dated as of July 22, 2014 among the Company, as Holdings, Energy & Exploration Partners, LLC, as Borrower, the Lenders party thereto and Credit Suisse AG, Cayman Islands Branch, as Administrative Agent and Collateral Agent | |||
| 10.2 | Energy & Exploration Partners, Inc. 2012 Stock Incentive Plan (incorporated herein by reference to Exhibit 10.9 to the Company’s Registration Statement on Form S-1 (Registration No. 333-183808) filed September 10, 2012) | |||
II-8
Table of Contents
| Exhibit |
Description | |||
| 10.3* | Form of Employment Agreement for executive officers | |||
| 10.4 | Form of Indemnification Agreement between Energy & Exploration Partners, Inc. and each of its executive officers and directors (incorporated herein by reference to Exhibit 10.13 to Amendment No. 1 to the Company’s Registration Statement on Form S-1 (Registration No. 333-183808) filed October 17, 2012) | |||
| 10.5 | Form of Restricted Stock Award Agreement (incorporated herein by reference to Exhibit 10.10 to Amendment No. 3 to the Company’s Registration Statement on Form S-1 (Registration No. 333-183808) filed May 13, 2013) | |||
| 10.6 | Restricted Stock Award Agreement dated as of August 22, 2012 between Energy & Exploration Partners, Inc. and Brian C. Nelson (incorporated herein by reference to Exhibit 10.11 to the Company’s Registration Statement on Form S-1 (Registration No. 333-183808) filed September 10, 2012) | |||
| 10.7 | First Amendment to Restricted Stock Award Agreement dated as of November 16, 2012 between Energy & Exploration Partners, Inc. and Brian C. Nelson (incorporated herein by reference to Exhibit 10.33 to Amendment No. 3 to the Company’s Registration Statement on Form S-1 (Registration No. 333-183808) filed May 13, 2013) | |||
| 10.8 | Second Amendment to Restricted Stock Award Agreement dated as of December 1, 2013 between Energy & Exploration Partners, Inc. and Brian C. Nelson (incorporated herein by reference to Exhibit 10.42 to Amendment No. 5 to the Company’s Registration Statement on Form S-1 (Registration No. 333-183808) filed April 4, 2014) | |||
| 10.9** | Third Amendment to Restricted Stock Award Agreement dated as of March 31, 2014 between Energy & Exploration Partners, Inc. and Brian C. Nelson | |||
| 10.10 | Restricted Stock Award Agreement dated as of August 22, 2012 between Energy & Exploration Partners, Inc. and Tom D. McNutt (incorporated herein by reference to Exhibit 10.34 to Amendment No. 5 to the Company’s Registration Statement on Form S-1 (Registration No. 333-183808) filed April 4, 2014) | |||
| 10.11 | First Amendment to Restricted Stock Award Agreement dated as of November 16, 2012 between Energy & Exploration Partners, Inc. and Tom D. McNutt (incorporated herein by reference to Exhibit 10.35 to Amendment No. 5 to the Company’s Registration Statement on Form S-1 (Registration No. 333-183808) filed April 4, 2014) | |||
| 10.12 | Second Amendment to Restricted Stock Award Agreement dated as of December 1, 2013 between Energy & Exploration Partners, Inc. and Tom D. McNutt (incorporated herein by reference to Exhibit 10.43 to Amendment No. 5 to the Company’s Registration Statement on Form S-1 (Registration No. 333-183808) filed April 4, 2014) | |||
| 10.13 | Subordinated Unsecured Note dated as of April 8, 2013 from Energy & Exploration Partners, Inc. to Chesapeake Exploration, L.L.C. (incorporated herein by reference to Exhibit 10.38 to Amendment No. 3 to the Company’s Registration Statement on Form S-1 (Registration No. 333-183808) filed May 13, 2013) | |||
| 10.14 | Assignment of Overriding Royalty dated as of August 20, 2012 among BHP Consulting LP and the assignees party thereto (incorporated herein by reference to Exhibit 10.14 to Amendment No. 1 to the Company’s Registration Statement on Form S-1 (Registration No. 333-183808) filed October 17, 2012) | |||
II-9
Table of Contents
| Exhibit |
Description | |||
| 10.15 | Assignment of Overriding Royalty dated as of August 20, 2012 among TDM Holding, LLC and the assignees party thereto (incorporated herein by reference to Exhibit 10.15 to Amendment No. 1 to the Company’s Registration Statement on Form S-1 (Registration No. 333-183808) filed October 17, 2012) | |||
| 10.16 | Assignment of Overriding Royalty dated as of August 29, 2012 among TDM Holding, LLC and the assignees party thereto (incorporated herein by reference to Exhibit 10.16 to Amendment No. 1 to the Company’s Registration Statement on Form S-1 (Registration No. 333-183808) filed October 17, 2012) | |||
| 10.17 | Assignment of Overriding Royalty dated as of August 20, 2012 among INDY Exploration II, LLC and the assignees party thereto (incorporated herein by reference to Exhibit 10.17 to Amendment No. 1 to the Company’s Registration Statement on Form S-1 (Registration No. 333-183808) filed October 17, 2012) | |||
| 10.18 | Assignment of Overriding Royalty dated as of August 20, 2012 among Energy & Exploration Partners, LLC and the assignees party thereto (incorporated herein by reference to Exhibit 10.18 to Amendment No. 1 to the Company’s Registration Statement on Form S-1 (Registration No. 333-183808) filed October 17, 2012) | |||
| 10.19 | Assignment of Overriding Royalty dated as of August 20, 2012 among Energy & Exploration Partners, LLC and the assignees party thereto (incorporated herein by reference to Exhibit 10.19 to Amendment No. 1 to the Company’s Registration Statement on Form S-1 (Registration No. 333-183808) filed October 17, 2012) | |||
| 10.20 | Assignment of Overriding Royalty dated as of August 20, 2012 among Energy & Exploration Partners, LLC and the assignees party thereto (incorporated herein by reference to Exhibit 10.20 to Amendment No. 1 to the Company’s Registration Statement on Form S-1 (Registration No. 333-183808) filed October 17, 2012) | |||
| 10.21 | Assignment of Overriding Royalty dated as of August 20, 2012 among Energy & Exploration Partners, LLC and the assignees party thereto (incorporated herein by reference to Exhibit 10.21 to Amendment No. 1 to the Company’s Registration Statement on Form S-1 (Registration No. 333-183808) filed October 17, 2012) | |||
| 10.22 | Assignment of Overriding Royalty dated as of August 20, 2012 among Energy & Exploration Partners, LLC and the assignees party thereto (incorporated herein by reference to Exhibit 10.22 to Amendment No. 1 to the Company’s Registration Statement on Form S-1 (Registration No. 333-183808) filed October 17, 2012) | |||
| 10.23 | Assignment of Overriding Royalty dated as of August 20, 2012 among Energy & Exploration Partners, LLC and the assignees party thereto (incorporated herein by reference to Exhibit 10.23 to Amendment No. 1 to the Company’s Registration Statement on Form S-1 (Registration No. 333-183808) filed October 17, 2012) | |||
| 10.24 | Assignment of Overriding Royalty dated as of August 20, 2012 among Energy & Exploration Partners, LLC and the assignees party thereto (incorporated herein by reference to Exhibit 10.24 to Amendment No. 1 to the Company’s Registration Statement on Form S-1 (Registration No. 333-183808) filed October 17, 2012) | |||
| 10.25 | Assignment of Overriding Royalty dated as of August 20, 2012 among Energy & Exploration Partners, LLC and the assignees party thereto (incorporated herein by reference to Exhibit 10.25 to Amendment No. 1 to the Company’s Registration Statement on Form S-1 (Registration No. 333-183808) filed October 17, 2012) | |||
II-10
Table of Contents
| Exhibit |
Description | |||
| 10.26 | Stipulation of Interest dated as of August 20, 2012 among Energy & Exploration Partners, LLC, Halcón Energy Properties, Inc., and the assignees party thereto (incorporated herein by reference to Exhibit 10.26 to Amendment No. 1 to the Company’s Registration Statement on Form S-1 (Registration No. 333-183808) filed October 17, 2012) | |||
| 10.27 | Stipulation of Interest dated as of August 20, 2012 among Energy & Exploration Partners, LLC, Halcón Energy Properties, Inc., and TDM Holding, LLC (incorporated herein by reference to Exhibit 10.27 to Amendment No. 1 to the Company’s Registration Statement on Form S-1 (Registration No. 333-183808) filed October 17, 2012) | |||
| 10.28* | Form of Amended and Restated Energy & Exploration Partners, Inc. 2012 Stock Incentive Plan | |||
| 21.1** | Subsidiaries of Energy & Exploration Partners, Inc. | |||
| 23.1 | Consent of Hein & Associates LLP | |||
| 23.2* | Consent of Bracewell & Giuliani LLP (included as part of Exhibit 5.1 hereto) | |||
| 23.3 | Consent of Cawley, Gillespie & Associates, Inc. | |||
| 23.4 | Consent of LaPorte, A Professional Accounting Corporation | |||
| 24.1 | Power of Attorney (included on the signature page of this Registration Statement) | |||
| 99.1 | Consent of Drilling Info, Inc. | |||
| 99.2 | Reserve Report of Cawley, Gillespie & Associates, Inc. as of December 31, 2012 (incorporated herein by reference to Exhibit 99.3 to Amendment No. 3 to the Company’s Registration Statement on Form S-1 (Registration No. 333-183808) filed May 13, 2013) | |||
| 99.3 | Reserve Report of Cawley, Gillespie & Associates, Inc. as of December 31, 2013 (incorporated herein by reference to Exhibit 99.4 to Amendment No. 6 to the Company’s Registration Statement on Form S-1 (Registration No. 333-183808) filed April 4, 2014) | |||
| 99.4 | Reserve Report of Cawley, Gillespie & Associates, Inc. as of December 31, 2014 | |||
| * | To be filed by amendment. |
| ** | Previously filed. |
| † | The schedules and exhibits to this agreement have been omitted pursuant to Item 601(b)(2) of Regulation S-K. The registrant will furnish supplementally a copy of each such schedule and exhibit to the Securities and Exchange Commission upon request. |
II-11