Attached files
| file | filename |
|---|---|
| 8-K - FORM 8-K - EXELON CORP | d915962d8k.htm |
| EX-99.1 - EX-991 - EXELON CORP | d915962dex991.htm |
 Earnings Conference Call
1
st
Quarter 2015
April 29, 2015
Exhibit 99.2 |
 2
Cautionary Statements Regarding Forward-Looking Information
This presentation contains certain forward-looking statements within the
meaning of the Private Securities Litigation Reform Act of 1995, that are
subject to risks and uncertainties. The factors that could cause actual
results to differ materially from the forward-looking statements
made by Exelon Corporation, Commonwealth Edison Company, PECO Energy
Company, Baltimore Gas and Electric Company and Exelon
Generation Company, LLC (Registrants) include those factors discussed herein,
as well as the items discussed in (1) Exelon’s 2014 Annual Report
on Form 10-K in (a) ITEM 1A. Risk Factors, (b) ITEM 7.
Management’s Discussion and Analysis of Financial Condition and
Results of Operations and (c) ITEM 8. Financial Statements and
Supplementary Data: Note 22; (2) Exelon’s First Quarter 2015 Quarterly
Report on Form 10-Q (to be filed on April 29, 2015) in (a) Part II,
Other Information, ITEM 1A. Risk Factors; (b) Part 1, Financial
Information, ITEM 2. Management’s Discussion and Analysis of
Financial Condition and Results of Operations and (c) Part I, Financial
Information, ITEM 1. Financial Statements: Note 17; and (3) other factors
discussed in filings with the SEC by the Registrants. Readers are
cautioned not to place undue reliance on these forward-looking
statements, which apply only as of the date of this presentation. None
of the Registrants undertakes any obligation to publicly release any
revision to its forward-looking statements to reflect events or
circumstances after the date of this presentation.
2015 1Q Earnings Release Slides |
 3
2015 1Q Earnings Release Slides
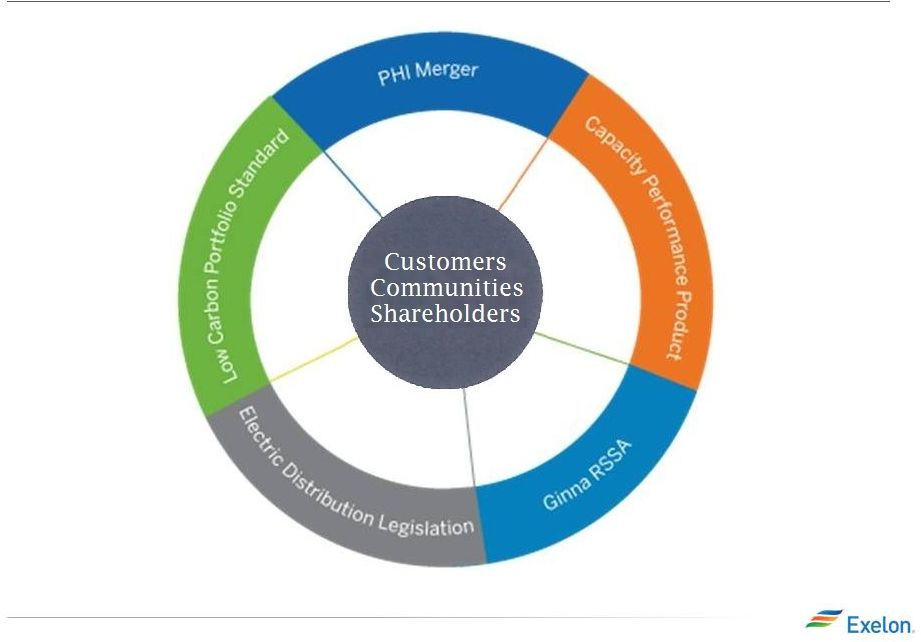
Policy and Business Priorities |
 4
2015 1Q Earnings Release Slides
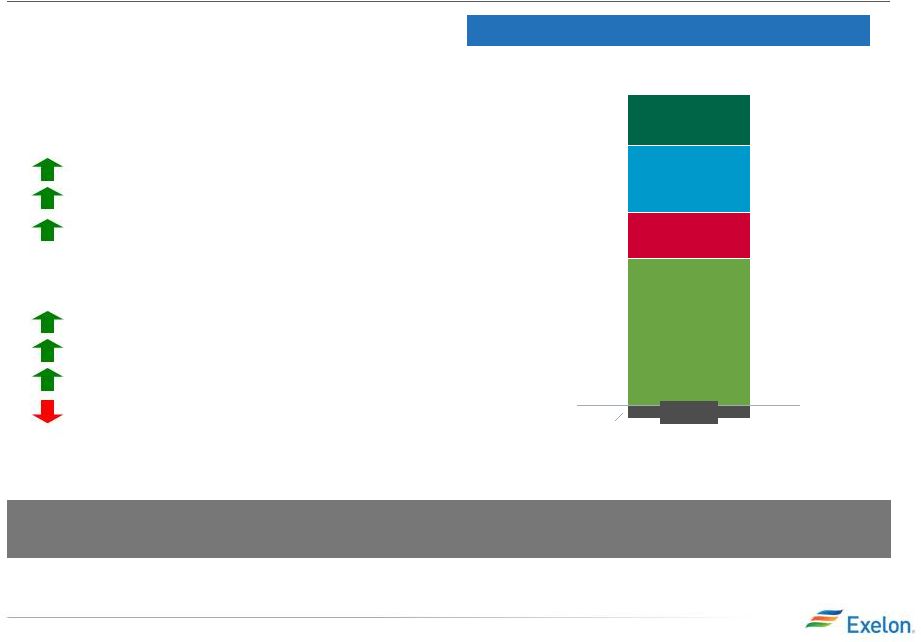
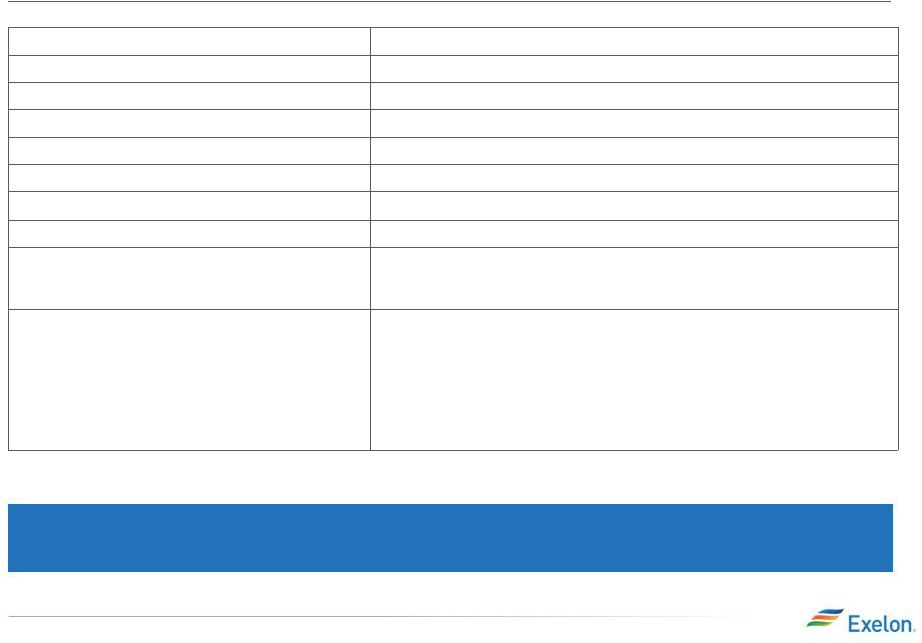
Key Financial Messages
Expect
Q2
2015
earnings
of
$0.45
-
$0.55/share
and
re-affirm
full-year
guidance
range
of
$2.25 -
$2.55/share
(3,4)
BGE
ExGen
ComEd
HoldCo
PECO
$0.35
-$0.03
Q1 2015
$0.11
$0.16
$0.12
$0.71
Adjusted Operating EPS Results
(1,2)
•
Delivered adjusted (non-GAAP) operating
earnings in Q1 of $0.71/share exceeding
our guidance range of $0.60-$0.70/share
•
Utilities
Colder than normal winter
No severe storms
Increased distribution revenues
•
ExGen
Benefits of generation to load match
Higher load serving margins
Strong portfolio management
Impacts of unplanned nuclear outages
(1)
Refer to the Earnings Release Attachments for additional details and to the
Appendix for a reconciliation of adjusted (non-GAAP) operating EPS to GAAP EPS.
(2)
Amounts may not add due to rounding.
(3)
ComEd ROE based on 30 Year average Treasury yield of 2.58% as of 3/31/15.
25 basis point move in 30 Year Treasury Rate equates to +/-$0.01 impact to EPS.
(4)
2015 earnings guidance based on expected average outstanding shares of
~866M. Refer to Appendix for a reconciliation of adjusted non-GAAP operating EPS guidance to GAAP EPS. |
 5
2015 1Q Earnings Release Slides
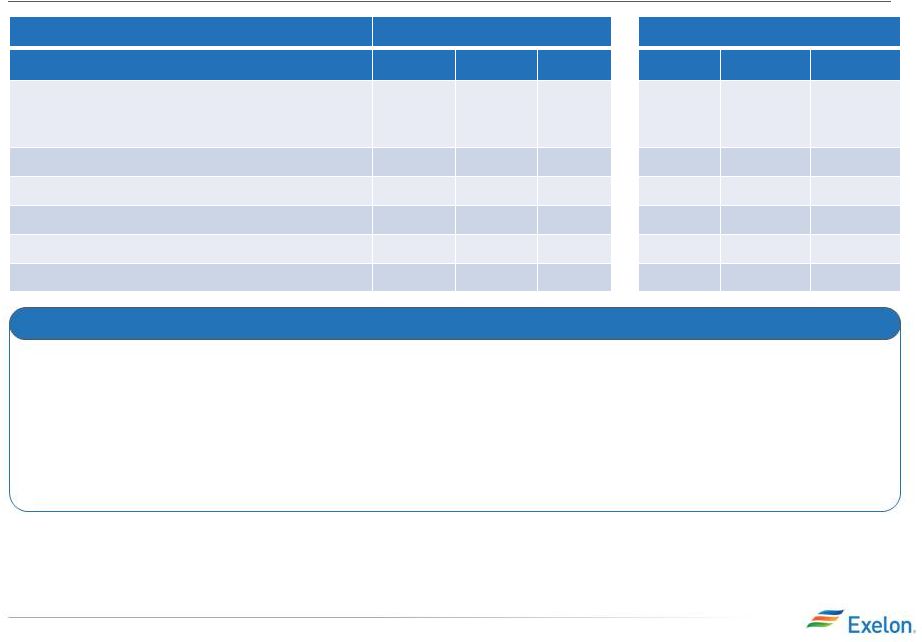
Exelon Generation: Gross Margin Update
March 31, 2015
Change from Dec 31, 2014
Gross Margin Category ($M)
(1)
2015
2016
2017
2015
2016
2017
Open Gross Margin
(3)
(including South, West, Canada hedged gross
margin)
$5,600
$5,900
$6,050
$(100)
$50
$(50)
Mark-to-Market of Hedges
(3,4)
$1,300
$600
$350
$250
$50
-
Power New Business / To Go
$250
$500
$800
$(100)
$(50)
-
Non-Power Margins Executed
$300
$150
$50
$100
$50
-
Non-Power New Business / To Go
$150
$300
$400
$(100)
$(50)
-
Total Gross Margin
(2)
$7,600
$7,450
$7,650
$50
$50
$(50)
•
Load serving business had a strong quarter driven by our generation to load
matching strategy
•
Natural gas declined, power prices were relatively flat, and heat rates
expanded during the quarter
•
Significantly behind ratable in the Midwest reflecting the fundamental upside
we see in power prices in 2016 and 2017
Recent Developments
3)
Excludes EDF’s equity ownership share of the CENG Joint Venture
4)
Mark-to-Market of Hedges assumes mid-point of hedge percentages. 1)
Gross margin categories rounded to nearest $50M.
2)
Total Gross Margin (Non-GAAP) is defined as operating revenues less
purchased power and fuel expense, excluding revenue related to
decommissioning, gross receipts tax, Exelon Nuclear Partners, operating
services agreement with Fort Calhoun and variable interest entities. Total
Gross Margin is also net of direct cost of sales for certain Constellation
businesses. See Slide 27 for a Non-GAAP to GAAP reconciliation
of Total Gross Margin |
 6
2015 1Q Earnings Release Slides
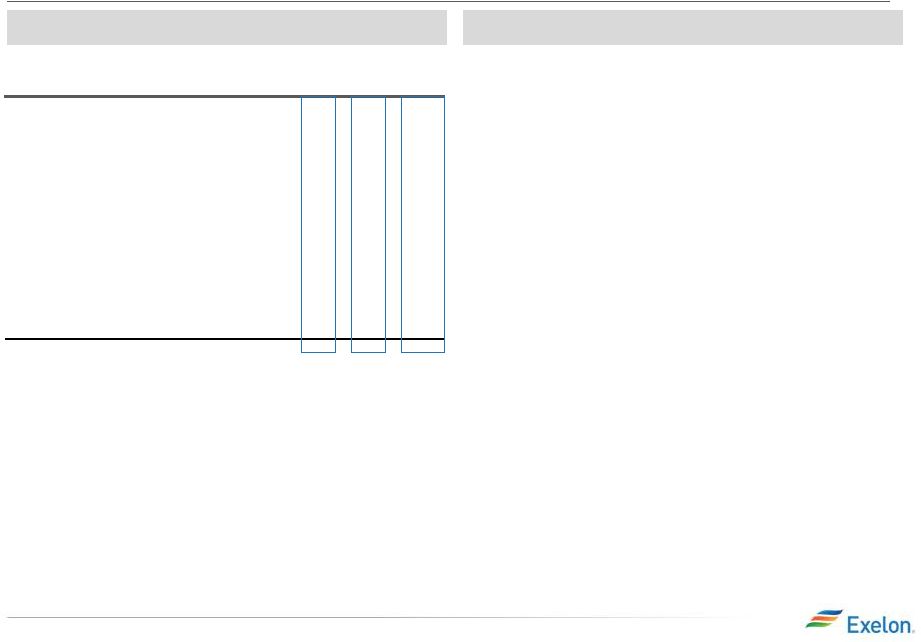
2015 Projected Sources and Uses of Cash
Key Messages
(1)
•
Cash from Operations is projected to be $6,700M vs. 4Q14E of
$6,775M for a ($75M) variance. This variance is driven by:
–
($75M) MTM pre-issuance interest rate hedges
–
($50M) Income taxes and settlements
–
$25M Working capital favorability
–
$25M Higher net income at PECO primarily due to favorable weather
and volume
•
Cash from Financing activities is projected to be $725M vs.
4Q14E of $750M for a ($25M) variance. This variance is driven
by:
–
($125M) Lower project financing at ExGen
–
$50M Increased ComEd LTD requirements
–
$25M Higher commercial paper requirements at ExGen
•
Cash from Investing activities is projected to be ($7,175M) vs.
4Q14E of ($6,975M) for a ($200M) variance. This variance is
driven by:
–
($200M) Grid reliability investments at ComEd
Projected Sources & Uses
(1)
(1)
All amounts rounded to the nearest $25M.
(2)
Does not include collateral.
(3)
Includes cash flow activity from Holding Company and other corporate
entities. (4)
Adjusted Cash Flow from Operations (non-GAAP) primarily includes net cash
flows from operating activities and net cash flows from investing
activities excluding capital expenditures at ownership. (5)
Dividends are subject to declaration by the Board of Directors.
(6)
“Other Financing”
primarily includes expected changes in short-term debt and tax-exempt
bond issuance at ExGen.
($ in millions)
(1)
BGE
ComEd
PECO
ExGen
Exelon
(3)
2015E
As of 4Q14
Variance
3,575
3,575
--
Adjusted Cash Flow from Operations
(4)
600
2,200
625
3,350
6,700
6,775
(75)
CapEx (excluding other items below):
(675)
(2,025)
(500)
(1,925)
(5,225)
(5,100)
(125)
Nuclear Fuel
n/a
n/a
n/a
(1,125)
(1,125)
(1,125)
--
Dividend
(5)
(1,075)
(1,075)
--
Nuclear Uprates
n/a
n/a
n/a
(100)
(100)
(100)
--
Wind
n/a
n/a
n/a
(100)
(100)
(100)
--
Solar
n/a
n/a
n/a
(125)
(125)
(125)
--
Upstream
n/a
n/a
n/a
(25)
(25)
(25)
--
Utility Smart Grid/Smart Meter
(25)
(400)
(50)
n/a
(475)
(400)
(75)
Net Financing (excluding Dividend):
Debt Issuances
250
750
350
750
2,100
2,050
50
Debt Retirements
(75)
(250)
0
(550)
(1,675)
(1,675)
--
Project Finance
n/a
n/a
n/a
75
75
200
(125)
Other Financing
(6)
50
(25)
0
1,100
1,300
1,250
50
3,825
4,125
(300)
2015 1Q Earnings Release Slides
Beginning
Cash
Balance
Ending
Cash
Balance
(2)
(2) |
 7
Exelon Generation Disclosures
March 31, 2015
2015 1Q Earnings Release Slides |
 8
2015 1Q Earnings Release Slides
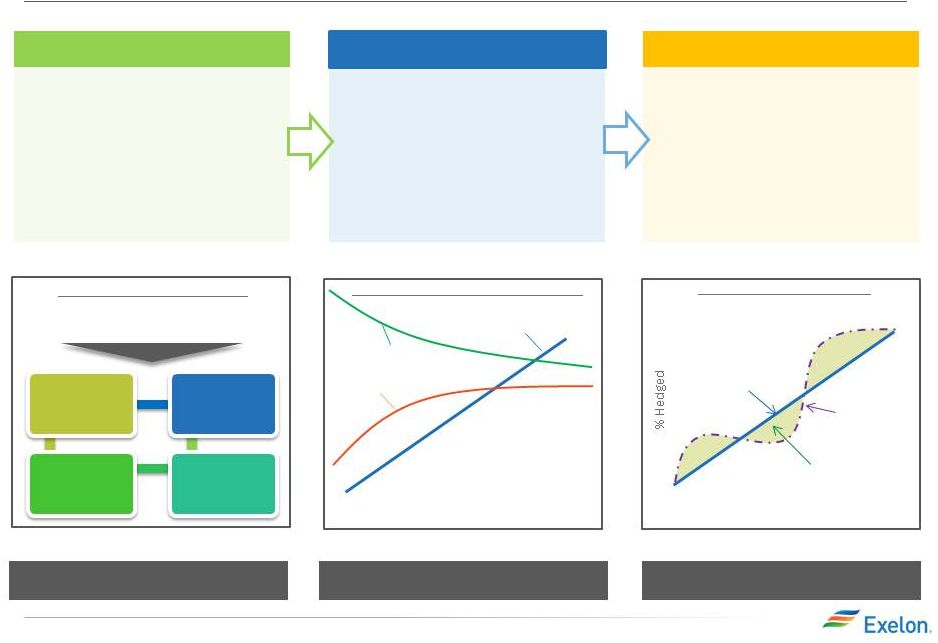
Portfolio Management Strategy
Protect Balance Sheet
Ensure Earnings Stability
Create Value
Exercising Market Views
Purely ratable
Actual hedge %
Market views on timing, product
allocation and regional spreads
reflected in actual hedge %
High End of Profit
Low End of Profit
% Hedged
Open Generation
with LT Contracts
Portfolio Management &
Optimization
Portfolio Management Over Time
Align Hedging & Financials
Establishing Minimum Hedge Targets
2015 1Q Earnings Release Slides
Capital
Structure
Credit Rating
Capital &
Operating
Expenditure
Dividend
Strategic Policy Alignment
•Aligns hedging program with
financial policies and financial
outlook
•Establish minimum hedge targets
to meet financial objectives of the
company (dividend, credit rating)
•Hedge enough commodity risk to
meet future cash requirements
under a stress scenario
Three-Year Ratable Hedging
•Ensure stability in near-term cash
flows and earnings
•Disciplined approach to hedging
•Tenor aligns with customer
preferences and market liquidity
•Multiple channels to market that
allow us to maximize margins
•Large open position in outer years
to benefit from price upside
Bull / Bear Program
•Ability to exercise fundamental
market views to create value within
the ratable framework
•Modified timing of hedges versus
purely ratable
•Cross-commodity hedging (heat
rate positions, options, etc.)
•Delivery locations, regional and
zonal spread relationships |
 9
2015 1Q Earnings Release Slides
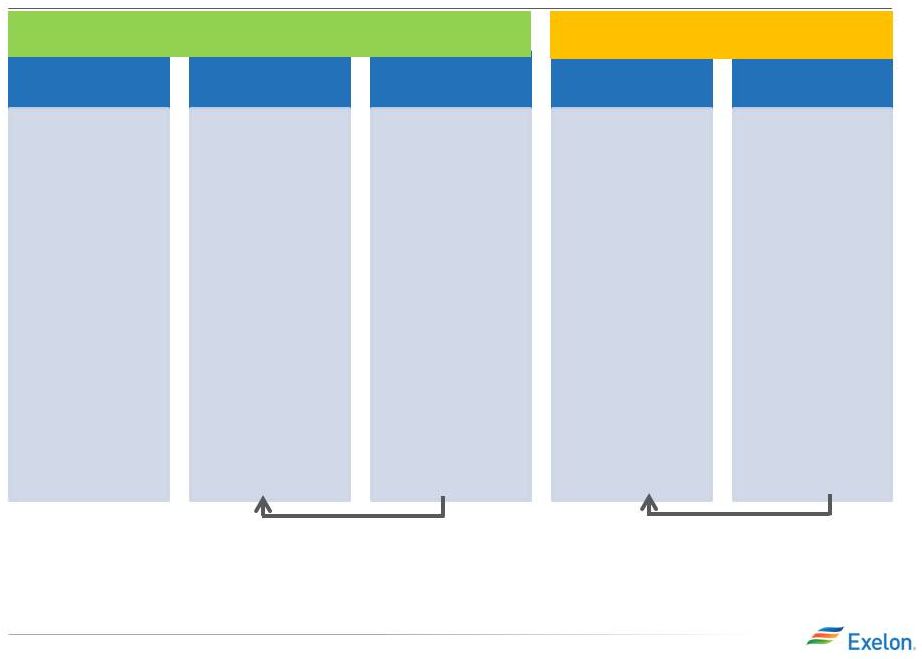
Components of Gross Margin Categories
Gross margin linked to power production and sales
Gross margin from
other business activities
Open Gross
Margin
•Generation Gross
Margin at current
market prices,
including capacity
and ancillary
revenues, nuclear
fuel amortization
and fossils fuels
expense
•Exploration and
Production
(4)
•Power Purchase
Agreement (PPA)
Costs and
Revenues
•Provided at a
consolidated level
for all regions
(includes hedged
gross margin for
South, West and
Canada
(1)
)
MtM
of
Hedges
(2)
•Mark-to-Market
(MtM) of power,
capacity and
ancillary hedges,
including cross
commodity, retail
and wholesale load
transactions
•Provided directly at
a consolidated
level for five major
regions. Provided
indirectly for each
of the five major
regions via
Effective Realized
Energy Price
(EREP), reference
price, hedge %,
expected
generation
“Power”
New
Business
•Retail, Wholesale
planned electric
sales
•Portfolio
Management new
business
•Mid marketing new
business
“Non Power”
Executed
•Retail, Wholesale
executed gas sales
•Load Response
•Energy Efficiency
(4)
•BGE Home
(4)
•Distributed Solar
“Non Power”
New Business
•Retail, Wholesale
planned gas sales
•Load Response
•Energy Efficiency
(4)
•BGE Home
(4)
•Distributed Solar
•Portfolio
Management /
origination fuels
new business
•Proprietary
trading
(3)
(1) Hedged gross margins for South, West & Canada region will be included
with Open Gross Margin, and no expected generation, hedge %, EREP or reference prices provided for this region
(2) MtM of hedges provided directly for the five larger regions; MtM of hedges
is not provided directly at the regional level but can be easily estimated using EREP, reference price and hedged MWh
(3) Proprietary trading gross margins will generally remain within “Non
Power” New Business category and only move to “Non Power” Executed category upon management discretion
(4) Gross margin for these businesses are net of direct “cost of
sales” (5) Margins for South, West & Canada regions and optimization of fuel and
PPA activities captured in Open Gross Margin Margins
move
from
new
business
to
MtM
of
hedges
over
the
course
of
the
year
as
sales
are
executed
(5)
Margins
move
from
“Non
power
new
business”
to
“Non
power
executed”
over
the
course
of
the
year
2015 1Q Earnings Release Slides |
 10
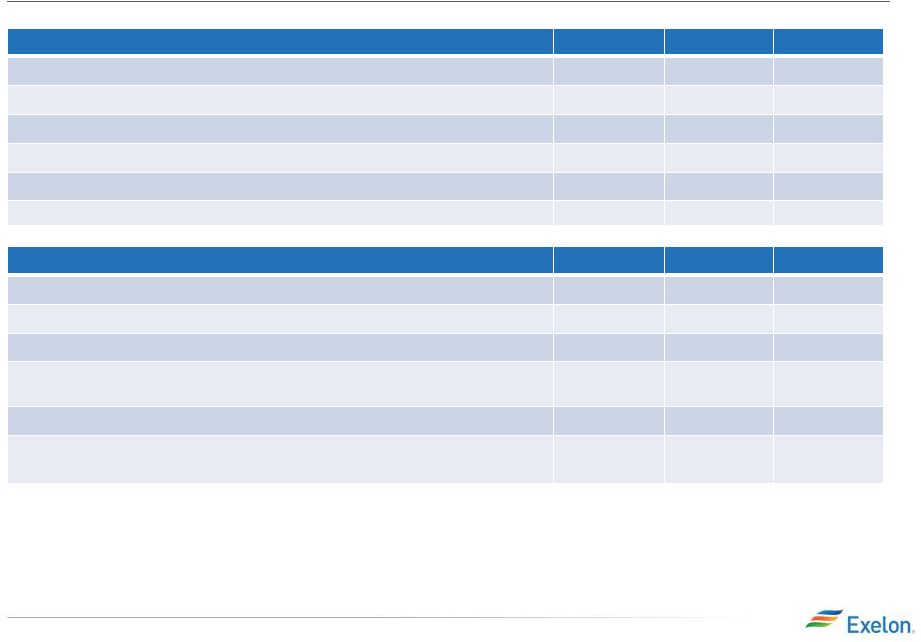
2015 1Q Earnings Release Slides
ExGen Disclosures
2015
2016
2017
Open Gross Margin
(including South, West & Canada hedged GM)
(3)
$5,600
$5,900
$6,050
Mark-to-Market of Hedges
(3,4)
$1,300
$600
$350
Power New Business / To Go
$250
$500
$800
Non-Power Margins Executed
$300
$150
$50
Non-Power New Business / To Go
$150
$300
$400
$7,600
$7,450
$7,650
(1)
Gross margin categories rounded to nearest $50M
(2)
Total Gross Margin (Non-GAAP) is defined as operating revenues less
purchased power and fuel expense, excluding revenue related to
decommissioning, gross receipts tax, Exelon Nuclear Partners, operating
services agreement with Fort Calhoun and variable interest entities.
Total Gross Margin is also net of direct cost of sales for certain Constellation
businesses. See Slide
27 for a Non-GAAP to GAAP reconciliation of Total Gross Margin
(3)
Excludes EDF’s equity ownership share of the CENG Joint Venture
(4)
Mark-to-Market of Hedges assumes mid-point of hedge percentages
(5)
Based on March 31, 2015 market conditions
2015 1Q Earnings Release Slides
Reference
Prices
(5)
2015
2016
2017
Henry Hub Natural Gas ($/MMbtu)
$2.83
$3.11
$3.35
Midwest: NiHub ATC prices ($/MWh)
$30.74
$31.06
$31.23
Mid-Atlantic: PJM-W ATC prices ($/MWh)
$39.25
$38.73
$38.12
ERCOT-N ATC Spark Spread ($/MWh)
HSC Gas, 7.2HR, $2.50 VOM
$4.90
$4.84
$4.97
New York: NY Zone A ($/MWh)
$35.63
$36.54
$35.95
New England: Mass Hub ATC Spark Spread($/MWh)
ALQN Gas, 7.5HR, $0.50 VOM
$7.54
$9.36
$10.47
Gross
Margin
Category
($M)
(1)
Total
Gross
Margin
(2) |
 11
2015 1Q Earnings Release Slides
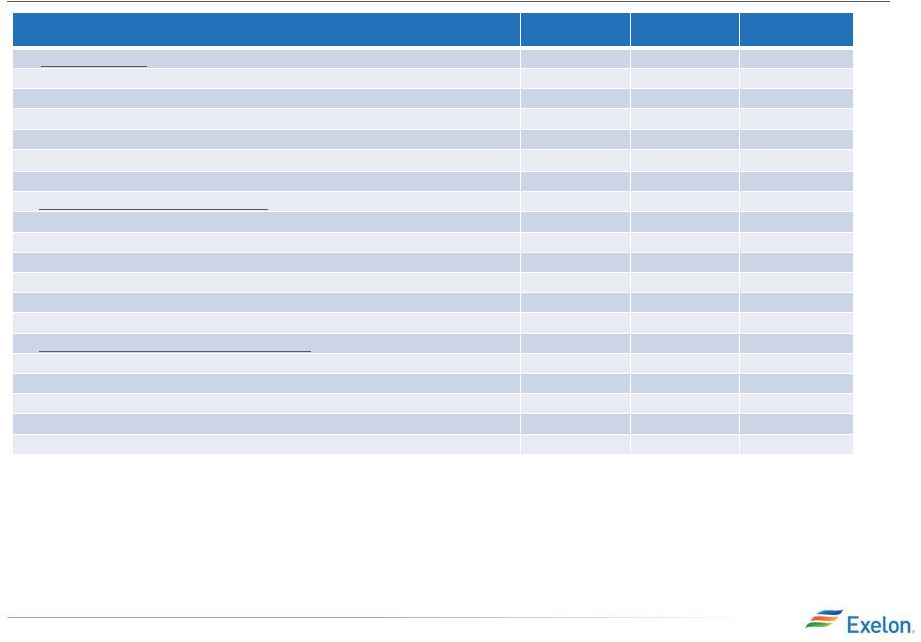
ExGen Disclosures
Generation and Hedges
2015
2016
2017
Exp. Gen (GWh)
(1)
193,000
200,500
205,100
Midwest
96,400
97,400
95,900
Mid-Atlantic
(2)
61,900
63,200
61,100
ERCOT
15,300
17,400
26,100
New York
(2)
9,200
9,300
9,300
New England
10,200
13,200
12,700
% of Expected Generation Hedged
(3)
94%-97%
67%-70%
37%-40%
Midwest
93%-96%
64%-67%
30%-33%
Mid-Atlantic
(2)
99%-102%
75%-78%
47%-50%
ERCOT
98%-101%
83%-86%
53%-56%
New York
(2)
82%-85%
57%-60%
35%-38%
New England
77%-80%
37%-40%
16%-19%
Effective Realized Energy Price ($/MWh)
(4)
Midwest
$35.00
$34.00
$35.00
Mid-Atlantic
(2)
$47.50
$44.00
$45.00
ERCOT
(5)
$14.00
$9.50
$8.00
New York
(2)
$47.00
$44.50
$40.50
New England
(5)
$32.50
$17.00
$12.50
2015 1Q Earnings Release Slides
(1) Expected generation is the volume of energy that best represents our
commodity position in energy markets from owned or contracted for capacity based upon a simulated dispatch
model that makes assumptions regarding future market conditions, which are
calibrated to market quotes for power, fuel, load following products, and options. Expected generation
assumes 14 refueling outages in 2015, 12 in 2016, and 15 in 2017 at
Exelon-operated nuclear plants, and Salem. Expected generation assumes capacity factors of 93.0%, 94.1% and
93.4% in 2015, 2016 and 2017 respectively at Exelon-operated nuclear
plants, at ownership. These estimates of expected generation in 2016 and 2017 do not represent guidance or a
forecast of future results as Exelon has not completed its planning or
optimization processes for those years. (2) Excludes EDF’s equity ownership share of CENG Joint Venture. (3) Percent
of expected generation hedged is the amount of equivalent sales divided by
expected generation. Includes all hedging products, such as wholesale and retail sales of power, options and
swaps. (4) Effective realized energy price is representative of an
all-in hedged price, on a per MWh basis, at which expected generation has been hedged. It is developed by considering the
energy revenues and costs associated with our hedges and by considering the
fossil fuel that has been purchased to lock in margin. It excludes uranium costs and RPM capacity revenue,
but includes the mark-to-market value of capacity contracted at prices
other than RPM clearing prices including our load obligations. It can be compared with the reference prices used to
calculate open gross margin in order to determine the mark-to-market
value of Exelon Generation's energy hedges. (5) Spark spreads shown for ERCOT and New England.
|
 12
2015 1Q Earnings Release Slides
ExGen Hedged Gross Margin Sensitivities
Gross
Margin
Sensitivities
(With
Existing
Hedges)
(1)
2015
2016
2017
Henry Hub Natural Gas ($/Mmbtu)
$(40)
$240
$580
$75
$(225)
$(570)
NiHub ATC Energy Price
$20
$170
$335
$(15)
$(170)
$(330)
PJM-W ATC Energy Price
$(15)
$70
$175
$15
$(65)
$(170)
NYPP Zone A ATC Energy Price
$5
$10
$25
$(10)
$(15)
$(30)
Nuclear Capacity Factor
+/-
$35
+/-
$45
+/-
$45
(1)
Based on March 31, 2015 market conditions and hedged position; Gas price
sensitivities are based on an assumed gas-power relationship derived from an internal model that is updated
periodically; Power prices sensitivities are derived by adjusting the power
price assumption while keeping all other prices inputs constant; Due to correlation of the various assumptions,
the hedged gross margin impact calculated by aggregating individual
sensitivities may not be equal to the hedged gross margin impact calculated when correlations between the various
assumptions are also considered; Sensitivities based on commodity exposure
which includes open generation and all committed transactions; Excludes EDF’s equity share of CENG Joint
Venture
2015 1Q Earnings Release Slides
+ $1/Mmbtu
-
$1/Mmbtu
+ $5/MWh
-
$5/MWh
+ $5/MWh
-
$5/MWh
+ $5/MWh
-
$5/MWh
+/-
1% |
 13
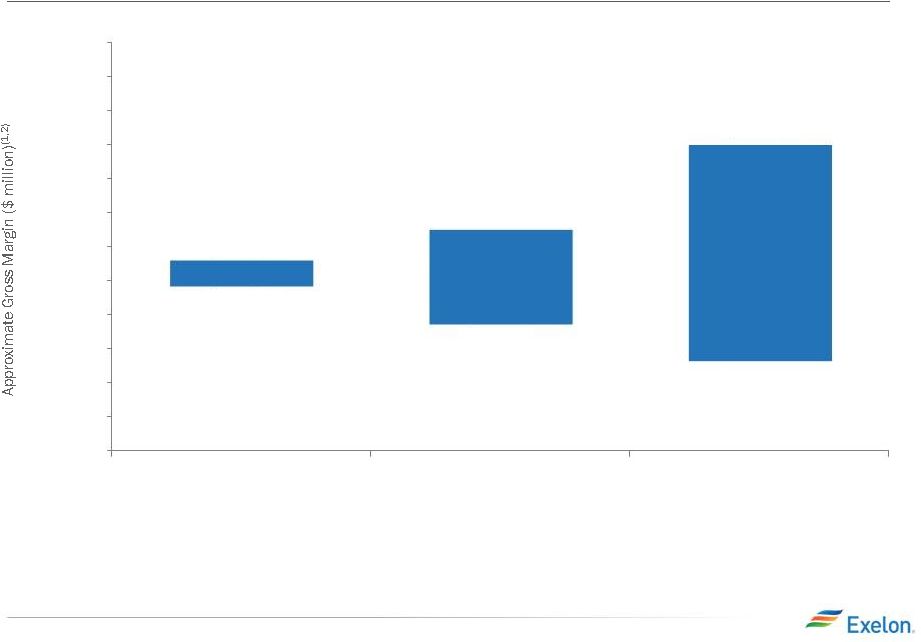
ExGen Hedged Gross Margin Upside/Risk
$7,800
$7,400
$8,250
$6,850
$9,500
$6,300
2015
2016
2017
5,000
5,500
6,000
6,500
7,000
7,500
8,000
8,500
9,000
9,500
10,000
10,500
11,000
(1)
Represents an approximate range of expected gross margin, taking into account
hedges in place, between the 5th and 95th percent confidence levels assuming all
unhedged supply is sold into the spot market; Approximate gross margin ranges
are based upon an internal simulation model and are subject to change based upon market
inputs, future transactions and potential modeling changes; These ranges of
approximate gross margin in 2016 and 2017 do not represent earnings guidance or a forecast
of future results as Exelon has not completed its planning or optimization
processes for those years; The price distributions that generate this range are calibrated to market
quotes for power, fuel, load following products, and options as of March 31,
2015
(2)
Gross Margin Upside/Risk based on commodity exposure which includes open
generation and all committed transactions
(3)
Gross Margin (Non-GAAP) is defined as operating revenues less purchased
power and fuel expense, excluding revenue related to decommissioning, gross receipts tax, Exelon
Nuclear Partners, operating services agreement with Fort Calhoun and variable
interest entities. Total Gross Margin is also net of direct cost of sales for certain Constellation
businesses. See Slide
27 for a Non-GAAP to GAAP reconciliation of Total Gross Margin Excludes EDF’s equity ownership share of the CENG Joint Venture
2015 1Q Earnings Release Slides |
 14
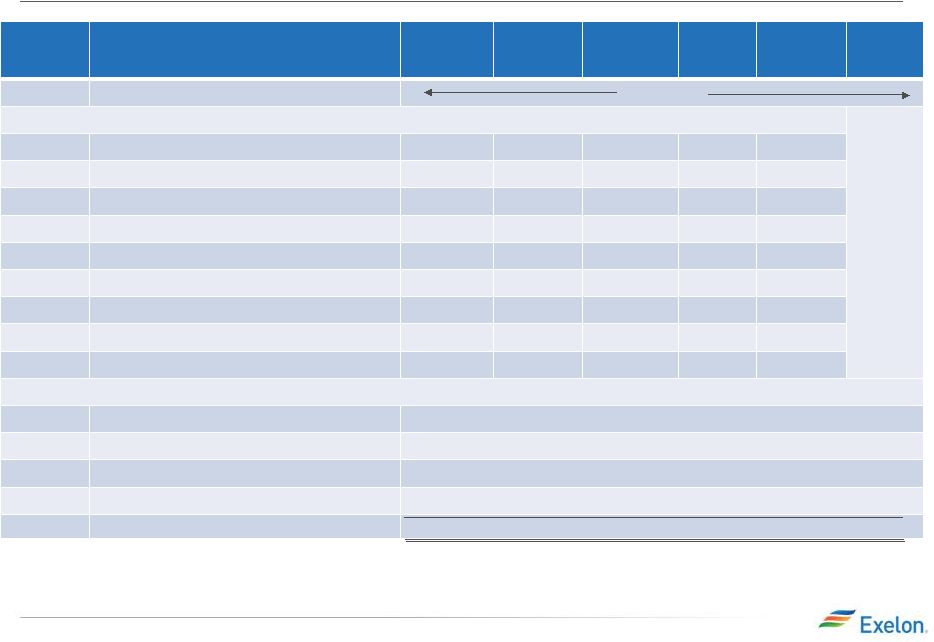
2015 1Q Earnings Release Slides
Illustrative Example of Modeling Exelon
Generation
2016 Gross Margin
Row
Item
Midwest
Mid-
Atlantic
ERCOT
New York
New
England
South,
West &
Canada
(A)
Start with fleet-wide open gross margin
$5.90 billion
(B)
Expected Generation (TWh)
97.4
63.2
17.4
9.3
13.2
(C)
Hedge % (assuming mid-point of range)
65.5%
76.5%
84.5%
58.5%
38.5%
(D=B*C)
Hedged Volume (TWh)
63.8
48.3
14.7
5.4
5.1
(E)
Effective Realized Energy Price ($/MWh)
34.00
44.00
9.50
44.50
17.00
(F)
Reference Price ($/MWh)
31.06
38.73
4.84
36.54
9.36
(G=E-F)
Difference ($/MWh)
2.94
5.27
4.66
7.96
7.64
(H=D*G)
Mark-to-market value of hedges ($ million)
(1)
185
255
70
45
40
(I=A+H)
Hedged Gross Margin ($ million)
$6,500
(J)
Power New Business / To Go ($ million)
$500
(K)
Non-Power Margins Executed ($ million)
$150
(L)
Non-Power New Business / To Go ($ million)
$300
(N=I+J+K+L)
Total Gross Margin
(2)
$7,450 million
(1)
Mark-to-market rounded to the nearest $5 million
(2)
Total Gross Margin (Non-GAAP) is defined as operating revenues less
purchased power and fuel expense, excluding revenue related to decommissioning, gross receipts
tax, Exelon Nuclear Partners operating services agreement with Fort Calhoun and
variable interest entities. Total Gross Margin is also net of direct cost of sales for
certain Constellation businesses. See Slide 27 for a Non-GAAP to GAAP reconciliation
of Total Gross Margin
2015 1Q Earnings Release Slides |
 15
2015 1Q Earnings Release Slides
Additional Disclosures
2015 1Q Earnings Release Slides |
 2015 1Q Earnings Release Slides
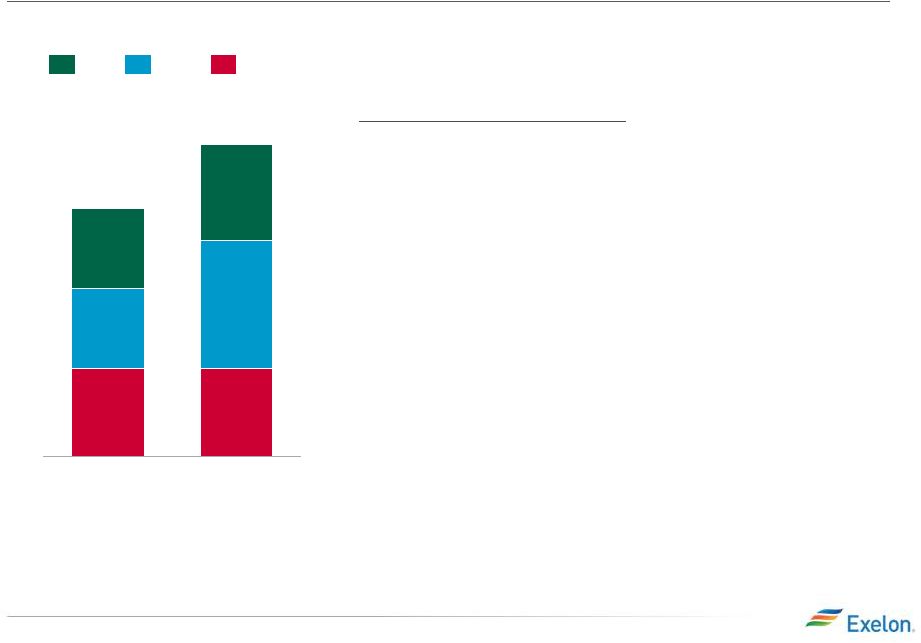
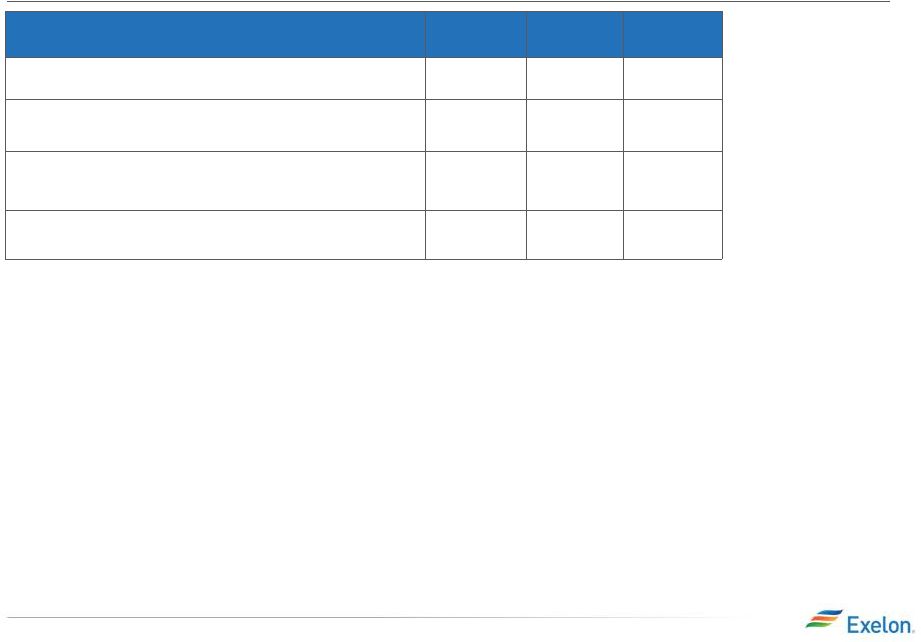
Exelon Utilities Adjusted Operating EPS Contribution
(1)
Key Drivers –
1Q15 vs. 1Q14
:
BGE
(+0.02):
•
Increased distribution revenue due to rate case: $0.02
PECO (+0.06):
•
Decreased storm costs: $0.05
•
Favorable weather and volume: $0.01
ComEd
(0.00):
•
Unfavorable weather and volume
(2)
: $(0.01)
•
Decreased
distribution
(2)
earnings
due
to
lower
return
on
common equity: $(0.01)
•
Increased distribution
(2)
earnings due to increased capital
investments: $0.01
1Q 2015
$0.39
$0.11
$0.16
$0.12
1Q 2014
$0.31
$0.11
$0.10
$0.10
BGE
ComEd
PECO
16
2015 1Q Earnings Release Slides
Numbers may not add due to rounding.
(1)
Refer to the Earnings Release Attachments for additional details and to the
Appendix for a reconciliation of adjusted (non-GAAP) operating EPS to GAAP EPS.
(2)
Due to the distribution formula rate, changes in ComEd’s earnings are
driven primarily by changes in 30-year U.S. Treasury rates (inclusive of ROE), rate base and capital
structure in addition to weather, load and changes in customer mix.
|
 2015 1Q Earnings Release Slides
2015 Regulatory and Legislative Timelines
ExGen
Exelon Utilities
PHI Acquisition
Illinois
Legislative
Session
Begins (Jan
14)
FERC Issues
Deficiency
Letter on
PJM Capacity
Performance
Proposal
(March 31)
FERC Agrees
to Delay PJM
BRA Auction
(April 24)
Supreme
Court
decision on
cert in EPSA
v. FERC
(Demand
Response)
(May)
Supreme
Court
Decision in
Michigan vs.
EPA (MATS)
(June)
PJM BRA
Auction (No
later than
August 10-
14)
Illinois
Legislative
Veto Session
(Nov)
IL Senate
Committee
approves
LCPS &
ComEd
legislation
(March 27)
PJM
Responds to
FERC
Deficiency
Letter (April
10)
MATS Rule in
Effect (April)
Illinois
Legislative
Session
Adjourns
(May 31)
FERC
Deadline to
Respond to
CP
Deficiency
(June 9)
Final Clean
Power Rule
(111d)
Issued (Mid-
Summer)
PECO Electric Rate
Case and LTIIP Filing
(March 27)
ComEd Formula
Rate Filing (April15)
BGE Electric and
Gas Rate Case Filing
(TBD) MD PSC
Ruling Expected 7
Months after Filing
PaPUC Ruling
Expected on LTIIP
Filing (Q3)
PaPUC Ruling
Expected on PECO
Electric Rate Case
(Dec)
ICC Rules on ComEd
Formula Rate Filing
(Dec)
Settlement
Filed in New
Jersey (Jan
14)
Maryland
Hearings
(Jan 26 –
Feb 10)
New Jersey
Approval
(Feb 11)
Settlement
filed in
Delaware (Feb
13)
Multi-party
Settlement
filed in
Maryland
(March 16)
DC Hearings
(March 30-
April 8, April
20-22)
Maryland
Settlement
Hearings
(April 15-21)
DC
Initial
Briefs Due
(May 13)
Delaware
Decision
Expected
(June 2)
DC
Reply Briefs
Due
(May 27)
2015 1Q Earnings Release Slides
17
Maryland
Deadline
(May 15)
Expected
Transaction
Close (Q2/Q3) |
 18
2015 1Q Earnings Release Slides
Proposed Low Carbon Portfolio Standard Legislation (HB
3293 / SB1585)
2015 1Q Earnings Release Slides
What is the purpose of the
legislation?
Beginning
January
1,
2016,
the
Illinois
Power
Agency
(IPA)
must
include
in
electric
utilities’
procurement plans
the procurement of cost-effective low carbon energy credits from low
carbon energy resources for all retail customers. This
procurement process follows the existing renewable energy resources procurement process.
What is a low carbon energy
credit?
A tradable credit that represents the environmental attributes of 1 MW of
energy produced from a low carbon energy resource. Low carbon
energy credits are created every day that low carbon energy resources are
generating power.
What is a low carbon energy, or
“LCE”, resource?
Energy from a generating unit that does not emit any air pollution, such as
sulfur dioxide, nitrogen oxide, or carbon dioxide, including technology
fueled by new and existing solar photovoltaic, solar thermal, wind, hydro,
nuclear, tidal energy, wave energy or clean coal.
What quantity of LCE resources is
being procured?
A maximum of 70% of retail sales per year. Like the renewable energy
resources procurement, the LCE procurement is limited by a separate
2.015% rate increase cap and cannot exceed the IPA’s benchmarks for
renewable energy resources.
Who is purchasing the LCE
credits?
Similar to the renewable portfolio standard, electric utilities would purchase
the LCE credits. While the renewables procurement includes only
eligible retail customers, the LCE procurement covers all retail
customers.
How will the utility recover its
costs to purchase LCE credits?
Utilities will recover all costs associated with purchasing LCE credits
through a rider that adds a charge to each retail customer’s bill
(consistent with the 2.015% rate cap). Like the renewable portfolio standard, this charge
will remain fixed for the duration of the LCPS.
What is the procurement
process?
The LCE procurement process relies on the same process the IPA uses to procure
renewable energy resources. The key difference is the need to
conduct a mid-year procurement. Because the legislation
probably will not become law until after the start of the 2015/2016
procurement year on June 1, 2015, the
IPA
will
conduct
and
complete
an
initial
procurement
before
January
1,
2016
that
will
procure
the
LCE
credits
needed
for
the
period
January
1,
2016
through
May
31,
2021,
by
entering
into
contracts
of
1
to
5
years
in length.
The
IPA
may
also
conduct
later
procurement
processes
if
it
needs
to
do
so.
How long will the new LCE
procurement requirements be in
effect?
The
new
LCE
procurement
requirements
will
sunset
on
December
31,
2021,
so
long
as
the
State
has
adopted
and
implemented
a
plan
under
Section
111(d)
of
the
federal
Clean
Air
Act.
If
the
State
has
not
completed these actions by that date, then the new requirements will sunset on
December 31 of the year in which the State adopts and implements that
plan. |
 19
2015 1Q Earnings Release Slides
Proposed Energy Plan for Illinois’
Future Legislation (HB
3328 / SB 1879)
2015 1Q Earnings Release Slides
Legislative
Change
Description
Customer Benefits
Expand Energy Efficiency
Allows utilities to invest in voltage optimization to meet
energy efficiency goals; spreads costs
to customers over 5
years minimizing initial customer impact;
shifts all energy
efficiency program management to the utilities
•
More energy efficiency
•
More customer cost
savings for most customers
regardless of program participation
Solar Power for the
Community
Changes existing net metering law to enable community solar
and other meter aggregation programs; provides access to
Renewable Energy Resources Fund (RERF) to support
development of community and rooftop solar
•
More customer access to sustainable
generation for customers at all income levels
and dwelling types (rentals, condos, homes with
rooftop limitations, etc.)
Equitable Cost Allocation
Through Rate Design
Modifications
Implements kilowatt-based rates for all retail customers;
breaks-out capacity and transmission charges as separate
bill line items; eliminates the requirement that a residential
customer who elects real-time pricing remain on that rate for
a minimum of a year
•
Allocates costs of grid more fairly and aligns
residential rate design with long-standing C&I
rate design
•
Unbundling charges facilitates comparisons of
energy offerings
•
Adjustment to real-time pricing provides more
pricing choices to customers
Additional Financial
Assistance for those in
need --
2021
Extends access to ComEd shareholder-funded customer
assistance dollars
for low-income customers, including senior
citizens, veterans, small businesses, and community
organizations
•
Provides $50M in customer assistance benefits
Microgrids
for Security and
Resiliency
Pilot program to demonstrate how microgrid
technology can
provide security and resiliency to critical infrastructure
•
Increased security,
resiliency, and reliability for
critical infrastructure
Electric Vehicle Charging
Stations
Initiates a program to increase the number and accessibility
of electric vehicle charging
•
Supports
electrification of transportation sector
Demand Response
Facilitation Service
Enables utility to aggregate demand response procurement
for retail energy providers in service territory;
easing the
administrative burden on retail energy providers
•
Ensures
viability of demand response
participation in Illinois
Renewable Portfolio
Standards Enhancements
Improves access to RERF money which is limited under the
current legislation and streamlines administration
•
Allows
for more competitive service for large
C&I customers
•
Increases RECs purchase |
 20
2015 1Q Earnings Release Slides
ComEd April 2015 Distribution Formula Rate
Note: Disallowance of any items in the 2015 distribution formula rate
filing could impact 2015 earnings in the form of a regulatory asset adjustment.
Given the retroactive ratemaking provision in the Energy Infrastructure
Modernization Act (EIMA) legislation, ComEd net income during the year will
be based on actual costs with a regulatory asset/liability recorded to reflect
any under/over recovery reflected in rates. Revenue Requirement in
rate filings impacts cash flow.
Docket #
15-0287
Filing Year
Reconciliation Year
Common Equity Ratio
~ 46%
for both the filing and reconciliation year
ROE
9.14%
for the filing year (2014 30-yr Treasury Yield of 3.34% + 580 basis point risk
premium) and 9.09%
for the
reconciliation
year
(2014
30-yr
Treasury
Yield
of
3.34%
+
580
basis
point
risk
premium
–
5
basis
points
performance metrics
penalty). For 2015 and 2016, the actual allowed ROE reflected in net income
will ultimately be based on the average of the 30-year Treasury Yield
during the respective years plus 580 basis point spread, absent any metric penalties
Requested Rate of Return
~ 7%
for both the filing and reconciliation years
Rate Base
$8,286 million –
Filing
year
(represents
projected
year-end
rate
base
using
2014
actual
plus
2015
projected
capital additions). 2015
and 2016 earnings will reflect 2015 and 2016 year-end rate base
respectively. $7,095 million -
Reconciliation year (represents year-end rate base for 2014)
Revenue Requirement
Decrease
$50M decrease
($142M decrease due to the 2014 reconciliation offset by a $92M
increase related to the filing year).
The 2014 reconciliation impact on net income was recorded in 2014 as a regulatory
asset. Timeline
•
04/15/15 Filing Date
•
240 Day Proceeding
•
ICC order expected to be issued by mid-December 2015
2014 Calendar Year Actual Costs and 2015 Projected Net Plant Additions
are
used
to
set
the
rates
for
calendar
year 2016.
Rates currently in effect (docket 14-0312) for calendar year 2015 were based
on 2013 actual costs and 2014 projected net plant
additions
Reconciles
Revenue
Requirement
reflected
in
rates
during
2014
to
2014
Actual
Costs
Incurred.
Revenue requirement
for
2014
is
based
on
docket
13-0318
(2012
actual
costs
and
2013
projected
net
plant
additions) approved
in
December 2013 and
reflects the impacts of PA 98-0015 (SB9)
The 2015 distribution formula rate filing establishes the net revenue
requirement used to set the rates that will take effect in January 2016
after the Illinois Commerce Commission's (ICC’s) review. There are
two components to the annual distribution formula rate filing: •
Filing Year: Based on prior year costs (2014) and current year (2015)
projected plant additions. •
Annual Reconciliation: For the prior calendar year (2014), this amount
reconciles the revenue requirement reflected in rates during the prior year
(2014) in effect to the actual costs for that year. The annual reconciliation
impacts cash flow in the following year (2016) but the earnings impact
has been recorded in the prior year (2014) as a regulatory asset.
2015 1Q Earnings Release Slides |
 PECO Electric Distribution Rate Case
Docket #
R-2015-2468981
Fully Projected Future Test Year
2016
Common Equity Ratio
53%
Requested Return on Equity
10.95%
Overall Rate of Return
8.2%
Proposed Rate Base
$4.1B
Revenue Requirement Increase Ask
$190M
System Average Increase as % of overall bill
4.4%
Timeline
•
3/27/15 –
PECO filed electric distribution rate case with PaPUC
•
9 month Proceeding
•
Increased rates effective on January 1, 2016
Basis for Rate Case
•
Since last rate case (2010):
•
Proposed investment maintains strong reliability performance with
targeted First Electric Distribution Rate Case since 2010
21
investment to address pockets with reliability issues
–
Electric Distribution Rate base increased by one third
(approximately $1B)
–
Sales declined by 0.6%
–
Operating expenses were essentially flat (less than 1% annually)
2015 1Q Earnings Release Slides |
 22
2015 1Q Earnings Release Slides
PECO Electric LTIIP -
System 2020
•
PECO filed its Electric Long Term Infrastructure Improvement Plan
(“LTIIP”) along with its associated recovery mechanism the
Distribution System Improvement Charge (“DSIC”) on March
27, 2015 (with Electric Distribution Rate Case) o
LTIIP
includes
$275
million
in
incremental
capital
spending
from
2016-2020
focusing on the following areas:
Cable Replacement
Storm Hardening Programs
Substation replacement and upgrades
o
DSIC mechanism will allow recovery of eligible LTIIP spend between rate
cases if the electric distribution ROE falls below the DSIC ROE established by
PaPUC. The current Electric DSIC ROE is 10.1%.
o
Expected approval in 3Q15
•
PECO also proposed the concept of constructing one or more pilot
microgrid
projects as part of a future LTIIP update ($50-$100M). The objective
is to evaluate and test emerging microgrid technologies that could
enhance reliability and resiliency by replacing obsolete infrastructure
as an alternative to traditional solutions.
2015 1Q Earnings Release Slides |
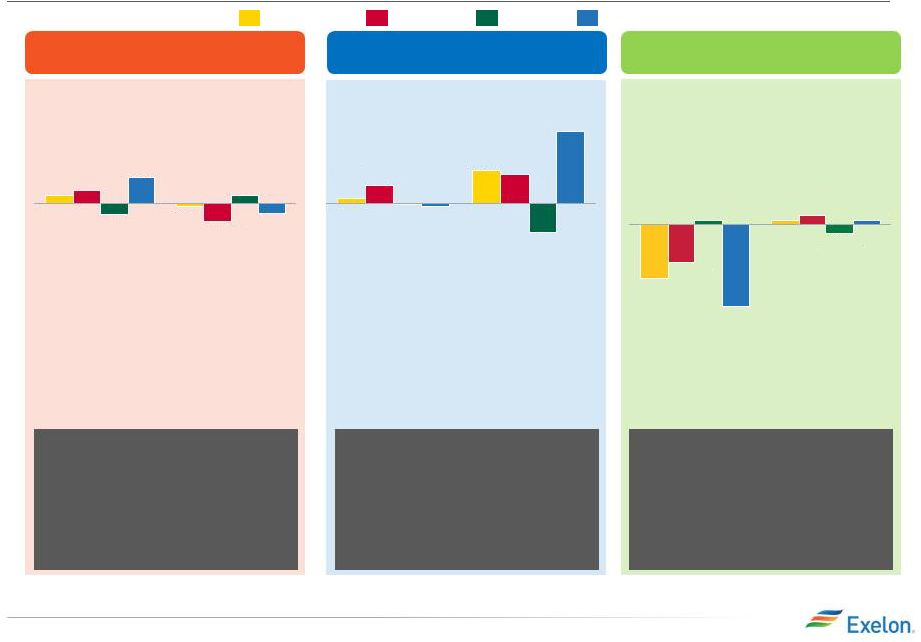 23
2015 1Q Earnings Release Slides
Notes: Data is not adjusted for leap year. Source of economic outlook
data is IHS (February 2015) and Bureau of Economic Analysis. Assumes 2015 GDP of 3.0% and U.S. unemployment
of 5.5%. ComEd has the ROE collar as part of the distribution formula rate and
BGE is decoupled which mitigates the load risk. QTD and YTD actual data can be found in earnings release
tables. BGE amounts have been adjusted for unbilled / true-up load
from prior quarters BGE
2015 load growth is greater
than 2014, attributable to
slowly improving economic
conditions and moderate
customer growth, partially
offset by energy efficiency
Exelon Utilities Load
2015E
2014
Large C&I
Small C&I
Residential
All Customers
ComEd
2015 load growth is similar to
2014 reflecting slowly
improving economy being
offset by energy efficiency
2015E
2014
PECO
2015 load growth is driven by
modest economic growth
coupled with increased shale
gas transportation and NGL
production, partially offset by
energy efficiency.
2015E
2014
Chicago GMP
2.4%
Chicago Unemployment
6.1%
Philadelphia GMP
2.0%
Philadelphia Unemployment
6.6%
Baltimore GMP
1.6%
Baltimore Unemployment
5.8%
-0.1%
0.2%
-0.5%
0.3%
0.2%
-0.3%
-0.3%
0.7%
0.9%
0.1%
0.8%
0.5%
-0.8%
0.0%
2.0%
-0.1%
0.1%
-1.3%
0.2%
-0.9%
-0.2%
0.1%
0.1%
-1.9%
2015 1Q Earnings Release Slides |
 24
2015 1Q Earnings Release Slides
Appendix
Reconciliation of Non-GAAP
Measures
2015 1Q Earnings Release Slides |
 25
2015 1Q Earnings Release Slides
1Q GAAP EPS Reconciliation
Three Months Ended March 31, 2015
ExGen
ComEd
PECO
BGE
Other
Exelon
2015 Adjusted (non-GAAP) Operating Earnings (Loss) Per Share
$0.35
$0.11
$0.16
$0.12
$(0.03)
$0.71
Mark-to-market impact of economic hedging activities
0.11
-
-
-
-
0.11
Unrealized gains related to NDT fund investments
0.03
-
-
-
-
0.03
Merger and integration costs
(0.01)
-
-
-
(0.01)
(0.02)
Mark-to-market impact of PHI merger related interest rate swaps
-
-
-
-
(0.06)
(0.06)
Amortization of commodity contract intangibles
0.03
-
-
-
-
0.03
Midwest Generation bankruptcy recoveries
0.01
-
-
-
-
0.01
CENG Non-Controlling Interest
(0.01)
-
-
-
-
(0.01)
1Q 2015 GAAP Earnings (Loss) Per Share
$0.51
$0.11
$0.16
$0.12
$(0.10)
$0.80
NOTE: All amounts shown are per Exelon share and represent contributions
to Exelon's EPS. Amounts may not add due to rounding. Three Months
Ended March 31, 2014 ExGen
ComEd
PECO
BGE
Other
Exelon
2014 Adjusted (non-GAAP) Operating Earnings (Loss) Per Share
$0.30
$0.11
$0.10
$0.10
$-
$0.62
Mark-to-market impact of economic hedging activities
(0.52)
-
-
-
-
(0.52)
Unrealized gains related to NDT fund investments
0.01
-
-
-
-
0.01
Merger and integration costs
(0.01)
-
-
-
-
(0.01)
Amortization of commodity contract intangibles
(0.04)
-
-
-
-
(0.04)
Tax settlements
0.04
-
-
-
-
0.04
1Q 2014 GAAP Earnings (Loss) Per Share
$(0.22)
$0.11
$0.10
$0.10
$-
$0.10
2015 1Q Earnings Release Slides |
 26
2015 1Q Earnings Release Slides
GAAP to Operating Adjustments
NOTE: All amounts shown are per Exelon share and represent contributions
to Exelon's EPS. Amounts may not add due to rounding. •
Exelon’s 2015 adjusted (non-GAAP) operating earnings excludes the
earnings effects of the following: Mark-to-market adjustments from
economic hedging activities Unrealized gains and losses from NDT fund
investments to the extent not offset by contractual accounting as
described in the notes to the consolidated financial statements Certain
costs incurred associated with the Integrys and pending Pepco Holdings, Inc. acquisitions
Mark-to-market adjustments from forward-starting interest rate
swaps related to anticipated financing for the pending PHI
acquisition Non-cash amortization of intangible assets, net, related
to commodity contracts recorded at fair value at the date of acquisition
of Integrys in 2014 Generation’s non-controlling interest
related to CENG exclusion items Other unusual items
2015 1Q Earnings Release Slides |
 27
2015 1Q Earnings Release Slides
ExGen Total Gross Margin Reconciliation to GAAP
Total Gross Margin Reconciliation (in $M)
(4)
2015
2016
2017
Revenue
Net
of
Purchased
Power
and
Fuel
Expense
(1)(5)
$8,150
$8,050
$8,350
Other Revenues
(2)
$(250)
$(250)
$(250)
Direct cost of sales incurred to generate revenues for certain
Constellation businesses
(3)
$(300)
$(350)
$(450)
Total Gross Margin (Non-GAAP, as shown on slide 5)
$7,600
$7,450
$7,650
2015 1Q Earnings Release Slides
Revenue net of purchased power and fuel expense (RNF), a non-GAAP measure,
is calculated as the GAAP measure of operating revenue less the GAAP measure of
purchased power and fuel expense. ExGen does not forecast the GAAP components
of RNF separately. RNF also includes the RNF of our proportionate ownership share of
CENG.
Reflects revenues from operating services agreement with Fort
Calhoun, variable interest entities, funds collected through revenues for decommissioning the former PECO
nuclear plants through regulated rates and gross receipts tax revenues.
Reflects the cost of sales and depreciation expense of certain Constellation
businesses of Generation.
All amounts rounded to the nearest $50M.
Excludes the impact of the operating exclusion for mark-to-market due
to the volatility and unpredictability of the future changes to power prices.
(1)
(2)
(3)
(4)
(5) |