Attached files
| file | filename |
|---|---|
| 8-K - 8-K - Carbonite Inc | a8-kq12015earningsrelease.htm |
| EX-99.1 - EXHIBIT 99.1 - Carbonite Inc | exhibit991q12015.htm |

CARBONITE 2015 FIRST QUARTER FINANCIAL RESULTS APRIL 28, 2015

EMILY WALT Director of Investor Relations

Safe Harbor These slides and the accompanying oral presentation contain "forward-looking statements" within the meaning of the Securities Act of 1933 and the Securities Exchange Act of 1934, as amended by the Private Securities Litigation Reform Act of 1995. These forward-looking statements represent the Company's views as of the date they were first made based on the current intent, belief or expectations, estimates, forecasts, assumptions and projections of the Company and members of our management team. Words such as "expect," "anticipate," "should," "believe," "hope," "target," "project," "goals," "estimate," "potential," "predict," "may," "will," "might," "could," "intend," variations of these terms or the negative of these terms and similar expressions are intended to identify these forward-looking statements. Those statements include, but are not limited to, statements regarding guidance on our future financial results and other projections or measures of future performance. Forward-looking statements are subject to a number of risks and uncertainties, many of which involve factors or circumstances that are beyond the Company's control. The Company's actual results could differ materially from those stated or implied in forward-looking statements due to a number of factors, including, but not limited to, the Company's ability to profitably attract new customers and retain existing customers, the Company's dependence on the market for cloud backup services, the Company's ability to manage growth, and changes in economic or regulatory conditions or other trends affecting the Internet and the information technology industry. These and other important risk factors are discussed under the heading "Risk Factors" in our Annual Report on Form 10-K for the fiscal year ended December 31, 2014 filed with the Securities and Exchange Commission, which is available on www.sec.gov. Except as required by law, we do not undertake any obligation to update our forward-looking statements to reflect future events, new information or circumstances. This presentation contains non-GAAP financial measures including, but not limited to, non-GAAP Gross Margin, non-GAAP EPS and Free Cash Flow. A reconciliation to GAAP can be found in the financial schedules included in our most recent earnings press release which can be found on Carbonite’s website, investors.carbonite.com or www.sec.gov. 3

4 MOHAMAD ALI President & CEO

ANTHONY FOLGER CFO & Treasurer

Q115 Bookings 6 Q115 Growth Y/Y Total Bookings $36.9M 13% SMB $13.1M 42% Consumer $23.8M 2% $23.3 $21.5 $21.1 $22.1 $23.8 $9.2 $9.1 $9.5 $12.4 $13.1 $32.5 $30.6 $30.6 $34.5 $36.9 Q114 Q214 Q314 Q414 Q115 SMB Consumer 28% of total bookings 36% of total bookings

Q115 Revenue $29.1 $30.3 $31.3 $31.9 $33.0 Q114 Q214 Q314 Q414 Q115 7 Q115 Growth Y/Y Total Revenue $33.0M 13%

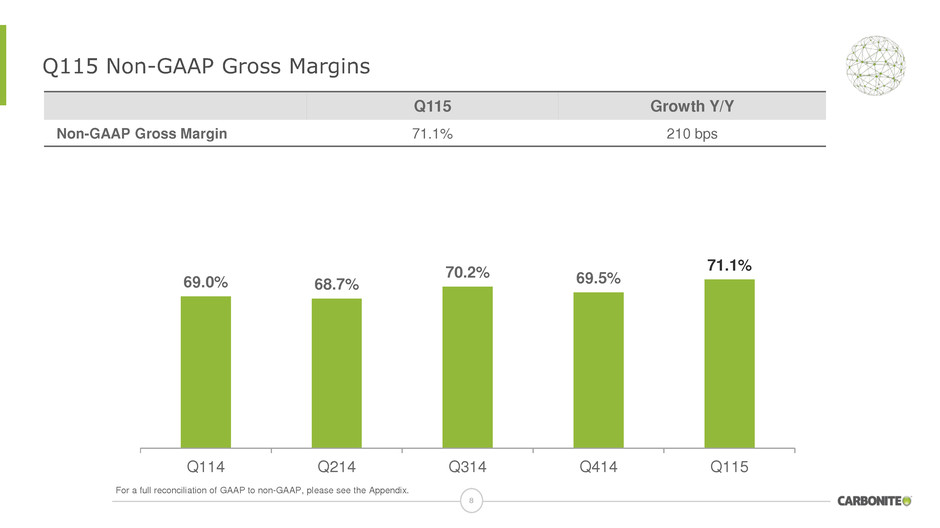
Q115 Non-GAAP Gross Margins 8 69.0% 68.7% 70.2% 69.5% 71.1% Q114 Q214 Q314 Q414 Q115 For a full reconciliation of GAAP to non-GAAP, please see the Appendix. Q115 Growth Y/Y Non-GAAP Gross Margin 71.1% 210 bps

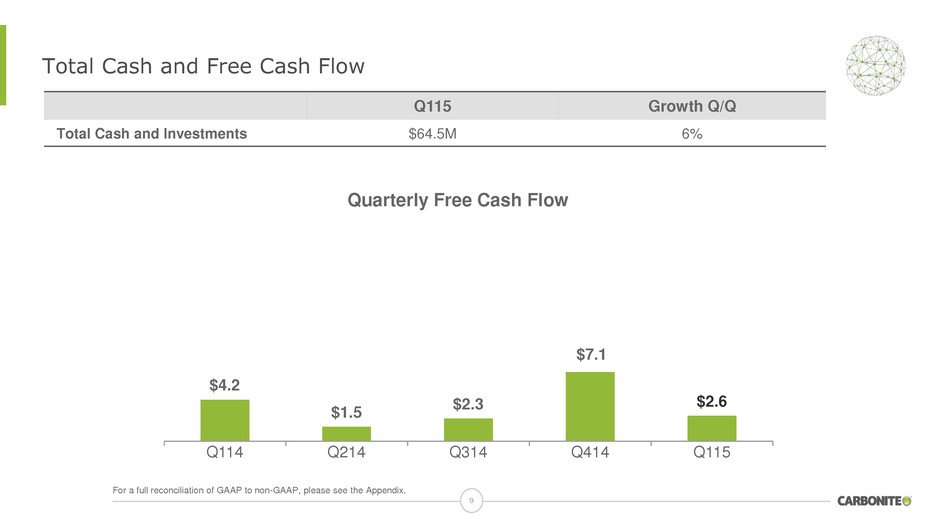
Total Cash and Free Cash Flow $4.2 $1.5 $2.3 $7.1 $2.6 Q114 Q214 Q314 Q414 Q115 Quarterly Free Cash Flow For a full reconciliation of GAAP to non-GAAP, please see the Appendix. 9 Q115 Growth Q/Q Total Cash and Investments $64.5M 6%

Q215 & FY15 Non-GAAP Business Outlook Q215 Revenue $33.5 - $33.7M Non-GAAP net loss per share ($0.04) – ($0.02) 2015 Revenue $137.3M - $138.3M Non-GAAP EPS $0.09 – $0.11 Non-GAAP gross margin ~200 bps over 2014 Free cash flow $16.0M - $18.0M 10

11 MOHAMAD ALI President & CEO

Areas of Focus in 2015 12 Enhance Product Roadmap Improve Operational Effectiveness Increase Go-to-Market Capacity

The Current State of SMB Business Continuity Plans 13 65% 35% 30% 35% of SMBs do not have a business continuity solution in place at all today. 65% of SMBs still use backup to tape or disk, which can result in significant overhead costs, including the initial purchase price and the maintenance costs. Only 30% of SMBs are currently using a cloud backup solution. Source: IDC 2015

Full Suite of Powerful Yet Simple Solutions Hybrid Appliance provides local and cloud backup Bare metal restore allows complete recovery from system image Creates 1:1 copies of all emails in a central archive to ensure long- term security and availability of data Supports archiving of Microsoft Exchange, Office 365, Gmail and other leading systems 1 PC or Mac with unlimited cloud storage Automatic & continuous protection for photos, documents, music and more Unlimited databases & live applications Hybrid protection for SQL, Exchange, Oracle, MySQL and more All PCs, external drives, NAS devices & file servers Easily access, restore and centrally manage all backed up files PERSONAL From $60 /yr PRO From $270 /yr SERVER From $800 /yr APPLIANCE From $1,200 / yr MAILSTORE From $190 14

Improved GTM Capacity Driven by Operational Execution • Infrastructure upgrades • Improved systems integration with channel partners to reduce complexity • Partner portal re-launch to improve usability and responsiveness, and support localization • Investing in relationships with major distribution and DMR partners • Driving improved positioning and education about Carbonite • Communicating potential margin expansion opportunities • Business process review • Projects managed and prioritized in relation to overall business needs, not in functional siloes • Decreased risk to project failures 15

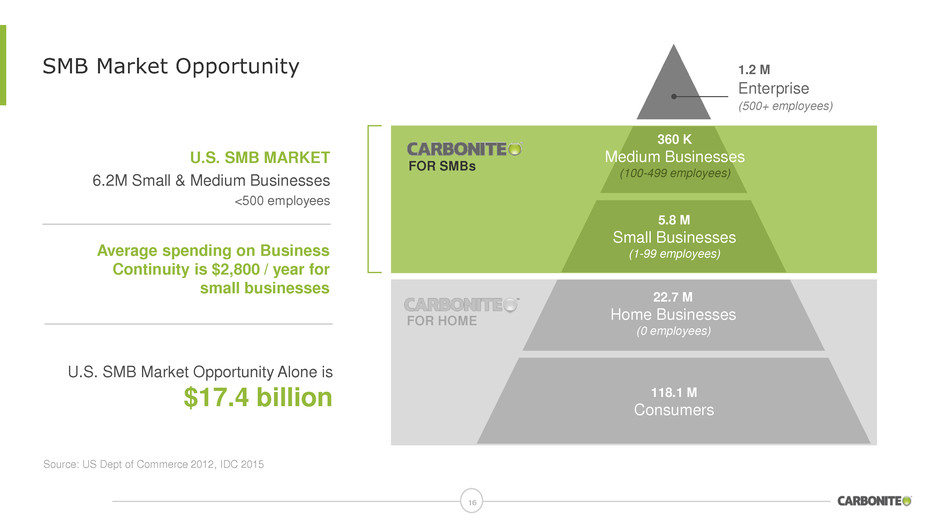
SMB Market Opportunity 16 Source: US Dept of Commerce 2012, IDC 2015 U.S. SMB MARKET 6.2M Small & Medium Businesses <500 employees 22.7 M Home Businesses (0 employees) 118.1 M Consumers 5.8 M Small Businesses (1-99 employees) 360 K Medium Businesses (100-499 employees) 1.2 M Enterprise (500+ employees) FOR HOME FOR SMBs Average spending on Business Continuity is $2,800 / year for small businesses U.S. SMB Market Opportunity Alone is $17.4 billion

Tolerance for Downtime Minutes / Hours Hours to 1 Day Days Minutes Operational Expense Capital Expenditure Price Sensitivity Will Pay for High Availability IT Budget Price is Main Driver Price Important SaaS/Cloud Adoption Email & Business- Specific Apps Customer & Channel Sophistication Unsophisticated Admin or Savvy Reseller Dedicated Admin or outsourced MSP Dedicated IT Staff or outsourced MSP Flexible IT Infrastructure Strategic IT Infrastructure Piecemeal IT Infrastructure No Admin or Break/Fix Consultant SMB Customer Profile 4 3 2 1 Basic Backup Advanced Backup Selective Continuity High Availability 17

Q&A 18

FINANCIAL STATEMENTS
