Attached files
| file | filename |
|---|---|
| 8-K - FORM 8-K - CIT GROUP INC | e63845_8k.htm |
| EX-99.1 - EARNINGS RELEASE - CIT GROUP INC | e63845ex99-1.htm |
Exhibit 99.2

® CIT First Quarter 2015 Financial Results April 28, 2015

1 Important Notices This presentation contains forward - looking statements within the meaning of applicable federal securities laws that are based upon our current expectations and assumptions concerning future events, which are subject to a number of risks and uncertainties that could cause actual results to differ materially from those anticipated . The words “expect,” “anticipate,” “estimate,” “forecast,” “initiative,” “objective,” “plan,” “goal,” “project,” “outlook,” “priorities,” “target,” “intend,” “evaluate,” “pursue,” “commence,” “seek,” “may,” “would,” “could,” “should,” “believe,” “potential,” and “continue,” or the negative of any of those words or similar expressions are intended to identify forward - looking statements . All statements contained in this presentation, other than statements of historical fact, including without limitation, statements about our plans, strategies, prospects and expectations regarding future events and our financial performance, are forward - looking statements that involve certain risks and uncertainties . While these statements represent our current judgment on what the future may hold, and we believe these judgments are reasonable, these statements are not guarantees of any events or financial results, and our actual results may differ materially . Important factors that could cause our actual results to be materially different from our expectations include, among others, the risk that CIT is unsuccessful in implementing its strategy and business plan, the risk that CIT is unable to react to and address key business and regulatory issues, the risk that CIT is unable to achieve the projected revenue growth from its new business initiatives or the projected expense reductions from efficiency improvements, and the risk that CIT becomes subject to liquidity constraints and higher funding costs . We describe these and other risks that could affect our results in Item 1 A, “Risk Factors,” of our latest Annual Report on Form 10 - K for the year ended December 31 , 2014 , which was filed with the Securities and Exchange Commission . Accordingly, you should not place undue reliance on the forward - looking statements contained in this presentation . These forward - looking statements speak only as of the date on which the statements were made . CIT undertakes no obligation to update publicly or otherwise revise any forward - looking statements, except where expressly required by law . This presentation is to be used solely as part of CIT management’s continuing investor communications program . This presentation shall not constitute an offer or solicitation in connection with any securities .

2 Executing on O ur Priorities ▪ Target mid - year closing of the OneWest acquisition o Integration planning well underway ▪ Deposits 50% of total fundings ; interest cost down 8 bps ▪ Credit reserve 1.8% of average finance receivables ▪ Cash and investment portfolio positioned to benefit from a rise in interest rates ▪ Completed existing share repurchase program o Repurchased 7.3 million shares ($332 million) ▪ Board authorized additional $200 million share repurchase program in April 2015 Expand Commercial Banking Franchise Maintain Strong Risk Management Practices Grow Business Franchises Realize Embedded Value Return Excess Capital 1Q15 Earnings Call
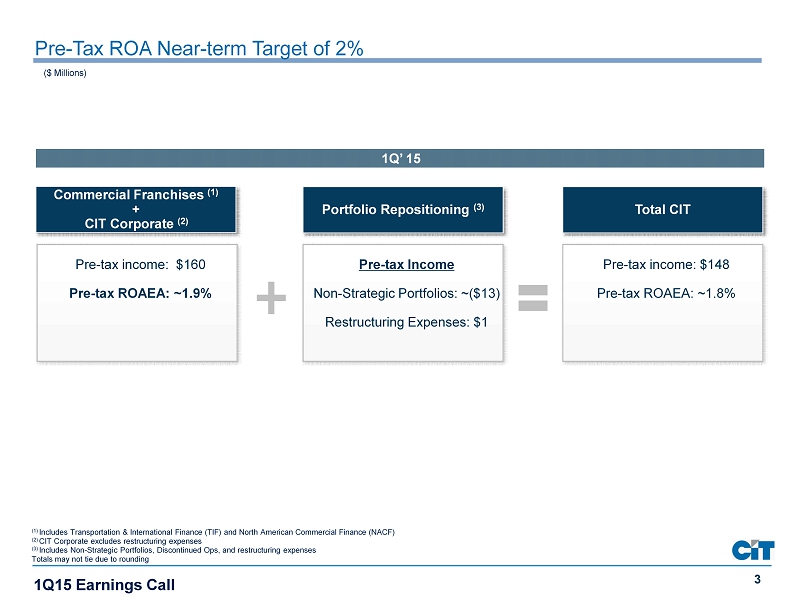
3 Pre - Tax ROA Near - term Target of 2% 1Q15 Earnings Call (1) Includes Transportation & International Finance (TIF) and North American Commercial Finance (NACF) (2) CIT Corporate excludes restructuring expenses (3) Includes Non - Strategic Portfolios, Discontinued Ops, and restructuring expenses Totals may not tie due to rounding ($ Millions) Commercial Franchises (1) + CIT Corporate (2) Portfolio Repositioning (3) Total CIT Pre - tax income: $160 Pre - tax ROAEA: ~1.9% Pre - tax Income Non - Strategic Portfolios: ~($13) Restructuring Expenses: $1 Pre - tax income: $148 Pre - tax ROAEA: ~ 1 .8% 1Q’ 15
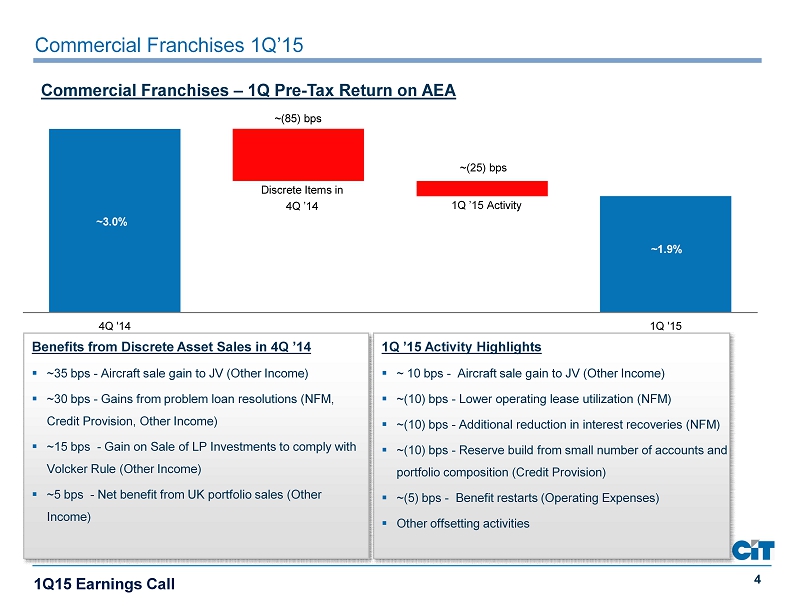
4 Commercial Franchises 1Q’15 1Q15 Earnings Call 4Q '14 1Q '15 Commercial Franchises – 1Q Pre - Tax Return on AEA 1Q ’15 Activity Highlights ▪ ~ 10 bps - Aircraft sale gain to JV (Other Income) ▪ ~(10) bps - Lower operating lease utilization (NFM ) ▪ ~( 10) bps - A dditional reduction in interest recoveries (NFM ) ▪ ~( 10) bps - Reserve build from small number of accounts and portfolio composition (Credit P rovision ) ▪ ~(5) bps - Benefit restarts (Operating Expenses) ▪ Other offsetting activities ~1.9% ~3.0% Discrete Items in 4Q ’14 ~(85) bps 1Q ’15 Activity ~(25) bps Benefits from Discrete Asset Sales in 4Q ’14 ▪ ~35 bps - Aircraft sale gain to JV (Other I ncome) ▪ ~30 bps - Gains from problem loan resolutions (NFM, Credit P rovision, Other I ncome) ▪ ~15 bps - Gain on Sale of LP Investments to comply with Volcker Rule (Other I ncome) ▪ ~5 bps - Net benefit from UK portfolio sales (Other I ncome)
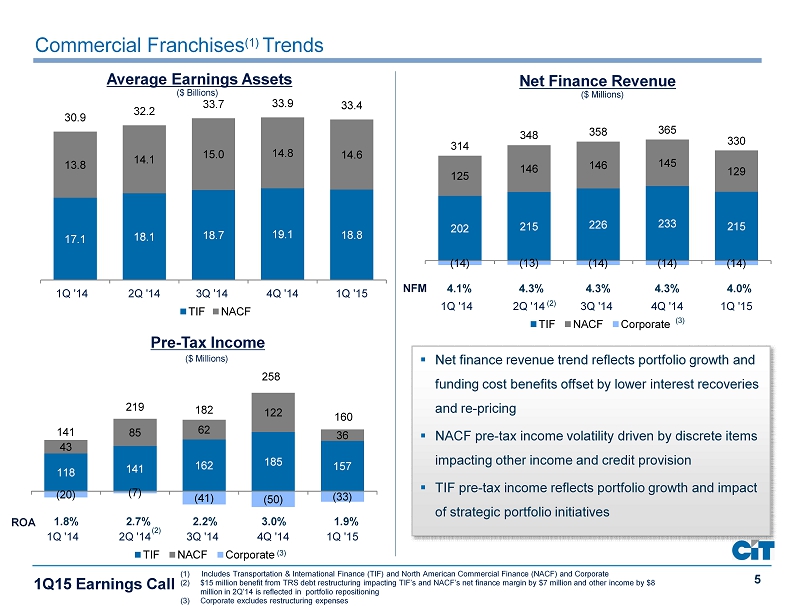
5 202 215 226 233 215 125 146 146 145 129 (14) (13) (14) (14) (14) 314 348 358 365 330 1Q '14 2Q '14 3Q '14 4Q '14 1Q '15 TIF NACF Corporate Commercial Franchises (1) Trends 17.1 18.1 18.7 19.1 18.8 13.8 14.1 15.0 14.8 14.6 30.9 32.2 33.7 33.9 33.4 1Q '14 2Q '14 3Q '14 4Q '14 1Q '15 TIF NACF 1 Q15 Earnings Call Average Earnings Assets Net Finance Revenue 118 141 162 185 157 43 85 62 122 36 (20) (7) (41) (50) (33) 141 219 182 258 160 1Q '14 2Q '14 3Q '14 4Q '14 1Q '15 TIF NACF Corporate Pre - Tax Income ($ Millions) ($ Millions) ($ Billions) ▪ Net finance revenue trend reflects portfolio growth and funding cost benefits offset by lower interest recoveries and re - pricing ▪ NACF pre - tax income volatility driven by discrete items impacting other income and credit provision ▪ TIF pre - tax income reflects portfolio growth and impact of strategic portfolio initiatives 4.1% NFM ROA 4.3% 4.3% 4.3% 4.0% 1.8% 2.7% 2.2% 3.0% 1.9% (1) Includes Transportation & International Finance (TIF) and North American Commercial Finance ( NACF) and Corporate (2) $15 million benefit from TRS debt restructuring impacting TIF’s and NACF’s net finance margin by $7 million and other income by $8 million in 2Q’14 is reflected in portfolio repositioning (3) Corporate excludes restructuring expenses (2) (2) (3) (3)
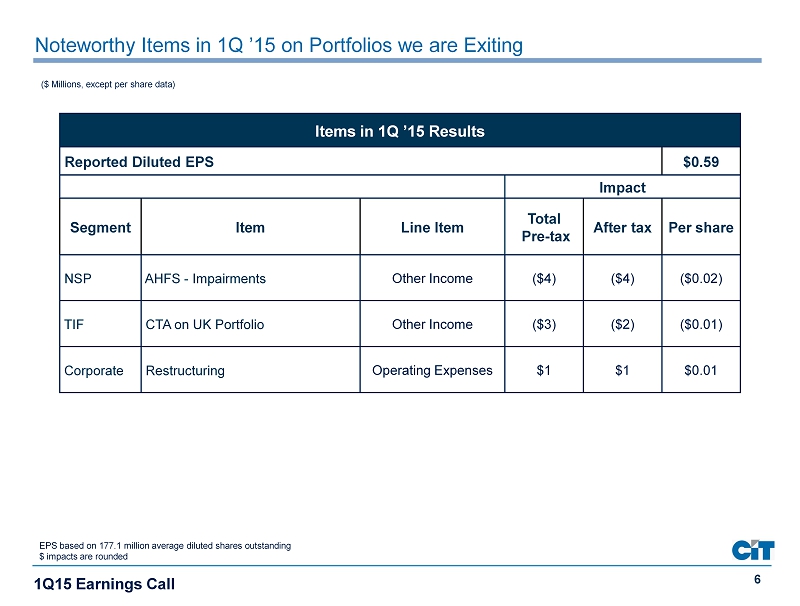
6 ($ Millions, except per share data) Noteworthy Items in 1Q ’15 on Portfolios we a re Exiting Items in 1Q ’15 Results Reported Diluted EPS $0.59 Impact Segment Item Line Item Total Pre - tax After tax Per share NSP AHFS - Impairments Other Income ($4) ($4) ($0.02) TIF CTA on UK Portfolio Other Income ($3) ($2) ($0.01) Corporate Restructuring Operating Expenses $1 $1 $0.01 EPS based on 177.1 million average diluted shares outstanding $ impacts are rounded 1Q15 Earnings Call

7 (1) Includes International VA reversal impact of $4 4 million, $0.24 diluted EPS in 4Q14 and U.S. VA reversal impact of $375 million, $2.01 diluted EPS in 3Q14 (2) Average earning assets (AEA) is computed using month end balances and is the average of finance receivables, operating lease equ ipment and financing and leasing assets held for sale less the credit balances of factoring clients. (3) Excluding accelerated FSA net discount / premium and other charges on debt redemptions and accelerated OID (original issue discount) on debt extinguishment related to the TRS facility. Adjusted net finance margin is a non - GAAP measure ; please see the non - GAAP disclosures in our first quarter press release for a reconciliation of non - GAAP to GAAP financial information . (4) Operating expenses in 4Q14 includes loss on extinguishment of debt of $3.1 million. (5) Average finance receivables (AFR) is computed using month end balances and is the average of finance receivables (as defined be low). It excludes operating lease equipment. (6) Finance receivables (FR) include loans, direct financing lease and leverage lease receivables and factoring receivables. (7) Capital ratios are preliminary as of 3/31/15 and based on fully phased - in Basel III estimates At or For the Period Ended 1Q ’15 4Q ’14 3Q ’14 2Q ’14 1Q ’14 FY ’ 14 FY ’ 13 EPS (Diluted) – Total (1) $0.59 $1.37 $2.76 $1.29 $0.59 $5.96 $3.35 EPS (Diluted) – Continuing Ops. (1) $0.59 $1.37 $2.76 $1.02 $0.58 $5.69 $3.19 EPS (Diluted) impact from VA Reversal - $0.24 $2.01 - - $2.21 - Book Value Per Share $50.26 $50.13 $49.10 $46.42 $45.10 $50.13 $44.78 Tangible Book Value Per Share $46.89 $46.83 $45.87 $44.16 $42.94 $46.83 $42.98 Continuing Ops. Profitability Metrics as a % of AEA (2) Net Finance Margin 4.00% 4.34% 4.26% 4.35% 4.01% 4.25% 4.61% Adjusted Net Finance Margin (3) 4.00% 4.34% 4.26% 4.26% 4.01% 4.23% 4.71% Provision for Credit Losses (0.41%) (0.17%) (0.45%) (0.12%) (0.46%) (0.30%) (0.22%) Other Income 1.02% 1.36% 0.28% 1.13% 0.89% 0.91% 1.27% Operating Expenses (4) 2.86% (2.93%) (2.74%) (2.71%) (2.91%) (2.83%) (3.22%) Pre - tax Income 1.75% 2.59% 1.36% 2.64% 1.53% 2.04% 2.44% Effective Tax Rate 30% (13%) (344%) 8% 11% (58%) 11% Net Charge - offs (% of AFR (5) ) 0.43% 0.47% 0.39% 0.45% 0.76% 0.52% 0.44% Non - accrual Loans (% of FR (6) ) 0.92% 0.82% 1.02% 1.02% 1.18% 0.82% 1.29% Total Capital Ratio (7) 14.8% 15.2% 15.0% 16.7% 16.8% 15.2% 17.4% Tier 1 Capital Ratio/Tier 1 Common (7) 14.1% 14.5% 14.3% 16.0% 16.1% 14.5% 16.7% Performance Highlights & Trends 1Q15 Earnings Call

8 GAAP Tax vs. Economic Tax – (Continuing Operations ) 1Q ’15 FY ’14 Pre - tax Income $148 $681 1Q15 Earnings Call (1) GAAP tax provision includes discrete tax items of $2 million and $445 million for 1Q’15 and FY’14 , respectively (2) Net income includes $0 million and $1 million of losses attributable to non - controlling interests for 1Q’15 and FY’14 , respectively (3) EPS based on 177.1 million and 189.5 million average diluted shares outstanding for 1Q’15 and FY’14 , respectively $ impacts are rounded ($ Millions ,except per share data) GAAP Tax Provision (1) ($44) $398 Net Income (2) $104 $1,078 Reported EPS (3) $0.59 $5.69 Effective Tax Rate 30% (58%) Cash Taxes ($14) ($22) Pro Forma Net Income (2) $134 $658 Pro Forma EPS (3) $0.76 $3.47 Effective Tax Rate (Cash) 9% 3% ▪ Reset of GAAP effective tax rate in 1Q ’15 due to prior year partial valuation allowance reversal ▪ GAAP earnings reflect $44 million tax provision while cash taxes were significantly lower at $14 million

9 Profitability Metrics (1) (1) % of a verage e arning assets, which were approximately $33.8 billion and $33.4 billion for 1Q’15 and FY’14, respectively (2) Adjusted for debt refinancing costs (3) Includes debt extinguishment costs FY ’14 1Q ’15 Near - term Outlook Net Finance Margin (2) 4.2% 4.0% 3.75% - 4.25% Credit Provision (0.3%) (0.4%) (0.35%) – (0.75%) Other Income 0.9% 1.0% 0.75% - 1.00% Operating Expenses (3) (ex. restructuring) (2.7%) (2.9%) (2.00%) – (2.50%) Pre - tax Income (ROAEA) 2.0% 1.8% ~2.0% Near - term outlook excludes impact of Currency Translation Adjustment charges 1Q15 Earnings Call
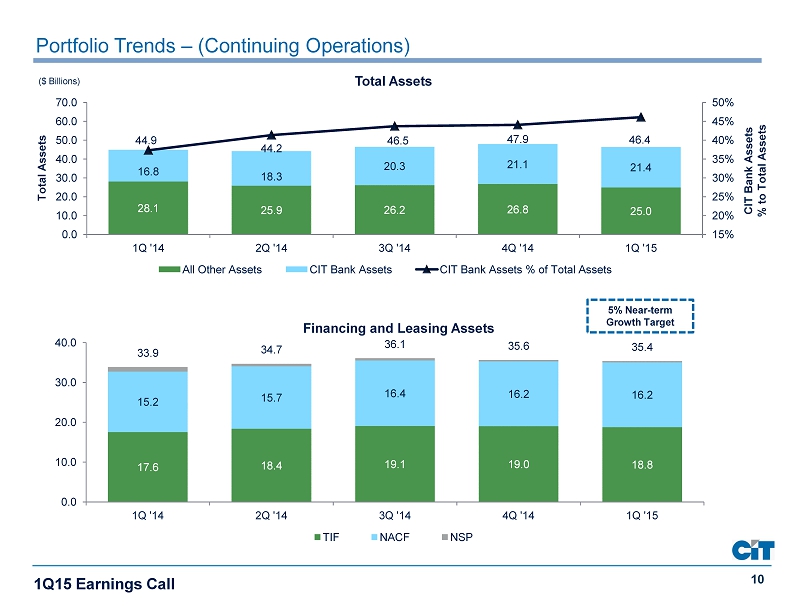
10 ($ Billions ) Financing and Leasing Assets Portfolio Trends – (Continuing Operations) 28.1 25.9 26.2 26.8 25.0 16.8 18.3 20.3 21.1 21.4 44.9 44.2 46.5 47.9 46.4 15% 20% 25% 30% 35% 40% 45% 50% 0.0 10.0 20.0 30.0 40.0 50.0 60.0 70.0 1Q '14 2Q '14 3Q '14 4Q '14 1Q '15 Total Assets Total Assets All Other Assets CIT Bank Assets CIT Bank Assets % of Total Assets CIT Bank Assets % to Total Assets 17.6 18.4 19.1 19.0 18.8 15.2 15.7 16.4 16.2 16.2 33.9 34.7 36.1 35.6 35.4 0.0 10.0 20.0 30.0 40.0 1Q '14 2Q '14 3Q '14 4Q '14 1Q '15 TIF NACF NSP 1Q15 Earnings Call 5% Near - term Growth Target
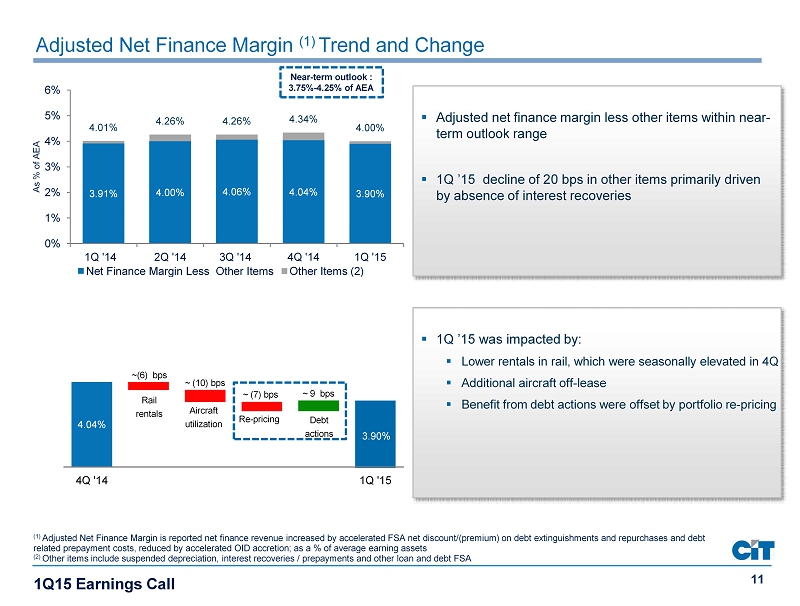
11 Adjusted Net Finance Margin (1) Trend and Change 3.91% 4.00% 4.06% 4.04% 3.90% 4.01% 4.26% 4.26% 4.34% 4.00% 0% 1% 2% 3% 4% 5% 6% 1Q '14 2Q '14 3Q '14 4Q '14 1Q '15 As % of AEA Net Finance Margin Less Other Items Other Items (2) ( 1 ) Adjusted Net Finance Margin is reported net finance revenue increased by accelerated FSA net discount/(premium) on debt extinguishment s a nd repurchases and debt related prepayment costs, reduced by accelerated OID accretion; as a % of average earning assets (2) Other items include suspended depreciation, interest recoveries / prepayments and other loan and debt FSA ▪ Adjusted net finance margin less other items within near - term outlook range ▪ 1Q ’15 decline of 20 bps in other items primarily driven by absence of interest recoveries Near - term outlook : 3 .75% - 4.25% of AEA 1Q15 Earnings Call 4.04 % 4Q '14 1Q '15 Re - pricing ~ (7) bps Rail rentals ~( 6 ) bps Debt a ctions ~ 9 bps 3.90% ▪ 1Q ’15 was impacted by: ▪ Lower rentals in rail, which were seasonally elevated in 4Q ▪ Additional aircraft off - lease ▪ Benefit from debt actions were offset by portfolio re - pricing Aircraft utilization ~ (10) bps

12 Asset Quality Trends – ( Continuing Operations) ($ Millions) 218 190 201 161 179 0.8% 0.5% 0.4% 0.5% 0.4% 0.0% 0.3% 0.6% 0.9% 1.2% 1.5% 0 50 100 150 200 250 1Q '14 2Q '14 3Q '14 4Q '14 1Q '15 Net Charge - offs % to AFR Non – accrual Loans Non - accrual Loans & Net Charge - offs Non - accrual Loans Net Charge - offs % to AFR 353 341 358 346 357 1.9% 1.8% 1.8% 1.8% 1.8% 1.5% 1.7% 1.9% 2.1% 2.3% 2.5% 2.7% 2.9% 0 50 100 150 200 250 300 350 400 450 500 1Q '14 2Q '14 3Q '14 4Q '14 1Q '15 Allowance for Loan Losses % to FR Allowance for Loan Losses Allowance for Loan Losses Allowance for Loan Losses Allowance for Loan Losses % to FR (1) (1) 1Q’15,4Q’14, 3Q’14, 2Q’14 and 1Q’14 include approximately $11 million, $7 million, $11 million, $12 million, and $14 million re spectively, of charge - offs related to the transfer of loans to held for sale; exclusive of these charge - offs, net charge - offs as a % to AFR would have been 20 bps, 34 bps ,17 bps, 21 bps and 46 bps respectively. 1Q15 Earnings Call

13 Other Income Trends – Components (Continuing Operations) - 0.5% 0.0% 0.5% 1.0% 1.5% - 55 - 30 - 5 20 45 70 95 120 145 $ 94 $ 2 4 $116 Factoring commissions Fee revenues Gains on sales of leasing equipment All other income Factoring commissions & Fee revenues % of AEA Factoring commissions, Fee revenues & Gains on sales of leasing equipment % of AEA Other Income Line Item Key Drivers Factoring Commissions ▪ Factoring Volume and Mix ▪ Commission Rates Fee Revenues ▪ Market Pricing ▪ M&A Market Gain on Sales of Leasing Equipment ▪ Residual Realization ▪ Portfolio Management of Operating Equipment All Other Income ▪ Gains (Losses) on Loan & Portfolio Sales ▪ Gains (Losses) on Investments ▪ Impairment on Assets Held for Sale ▪ Recoveries of Loans Charged off Pre - Emergence and Loans Charged off Prior to Transfer to Held for Sale ▪ Counterparty Receivable Accretion ▪ Gains (Losses) on derivatives and foreign currency exchange ▪ Other revenues ($ Millions) $ 71 1 Q ’14 3 Q ’14 4 Q ’14 1 Q ’15 2 Q ’14 $86 Total Reported: Near - term outlook : 0.75% - 1.00% of AEA 1Q15 Earnings Call
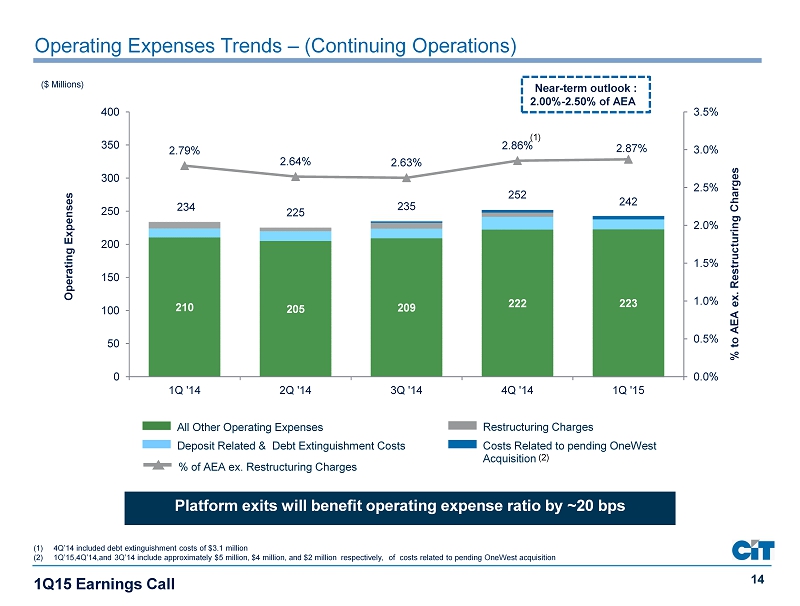
14 210 205 209 222 223 234 225 235 252 242 2.79% 2.64% 2.63% 2.86% 2.87% 0.0% 0.5% 1.0% 1.5% 2.0% 2.5% 3.0% 3.5% 0 50 100 150 200 250 300 350 400 1Q '14 2Q '14 3Q '14 4Q '14 1Q '15 Operating Expenses Operating Expenses Trends – (Continuing Operations) ($ Millions) % to AEA ex. Restructuring Charges Restructuring Charges All Other Operating Expenses Costs Related to pending OneWest Acquisition Deposit Related & Debt Extinguishment Costs % of AEA ex. Restructuring Charges Near - term outlook : 2.00% - 2.50% of AEA (1) 4Q’14 included debt extinguishment costs of $3.1 million (2) 1Q’15,4Q’14,and 3Q’14 include approximately $ 5 million, $4 million, and $ 2 million respectively, of costs related to pending OneWest acquisition (1) 1Q15 Earnings Call (2) P latform exits will benefit operating expense ratio by ~20 bps

15 APPENDIX 1Q15 Earnings Call

16 Platform Exits In Progress 1Q15 Earnings Call Estimated CTA Brazil Expected Timing Transaction Size ~$ 1 00 ~$50 ($ Millions) Other international platforms ; $350 million of UK CF and $180 million of NSP assets already sold but will have trailing CTA ch arges of ~$5 million Mexico ~$200 ~ $20 2H ’15 2H ’15 UK Equipment Finance ~$400 ~ $5 2H ’15 Increase in CTA from 4Q ’14 driven by foreign currency volatility in 1Q ’15

17 Other $ 18.9 Oil & Gas Extraction Svcs . ~$0.5 Exposure to Oil 1Q15 Earnings Call Loans ($ Billions) Total Loans: $19.4 Billion ▪ ~$0.5 billion of loans ▪ ~ 3% of total loans ▪ ~60% Energy Services and ~ 40% in Exploration & Production (E&P) ▪ Less than 20% are Cash Flow Loans ▪ Majority of portfolio is secured by working capital assets, long lived fixed assets and traditional reserve based lending assets Other ~89,000 In - service to Oil Sector ~22,000 North American Railcars Total Cars: ~110,000 ▪ Approximately 22,000 railcars that service the oil sector ▪ Leased to a mix of E&P, midstream, and refining customers as well as diversified shippers ▪ ~12,000 tank cars are leased directly to customers for the transportation of crude ▪ ~9,000 sand cars that support crude oil and natural gas drilling ▪ Fewer than 2,000 rail cars that service the oil sector expire this year ▪ Impact: Utilization and Net Finance Margin ▪ Impact: Credit Provision

18 Providing Financial Solutions to Small and Middle Market Companies and the Transportation Sector (1) Financing and Leasing assets include loans, operating lease equipment and assets held for sale; data as of 3/31/15 (2) Remaining UK assets are in held for sale Financing and Leasing Assets (1 ) Total $ 35 Billion Leasing and financing solutions for commercial airlines worldwide and business jet operators Aerospace $16 $19 Less than $1 North American Commercial Finance Non - Strategic Portfolios Transportation & International Finance Transportation & International Finance Leasing and financing solutions to freight shippers and carriers Rail Financing solutions to owners and operators of oceangoing cargo vessels Maritime Finance Lending and equipment leasing to small and middle market businesses in the UK (2) and China International Finance Senior secured commercial real estate loans to developers and other commercial real estate professionals Real Estate Finance North American Commercial Finance Lending, leasing, and other financial and advisory services to the middle market Corporate Finance Leasing and equipment loan solutions to small businesses and middle market companies Equipment Finance Leading provider of factoring and financing to consumer product companies Commercial Services 1Q15 Earnings Call