Attached files
| file | filename |
|---|---|
| 8-K - FORM 8-K - POPULAR, INC. | d914669d8k.htm |
 Investor
Presentation First Quarter 2015
Exhibit 99.1 |
 Forward Looking
Statements 1
The information contained in this presentation includes forward-looking statements within
the meaning of the Private Securities Litigation Reform Act of 1995. These
forward-looking statements are based on management’s current expectations and
involve risks and uncertainties that may cause the Company's actual results to differ
materially from any future results expressed or implied by such forward-looking statements.
Factors that may cause such a difference include, but are not limited to (i) the rate of
growth in the economy and employment levels, as well as general business and economic
conditions; (ii) changes in interest rates, as well as the magnitude of such changes;
(iii) the fiscal and monetary policies of the federal government and its agencies; (iv)
changes in federal bank regulatory and supervisory policies, including required levels of capital
and the impact of proposed capital standards on our capital ratios; (v) the impact of the
Dodd-Frank Wall Street Reform and Consumer Protection Act on our businesses,
business practices and cost of operations; (vi) regulatory approvals that may be
necessary to undertake certain actions or consummate strategic transactions such as
acquisitions and dispositions; (vii) the relative strength or weakness of the consumer and
commercial credit sectors and of the real estate markets in Puerto Rico and the other markets
in which borrowers are located; (viii) the performance of the stock and bond markets;
(ix) competition in the financial services industry; (x) additional Federal Deposit
Insurance Corporation assessments; (xi) possible legislative, tax or regulatory
changes; and (xii) risks related to the Doral Transaction, including (a) our ability to maintain
customer relationships, including managing any potential customer confusion caused by the
alliance structure, (b) risks associated with the limited amount of diligence able to
be conducted by a buyer in an FDIC transaction and (c) difficulties in converting or
integrating the Doral branches or difficulties in providing transition support to
alliance co-bidders. Other than to the extent required by applicable law, the Company undertakes no
obligation to publicly update or revise any forward-looking statement. Please refer to our
Annual Report on Form 10-K for the year ended December 31, 2014 and other SEC
reports for a discussion of those factors that could impact our future results. The
financial information included in this presentation for the quarter ended March 31,
2015 is based on preliminary unaudited data and is subject to change. |
 1
See appendix for reconciliation to GAAP.
²
Excludes net write-downs related to BPNA‘s legacy and classified asset sales.
Q1 2015 Highlights
•
NPLs increased by $35 million QoQ; ratio at 3.2%
•
NPL inflows, excluding consumer loans, down by $65 million QoQ
•
NCOs ratio of 0.72%²
compared to 1.04%²
last quarter
Credit
(excluding
covered loans)
•
Reported adjusted net income of $90 million¹
•
Strong margins: Popular, Inc. 4.57%, BPPR 5.00%
Earnings
•
Robust capital; Common Equity Tier 1 Capital ratio of 15.8%
Capital
Doral Bank
Transaction
•
Popular acquired approximately $2.3 billion in assets and assumed $2.2 billion
in deposits from the FDIC, as receiver for Doral Bank
•
Popular’s bid to purchase approximately $5 billion of GSE mortgage servicing
rights (“MSRs”) was accepted by the FDIC. Closed acquisition of $2.7 billion in
GNMA MSRs. Still in negotiations for the acquisition of other GSE MSRs
2 |
 Doral Bank
Transaction •
Efficient
deployment of capital with meaningful earnings accretion; in-market expansion
provides significant cost savings opportunities
•
Strengthens PR franchise and grows strategically important New York business through
the addition of an attractive commercial platform
Overview
•
$2.3 billion in assets acquired
$827 million of Puerto Rico loans acquired by BPPR and $891 million of U.S.
mainland loans acquired by PCB
$607 million in investment securities, cash, and other assets acquired
Assets
Acquired
•
$2.2 billion of deposits assumed
$1.0 billion deposits assumed by BPPR (8 branches and internet deposits)
$1.2 billion of NY branch deposits (3 branches) assumed by PCB
Deposits
Assumed
•
Transaction related costs incurred in Q1 2015 were $9 million; approximately $15 million
is
estimated
to
be
incurred
during
the
2
nd
and
3
rd
quarters
•
Recognized
goodwill
of
$43
million¹
and
core
deposit
intangible
of
$24
million¹
Transaction
Update
3
1
Figures may be adjusted upon completion of fair market value analysis.
•
No brokered CDs assumed |
 Financial Summary
(non-GAAP)¹ ¹
Unaudited. See Appendix for reconciliation to GAAP.
4
($ in thousands)
Q1 15
Q4 14
Variance
Net interest income
343,195
$
345,452
$
(2,257)
$
FDIC loss share income (expense)
4,139
(18,693)
22,832
Other non-interest income
109,975
120,373
(10,398)
Gross revenues
457,309
447,132
10,177
Provision for loan losses – non-covered loans
29,711
50,759
(21,048)
Provision for loan losses – covered loans
10,324
(3,646)
13,970
Total provision for loan losses
40,035
47,113
(7,078)
Net revenues
417,274
400,019
17,255
Personnel costs
114,026
107,762
6,264
Professional fees
68,531
80,383
(11,852)
OREO expenses
23,069
20,016
3,053
Other operating expenses
85,891
102,583
(16,692)
Total operating expenses
291,517
310,744
(19,227)
Income from continuing operations before income tax
125,757
89,275
36,482
Income tax expense
35,464
12,472
22,992
Net income
90,293
$
76,803
$
13,490
$ |
 $798
$713
$636
$542
$319
$204
$149
$28
$9
$79
$55
$-
$100
$200
$300
$400
$500
$600
$700
$800
$900
FDIC LSA
Q1 14
FDIC LSA
Q2 14
FDIC LSA
Q3 14
FDIC LSA
Q4 14
FDIC LSA
Q1 15
Payment received
Apr 15 (Q4 NCOs)
Remaining
Indemnity Asset
amortization
Estimated NCOs
billed on Apr 15
for Q1 15
Commercial FDIC
LSA Rollforward
Q1 15
FDIC LSA
reimbursement
under dispute
Remaining losses
to be realized and
collected
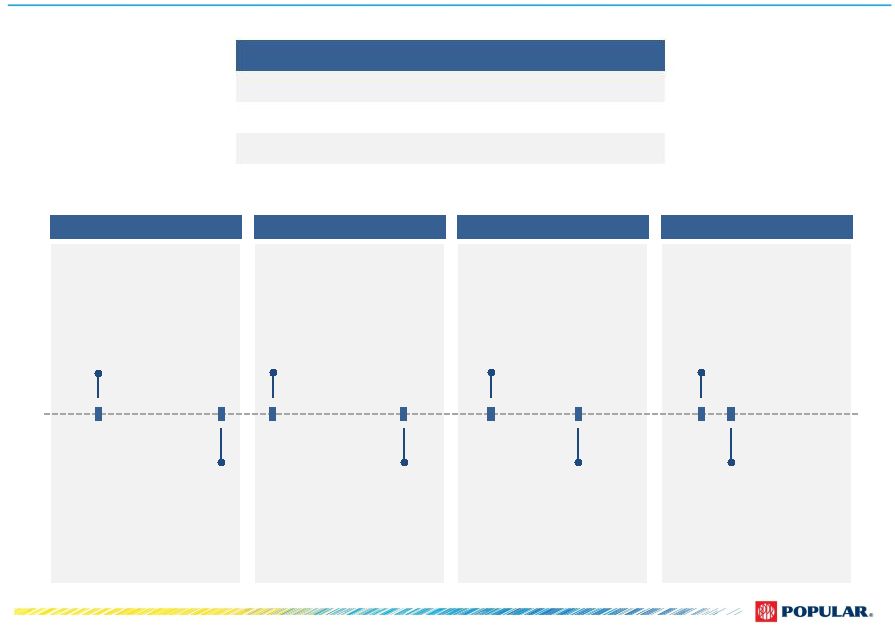
$410
$91
Single family FDIC LSA
Commercial
FDIC LSA
Commercial
FDIC LSA components
FDIC Loss Share Asset
Composition of FDIC Loss Share Asset
($ in millions)
•
Commercial Loss Share Agreement expires in Q2
2015 and provides for loss share of net charge-offs
through the end of the quarter. Single family Loss
Share Agreement expires in Q2 2020.
•
Losses can be realized through lower appraised
values of collateral, discounted payoffs, and assets
sales.
5 |
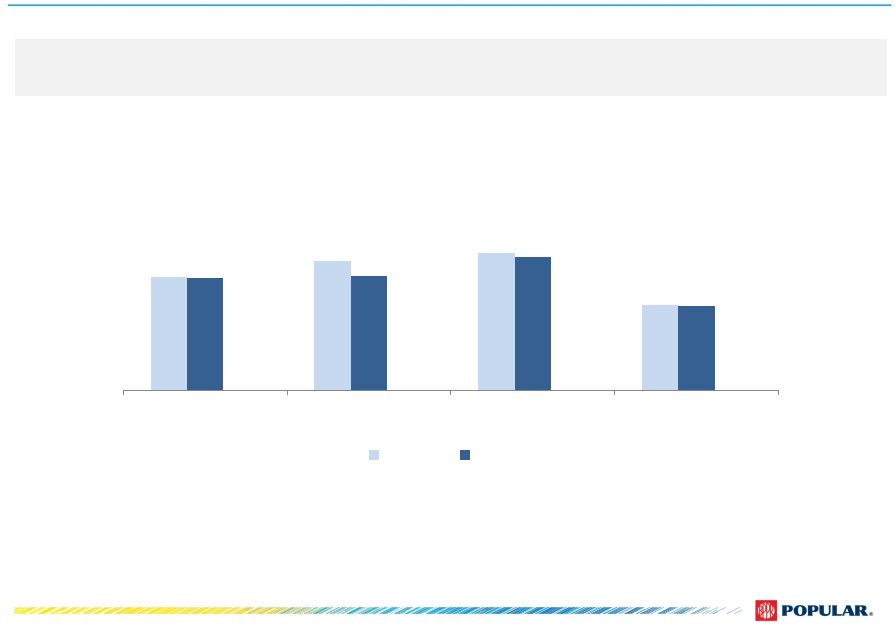 Capital
•
Popular’s capital metrics continued to be strong even with the implementation of Basel III
and the impact of the Doral Bank transaction
6
15.9
18.1
19.4
11.9
15.8
16.2
18.8
11.8
Common Equity Tier 1
Capital
Tier 1 Risk-Based Capital
Total Risk-Based Capital
Tier 1 Leverage
Q4 2014
Q1 2015
Note: Capital ratios for the current quarter are preliminary |
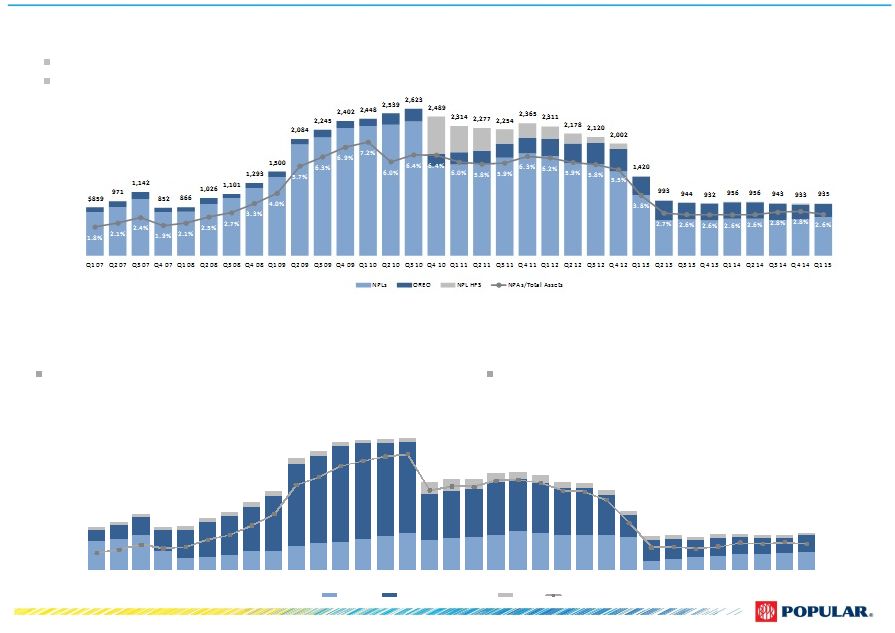 Non-Performing
Assets Non-Performing Loans (excluding covered loans)
($ in millions)
•
NPLs,
excluding
covered
loans,
increased
by
$35
million
QoQ,
of
which
$28
million
were
related
to
Doral
failure
and
asset
acquisition
•
NPLs to loans at 3.2%. Excluding the Doral asset acquisition impact, ratio stable at
3.3% Non-Performing Assets
(including covered assets)
($ in millions)
•
NPAs, including covered loans, relatively flat QoQ
Differences due to rounding.
BPPR NPLs at $638 million, or 3.8% of loans, increased by $27 million
-
Mortgage
NPLs
up
$25
million;
includes
$17
million
of
loans
with
a
previous repurchase obligation from Doral
US
operations
NPLs
at
$27
million,
or
0.6%
of
loans,
up
by
$8
million
-
Commercial NPLs up $7 million, primarily due to Doral Bank
acquired loans
7
$770
$858
$1,008
$771
$781
$923
$1,028
$1,203
$1,404
$1,978
$2,116
$2,276
$2,313
$2,330
$2,344
$1,572
$1,614
$1,625
$1,732
$1,738
$1,682
$1,563
$1,550
$1,425
$1,051
$614
$618
$598
$635
$640
$622
$630
$665
2.4%
2.7%
3.1%
2.8%
2.9%
3.5%
3.9%
4.7%
5.6%
8.0%
8.7%
9.6%
10.0%
10.4%
10.6%
7.6%
7.9%
7.9%
8.4%
8.4%
8.2%
7.6%
7.5%
6.8%
4.9%
2.9%
2.9%
2.8%
2.9%
3.3%
3.2%
3.3%
3.2%
0.0%
2.0%
4.0%
6.0%
8.0%
10.0%
12.0%
14.0%
Q1 07
Q2 07
Q3 07
Q4 07
Q1 08
Q2 08
Q3 08
Q4 08
Q1 09
Q2 09
Q3 09
Q4 09
Q1 10
Q2 10
Q3 10
Q4 10
Q1 11
Q2 11
Q3 11
Q4 11
Q1 12
Q2 12
Q3 12
Q4 12
Q1 13
Q2 13
Q3 13
Q4 13
Q1 14
Q2 14
Q3 14
Q4 14
Q1 15
Mortgage
Commercial & Construction
Other
NPL/Loans (HIP)
OREOs down by $24 million, primarily from the sale of covered commercial properties
NPL HFS down $10 million due to the completion of portfolio sales in the US operations
|
 NPL Inflows
Total NPL Inflows
($ in millions)
Highlights
•
Total NPL inflows decreased by $65 million QoQ
Excludes consumer loans
Metrics exclude covered loans. Differences due to rounding.
8
48
45
42
26
22
22
22
10
19
11
7
2
9
93
65
100
43
48
59
42
32
94
31
23
113
28
Q1 12
Q2 12
Q3 12
Q4 12
Q1 13
Q2 13
Q3 13
Q4 13
Q1 14
Q2 14
Q3 14
Q4 14
Q1 15
US Inflows
PR Inflows
55
51
52
34
26
29
27
16
23
16
9
10
15
279
231
257
210
158
158
136
126
183
136
119
205
135
Q1 12
Q2 12
Q3 12
Q4 12
Q1 13
Q2 13
Q3 13
Q4 13
Q1 14
Q2 14
Q3 14
Q4 14
Q1 15
US Inflows
PR Inflows
Mortgage NPL Inflows
($ in millions)
Commercial, Construction, and Legacy NPL Inflows
($ in millions)
PR commercial inflows, including construction, were
down $10 million excluding the impact of a $75 million
public sector borrower in the prior quarter
PR mortgage NPL inflows increased by $15 million
US total NPL inflows up by $6 million attributed to
commercial loans acquired from Doral
-
Includes $17 million related to loans with a previous
repurchase obligation from Doral and $2 million of
acquired mortgage loans
-
Excluding this impact, inflows decreased by $4
million
6
6
10
8
5
7
5
6
4
5
3
8
6
187
166
157
167
110
99
94
94
89
105
95
92
90
17
Q1 12
Q2 12
Q3 12
Q4 12
Q1 13
Q2 13
Q3 13
Q4 13
Q1 14
Q2 14
Q3 14
Q4 14
Q1 15
US Inflows
PR Inflows
Doral Inflows |
 108
98
96
101
81
79
58
35
43
46
40
50
36
163
200
32
3
2.13%
0.72%
Q1 12
Q2 12
Q3 12
Q4 12
Q1 13
Q2 13
Q3 13
Q4 13
Q1 14
Q2 14
Q3 14
Q4 14
Q1 15
NCO
Bulk Sale Write-downs
NCO%
Bulk Sale NCO%
ALLL (in millions) ALLL-to-NCO and ALLL-to-NPL
Ratios NCO
(in
millions)
and
NCO-to-Loan
Ratio
Provision
(in
millions)
and
Provision-to-NCO
Ratio
Additional Credit Metrics
Highlights
•
NCOs down $14 million QoQ, reflecting lower commercial net
charge-offs
•
Provision decreased by $22 million QoQ, reflecting lower
commercial NCO activity in the quarter
•
ALLL at $516 million, decreasing by $4 million QoQ; ALLL to
loans at 2.46% vs. 2.68% in Q4 2014
Excluding the Doral portfolio, ALLL to loans at 2.66%
•
ALLL to NPL coverage ratio at 78% in Q1 2015 vs. 82% in Q4
2014
Excluding the impact of Doral related NPLs, ALLL to
NPLs ratio relatively flat at 81%
Metrics exclude covered loans. Differences due to rounding.
9
665
649
636
622
584
529
526
538
543
526
522
520
516
154%
360%
40%
78%
Q1 12
Q2 12
Q3 12
Q4 12
Q1 13
Q2 13
Q3 13
Q4 13
Q1 14
Q2 14
Q3 14
Q4 14
Q1 15
ALLL
ALLL/NCO
ALLL/NPL
83
82
84
86
58
55
55
48
47
50
56
50
30
149
169
12
2
76%
83%
Q1 12
Q2 12
Q3 12
Q4 12
Q1 13
Q2 13
Q3 13
Q4 13
Q1 14
Q2 14
Q3 14
Q4 14
Q1 15
PLLL
Bulk Sale PLLL
PLLL/NCO
Bulk Sale PLLL/NCO
NCO ratio of 0.72% vs. 1.04% in Q4 2014
Provision to NCO of 83% |
 PR Public Sector
Exposure Our current direct exposure to the PR government, instrumentalities, and
municipalities is $995 million, of which approximately $813 million is outstanding,
relatively flat from Q4 2014. ¹
Includes GDB, COFINA, and CRIM.
Loans to the Government of Puerto Rico and
Public Corporations are obligations that have a
pledge of a specific source of income or
revenues identified for their repayment.
PR Central Government & Public Corporations
Municipalities
Loans to various municipalities are backed by
unlimited taxing power or real and personal
property taxes collected within such
municipalities.
Indirect Exposure
Indirect exposure includes loans or instruments
that are payable by non-governmental entities
and have a government guarantee to cover any
shortfall in collateral in the event of borrower
default. Majority are single-family mortgage
related.
10
Outstanding PR government exposure
($ in millions)
Loans
Securities
Total
Central Government ¹
120
$
55
$
175
$
Public Corporations
PRASA
85
1
86
PREPA
75
-
75
PRHTA
-
-
-
OTHER
-
-
-
Total Central Govt & Public Corp.
280
56
336
as % of Tier 1 Capital
8.6%
Municipalities
418
59
477
Direct Government Exposure
698
$
115
$
813
$
Indirect Exposure
327
$
49
$
376
$
|
 Driving
Shareholder Value Capital
•
Robust capital with Common Equity Tier 1 Capital of 15.8%
•
TARP repayment and BPNA transactions move us toward a more
active capital management process
Earnings
•
Unique franchise in PR provides strong, stable revenue-generating
capacity
•
Continued stability in Popular’s credit metrics
Additional Value
•
EVTC ownership and Banco BHD León stake
11
Recent
Accomplishments
•
TARP repayment
•
Credit MOUs lifted
•
US restructuring
•
Doral Bank transaction |
 Investor
Presentation First Quarter 2015
APPENDIX |
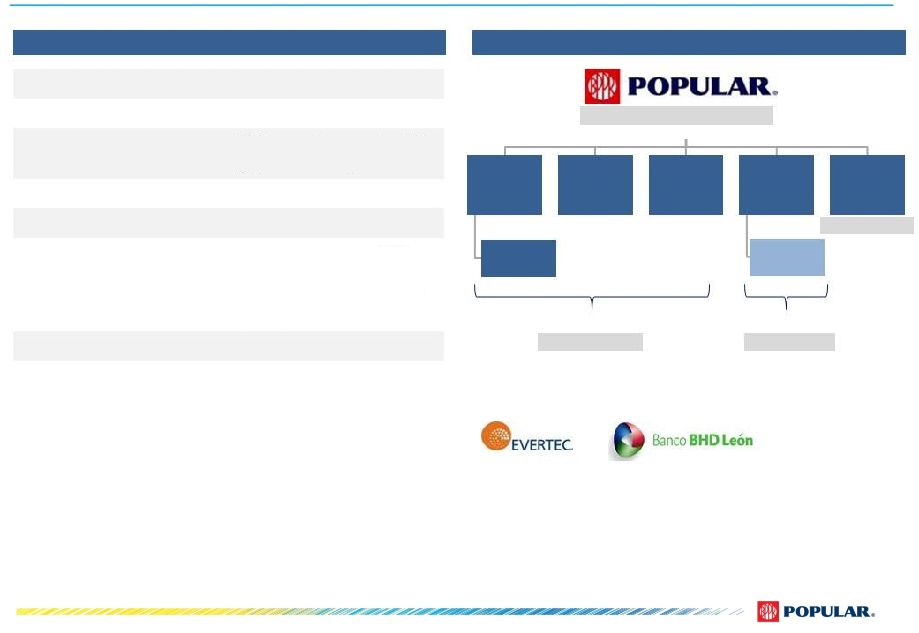 Who We Are
– Popular, Inc.
Franchise
Information as of March 31, 2015
¹
Includes the recently acquired Doral branches (8 branches in BPPR and 3 in PCB)
²
Doing business as Popular Community Bank
Summary Corporate Structure
Assets = $35.6 billion
Assets = $28.8 billion
Assets = $6.7 billion
Puerto Rico Operations
United States Operations
Assets = $0.1 billion
Selected equity investments
EVERTEC and Banco BHD León under Corporate segment and joint ventures under BPPR
segment •
Transaction processing,
business processes
outsourcing
•
15.05% stake
•
Adjusted EBITDA of $182.8
million for the year ended
December 31, 2014
•
Dominican Republic
bank
•
15.82% stake
•
2014 approximate
net income of $123
million
PRLP 2011 Holdings, LLC
•
Construction and
commercial loans
vehicle
•
24.9% stake
PR Asset Portfolio 2013-1
International, LLC
•
Construction,
commercial loans and
OREOs vehicle
•
24.9% stake
Corporate Structure –
Popular, Inc.
Industry
Financial services
Headquarters
San Juan, Puerto Rico
Assets
$36 billion (among top 50
BHCs in the U.S.)
Loans
$24 billion
Deposits
$27 billion
Banking branches¹
234 in Puerto Rico, New
York, New Jersey, Florida
and U.S. and British Virgin
Islands
NASDAQ ticker symbol
BPOP
Market Cap
$3.6 billion
13
Banco Popular
de Puerto Rico
Popular
Securities LLC
Popular’s
Insurance
Subsidaries
Popular North
America, Inc.
Holding
Companies
(Including
Equity
Investments)
Banco Popular
North America²
Popular Auto,
LLC |
 Market Leadership
in Puerto Rico Source: Puerto Rico Office of the Commissioner of Financial Institutions,
COSSEC, and 10K Reports.*Information included pertains to PR Commercial Banks and Credit Unions.
¹
Mortgage loan production and credit card data for certain competitors is not publicly
available; figures presented for competitors were estimated. Popular’s Puerto Rico
Market Share by Category Popular’s Puerto Rico Market Share Trend
14
38%
37%
35%
42%
40%
39%
39%
41%
24%
23%
22%
33%
34%
35%
36%
38%
2007
2008
2009
2010
2011
2012
2013
2014
Total Deposits (net of brokered)
Total Loans |
 GAAP
Reconciliation Q1 2015 * Unaudited.
¹
Covered loans represent loans acquired in the Westernbank FDIC-assisted transaction that
are covered under FDIC loss sharing agreements. 15
($ in thousands)
Actual
Results
BPNA (US GAAP)
Reorganization
Doral
Acquisition
Adjusted
Results
(Non-GAAP)
Net interest income
$ 343,195
$
-
$
- $ 343,195
29,711
-
-
29,711
10,324
-
-
10,324
Net interest income after provision for loan losses
303,160
-
-
303,160
Net loss on sale of loans, including valuation adjustments on loans
held-for-sale (79)
-
-
(79)
FDIC loss share income
4,139
-
-
4,139
Other non-interest income
111,175
-
1,121
110,054
Personnel costs
116,458
-
2,432
114,026
Net occupancy expenses
21,709
-
643
21,066
Professional fees
75,528
-
6,997
68,531
Restructuring costs
10,753
10,753
-
-
Other operating expenses
87,894
-
-
87,894
Income (loss) from continuing operations before income tax
106,053
(10,753)
(8,951)
125,757
Income tax expense
32,568
-
(2,896)
35,464
Income (loss) from continuing operations
$ 73,485
$ (10,753)
$ (6,055)
$ 90,293
Income from discontinued operations, net of tax
$ 1,341
$
1,341
$
-
$
- Net income (loss)
$ 74,826
$
(9,412) $ (6,055)
$ 90,293
Basic and Diluted EPS
0.72
$
Net interest margin
4.57%
Tangible common book value per common share
36.33
$
Market value per common share
34.39
$
Q1 2015 *
Provision for loan losses – non-covered loans
Provision
for
loan
losses
–
covered
loans
¹ |
 Provision for
loan losses – non-covered loans GAAP Reconciliation Q4 2014
* Unaudited.
¹
Covered loans represent loans acquired in the Westernbank FDIC-assisted transaction that
are covered under FDIC loss sharing agreements. ²
Excludes the impact of $18.6 million pertaining to US repos refinancing. US GAAP net interest
margin was 4.45%. 16
($ in thousands)
Actual
Results
BPNA (US GAAP)
Reorganization
Other
Adjustments
Adjusted
Results
(Non-GAAP)
Net interest income (expense)
$ 326,861
$ (18,591)
$
- $ 345,452
51,637
878
-
50,759
(3,646)
-
-
(3,646)
Net interest income (expense) after provision for loan losses
278,870
(19,469)
-
298,339
Net gain on sale of loans, including valuation adjustments on loans
held-for-sale 10,946
1,684
-
9,262
FDIC loss share expense
(18,693)
-
-
(18,693)
Other non-interest income
111,111
-
-
111,111
Personnel costs
110,736
-
2,974
107,762
Net occupancy expenses
23,877
-
1,895
21,982
Professional fees
80,383
-
-
80,383
Loss on early extinguishment of debt
532
532
-
-
Restructuring costs
13,861
13,861
-
-
Other operating expenses
100,617
-
-
100,617
Income (loss) from continuing operations before income tax
52,228
(32,178)
(4,869)
89,275
Income tax expense
12,472
-
-
12,472
Income (loss) from continuing operations
$ 39,756
$ (32,178)
$ (4,869)
$ 76,803
Income from discontinued operations, net of tax
$ 9,086
$
9,086
$
-
$
- Net income (loss)
$ 48,842
$ (23,092)
$ (4,869)
$ 76,803
Basic EPS
0.47
$
Diluted EPS
0.46
$
Net interest margin
4.70%
²
Tangible common book value per common share
35.89
$
Market value per common share
34.05
$
Q4 2014 *
Reversal of provision for loan losses – covered loans ¹
|
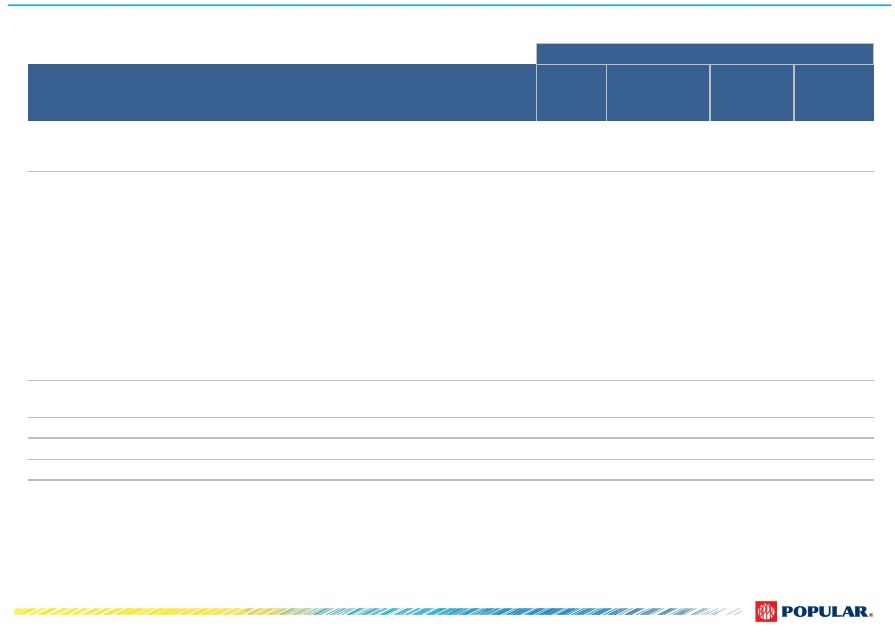
 Business Segments
(GAAP)* * Unaudited
¹
Non-fully taxable equivalent
17
($ in millions)
Financial Results
Q1 15
Q4 14
Variance
Q1 15
Q4 14
Variance
Net interest income
307
$
311
$
(4)
$
52
$
31
$
21
$
Non-interest income
103
79
24
6
18
(12)
Gross revenues
410
390
20
58
49
9
Provision for loan losses –
non-covered loans
32
53
(21)
(2)
(1)
(1)
Provision for loan losses –
covered loans
10
(4)
14
-
-
-
Total provision for loan losses
42
49
(7)
(2)
(1)
(1)
Operating expenses
240
240
-
55
64
(9)
Income tax expense
37
25
12
1
1
-
Income (loss) from continuing operations
91
$
76
$
15
$
4
$
(15)
$
19
$
Income from discontinued operations, net of tax
-
$
-
$
-
$
1
$
9
$
(8)
$
Net income (loss)
91
$
76
$
15
$
5
$
(6)
$
11
$
($ in millions)
Balance Sheet Highlights
Q1 15
Q4 14
Variance
Q1 15
Q4 14
Variance
Total assets
28,804
$
27,384
$
1,420
$
6,718
$
5,503
$
1,215
$
Total loans
19,211
18,564
647
4,417
3,488
929
Total deposits
22,504
21,426
1,078
4,854
3,459
1,395
($ in millions)
Asset Quality(including covered assets)
Q1 15
Q4 14
Variance
Q1 15
Q4 14
Variance
Non-performing loans held-in-portfolio
658
$
629
$
29
$
27
$
19
$
8
$
Non-performing assets
895
879
16
39
54
(15)
Allowance for loan losses
557
571
(14)
32
31
1
Net interest margin
¹
5.00%
5.15%
-0.15%
3.82%
2.40%
1.42%
PR
US |
 Consolidated
Credit Summary (Excluding Covered Loans) 1
Excluding provision for loan losses and net write-downs related to the classified and
legacy assets sale Note: Numbers may not add to total due to rounding.
18
$ in millions
Q1 15
Q2 14
Q1 14
Loans Held in Portfolio (HIP)
$21,013
$19,404
$19,359
$19,635
$21,612
Performing HFS
152
87
158
93
94
NPL HFS
8
19
20
4
1
Total Non Covered Loans
21,174
$
19,511
$
19,537
$
19,732
$
21,707
$
Non-performing loans (NPLs)
$665
$631
$622
$640
$635
Commercial
$274
$260
$252
$278
$307
Construction
$13
$14
$19
$22
$22
Legacy
$2
$2
$6
$8
$12
Mortgage
$329
$305
$295
$286
$252
Consumer
$44
$47
$47
$43
$39
Leases
$3
$3
$3
$3
$3
NPLs HIP to loans HIP
3.16%
3.25%
3.21%
3.26%
2.94%
Net charge-offs (NCOs)
$36
$50
$40
$46
$43
Commercial
$4
$13
$0
$10
$11
Construction
($3)
($0)
($1)
($1)
($2)
Legacy
($2)
($4)
$0
($1)
($5)
Mortgage
$11
$12
$13
$10
$9
Consumer
$25
$28
$27
$26
$28
Leases
$1
$1
$1
$1
$1
Write-downs
($3)
$3
$32
$20
$0
NCOs to average loans HIP
0.72%
1.04%
¹
0.83%
¹
0.94%
0.80%
Provision for loan losses (PLL)
$30
$50
¹
$56
¹
$50
$47
PLL to average loans HIP
0.57%
1.02%
¹
1.16%
¹
1.02%
0.88%
PLL to NCOs
0.83x
0.99x
¹
1.39x
¹
1.08x
1.10x
Allowance for loan losses (ALL)
$516
$520
$522
$526
$543
ALL to loans HIP
2.46%
2.68%
2.69%
2.68%
2.51%
ALL to NPLs HIP
77.63%
82.30%
83.88%
82.26%
85.40%
Q4 14
Q3 14
¹
¹
¹
¹ |
  De-risked Loan
Portfolios •
The Corporation has de-risked its loan portfolios
by reducing its exposure in asset classes with
historically high loss content
•
In the BPPR commercial portfolio reductions
include:
Commercial portfolio, including
construction, has decreased from 55% of
total loans held-in-portfolio to 41%
Construction portfolio is down by 92% since
Q4 2007
SME
lending is down by 56% from Q4 2007
•
Collateralized exposure now represents a larger
portion of consumer loan portfolio
•
Unsecured loans credit quality has improved as
overall FICO scores have increased
1
Small and Medium Enterprise
19
$ in millions
Q4 2007
Q1 2015
Q4 2007
Q1 2015
Q4 2007
Q1 2015
Variance
Commercial
$7,774
$6,330
$4,515
$1,876
$12,288
$8,206
($4,082)
Consumer
3,552
3,347
1,698
468
5,249
3,815
(1,434)
Mortgage
2,933
5,465
3,139
1,011
6,071
6,475
404
Construction
1,231
99
237
117
1,468
216
(1,252)
Leases
814
581
-
-
814
581
(233)
Legacy
-
-
2,130
78
2,130
78
(2,052)
Subtotal
$16,304
$15,821
$11,718
$3,550
$28,021
$19,371
($8,650)
Doral
-
783
-
859
-
1,642
1,642
Total
$16,304
$16,605
$11,718
$4,408
$28,021
$21,013
($7,008)
PR
US
Total
Loan Composition (Held-in Portfolio)
NCOs
($mm)
(%)
($mm)
(%)
($mm)
(%)
Distribution²
CRE SME
1
$2,938
33%
$1,500
23%
($1,438)
-49%
24%
C&I SME
1
2,287
25%
793
12%
(1,494)
-65%
29%
C&I Corp
1,592
18%
1,966
31%
374
23%
5%
Construction
1,231
14%
99
2%
(1,132)
-92%
36%
CRE Corp
892
10%
1,981
31%
1,089
122%
4%
Multifamily
64
1%
90
1%
26
40%
1%
Total
$9,004
$6,429
($2,575)
-29%
100%
¹
Small and Medium Enterprise
BPPR Commercial & Construction Distribution
Q4 2007
Q1 2015
Variance
²
NCOs distribution represents the percentage allocation of net charge-offs from Q1 2008
through Q4 2014 per each loan category.
1 |
 Popular, Inc.
Credit Ratings Our senior unsecured ratings have remained stable
Moody’s
B2
Positive
Fitch
BB-
Stable Outlook
S&P
B+
Negative
April
Moody’s placing most
of the PR banks under
review with the
possibility of
downgrades, due to
the state of the
Puerto Rico economy
December
Moody’s
downgraded
BPOP to B1;
outlook stable
January
Fitch raised to
BB-
from B+;
outlook stable
October
Moody’s
revised outlook
to negative
February
Moody's placed
BPOP on review
for downgrade
May
Moody’s
downgraded
BPOP to B2;
outlook negative
February
S&P Places BPOP on credit
watch negative due to the
general economic
environment in Puerto
Rico; the actions follow
the recent downgrades of
PR Muni Bonds
March
Moody’s placed
BPOP on review
for possible
upgrade due to a
change in their
bank rating
methodology
2012
2013
2014
2015
20 |
 Investor
Presentation First Quarter 2015 |