Attached files
| file | filename |
|---|---|
| EX-23.2 - EX-23.2 - AVINTIV Inc. | d806629dex232.htm |
| EX-23.1 - EX-23.1 - AVINTIV Inc. | d806629dex231.htm |
| EX-23.3 - EX-23.3 - AVINTIV Inc. | d806629dex233.htm |
Table of Contents
As filed with the Securities and Exchange Commission on April 27, 2015.
Registration No. 333-201995
UNITED STATES
SECURITIES AND EXCHANGE COMMISSION
Washington, D.C. 20549
AMENDMENT NO. 1
TO
FORM S-1
REGISTRATION STATEMENT
UNDER
THE SECURITIES ACT OF 1933
PGI Specialty Materials, Inc.
(Exact Name of Registrant as Specified in its Charter)
| Delaware | 2221 | 27-4132779 | ||
| (State or other jurisdiction of incorporation or organization) |
(Primary Standard Industrial Classification Code Number) |
(I.R.S. Employer Identification No.) |
9335 Harris Corners Parkway, Suite 300
Charlotte, North Carolina 28269
(704) 697-5100
(Address, including zip code, and telephone number, including area code, of Registrant’s principal executive offices)
April Miller Boise
Senior Vice President, General Counsel,
Head of Global Mergers & Acquisitions
and Secretary
PGI Specialty Materials, Inc.
9335 Harris Corners Parkway, Suite 300
Charlotte, North Carolina 28269
(704) 697-5100
(Name, address, including zip code, and telephone number, including area code, of agent for service)
Copies to:
| Igor Fert, Esq. Simpson Thacher & Bartlett LLP 425 Lexington Avenue New York, NY 10017 Telephone: (212) 455-2000 Facsimile: (212) 455-2502 |
Michael Kaplan, Esq. Richard D. Truesdell, Jr., Esq. Davis Polk & Wardwell LLP 450 Lexington Avenue New York, NY 10017 Phone: (212) 450-4000 Fax: (212) 701-5800 |
Approximate date of commencement of the proposed sale of the securities to the public: As soon as practicable after the Registration Statement is declared effective.
If any of the securities being registered on this form are to be offered on a delayed or continuous basis pursuant to Rule 415 under the Securities Act of 1933, check the following box. ¨
If this form is filed to register additional securities for an offering pursuant to Rule 462(b) under the Securities Act, check the following box and list the Securities Act registration statement number of the earlier effective registration statement for the same offering. ¨
If this form is a post-effective amendment filed pursuant to Rule 462(c) under the Securities Act, check the following box and list the Securities Act registration statement number of the earlier effective registration statement for the same offering. ¨
If this form is a post-effective amendment filed pursuant to Rule 462(d) under the Securities Act, check the following box and list the Securities Act registration statement number of the earlier effective registration statement for the same offering. ¨
Indicate by check mark whether the Registrant is a large accelerated filer, an accelerated filer, a non-accelerated filer, or a smaller reporting company. See the definitions of “large accelerated filer,” “accelerated filer” and “smaller reporting company” in Rule 12b-2 of the Exchange Act.
| Large accelerated filer | ¨ | Accelerated filer | ¨ | |||
| Non-accelerated filer | x (Do not check if a smaller reporting company) | Smaller reporting company | ¨ | |||
CALCULATION OF REGISTRATION FEE
|
| ||||
| Title Of Each Class Of Securities To Be Registered |
Proposed Maximum Offering Price(1)(2) |
Amount of Registration Fee(3) | ||
| Common Stock, par value $0.01 per share |
$100,000,000 | $11,620 | ||
|
| ||||
| (1) | Estimated solely for the purpose of determining the amount of the registration fee in accordance with Rule 457(o) under the Securities Act of 1933. |
| (2) | Includes shares of common stock subject to the underwriters’ option to purchase additional shares of common stock. |
| (3) | Previously paid |
The Registrant hereby amends this Registration Statement on such date or dates as may be necessary to delay its effective date until the Registrant shall file a further amendment which specifically states that this Registration Statement shall thereafter become effective in accordance with Section 8(a) of the Securities Act of 1933 or until the Registration Statement shall become effective on such date as the Securities and Exchange Commission, acting pursuant to said Section 8(a), may determine.
Table of Contents
The information in this prospectus is not complete and may be changed. We may not sell these securities until the registration statement filed with the Securities and Exchange Commission is effective. This prospectus is not an offer to sell these securities and it is not soliciting an offer to buy these securities in any jurisdiction where the offer or sale is not permitted.
Subject to Completion. Dated April 27, 2015.
Shares

PGI Specialty Materials, Inc.
Common Stock
This is an initial public offering of shares of common stock of PGI Specialty Materials, Inc.
Prior to this offering, there has been no public market for the common stock. It is currently estimated that the initial public offering price per share will be between $ and $ . PGI Specialty Materials, Inc. intends to list the common stock on The New York Stock Exchange (the “NYSE”) under the symbol “ .”
After the completion of this offering, affiliates of The Blackstone Group L.P. will continue to own a majority of the voting power of all outstanding shares of the common stock. As a result, we will be a “controlled company” within the meaning of the corporate governance standards of the NYSE. See “Principal Stockholders.”
We have granted the underwriters a 30-day option to purchase up to additional shares at the initial public offering price less the underwriting discount and commissions.
Investing in our common stock involves risk. See “Risk Factors” beginning on page 27 to read about factors you should consider before buying shares of our common stock.
Neither the Securities and Exchange Commission nor any other regulatory body has approved or disapproved of these securities or passed upon the accuracy or adequacy of this prospectus. Any representation to the contrary is a criminal offense.
| Per Share | Total | |||||||
| Initial public offering price |
$ | $ | ||||||
| Underwriting discounts and commissions(1) |
$ | $ | ||||||
| Proceeds, before expenses, to us |
$ | $ | ||||||
| (1) | See “Underwriting” for additional information regarding underwriting compensation. |
The underwriters expect to deliver the shares against payment in New York, New York on or about , 2015.
| BofA Merrill Lynch | Citigroup | |||
| Goldman, Sachs & Co. | Jefferies | RBC Capital Markets | ||
Prospectus dated , 2015.
Table of Contents
Unless otherwise indicated or the context otherwise requires, financial data in this prospectus reflects the consolidated business and operations of PGI Specialty Materials, Inc. and its consolidated subsidiaries.
Neither we nor the underwriters have authorized anyone to provide any information or to make any representations other than those contained in this prospectus or in any free writing prospectuses we have prepared. Neither we nor the underwriters take responsibility for, nor can provide any assurance as to the reliability of, any other information that others may give you. This prospectus is an offer to sell only the shares offered hereby, but only under circumstances and in jurisdictions where it is lawful to do so. The information contained in this prospectus is current only as of its date.
i
Table of Contents
MARKET, RANKING AND OTHER INDUSTRY DATA
The data included in this prospectus regarding the markets and the industry in which we operate, including the size of certain markets and our position and the position of our competitors within these markets, are based on reports of government agencies, independent industry sources (including a report prepared for us by Smithers Information Ltd., an independent third-party market research firm, and information obtained from Nonwovens Industry) and our own estimates relying on our management’s knowledge and experience in the markets in which we operate. Our management’s knowledge and experience, in turn, are based on information obtained from our customers, distributors, suppliers, trade and business organizations and other contacts in the markets in which we operate. We believe these reports, sources and estimates to be accurate as of their respective dates. However, this information may prove to be inaccurate because of the method by which we obtained some of the data for our estimates or because this information cannot always be verified with complete certainty due to the limits on the availability and reliability of raw data, the voluntary nature of the data gathering process and other limitations and uncertainties. Unless otherwise specified in this prospectus, all references to market size and our market positions are based on our pro forma net sales for the specified periods.
Although we believe market, ranking and other industry data included in this prospectus is generally reliable, we cannot guarantee the accuracy and completeness of the information and have not independently verified it. We have not independently verified any of the data from other third party sources, nor have we ascertained the underlying assumptions relied upon therein. As a result, you should be aware that market, ranking and other industry data included in this prospectus, and our estimates and beliefs based on that data, may not be reliable. Neither we nor the underwriters can guarantee the accuracy or completeness of any such information contained in this prospectus. While we are not aware of any misstatements regarding the industry data presented herein, our estimates involve risks and uncertainties and are subject to change based on various factors, including those discussed under the heading “Risk Factors,” “Forward-Looking Statements” and “Management’s Discussion and Analysis of Financial Condition and Results of Operations” in this prospectus.
TRADEMARKS, SERVICE MARKS AND TRADENAMES
This prospectus contains some of our trademarks, trade names and service marks, including the following: APEX, Chicopee, Chix, Chux, Durawipe, Fiberweb, KAMI, Masslinn, PGI, Polymer Group, Inc., Providência, REEMAY, Spinlace, S-Tex, TYPAR and Worxwell. Each one of these trademarks, trade names or service marks is either (i) our registered trademark, (ii) a trademark for which we have a pending application, (iii) a trade name or service mark for which we claim common law rights or (iv) a registered trademark or application for registration which we have been licensed by a third party to use.
Solely for convenience, the trademarks, service marks, and trade names referred to in this prospectus are without the ® and ™ symbols, but such references are not intended to indicate, in any way, that we will not assert, to the fullest extent under applicable law, our rights or the rights of the applicable licensors to these trademarks, service marks, and trade names. This prospectus contains additional trademarks, service marks and trade names of others, which are the property of their respective owners. All trademarks, service marks and trade names appearing in this prospectus are, to our knowledge, the property of their respective owners.
As used in this prospectus, unless otherwise noted or the context otherwise requires:
| • | references to the “Issuer” are to PGI Specialty Materials, Inc., exclusive of its subsidiaries; |
| • | references to “we,” “us,” “our,” “PGI,” and “the Company” are to PGI Specialty Materials, Inc. and its subsidiaries; |
| • | references to “PGI Group” are to Polymer Group, Inc., an indirect subsidiary of the Issuer, exclusive of its subsidiaries; |
ii
Table of Contents
| • | references to “Holdings” are to Scorpio Acquisition Corporation, the direct subsidiary of the Issuer, exclusive of its subsidiaries; |
| • | references to “Blackstone” and the “Sponsor” are to certain investment funds affiliated with Blackstone Capital Partners V L.P.; |
| • | references to the “Investor Group” are, collectively, to Blackstone and the management investors (as defined below); |
| • | references to the “management investors” are to certain members of our management team and employees who have made investments in the Issuer; |
| • | references to “Providência” are to Companhia Providência Indústria e Comércio, a Brazilian corporation (sociedade anônima); |
| • | references to “Acquisition Co.” are to our wholly-owned subsidiary, PGI Polímeros do Brasil S.A., a Brazilian corporation (sociedade anônima); |
| • | references to the “Providência Acquisition” are to the acquisition of approximately 71.25% of the outstanding capital stock of Providência by Acquisition Co.; |
| • | references to “Providência Refinancing” are to the borrowings under the Incremental Amendment (as defined below), the Senior Unsecured Notes (as defined below) and the use of proceeds therefrom; |
| • | references to the “Mandatory Tender Offer” are to the mandatory tender offer registration request filed by Acquisition Co., our wholly-owned subsidiary, with the Securities Commission of Brazil (Comissão de Valores Mobiliários or “CVM”) in order to launch as required by Brazilian law, after the CVM’s approval, a tender offer to acquire the remaining approximately 28.75% of the outstanding capital stock of Providência that is currently held by minority shareholders; |
| • | references to “Fiberweb” are to Fiberweb Limited (formerly known as Fiberweb plc); |
| • | references to the “Fiberweb Acquisition” are to the completion of the acquisition of the entire issued ordinary share capital of Fiberweb, the borrowings under the Bridge Facilities and the use of proceeds therefrom; |
| • | references to the “Fiberweb Refinancing” are to the Equity Contribution (as defined below), the borrowings under the Term Loans (as defined below) and the use of proceeds therefrom; |
| • | references to “Terram Geosynthetics” are to Terram Geosynthetics Private Limited, a joint venture we acquired as part of the Fiberweb Acquisition in which we maintain a 65% interest; |
| • | references to the “ABL Facility” are to the Credit Agreement, dated as of January 28, 2011, among Holdings, PGI Group, as lead borrower, the lenders from time to time party thereto, Citibank, N.A., as administrative agent and collateral agent, Morgan Stanley Senior Funding, Inc., as syndication agent, Barclays Bank PLC and RBC Capital Markets, as co-documentation agents, and Citigroup Global Markets Inc., Morgan Stanley Senior Funding, Inc., Barclays Capital Inc. and RBC Capital Markets LLC, as joint lead arrangers and joint book runners, as further amended or supplemented from time to time; |
| • | references to the “Secured Bridge Facility” are to the $268.0 million secured bridge credit facility, dated as of September 17, 2013, among PGI Group, Holdings, the lenders from time to time party thereto, Citicorp North America, Inc., as administrative agent, Barclays Bank PLC, as syndication agent and Citigroup Global Markets Inc. and Barclays Bank PLC, as joint lead arrangers and joint bookrunners, as further amended or supplemented from time to time; |
| • | references to the “Unsecured Bridge Facility” are to the $50.0 million unsecured bridge credit facility, dated as of November 26, 2013, among PGI Group, Holdings, the lenders from time to time party thereto, Citicorp North America, Inc., as administrative agent, Barclays Bank PLC, as syndication |
iii
Table of Contents
| agent and Citigroup Global Markets Inc. and Barclays Bank PLC, as joint lead arrangers and joint bookrunners, as further amended or supplemented from time to time; |
| • | references to the “Bridge Facilities” are to the Secured Bridge Facility and the Unsecured Bridge Facility, collectively; |
| • | references to the “Term Loans” are to the $295.0 million of term loans outstanding pursuant to the Senior Secured Credit Agreement (the “Term Loan Facility”), dated as of December 19, 2013, among PGI Group, Holdings, the lenders from time to time party thereto, Citicorp North America, Inc., as administrative agent, Barclays Bank PLC, as syndication agent, RBC Capital Markets and HSBC Bank USA, N.A., as co-documentation agents, Citigroup Global Markets Inc. and Barclays Bank PLC, as joint lead arrangers and Citigroup Global Markets Inc., Barclays Bank PLC, RBC Capital Markets and HSBC Securities (USA) Inc., as joint bookrunners, as further amended or supplemented from time to time; |
| • | references to “Additional Term Loans” are to the $415.0 million of incremental term loans outstanding pursuant to an incremental term loan amendment, dated as of June 10, 2014 (the “Incremental Amendment”), to our existing Term Loan Facility; |
| • | references to “2015 Additional Term Loans” are to the $283.0 million of incremental term loans outstanding pursuant to the second incremental term loan amendment, dated as of April 17, 2015 (the “Second Incremental Amendment”); |
| • | references to “Equity Contribution” are to an equity investment by the Sponsor of approximately $30.7 million in the Issuer, the proceeds of which were contributed as a capital contribution to Holdings, which in turn contributed such proceeds to PGI Group as a capital contribution; |
| • | references to “pro forma” give pro forma effect to the Providência Acquisition and the Providência Refinancing and the Offering (as defined herein), for the period indicated; |
| • | references to the “Senior Unsecured Notes” are to the $210.0 million aggregate principal amount of 6.875% senior unsecured notes due 2019 issued by PGI Group on June 11, 2014; |
| • | references to the “Senior Secured Notes” are to the $560.0 million aggregate principal amount of 7.75% notes due 2019 issued by PGI Group on January 13, 2011; |
| • | reference to “spunmelt” are to spunmelt technology, which uses thermoplastic polymers that are melt-spun to manufacture continuous-filament products; |
| • | references to “Smithers Pira” are to Smithers Information Ltd., a market research firm. All information included herein that is attributed to Smithers Pira is based on Smithers Pira Consultancy Report: Global Nonwovens Market Study, dated October 30, 2014; |
| • | references to “nonwovens industry” are to industry size, as measured by either volume (in metric tons) or value (in U.S. dollars), based on information by Smithers Pira. The nonwovens industry, as defined by Smithers Pira, encompasses nonwovens used for various products that serve the hygiene, healthcare filtration, dryer sheets, industrial and wipes applications. The industry also includes geocomposites products, which are an adjacent technology used in industrial applications that can utilize nonwovens; |
| • | references to “Nonwovens Industry” are to the information publicly available at http://www.nonwovens-industry.com, a website dedicated to the worldwide business of nonwovens; |
| • | references to “markets” or “regions” generally refers to the four geographic regions in which we operate: North America, South America, Europe (including our India operations), and Asia; |
| • | references to “applications” generally are to the various customer end-use applications which our products serve. While our products serve a diverse range of applications, for convenience, we group these applications into three primary categories: Personal Care, Infection Prevention and High Performance Solutions. Personal Care includes hygiene applications (such as baby diapers, adult |
iv
Table of Contents
| incontinence products, and feminine hygiene products), personal care wipes, and fabric-softening dryer sheets. Infection Prevention includes healthcare applications (such as surgical gowns and drapes, face masks and wound care products), filtration products (including blood filters, pool and spa filters, and Hepa filtration), and disinfectant wipes (including patient care wipes and hard surface disinfectant wipes). High Performance Solutions includes building, construction and geosynthetics (including house wrap, road underlayment and industrial cable wrap), along with air filtration, home and bedding and industrial wiping applications, among others; |
| • | references to our market positions or rank are, except as otherwise indicated, based on our pro forma net sales; and |
| • | references to the “underwriters” are to the firms listed on the cover page of this prospectus. |
On January 28, 2011, pursuant to an Agreement and Plan of Merger, dated as of October 4, 2010, we were acquired by affiliates of Blackstone, along with certain members of our management (the “Merger”). Periods prior to January 28, 2011 reflect the financial position, results of operations, and changes in financial position of the Company prior to the Merger (the “Predecessor”). The fiscal year ended December 31, 2011 reflects the financial position, results of operations, and changes in financial position of the Company after the Merger (the “Successor”). The Successor had no operating activities between its November 22, 2010 inception date and the closing date of the Merger. The audited financial statements of the Successor for the period from November 22, 2010 to January 2, 2011, and as of January 2, 2011, have been omitted from this prospectus because we believe the Successor qualified as a “business combination related shell company” within the meaning of relevant SEC guidance during such period, as it was formed for the sole purpose of completing the Merger and did not have any assets as of January 2, 2011.
The Merger was recorded using the acquisition method of accounting in accordance with the accounting guidance for business combinations and non-controlling interest. The guidance prescribes that the purchase price be allocated to assets acquired and liabilities assumed based on the estimated fair market value of such assets and liabilities at the date of acquisition. As a result, periods prior to the Merger are not comparable to subsequent periods due to the difference in the basis of presentation of purchase accounting as compared to historical cost.
The audited financial statements of Fiberweb as of and for the years ended December 31, 2012, 2011 and 2010 and the unaudited interim financial statements as of and for the nine months ended September 30, 2013 included in this prospectus have been prepared in pounds sterling and in accordance with applicable International Financial Reporting Standards (“IFRS”) as issued by the International Accounting Standards Board (“IASB”). IFRS differs in certain significant respects from U.S. Generally Accepted Accounting Principles (“GAAP”).
The audited financial statements of Providência as of and for the years ended December 31, 2013 and 2012 and the unaudited condensed interim financial statements as of and for the three months ended March 31, 2014 included in this prospectus have been prepared in Brazilian reals and in accordance with applicable IFRS as issued by the IASB. IFRS differs in certain significant respects from GAAP. See “Unaudited Pro Forma Condensed Combined Financial Information” for a discussion of significant differences between IFRS and GAAP as they relate to Providência.
The Company’s fiscal year is based on a 52 week period ending on the Saturday closest to each December 31. The one month ended January 28, 2011 for the Predecessor contains four weeks. The fiscal year ended December 31, 2011 for the Successor contains 48 weeks. The fiscal years ended December 29, 2012 and December 28, 2013 for the Successor contain operating results for 52 weeks. References herein to “2011,” “2012,” and “2013” generally refer to fiscal 2011, fiscal 2012 and fiscal 2013, respectively, unless the context indicates otherwise. In fiscal year 2014, the Company changed its year-end date to December 31. The Company’s 2014 fiscal year commenced on December 29, 2013 and concluded on December 31, 2014.
v
Table of Contents
This summary highlights certain significant aspects of our business and this offering. This is a summary of information contained elsewhere in this prospectus, is not complete, and does not contain all of the information that you should consider before making your investment decision. You should carefully read the entire prospectus, including the information presented under the section entitled “Risk Factors” and the consolidated financial statements and the notes thereto, before making an investment decision. This summary contains forward-looking statements that involve risks and uncertainties. Our actual results may differ significantly from future results contemplated in the forward-looking statements as a result of certain factors such as those set forth in “Risk Factors” and “Forward-Looking Statements.” When making an investment decision, you should also read the discussion under “Basis of Presentation” for the definition of certain terms used in this prospectus and a description of certain transactions and other matters described in this prospectus.
Company Overview
We are a leading global innovator and manufacturer of specialty materials for use in a broad range of products that make the world safer, cleaner and healthier. We design and manufacture versatile high performance materials that can be engineered to possess specific value-added characteristics, including absorbency, tensile strength, softness and barrier properties. We serve customers focused on personal care, infection prevention, and high performance solutions, where our products are critical components used in a broad array of consumer and commercial products. For personal care applications, we supply specialty materials essential to the performance and feel of disposable baby diapers, feminine hygiene products, adult incontinence products, personal wipes and fabric softening dryer sheets. For infection prevention applications, our materials are utilized in products designed to ensure a clean environment, including disinfectant wipes, surgical gowns and drapes, face masks, wound care sponges, and water, air and blood filters. For high performance solutions, we supply protective house wrap, industrial cable wrap, construction and agricultural geosynthetics, as well as components for home and bedding products, industrial cleaning wipes, and various other applications.
We primarily manufacture nonwovens, which are fabric-like, value-added materials produced from polypropylene and other resins, along with natural and synthetic fibers and other components. The total nonwovens industry size is estimated to be worth in excess of $30 billion globally in 2013 and is expected to grow at a compounded annual growth rate (“CAGR”) by volume of 6.6% from 2013 to 2018, according to Smithers Pira.
We are the largest global manufacturer of nonwovens based on our 2013 pro forma net sales, according to Nonwovens Industry. Over the past five years, we have undertaken a series of investments and acquisitions, including the Fiberweb Acquisition in November 2013 and the Providência Acquisition in June 2014, that have expanded our global presence, increased our product portfolio and broadened our technology base. As a result, we estimate that we generated approximately 70% of our 2014 pro forma net sales from applications for which we believe we have either the #1 or #2 position as measured by pro forma net sales or volume. We believe we have one of the largest global platforms in the nonwovens industry, with 22 manufacturing and converting facilities in 14 countries, including a significant presence in high-growth emerging markets such as South America and Asia. We have manufacturing capabilities in each of North America, South America, Europe and Asia, which we believe is a competitive advantage in serving our multi-national, blue-chip customers. Our manufacturing facilities are strategically located near the production facilities of many of our key customers in order to increase our effectiveness in addressing regional demand for our products, many of which do not ship economically over long distances.
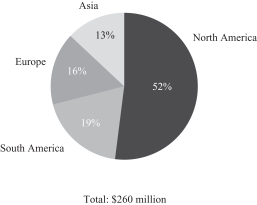
For the fiscal year ended December 31, 2014, on a pro forma basis, we generated net sales of $2,006 million, and net loss attributable to PGI Specialty Materials, Inc. of $121 million. For the year ended December 31, 2014, we generated pro forma Adjusted EBITDA of $260 million. For information about how we calculate
1
Table of Contents
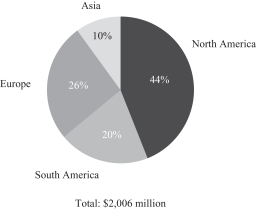
Adjusted EBITDA, please see “Summary Historical and Pro Forma Condensed Combined Financial Information.” Our sales are geographically diversified, with 44% of our pro forma net sales generated in North America, 20% generated in South America, 26% generated in Europe and 10% generated in Asia, each for the year ended December 31, 2014.
Segment Overview
We manage our business through four reportable operating segments organized by geographic region: North America, South America, Europe and Asia. Each of our regional manufacturing facilities has a diverse range of capabilities and technologies to serve local demand trends and our customers’ specific requirements, which vary by region. Consequently, each of our regions serves a unique mix of customer applications; however, certain of our applications and customers are consistent across our regions. We believe that our ability to provide consistent, high-quality products across a variety of geographies is a strong competitive advantage in serving our global customers. In addition, our geographic breadth and broad range of applications reduce exposure to any one region, manufacturing facility, application, or customer.
North America
Our North America segment includes five manufacturing and converting facilities in the United States, one in Canada and one in Mexico. Our North America segment includes a broad array of product technologies, including our proprietary Reemay, Spinlace, Apex and TYPAR technologies, that collectively serve a wide spectrum of product applications. Within personal care, we believe we are a leading manufacturer of nonwovens for hygiene applications, such as baby diapers and feminine hygiene products, and substrates for fabric-softening dryer sheets, based on pro forma volume. Within infection prevention, we believe we are the largest provider of substrates for household cleaning wipes, based on pro forma volume, and a leading supplier of specialty materials for use in various medical garments, such as surgical gowns and drapes. Within high performance solutions, we believe we are the largest provider of filtration media for pool and spa filters, as well as the #1 provider of protective house wrap in Canada, based on pro forma volume, and the #2 provider in the United States.
South America
Our South America segment includes two manufacturing facilities in Brazil, one in Argentina and one in Colombia. This footprint enables us to efficiently serve the Caribbean and Central America, the Andean Community (CAN) and the Southern Common Market (MERCOSUR) economic trade zones. All of our facilities in the region utilize leading-edge spunmelt technology and specialize in serving personal care applications, such as baby diapers and feminine hygiene products. We believe consumer adoption of these products is expected to grow rapidly with disposable incomes rising towards the levels of developed economies. We believe we are the leading provider of nonwovens for personal care applications in South America, based on pro forma volume. Within high performance solutions, we also serve certain specialty agriculture and industrial customers in this region.
Europe
Our Europe segment includes two manufacturing facilities in the United Kingdom, two in France, and one in each of Germany, Italy, Spain and the Netherlands. Our Europe segment also includes our India joint venture with one manufacturing facility located in India. Our European segment includes our most diverse set of technologies, such as our proprietary S-tex spunmelt and hydroentanglement technologies, and serves a broad array of personal care, infection prevention and high performance solutions applications. We believe we are the leading global provider of industrial cable wrap and have significant positions in geosynthetics for civil engineering, landscape and military use. We also have meaningful positions in hygiene applications, such as baby diapers and adult incontinence products, and healthcare products, such as surgical drapes, blood filtration and face masks.
2
Table of Contents
Asia
Our Asia segment consists of two manufacturing facilities in China. Infection prevention applications currently represent approximately 60% of our pro forma net sales in Asia, with personal care applications accounting for 31% and high performance solutions applications accounting for the remaining 9%, for the fiscal year ended December 31, 2014. Our Asia region is the primary manufacturing base for servicing our global healthcare customers. For these applications, we supply our specialty materials to regional converters in Asia who cut and sew our products into finished goods for sale primarily in Europe and North America. In addition, we plan to utilize our leading-edge spunmelt technologies to participate in the rapid growth expected in the Asia region from rising disposable incomes and consumer adoption of personal care products.
|
2014 Pro Forma Net Sales by Geography |
2014 Pro Forma Adjusted EBITDA by Geography(1)(2) | |
|
| |
| (1) | For information about how we calculate pro forma Adjusted EBITDA, please see “Summary Historical and Pro Forma Condensed Combined Financial Information.” |
| (2) | Percentages in chart are presented before unallocated corporate expenses. |
Overview of Key Applications
We design and manufacture specialty materials, which are critical components used in various personal care, infection prevention and high performance solutions products that make the world safer, cleaner and healthier. Our customers include global manufacturers such as Procter & Gamble (diapers, feminine sanitary protection and dryer sheets), Kimberly-Clark (diapers, surgical drapes and face masks) and Cardinal Health (surgical drapes and medical accessories) and a number of regional manufacturers.
3
Table of Contents
While we manufacture specialty materials both for disposable applications (such as hygiene, healthcare, wipes and filtration) and durable applications (such as house wrap and geosynthetics), we believe we are an industry leader in serving disposable applications as measured by pro forma net sales or volume—which we believe are attractive due to the recurring nature of product sales, long-term secular growth trends driven by higher global incomes, and lower cyclicality with macroeconomic cycles. Disposable applications represented approximately 74% of our pro forma net sales in 2014.
| 2014 Pro Forma Net Sales by Application |
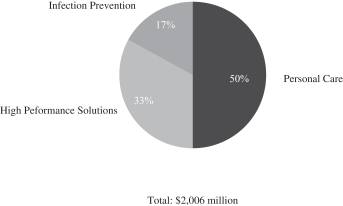
|
The table below outlines our key product applications and related industry metrics.
| Key Applications |
% of 2014 Pro Forma Net Sales(1) |
Representative End Products |
Representative |
Product Application Estimated 2013 Size |
Product Application Projected Volume Growth 2013-2018(3) | |||||||
| (dollars in millions) | ||||||||||||
| Personal Care |
50% | Hygiene | Baby diapers, feminine hygiene products, adult incontinence products, and training pants | Kimberly-Clark, Procter & Gamble, SCA |
$8,549 | 6.3% | ||||||
| Dryer Sheets/Personal Wipes |
Dryer sheets and Personal wipes | Procter & Gamble, SC Johnson |
$1,689 | 5.1% | ||||||||
| Infection Prevention | 17% | Healthcare |
Surgical gowns and drapes, disposable surgical packs, face masks, shoe covers and wound care sponges and dressings |
Cardinal Healthcare, Halyard Health, Medline |
$1,148 | 5.1% | ||||||
| Filtration |
Air, water and blood filters |
3M, Pall | $541 | 6.6% | ||||||||
| Disinfectant Wipes |
Patient care & skin disinfectant wipes, hard surface wipes, sanitizer-compatible wipes |
Clorox, SC Johnson, Sysco | $387 | 7.0% | ||||||||
4
Table of Contents
| Key Applications |
% of 2014 Pro Forma Net Sales(1) |
Representative End Products |
Representative |
Product Application Estimated 2013 Size |
Product Application Projected Volume Growth 2013-2018(3) | |||||||
| (dollars in millions) | ||||||||||||
| High Performance Solutions |
33% | Building & Construction/ Geosynthetics & Agriculture |
House wrap, cable wrap, road underlayment liners, geo cells, tree protection | Regional Home-builders, CanSave, GAF, Suprema |
$4,058 | 7.4% | ||||||
| Industrial Wipes |
Auto/aero wipes, graphic arts, industrial general purpose wipes |
3M, Cintas | $849 | 7.0% | ||||||||
| Filtration |
Air, structure, and liquid filters, pool and spa filters |
Meissner, PALL | $2,309 | 6.6% | ||||||||
| Technical specialties and other |
Furniture and bedding, composites, other industrial applications |
Hanes, Simmons | $13,540 | 7.0% | ||||||||
Source: Smithers Pira.
| (1) | Gives pro forma effect to the Providência Acquisition, as if it had occurred on December 29, 2013. |
| (2) | Represents key industry participants in the applications indicated. Certain of such participants are not PGI customers. |
| (3) | Represents Smithers Pira’s projected compounded annual growth rate in volumes for global nonwoven demand for the indicated product applications from 2013 to 2018. |
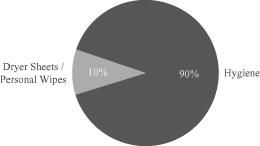
Personal Care
We manufacture specialty materials that are essential to the performance and feel of hygiene, dryer sheets and personal wipes applications. For hygiene applications, our products are engineered to provide critical performance characteristics including superior absorbency, barrier properties, strength, fit and softness in baby diapers, feminine hygiene products, adult incontinence products and training pants. Our broad product offering and global manufacturing base provides hygiene customers with a full range of these specialized components for their manufacturing facilities around the globe. We believe we are the leading global manufacturer of nonwovens for hygiene applications, based on pro forma volume.
To serve fabric-softening dryer sheet applications we sell products made with our proprietary Reemay technology that provides superior heat resistance and scent retention, which are critical to product performance and customer demands. We believe we are the primary supplier of these products to the two largest dryer sheet manufacturers in the United States.
Within wipes applications, our products serve as the key substrate for facial wipes and other personal cleansing wipes. Wipes producers rely on our specialty materials to enhance the durability, softness and liquid dispensability of their products.
5
Table of Contents
We frequently partner with industry leaders to jointly develop innovative products to meet changing consumer demands. We believe our ability to serve global manufacturers and provide specialty material consistently across geographical regions differentiates us from our competition.
| 2014 Personal Care Pro Forma Net Sales by Application |
|
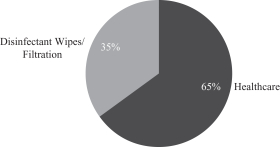
Infection Prevention
Our specialty materials are integral to many healthcare products that ensure a sterile environment by enhancing key performance characteristics such as barrier performance, breathability, strength and softness. Our healthcare products are used for the manufacture of disposable surgical packs, surgical gowns and drapes, face masks, shoe covers and wound care sponges. For these applications, our customers predominantly convert our specialty materials into their products in lower labor cost countries, such as China, for export to Western markets. We believe that our high-quality nonwoven manufacturing capabilities in China, strategically located near the manufacturing and converting operations of our customers, combined with our global position, provide a competitive advantage in serving these customers. We believe we are the leading global supplier of nonwovens for healthcare applications, based on pro forma volume.
We also provide substrates with superior absorbency, strength, softness or abrasiveness, durability and liquid dispensability for use in hard surface disinfectant wipes, patient care wipes and other infection prevention wipes. Our infection prevention wipes products include our Chicopee-branded converted wipes sold into foodservice channels to sanitize eating surfaces, as well as substrates sold to leading consumer products companies for conversion into hard surface disinfectant wipes for consumer use. We believe we are the leading North American supplier of materials for use in consumer disinfectant wipes, based on pro forma volume.
6
Table of Contents
Additionally, our specialty materials are critical to many filtration applications including blood, water and air filtration. We believe there are significant opportunities to expand our existing business in the areas of air filtration for HVAC applications, HEPA air filtration, as well as blood and water filtration.
| 2014 Infection Prevention Pro Forma Net Sales by Application |
|
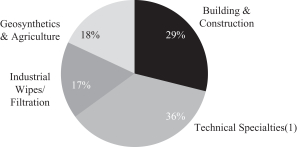
High Performance Solutions
Numerous industrial and other applications make use of our specialty materials due to our ability to engineer characteristics such as strength and durability, barrier protection, breathability and insulation properties. High performance solutions applications include protective house wrap, industrial cable wrap, geosynthetics, products for agricultural uses, industrial wipes and various other specialty materials used in home furnishings and bedding, road underlayment, liners and railroad materials.
We believe we are a leading supplier of house wrap to home-builders in the United States and Canada. House wrap is a protective layer used to prevent moisture-related damage and enhance energy efficiency. Through our Typar brand, we believe that we are the #1 provider of house wrap in Canada, based on pro forma volume, and the #2 provider in the United States. As this application is linked both to new construction and renovation spending, we expect continued growth in this segment to the extent the housing market recovery continues.
We believe that we are also a leading supplier of industrial cable wrap in Europe. Cable wrap is a protective cover used for pipelines and cables to prevent damage to these critical infrastructure assets. In addition, we believe we are the leading provider of nonwoven substrates for pool and spa filtration applications in North America through our proprietary Reemay-branded technology based on pro forma volume.
Geosynthetics products include various specialty materials used to improve the performance and mitigate the environmental impact of civil engineering and construction projects. Geosynthetics also include products for military, forestry, agriculture and landscaping applications. Key brands in this category include Terram, Tubex, DefenCell and Agryl.
Our high performance solutions also include converted wipes sold under our Chicopee brand name for use in automotive, graphics arts and cleanroom wipes, materials for household and bedding applications, industrial filtration media and various other technical products.
7
Table of Contents
| 2014 High Performance Solutions Pro Forma Net Sales by Category |
|
| (1) | Includes materials for protective apparel, furniture and bedding, composites and other industrial durable and infrastructure applications. |
Our Competitive Strengths
Global Leader with Strong Competitive Positions
We are a leading global supplier of specialty materials and the largest global manufacturer of nonwovens based on our 2013 pro forma net sales, according to Nonwovens Industry. The nonwovens industry has experienced significant consolidation in recent years, including our own acquisitions of Fiberweb and Providência, which we believe has improved our competitive position and enhanced our opportunities for growth across each of our geographic regions.
| 2013 Nonwovens Sales (in billions of $) |
|
Source: Nonwovens Industry.
| (1) | Includes $1.2 billion of revenue from PGI, $398 million of revenue from Fiberweb, and $360 million of revenue from Providência. |
| (2) | Production is primarily for internal consumption. |
| (3) | Represents companies primarily focused on nonwovens for disposable applications, such as hygiene, healthcare and wipes. |
8
Table of Contents
We estimate that we generated approximately 70% of our 2014 pro forma net sales from applications for which we believe we have either the #1 or #2 position as measured by pro forma net sales or volume. Specifically, we believe that we are an industry leader in serving disposable applications as measured by pro forma net sales or volume, which accounted for approximately 70% of our 2014 pro forma net sales. We also believe we are the leading global supplier of nonwovens for applications in personal care and healthcare, based on pro forma volume.
In addition, we believe that we have leading positions in a number of niche applications. We believe that we hold a leading position in pool and spa filtration in the United States through our Reemay branded products, which are sold to filter manufacturers. We also believe that we are the leading manufacturer of substrates for dryer sheets in the United States. Through our Typar brand, we believe that we are the #1 provider of house wrap in Canada, based on pro forma volume, and the #2 provider in the United States. As we continue to evolve to higher value specialty materials, we believe there is meaningful opportunity to grow in each of the key applications which we serve: personal care, infection prevention and high performance solutions. We believe that our innovative and differentiated technology platforms position us well to gain share in these applications as we work to broaden the use of our products.
Our market positions in numerous applications are a reflection of our differentiated technologies, customer service and global footprint. These capabilities enable us to effectively serve global customers, such as Procter & Gamble and Cardinal Health, who are among the industry leaders in their respective product applications. Our marketing and research and development teams collaborate closely with customers to develop new products through the application of new technologies, as well as meet our customers’ stringent product qualifications and process standards. These factors encourage customer loyalty, leading to an average relationship length of approximately 15 years with our key customers.
Attractive Long-Term Industry Growth Outlook Driven by Socio-Economic Trends
According to Smithers Pira, global demand for nonwovens is projected to grow at a CAGR of 6.6% by volume from 2013 to 2018 driven by several socio-economic trends, including overall population growth, a growing middle class in emerging markets, an aging population, increasing health standards, product innovation and agricultural efficiency. These trends favorably impact the various applications which we serve. For example, population growth and rising incomes impact the consumption of personal care products, such as baby diapers and wipes. In addition, increasing life expectancy and an aging population in many developed countries present a growing opportunity for adult incontinence and healthcare products. For example, the market for adult incontinence products, which uses up to 60% more of our specialty materials than baby diapers, was estimated at $2.4 billion in 2013 and is expected to grow to $3.4 billion in 2018. Increasingly stringent health standards and consumer focus on infection prevention are also driving greater consumption of disposable medical gowns, drapes, face masks, sanitary wipes and disinfectant wipes. Our specialty materials also serve a number of attractive niche applications, such as house wrap, industrial cable wrap and geosynthetics, which could benefit from a recovery in construction spending.
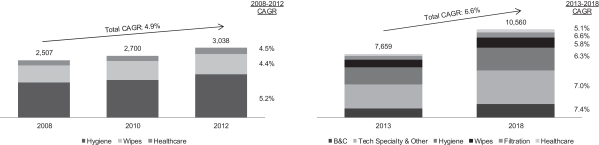
Our specialty materials are primarily used to manufacture disposable products, which accounted for approximately 74% of our pro forma net sales for the fiscal year ended December 31, 2014. We believe disposable products, such as baby diapers and medical gowns, have attractive long-term growth trends and are less cyclical than durable products, strengthening our financial profile through economic cycles (as demonstrated in the table below by the sale volumes of disposable products from 2008 to 2012). We believe that this resilience, combined with the diversification of our revenues across regions and applications, enhance our long-term financial profile and mitigates the risk of disruptions within any region, application, facility or customer.
9
Table of Contents
| Historical Disposable Application Growth | Expected Nonwoven Application Growth
|
Source: Smithers Pira.
| (1) | Wipes end market comprises personal wipes, dryer sheets, disinfectant wipes and industrial wipes. |
| (2) | Filtration end market includes medical and industrial filtration applications. |
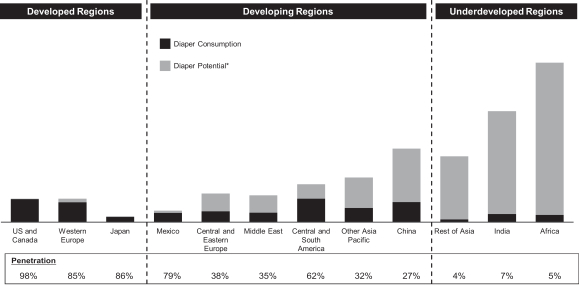
Significant Exposure to Attractive Emerging Markets
We believe that emerging markets represent a significant long-term secular growth opportunity for our specialty materials, especially in personal care applications. In many emerging markets, penetration rates for personal care products that utilize specialty nonwoven materials, such as disposable baby diapers, are significantly lower relative to developed markets. For example, the penetration of baby diapers is only 27% in China and 62% in Central and South America, compared to 98% in the United States and Canada, according to Price Hanna Consultants estimates. We believe growth will be driven by increasing disposable product penetration resulting from rising per capita incomes as well as population growth. According to Smithers Pira, total nonwovens volume demand in South America and Asia is projected to grow at a CAGR of 6.4% and 9.2%, respectively, from 2013 to 2018.
10
Table of Contents
The chart below contrasts the high penetration rates in developed regions in diaper consumption with the significantly lower current penetration rates seen in developing markets, which present a sizable growth opportunity. According to Smithers Pira, a 1% increase in the penetration rate of disposable diapers in China in 2013 would result in approximately $30 million of incremental materials market value, assuming current product design and pricing. Additionally, under-developed regions, such as India, Africa, and other emerging markets in Asia, represent additional longer-term growth opportunities.
| 2012 Actual and Estimated Potential Diaper Consumption by Region (in Billions of Diapers) |
|
Source: Price Hanna Consultants estimates.
| * | Represents potential market size if these regions achieve a penetration rate of 100%. Actual future penetration rates will vary. |
We believe that we are well-positioned to capitalize on this anticipated demand. The Providência Acquisition strengthened our presence in South America, providing us with the #1 nonwovens position in the region, based on pro forma volume, and two attractive manufacturing assets in Brazil to complement our existing production facilities in Colombia and Argentina. Pro forma for the Providência Acquisition, we are the leading manufacturer of nonwovens for hygiene and medical products in the region. Additionally, recent capacity expansions in Nanhai, China (expected to be completed in 2015) and Suzhou, China (completed in mid-2013) have enhanced our manufacturing capabilities in Asia. In 2014, we derived approximately 30% of our pro forma net sales and 32% of our Adjusted EBITDA from our South America and Asia segments.
Scalable Cost Structure and Operational Excellence To Drive Margin Expansion
Our scalable global infrastructure and focus on operational excellence position us to reduce our costs and increase our operating margins as we expand both organically and through acquisitions. We have increased our gross profit margin and Adjusted EBITDA margin from 15.5% and 11.8%, respectively, in 2011 on a stand alone basis to 17.9% and 13.0%, respectively, for the year ended December 31, 2014, on a pro forma basis. We have achieved this margin expansion through a combination of annual productivity and cost saving initiatives as well as realization of cost synergies associated with our recent acquisitions. For example, as of December 31, 2014, we have fully implemented initiatives at Fiberweb accounting for approximately $39.2 million of annualized
11
Table of Contents
savings (above our initial estimates of $28 million) and we continue to pursue initiatives aimed at achieving additional savings. Likewise, we have also identified initiatives that are estimated to generate meaningful synergies in connection with the Providência Acquisition.
In addition to executing on the identified acquisition synergies, we have recently implemented a robust business excellence program designed to generate annual productivity savings, achieve a low-cost position and prolong the useful life of our assets through product and process innovation. These initiatives have included continuous improvement programs focused on procurement, manufacturing, and distribution costs, facility consolidation and optimization, and optimization of our fixed cost structure. For example, in 2012, we restructured our global operations in order to consolidate our global footprint, align resources and capabilities with future growth opportunities, and provide a more efficient structure to serve existing customers. We believe we have the opportunity to continue to accelerate our annual productivity savings, which would serve to offset inflation in our business and benefit our margins.
Strong Free Cash Flow Generation
For the years ended December 29, 2012, December 28, 2013 and December 31, 2014, we have consistently generated strong free cash flow, which we define as Adjusted EBITDA minus capital expenditures, of $78.0 million, $155.8 million and $177.5 million, respectively. For the same periods, our net cash provided by operating activities was $75.5 million, $16.9 million and $49.1 million, respectively. Our strong cash flow generation has benefited from pass-through pricing mechanisms in many of our customer contracts, which allow us to pass through increases in certain raw material costs by changing our prices, thereby mitigating the potential impact of fluctuations in raw material costs on our profitability.
Our cash flow generation also benefits from our disciplined approach to capital investments. We believe our maintenance capital requirements (defined as investments required to maintain current production capabilities) range from 2.0% to 2.5% of our annual net sales, enabling us to deploy a meaningful portion of our capital investments toward projects designed to expand our capacity and/or capabilities or to reduce our operating costs. For instance, over the past five years, we have commercialized four new state-of-the-art spunmelt lines to expand our capacity to meet growing demand as well as realize their lower relative production cost per unit and their ability to produce lower basis weight products suited for certain hygiene applications. Additionally, we have invested in commercializing proprietary technologies, such as our Spinlace and Arium platforms, that provide differentiated product capability and cost performance. Our cash flow generation in the future may also benefit from our significant net operating losses, which were $284.1 million for the year ended December 31, 2014 and may result in reduced U.S. tax payments in the future.
Successful Track Record of Value-Enhancing Acquisitions
We have completed two significant acquisitions, Providência and Fiberweb, which enhanced our competitive position by expanding our capabilities in existing regions (like the US and Europe) and new regions (such as Brazil). These acquisitions also enhanced our technology positions in several new applications, such as filtration, where we believe there are significant growth opportunities. Additionally, given our scalable global infrastructure, we believe these acquisitions will result in meaningful cost savings and enhance our operating margins.
The Providência Acquisition was completed in June 2014 and strengthened our competitive position in North and South America. With three well-invested manufacturing facilities (two in Brazil and one in the United States) focused on hygiene applications, Providência’s operations were highly complementary with our existing operations. In particular, as a result of the acquisition, we are the largest producer of nonwovens in South
12
Table of Contents
America, with facilities in Brazil, Argentina and Colombia that enable us to cost-effectively serve customers across the continent. We have begun the integration of Providência into our existing regional operations and expect to generate meaningful cost savings from the elimination of duplicative costs, implementation of best practices, and by leveraging our enhanced scale.
The Fiberweb Acquisition was completed in November 2013. With operations in North America and Europe, Fiberweb improved our capabilities in several existing applications (such as hygiene and healthcare) but also meaningfully expanded our positions in several complementary applications, such as filtration, dryer sheets and house wrap. Fiberweb also provided access to several new technologies such as S-Tex (hygiene) and Nano fiber (filtration), which offer differentiated products to address our customers’ needs for innovation and customized solutions. Fiberweb has been fully integrated into our European and North American regions and we believe will generate significant cost savings, in excess of our initial estimates. As of December 31, 2014, we have fully implemented initiatives at Fiberweb accounting for approximately $39.2 million of annualized savings (above our initial estimates of $28 million).
Experienced Management Team
Our senior management team has extensive industry and operational experience and has been instrumental in developing and executing our growth strategy. Our nine person senior management team has an average of over 20 years of experience, including significant experience with specialty materials and similar businesses, and has successfully integrated numerous acquisitions. Our Chief Executive Officer, J. Joel Hackney Jr., who joined us in 2013 after holding a variety of senior executive roles with General Electric, Nortel and Avaya, has 21 years of relevant experience, including significant experience with leading global organizations and executing organic and acquisition-driven growth programs. Since mid-2012, we have successfully implemented an enhanced business strategy designed to significantly expand our business, both organically and through acquisitions, and to improve our cost structure and capital efficiency. We believe the proven abilities of our senior management team will allow us to continue to execute on our strategy, grow our global business, and deliver value to our stakeholders.
Our Strategy
Our mission is to provide superior products and services to enable our customers to create a safer, cleaner and healthier world. By leveraging our global team and broad portfolio of assets and technologies, we engineer customized solutions to meet our customers’ needs. We are focused on supplying consistent high quality products from our global manufacturing footprint, supported by knowledgeable local sales and technical service teams. We believe that our global presence and breadth of application expertise (further enhanced by the recent acquisitions of Fiberweb and Providência) provide a strong foundation for us to grow with our existing customers across the globe as well as for enhanced access to new customers across an array of highly specialized applications. As a result, we strive to grow our revenues consistent with the demand growth of the applications which we serve, while enhancing our operating efficiencies to improve our margins. To accomplish our mission and drive continued success, we are focused on the following strategies:
Support Continued Growth of Our Existing Customers Globally
We will invest to support the continued growth of our existing customers across the globe. As previously discussed, many of our customers’ products benefit from attractive growth trends and, consequently, our customers demand an increasing amount of our specialty materials. We will seek to enhance our competitive positions by providing cutting edge innovations, high quality and cost-effective products, and dedicated customer service. We will do so through initiatives to expand the production capacity of our current asset base as well as prudent capital investments to expand our capabilities. Many of our customers are increasingly growing their business globally, and we believe we are well positioned to gain share with these customers given our global presence and ability to reliably deliver consistent products across the globe.
13
Table of Contents
Further Strengthen our Positions in Emerging Markets
We intend to establish stronger positions in emerging markets through partnerships with new customers, as well as by accelerating growth with existing accounts where we are viewed as a strategic supplier. For example, the Providência Acquisition enhanced our position in South America, particularly Brazil, where we are now the leading supplier of hygiene products to a broad and long standing customer base. Additionally, in China, we have recently made significant capital investments in new production capacity designed to meet the growing demand for our products. In 2014, we generated 30% of our net sales and 32% of our Adjusted EBITDA in South America and Asia, respectively, on a pro forma basis. We believe there will be significant growth in our existing markets in South America and Asia. Additionally, in the future, we believe there may be growth opportunities in currently under-developed regions, where current penetration rates for many of the applications we serve are lower compared to other regions. As these emerging markets develop, we will continue to make careful, disciplined investments to expand our global capabilities and operations.
Pursue Growth in Complementary Businesses
We intend to use our industry expertise and capabilities to pursue growth opportunities in complementary products that share one or more key characteristics with our core businesses, including customers, products, manufacturing technologies or supply chain. We will prioritize opportunities in higher value applications with greater product differentiation, higher margins and lower capital intensity. For example, the Fiberweb Acquisition resulted in a significant improvement in our standing in several complementary applications, including filtration, dryer sheets and house wrap. By leveraging Fiberweb’s position and certain of our existing technologies and capabilities, we believe there may be opportunities to expand in these adjacent applications. We may pursue these opportunities organically or through targeted acquisitions depending on the specific industry dynamics and required capabilities.
Drive Business Excellence to Pursue Economic Leadership and Enhance Margins
Our success is dependent upon our ability to offer an attractive value proposition to our customers and to maximize customer satisfaction through our innovation, product quality and reliability. Consequently, we will seek to use our global platform and capabilities to offer solutions which maximize customers’ value and streamline their operations. We will also seek to improve our supply chain management to improve our cost position. We will seek to accelerate our business excellence initiatives to generate recurring annual productivity savings to offset inflation, enable reinvestment in growth, and improve our margins. These initiatives are focused on procurement savings, manufacturing yield optimization, lean initiatives, preventative maintenance and logistics savings. Over the past three years, we have increased our gross profit margin and Adjusted EBITDA margin from 15.5% and 11.8%, respectively, in 2011 on a stand alone basis to 17.9% and 13.0%, respectively, for the year ended December 31, 2014, on a pro forma basis. Through the realization of acquisition-related cost savings and our business excellence initiatives, we plan to continue to pursue improved cost positions and operating margins in the future.
Opportunistically Pursue Value-Enhancing Acquisitions
The nonwovens industry has experienced significant consolidation in recent years, including our acquisitions of Fiberweb and Providência. However, the industry remains relatively fragmented with many smaller regional players. In the future, we will continue to opportunistically evaluate potential acquisitions that enhance our business. We will prioritize transactions that complement our existing businesses, offer a potential for meaningful cost savings, enhance our capabilities in complementary products or regions or improve our growth profile by leveraging our existing customer relationships, technologies, global manufacturing and distribution network, and expertise in engineered materials.
14
Table of Contents
Develop and Attract Top Talent
We strive to attract and develop the best talent in the industry. We work as a team to make a positive impact to our organization, our customers and suppliers, and the community. We believe that our history of growth and innovation coupled with our strong global position will highlight the Company as an attractive career opportunity for talented business leaders. Over the past several years, we have redesigned our global organization structure and significantly enhanced the senior leadership team adding resources and capabilities in several key areas to address our strategic growth priorities.
Recent Acquisitions
We have recently completed two significant acquisitions. On June 11, 2014, Acquisition Co., our wholly-owned subsidiary, completed the acquisition of approximately 71.25% of the outstanding capital stock of Providência and on November 15, 2013, PGI Acquisition Limited, our indirect wholly-owned subsidiary, completed the acquisition of the entire issued ordinary share capital of Fiberweb. As required by Brazilian law, we intend to launch, subject to CVM approval, the Mandatory Tender Offer to acquire the remaining outstanding capital stock of Providência from the minority shareholders. See “Business—Expansion and Optimization—Providência Acquisition.”
Providência is a leading manufacturer of spunmelt nonwoven products based in Brazil, with a presence throughout the Americas, offering nonwoven fabrics under the KAMI brand. Its products are primarily used in hygienic and personal care applications, such as disposable diapers, sanitary pads, cleansing tissues and adult incontinence products. Providência operates state-of-the-art spunmelt technology, utilizing 13 Reicofil lines situated in three sites in North and South America. Providência was founded in 1963 and is based in São José dos Pinhais, Brazil. Following the completion of the Providência acquisition, Herminio Vicente Smania de Freitas joined PGI as President—South America & Global Hygiene. He continues to serve as chief executive officer of Providência.
The Providência Acquisition strengthened our competitive position in North and South America. With three well-invested manufacturing facilities (two in Brazil and one in the United States) focused on hygiene applications, Providência’s operations were highly complementary with our existing operations. In particular, as a result of the acquisition, we became the largest producer of nonwovens in South America, with facilities in Brazil, Argentina and Colombia that enable us to cost-effectively serve customers across the continent. We have begun the integration of Providência into our existing regional operations and expect to generate meaningful cost savings from the elimination of duplicative costs, implementation of best practices, and by leveraging our enhanced scale.
Fiberweb is one of the largest global manufacturers of specialized technical fabrics with eight production sites in six countries. Fiberweb creates specialty materials that are found in many critical applications, including hygiene and healthcare, as well as house wrap, filtration, dryer sheets, and several other specialized niche applications. In each area, Fiberweb helps its customers meet a range of technical challenges from precise filtration to reducing the energy demands of housing.
With operations in North America and Europe, Fiberweb improved our capabilities in several existing applications (such as hygiene and healthcare) but also meaningfully expanded our positions in several complementary applications, such as filtration, dryer sheets, and house wrap. Fiberweb also provided access to several new technologies such as S-Tex (hygiene) and Nano fiber (filtration), which offer differentiated products to address our customers’ needs for innovation and customized solutions. Fiberweb has been fully integrated into our European and North American regions and we believe will generate significant cost savings, in excess of our initial estimates. As of December 31, 2014, we have fully implemented initiatives at Fiberweb accounting for approximately $39.2 million of annualized savings (above our initial estimates of $28 million).
15
Table of Contents
Recent Developments
Dounor Acquisition
On March 25, 2015, we announced that PGI France Holdings SAS, our wholly-owned subsidiary, entered into an agreement to acquire Dounor SAS (“Dounor”), a French manufacturer of materials used in hygiene, healthcare and industrial applications. The acquisition of Dounor was completed on April 17, 2015 using the proceeds from borrowings under an incremental amendment (the “Second Incremental Amendment”) to the Company’s existing Term Loan Facility.
Term Loan Facility Amendment
On April 17, 2015, PGI Group entered into the Second Incremental Amendment. Pursuant to the Second Incremental Amendment, PGI Group obtained $283.0 million of commitments for incremental term loans (the “2015 Additional Term Loans”). A portion of the proceeds of the 2015 Additional Term Loans were used to fund the consideration due in respect of the previously announced acquisition of Dounor. The remaining proceeds are expected to be used to redeem $200.0 million outstanding principal amount of the PGI Group’s outstanding Senior Secured Notes, to pay related fees and expenses (including the redemption premium) and for general corporate purposes.
Redemption of Senior Secured Notes
On April 8, 2015, PGI Group issued a conditional notice of its election to redeem $200.0 million of the outstanding principal amount of its Senior Secured Notes. The Senior Secured Notes are expected to be redeemed on May 8, 2015 (the “Redemption Date”) at a redemption price of 103.875% of the principal amount thereof, plus accrued and unpaid interest on the Senior Secured Notes to, but excluding, the Redemption Date.
Risks Related to Our Business
Investing in our common stock involves substantial risks, and our ability to successfully operate our business and execute our growth plan is subject to numerous risks. Some of the more significant challenges and risks include the following:
| • | the specialized markets in which we sell our products are highly competitive and we may therefore have difficulty growing our business and maintaining profit margins; |
| • | we must continue to invest significant resources in developing innovative products in order to maintain a competitive edge in the highly specialized markets in which we operate; |
| • | increases in prices for raw materials and energy, as well as a reduction of our selling prices to customers could reduce our profit margins; |
| • | a material disruption at one of our manufacturing facilities could prevent us from meeting customer demand, reduce our sales or negatively affect our results of operation and financial condition; |
| • | we rely on a limited number of suppliers to provide raw materials, significant machinery and components used in our production facilities. A material interruption in supply or delivery could prevent or limit our ability to accept and fill orders for our products; |
| • | we generate most of our revenue from the sale of manufactured products that are used in a wide variety of consumer and industrial applications and the potential for product liability exposure could be significant; |
| • | goodwill and other identifiable intangible assets represent a significant portion of our total assets, and we may never realize the full value of our intangible assets; |
| • | our substantial indebtedness could adversely affect our financial condition and prevent us from fulfilling our obligations under our indebtedness; |
16
Table of Contents
| • | affiliates of our Sponsor control us and have the ability to elect all of the members of our Board of Directors; the Sponsor’s interests may conflict with ours or yours in the future; and |
| • | other factors set forth under “Risk Factors” in this prospectus. |
Corporate Information
PGI Specialty Materials, Inc. was incorporated under the laws of the State of Delaware in November 22, 2010. PGI Specialty Materials, Inc.’s only material asset is the equity of Holdings, sole equityholder of PGI Group, through which we conduct our operations. Our principal executive office is located at 9335 Harris Corners Parkway, Suite 300, Charlotte, North Carolina. Our telephone number is (704) 697-5100.
Our Sponsor
Blackstone (NYSE: BX) is one of the world’s leading investment firms. Blackstone’s asset management businesses, with approximately $310 billion in assets under management as of March 31, 2015, include investment vehicles focused on private equity, real estate, public debt and equity, non-investment grade credit, real assets and secondary funds, all on a global basis. Blackstone also provides various financial advisory services, including financial and strategic advisory, restructuring and reorganization advisory and fund placement services.
Immediately after the offering of our common stock, affiliates of Blackstone will beneficially own approximately % of our common stock or approximately % if the underwriters exercise in full their option to purchase additional shares.
17
Table of Contents
| Common stock offered by us |
shares. |
| Option to purchase additional shares |
The underwriters have an option to purchase up to additional shares of our common stock from us. The underwriters can exercise this option at any time within 30 days from the date of this prospectus. |
| Common stock outstanding after giving effect to this offering |
shares ( shares if the underwriters exercise their option to purchase additional shares in full). |
| Use of proceeds |
We estimate that the net proceeds to us from this offering, after deducting estimated underwriting discounts and estimated offering expenses payable by us, will be approximately $ , based on an assumed initial public offering price of $ per share, which is the midpoint of the price range set forth on the cover page of this prospectus. |
| We intend to use the net proceeds from this offering to redeem $ aggregate principal amount of the Senior Secured Notes and to pay a $ million one-time Advisory Agreement termination fee to our Sponsor, with any remaining balance to be used for general corporate purposes. See “Use of Proceeds.” |
| Dividend policy |
We have no current plans to pay dividends on our common stock. Any decision to declare and pay dividends in the future will be made at the sole discretion of our Board of Directors and will depend on, among other things, our results of operations, cash requirements, financial condition, contractual restrictions in the agreements governing our indebtedness and other obligations, and other factors that our Board of Directors may deem relevant. |
| Risk factors |
See “Risk Factors” for a discussion of risks you should carefully consider before deciding to invest in our common stock. |
| Proposed NYSE trading symbol |
“ ” |
The number of shares of our common stock to be outstanding immediately after the consummation of this offering is based on shares of common stock outstanding as of , and excludes:
| • | shares of common stock issuable upon the exercise of options to purchase shares outstanding as of , at a weighted average exercise of $ per share; |
| • | shares of common stock issuable pursuant to restricted stock units as of , ; and |
| • | shares of common stock reserved for future issuance following this offering under our equity plans. |
18
Table of Contents
Unless we indicate otherwise or the context otherwise requires, all information in this prospectus:
| • | assumes (1) no exercise of the underwriters’ option to purchase additional shares and (2) an initial public offering price of $ per share, which is the mid-point of the range set forth on the cover page of this prospectus; |
| • | reflects a for one stock split of our common stock, to be effected prior to the consummation of this offering; and |
| • | assumes the filing and effectiveness of our amended and restated certificate of incorporation immediately prior to the consummation of this offering. |
19
Table of Contents
SUMMARY HISTORICAL AND PRO FORMA CONDENSED COMBINED
FINANCIAL INFORMATION
The following summary historical and pro forma condensed combined financial information and other data set forth below should be read in conjunction with “Summary—Recent Acquisitions,” “Basis of Presentation,” “Unaudited Pro Forma Condensed Combined Financial Information” and the historical financial statements of the Company, Providência and Fiberweb, including the related notes, included elsewhere in this prospectus.
The summary historical financial information presented below as of and for the fiscal years ended December 31, 2014, December 28, 2013 and December 29, 2012 has been derived from our audited consolidated financial statements included elsewhere in this prospectus. The summary historical financial information presented below is not necessarily indicative of the results to be expected for any future period.
The summary unaudited pro forma condensed combined financial information presented below is based upon the historical consolidated financial statements of the Company and Providência and has been prepared to illustrate the effects of the Providência Acquisition and the Providência Refinancing (collectively, the “Transactions”) as well as the effects of the completion of this offering and the use of proceeds therefrom, after deducting estimated underwriting discounts and estimated offering expenses payable by us (the “Offering”). The summary unaudited pro forma condensed combined statements of operations data for the fiscal year ended December 31, 2014 has been prepared to give pro forma effect to the Transactions and the Offering as if they had occurred on December 29, 2013.
The summary unaudited pro forma condensed combined financial information includes only adjustments that are directly attributable to the Transactions and the Offering, factually supportable and with respect to the statements of operations, expected to have a continuing impact on the combined results. The Providência Acquisition has been accounted for using the acquisition method of accounting in accordance with Financial Accounting Standards Board (“FASB”) Accounting Standard Codification (“ASC”) Topic 805, Business Combinations (“ASC 805”). ASC 805 requires, among other things, that the assets acquired and liabilities assumed be recognized at their acquisition date fair values, with any excess of the consideration transferred over the estimated fair values of the identifiable net assets acquired recorded as goodwill. The estimated fair values of Providência assets acquired, liabilities assumed and resulting goodwill are subject to adjustment as the Company finalizes its fair value analysis. The Company has not completed the detailed valuation work necessary to arrive at the required estimates of the fair value of Providência net assets and related allocation of purchase price. The Company is still waiting for additional information to finalize the valuation of its acquired intangible assets and property, plant and equipment as well as the accounting for certain tax matters. The Company expects to complete its final purchase price allocation during the second quarter of 2015. Upon completion of detailed valuation studies and the final determination of fair value, the Company may make additional adjustments to the fair value allocation, which may differ significantly from the valuations set forth in the unaudited pro forma condensed combined financial information.
20
Table of Contents
The summary unaudited pro forma condensed combined financial information has been presented for informational purposes only and is not necessarily indicative of what the combined company’s results of operations actually would have been had the Transactions and the Offering, as applicable, been completed as of the dates indicated, nor is it necessarily indicative of future operating results of the combined company. As a result, the summary pro forma condensed combined statements of operations have not been adjusted to reflect future events that may have occurred since the date of acquisition and/or are expected to occur after the Transactions and the Offering, including, but not limited to, the anticipated realization of ongoing savings from operating synergies and certain one-time charges we expect to incur in connection with the Providência Acquisition, including but not limited to, costs in connection with the integration of the operations of the Company and Providência.
| (in thousands, except for per share data) | Pro Forma Fiscal Year Ended December 31, 2014 |
Fiscal Year Ended December 31, 2014 |
Fiscal Year Ended December 28, 2013 |
Fiscal Year Ended December 29, 2012 |
||||||||||||
| (unaudited) | ||||||||||||||||
| Statement of Operations Data: |
||||||||||||||||
| Net sales |
$ | 2,005,678 | $ | 1,859,914 | $ | 1,214,862 | $ | 1,155,163 | ||||||||
| Cost of goods sold |
(1,649,134 | ) | (1,526,406 | ) | (1,018,806 | ) | (957,917 | ) | ||||||||
|
|
|
|
|
|
|
|
|
|||||||||
| Gross profit |
356,544 | 333,508 | 196,056 | 197,246 | ||||||||||||
| Selling, general and administrative expenses |
(280,490 | ) | (254,280 | ) | (153,188 | ) | (140,776 | ) | ||||||||
| Special charges, net |
(40,633 | ) | (59,185 | ) | (33,188 | ) | (19,592 | ) | ||||||||
| Other operating, net |
(3,346 | ) | (1,845 | ) | (2,512 | ) | 287 | |||||||||
|
|
|
|
|
|
|
|
|
|||||||||
| Operating income (loss) |
32,075 | 18,198 | 7,168 | 37,165 | ||||||||||||
| Other income (expense): |
||||||||||||||||
| Interest expense |
(111,177 | ) | (96,153 | ) | (55,974 | ) | (50,414 | ) | ||||||||
| Debt modification and extinguishment costs |
(2,587 | ) | (15,725 | ) | (3,334 | ) | — | |||||||||
| Foreign currency and other, net |
(43,004 | ) | (27,083 | ) | (8,851 | ) | (5,134 | ) | ||||||||
|
|
|
|
|
|
|
|
|
|||||||||
| Income (loss) before income taxes |
(124,693 | ) | (120,763 | ) | (60,991 | ) | (18,383 | ) | ||||||||
| Income tax (provision) benefit |
(5,400 | ) | 1,523 | 36,024 | (7,655 | ) | ||||||||||
|
|
|
|
|
|
|
|
|
|||||||||
| Net income (loss) |
(130,093 | ) | (119,240 | ) | (24,967 | ) | (26,038 | ) | ||||||||
| Less: Earnings attributable to noncontrolling interest and redeemable noncontrolling interest |
(9,573 | ) | (3,943 | ) | (34 | ) | — | |||||||||
| Net income (loss) attributable to PGI Specialty Materials, Inc. |
$ | (120,520 | ) | $ | (115,297 | ) | $ | (24,933 | ) | $ | (26,038 | ) | ||||
|
|
|
|
|
|
|
|
|
|||||||||
| Per Share Data: |
||||||||||||||||
| Basic and diluted loss per share |
$ | (467.89 | ) | $ | (94.09 | ) | $ | (99.99 | ) | |||||||
|
|
|
|
|
|
|
|||||||||||
21
Table of Contents
| As of | ||||||||||||||||
| (in thousands) | December 31, 2014 (as Adjusted)(2) |
December 31, 2014 |
December 28, 2013 |
December 29, 2012 |
||||||||||||
| (unaudited) | ||||||||||||||||
| Balance Sheet Data: |
||||||||||||||||
| Cash and cash equivalents |
$ | $ | 178,491 | $ | 86,064 | $ | 97,879 | |||||||||
| Operating working capital(1) |
$ | $ | 100,115 | $ | 43,170 | $ | 29,628 | |||||||||
| Total assets |
$ | $ | 2,035,173 | $ | 1,464,520 | $ | 1,022,069 | |||||||||
| Short-term borrowings and long-term debt, including current portion |
$ | $ | 1,482,840 | $ | 896,668 | $ | 599,689 | |||||||||
| Redeemable noncontrolling interest |
$ | $ | 89,181 | $ | — | $ | — | |||||||||
| Total PGI Specialty Materials, Inc. shareholders’ equity |
$ | $ | (24,355 | ) | $ | 158,896 | $ | 139,202 | ||||||||
| (1) | Operating working capital is defined as accounts receivable plus inventories less trade accounts payable and accrued liabilities. |
| (2) | As adjusted to reflect this Offering. |
| (in thousands) | Fiscal Year Ended December 31, 2014 |
Fiscal Year Ended December 28, 2013 |
Fiscal Year Ended December 29, 2012 |
|||||||||
| Statement of Cash Flows Data: |
||||||||||||
| Net cash provided by (used in) operating activities |
$ | 49,148 | $ | 16,850 | $ | 75,471 | ||||||
| Net cash (used in) investing activities |
(436,682 | ) | (337,759 | ) | (50,233 | ) | ||||||
| Net cash provided by (used in) financing activities |
487,376 | 308,190 | (42 | ) | ||||||||
| (in thousands) (unaudited) |
Pro
Forma Fiscal Year Ended December 31, 2014 |
Fiscal Year Ended December 31, 2014 |
Fiscal Year Ended December 28, 2013 |
Fiscal Year Ended December 29, 2012 |
||||||||||||
| Other Financial Data: |
||||||||||||||||
| Adjusted EBITDA(1) |
$ | 259,977 | $ | 259,977 | $ | 210,411 | $ | 129,671 | ||||||||
| Depreciation and amortization(2) |
123,768 | 112,557 | 71,497 | 64,041 | ||||||||||||
| Total capital expenditures(3) |
89,488 | 82,457 | 54,642 | 51,625 | ||||||||||||
| (1) | Our management uses Adjusted EBITDA, defined as net income (loss) before interest expense (net of interest income), income and franchise taxes and depreciation and amortization, further adjusted to exclude certain other items permitted in calculating covenant compliance under our credit agreements and the indentures governing our Senior Secured Notes and Senior Unsecured Notes. Under our credit agreements and indentures governing our Senior Secured Notes and our Senior Unsecured Notes, our ability to engage in certain activities such as incurring certain additional indebtedness, making certain investments, and making restricted payments is tied to ratios based on Adjusted EBITDA. In addition, targets based on Adjusted EBITDA are among the measures we use to evaluate our management’s performance for purposes of determining their compensation under our incentive plans as further described under “Management—Executive Compensation.” |
Pro forma Adjusted EBITDA incorporates the adjustments described above and also gives pro forma effect to the Transactions and the Offering as if they had occurred on December 29, 2013. We present pro forma Adjusted EBITDA, in addition to Adjusted EBITDA, to provide a more complete understanding of our results of operations that gives effect to the Transactions and the Offering. The pro forma financial information we present is based on estimates and assumptions regarding the Transactions and Offering and our actual results may differ materially from such assumptions and estimates.
Adjusted EBITDA and pro forma Adjusted EBITDA are not recognized terms under GAAP, should not be considered in isolation or as a substitute for a measure of our liquidity or performance prepared in accordance with GAAP and are not indicative of income from operations or pro forma income of operations as determined under GAAP. Adjusted EBITDA, pro forma Adjusted EBITDA and other non-GAAP financial measures have important limitations which should be considered before using these measures to evaluate the Company’s liquidity or financial performance. Adjusted EBITDA and pro forma Adjusted EBITDA eliminate the effect of non-cash depreciation of tangible assets and amortization of intangible assets, much of which results from acquisitions accounted for under the purchase method of accounting. Adjusted EBITDA and pro forma Adjusted EBITDA also eliminate the effects of interest rates and changes in capitalization which management believes may not necessarily be indicative of a company’s underlying operating performance. Adjusted EBITDA and pro forma Adjusted EBITDA, as presented by us, may not be comparable to similarly titled measures of other companies due to varying methods of calculation. We believe that Adjusted EBITDA and pro forma Adjusted EBITDA provide useful information about flexibility under our covenants to investors, lenders, financial analysts and rating agencies since these groups have historically used EBITDA-related measures in our industry, along with other measures, to estimate the value of a company, to make informed investment decisions, and to evaluate a company’s ability to meet its debt service requirements. Adjusted EBITDA and pro forma Adjusted EBITDA should be read in conjunction with “Unaudited Pro Forma
22
Table of Contents
Condensed Combined Financial Information” and “Management’s Discussion and Analysis of Financial Condition and Results of Operations” sections of this prospectus.
| (2) | Depreciation and amortization excludes the amortization of loan acquisition costs that is included in interest expense. Pro forma depreciation and amortization for the fiscal year ended December 31, 2014 includes Providência results for the pre-acquisition period from January 1, 2014 through June 10, 2014. |
| (3) | Total capital expenditures for the Issuer represent purchases of property, plant and equipment included within the Statement of Cash Flow. Pro forma total capital expenditures for the fiscal year ended December 31, 2014 include capital expenditures of Providência for the pre-acquisition period from January 1, 2014 through June 10, 2014. |
We believe that the most directly comparable GAAP measure to Adjusted EBITDA is net income (loss). The following table reconciles net income (loss) to Adjusted EBITDA for the periods presented:
| (in thousands) (unaudited) |
Fiscal Year Ended December 31, 2014 |
Fiscal Year Ended December 28, 2013 |
Fiscal Year Ended December 29, 2012 |
|||||||||
| Net income (loss) attributable to PGI Specialty Materials, Inc. |
$ | (115,297 | ) | $ | (24,933 | ) | $ | (26,038 | ) | |||
| Net income (loss) attributable to noncontrolling interest and redeemable noncontrolling interest |
(3,943 | ) | (34 | ) | — | |||||||
| Interest expense |
96,153 | 55,974 | 50,414 | |||||||||
| Income and franchise tax |
(297 | ) | (35,658 | ) | 8,025 | |||||||
| Depreciation and amortization(a) |
112,557 | 71,497 | 64,041 | |||||||||
| Purchase accounting adjustments(b) |
6,976 | 7,288 | 936 | |||||||||
| Non-cash compensation(c) |
1,931 | 4,329 | 842 | |||||||||
| Special charges, net(d) |
59,185 | 33,188 | 19,592 | |||||||||
| Foreign currency and other non-operating, net(e) |
32,531 | 11,689 | 4,982 | |||||||||
| Loss on debt modification |
15,725 | 3,334 | — | |||||||||
| Severance and relocation expenses(f) |
3,542 | 4,943 | 1,657 | |||||||||
| Business optimization expenses(g) |
1,263 | 319 | 979 | |||||||||
| Management, monitoring and advisory fees(h) |
5,546 | 3,855 | 3,361 | |||||||||
| Other(i) |
2,899 | 958 | 880 | |||||||||
|
|
|
|
|
|
|
|||||||
| Adjusted EBITDA before contribution from acquisitions and contribution from estimated synergies |
$ | 218,771 | $ | 136,749 | $ | 129,671 | ||||||
| Contribution from acquisitions(j) |
13,366 | 37,946 | — | |||||||||
| Contribution from estimated synergies(k) |
27,840 | 35,716 | — | |||||||||
|
|
|
|
|
|
|
|||||||
| Adjusted EBITDA |
$ | 259,977 | $ | 210,411 | $ | 129,671 | ||||||
|
|
|
|
|
|
|
|||||||
| (a) | Excludes amortization of loan acquisition costs that are included in interest expense. |
| (b) | Reflects fair market value adjustments as a result of purchase accounting associated with acquisitions, primarily related to the step-up in inventory value and its amortization into earnings over the period of the acquired company’s normal inventory turns. |
| (c) | Reflects non-cash compensation costs related to employee and director restricted stock, restricted stock units and stock options. |
| (d) | Reflects costs associated with non-cash asset impairment charges, the restructuring and realignment of manufacturing operations and management organizational structures, pursuit of certain transaction opportunities, including expenses related to the Fiberweb and Providência acquisitions as well as the Merger, and other charges included in Special charges, net in our Consolidated Statement of Operations. |
| (e) | Reflects (gains) losses from foreign currency translation of intercompany loans, unrealized (gains) losses on interest rate and foreign currency hedging transactions, (gains) losses on sales of assets outside the ordinary course of business, factoring costs and certain other non-operating (gains) losses recorded in Foreign Currency and Other, net above as well as (gains) losses from foreign currency transactions recorded in Other Operating, net above. |
23
Table of Contents
| (f) | Reflects severance and relocation expenses not included under Special charges, net as well as costs incurred with the CEO transition in 2013. |
| (g) | Reflects costs incurred to improve IT and accounting functions, costs associated with establishing new facilities and certain other expenses. |
| (h) | Reflects management, monitoring and advisory fees paid under the Sponsor management agreement. We intend to terminate the Advisory Agreement in connection with this offering. See “Certain Relationships and Related Party Transactions—Advisory Agreement.” |
| (i) | Reflects charges such as gain/loss on disposals, start-up costs and other add-backs permitted under our debt agreements. |
| (j) | Pursuant to the indentures governing our Senior Secured Notes and our Senior Unsecured Notes and the credit agreements governing our Term Loans and our ABL Facility, we are permitted to include in our Adjusted EBITDA calculation the Adjusted EBITDA contributions from acquisitions for the portion of the fiscal year prior to the closing of the acquisition. The fiscal year ended December 28, 2013 reflects Adjusted EBITDA contributions of the Fiberweb Acquisition for the period from January 1, 2013 through November 15, 2013. The fiscal year ended December 31, 2014 reflects Adjusted EBITDA contributions of the Providência Acquisition for the period from January 1, 2014 through June 11, 2014. |
| (k) | Pursuant to the indentures governing our Senior Secured Notes and our Senior Unsecured Notes and the credit agreements governing our Term Loans and our ABL Facility, we are permitted to include in our calculation of Adjusted EBITDA contributions from estimated synergies resulting from acquisitions (subject to certain limitations). The adjustment represents management’s estimate of synergies expected to be realized within 12 months following the applicable acquisitions. The fiscal year ended December 28, 2013 includes the Adjusted EBITDA contribution from estimated synergies from the Fiberweb Acquisition. The fiscal year ended December 31, 2014 includes the Adjusted EBITDA contribution from estimated synergies from the Providência Acquisition. |
The credit agreement governing our Term Loans limits the amount of estimated synergies included in the calculation of Adjusted EBITDA for any consecutive four quarter period to 20% of Adjusted EBITDA, while the indenture governing our Senior Secured Notes and the credit agreement governing our ABL Facility limits such amount to the greater of $20 million or 10% of Adjusted EBITDA. The indenture governing our Senior Unsecured Notes does not include such limitation. Accordingly, Adjusted EBITDA for the fiscal year ended December 31, 2014 and December 28, 2013 presented in the table above includes $1.8 million and $14.7 million, respectively, of estimated synergies that exceed the limitations in our Senior Secured Notes and ABL Facility. Therefore, we are not permitted to include that portion of estimated synergies in Adjusted EBITDA for purposes of determining our compliance with certain covenants in the Senior Secured Notes and ABL Facility. The limitation under the credit agreement governing the Term Loans has not been reached for the amount of synergies presented in the table above.
We present these synergy adjustments as they are permitted under the terms of our debt instruments, but you should not view these adjustments as a projection of future results. Our ability to realize these anticipated synergies is subject to significant uncertainties and you should not place undue reliance on the adjustments.
24
Table of Contents
The following table reconciles pro forma net income (loss) to pro forma Adjusted EBITDA for the fiscal year ended December 31, 2014:
| (in thousands) (unaudited) |
Pro Forma Fiscal Year Ended December 31, 2014 |
|||
| Net income (loss) attributable to PGI Specialty Materials, Inc.(a) |
$ | (120,520 | ) | |
| Net income (loss) attributable to noncontrolling interest and redeemable noncontrolling interest |
(9,573 | ) | ||
| Interest expense |
111,177 | |||
| Income and franchise tax |
6,626 | |||
| Depreciation and amortization(b) |
123,768 | |||
| Purchase accounting adjustments(c) |
6,976 | |||
| Non-cash compensation(d) |
2,053 | |||
| Special charges, net(e) |
40,633 | |||
| Foreign currency and other non-operating, net(f) |
49,552 | |||
| Loss on debt modification |
2,587 | |||
| Severance and relocation expenses(g) |
3,547 | |||
| Business optimization expenses(h) |
1,625 | |||
| Management, monitoring and advisory fees(i) |
5,546 | |||
| Other(j) |
8,140 | |||
|
|
|
|||
| Pro forma Adjusted EBITDA before contribution from estimated synergies |
$ | 232,137 | ||
|
|
|
|||
| Contribution from estimated synergies(k) |
27,840 | |||
|
|
|
|||
| Pro forma Adjusted EBITDA |
$ | 259,977 | ||
|
|
|
|||
| (a) | Refer to “Unaudited Pro Forma Condensed Combined Financial Information”, included elsewhere in this prospectus, for more information related to pro forma net income (loss). |
| (b) | Excludes amortization of loan acquisition costs that are included in interest expense. |
| (c) | Reflects fair market value adjustments as a result of purchase accounting associated with acquisitions primarily related to the step up in inventory value and its amortization into earnings over the period of the acquired company’s normal inventory terms. |
| (d) | Reflects non-cash compensation costs related to employee and director restricted stock, restricted stock units and stock options. |
| (e) | Reflects costs associated with non-cash asset impairment charges, the restructuring and realignment of manufacturing operations and management organizational structures, pursuit of certain transaction opportunities, including expenses related to the Fiberweb and Providência acquisitions, and other charges included in Special charges, net in our consolidated statement of operations. |
| (f) | Reflects (gains) losses from foreign currency translation of intercompany loans, unrealized (gains) losses on interest rate and foreign currency hedging transactions, (gains) losses on sales of assets outside the ordinary course of business, factoring costs and certain other non-operating (gains) losses recorded in Foreign Currency and Other, net above as well as (gains) losses from foreign currency transactions recorded in Other Operating, net above. |
| (g) | Reflects severance and relocation expenses not included under Special charges, net. |
| (h) | Reflects costs incurred to improve IT and accounting functions, costs associated with establishing new facilities and certain other expenses. |
| (i) | Reflects management, monitoring and advisory fees paid under the Sponsor management agreement. We intend to terminate the Advisory Agreement in connection with this offering. See “Certain Relationships and Related Party Transactions—Advisory Agreement.” |
| (j) | Reflects charges such as gain/loss on disposals and start-up costs. |
25
Table of Contents
| (k) | Pursuant to the indentures governing our Senior Secured Notes and our Senior Unsecured Notes and the credit agreements governing our Term Loans and our ABL Facility, we are permitted to include in our calculation of pro forma Adjusted EBITDA contributions from estimated synergies resulting from acquisitions (subject to certain limitations described below). The adjustment represents management’s estimate of synergies expected to be realized within the next 12 months. The fiscal year ended December 31, 2014 includes a pro forma Adjusted EBITDA contribution of $27.8 million from the Fiberweb and Providência acquisitions (of which $8.9 million represents the portion attributable to Fiberweb and $18.9 million represents the portion attributable to Providência). |
The credit agreement governing our Term Loans limits the amount of estimated synergies included in the calculation of pro forma Adjusted EBITDA for any consecutive four quarter period to 20% of pro forma Adjusted EBITDA, while the indenture governing our Senior Secured Notes and the credit agreement governing our ABL Facility limit such amount to the greater of $20 million or 10% of pro forma Adjusted EBITDA. The indenture governing our Senior Unsecured Notes does not include such limitation. Accordingly, pro forma Adjusted EBITDA for the fiscal year ended December 31, 2014 includes approximately $1.8 million of estimated synergies that exceed the limitations in our Senior Secured Notes and ABL Facility. Therefore, we are not permitted to include that portion of estimated synergies in pro forma Adjusted EBITDA for purposes of determining our compliance with certain covenants in the Senior Secured Notes, and ABL Facility. The limitation under the credit agreement governing the Term Loans has not been reached for the amount of synergies presented in the table above.
We present these synergy adjustments as they are permitted under the terms of our debt instruments, but you should not view these adjustments as a projection of future results. Our ability to realize these anticipated synergies is subject to significant uncertainties and you should not place undue reliance on the adjustments.
26
Table of Contents
Investing in our common stock involves a high degree of risk. You should consider carefully the risks and uncertainties described below and the other information contained in this prospectus, including our consolidated financial statements and the related notes, before you decide whether to purchase our common stock.
Risks Related To Our Business
The specialized markets in which we sell our products are highly competitive, as a result we may have difficulty growing our business and maintaining profit margins.
The markets for our products are highly competitive. The primary competitive factors include product innovation and performance, quality, service, cost, distribution and technical support. In addition, we compete against a number of competitors in each of our markets. Some of these competitors are larger companies that have greater financial, technological, manufacturing and marketing resources than we do. A reduction in overall demand, a significant increase in manufacturing capacity in excess of demand or increased costs to design and produce our products would likely further increase competition and that increased competition could lead to reduced sales or cause us to reduce our prices, which could lower our profit margins and impair our ability to grow.
The global nonwovens market has historically experienced stable growth. However, beginning in late 2010, several of our competitors, primarily in the hygiene markets, installed or announced an intent to install capacity in excess of what we believe to be then current market demand. Consequently, as this manufacturing capacity entered into commercial production, the short-term to mid-term excess supply created unfavorable market dynamics, resulting in a downward pressure on selling prices. In recent years, we believe growing demand has filled a portion of this excess capacity and we have observed fewer new capacity expansions, leading to improving capacity utilization in our view.
Increases in prices for raw materials and energy could reduce our profit margins.
The primary raw materials used to manufacture most of our products are polypropylene resins (accounting for approximately 75% of raw materials costs historically), polyester fiber, polyethylene resin and, to a lesser extent, rayon and tissue paper. In addition, energy-related costs are a significant expense for us (both directly and as inputs to our primary raw materials). The prices of raw materials and energy can be volatile and are susceptible to rapid and substantial changes due to factors beyond our control such as changing economic conditions, currency fluctuations, political unrest and instability in energy-producing nations, and supply and demand considerations. To the extent that we are able to pass along raw material price increases to some of our customers, there is often a delay between the time we are required to pay the increased raw material price and the time we are able to pass the increase on to our customers. To the extent we are not able to pass along all or a portion of such increased prices of raw materials, our cost of goods sold would increase and our operating income and margins would correspondingly decrease. There can be no assurance that the prices of raw materials and energy will not increase in the future or that we will be able to pass on any increases to our customers. In addition, volatility in the prices for raw materials could make it more difficult for us to pass along all or a portion of any increase to our customers. Material increases in raw material and energy prices that cannot be passed on to customers could have a material adverse effect on our profit margins, results of operations and financial condition.
The industries that we serve are subject to the overall economic environment and demand for end-use products.
Our net sales are affected by general economic conditions, and the development of demand for and prices of end-use products in the industries that we serve. Geographically, general economic conditions constitute important factors affecting the demand for our products. Our results may also be affected by the cyclicality of the end-uses applications and industries we serve, although these cycles vary across industries and geographic
27
Table of Contents
regions. Demand for and prices of our products have fluctuated during the past years as demand by end-users and intermediate converters has changed. A substantial decline in general economic conditions combined with a consequent decline in the prices and/or demand for our products could have an adverse effect on our business, results of operations or financial condition.
The loss of any of our large volume customers could significantly reduce our revenues and profits.
A significant amount of our products are sold to large volume customers. We have one major customer, Procter & Gamble, that accounts for over approximately 12% of our business and our 20 largest customers represented approximately 51% of our sales in 2014. We also do not have any long-term volume commitments with our customers and, as a result, the amount, and prices at which, our customers purchase from us may vary across periods. As a result, a decrease in business from, or the loss of any large volume customers, could materially reduce our product sales, lower our profits and impair our financial condition.
Our international operations pose risks to our business that may not be present with our domestic operations.
Our manufacturing facilities in the United States accounted for approximately 33% of net sales for 2014, with facilities in Mexico, Canada, Europe, Asia and South America accounting for approximately 67% of net sales for the same period. As a result of the Providência Acquisition, we have further strengthened our presence in South America and we expect a proportionate increase to our net sales in that region. As part of our growth strategy, we have expanded, and may continue to expand operations in foreign countries where we have an existing presence or enter new foreign markets and expect to increase sales of products as disposable income increases in developing markets. Our foreign operations are, and any future foreign operations will be, subject to certain risks that are unique to doing business in foreign countries. These risks include fluctuations in foreign currency exchange rates, inflation, economic or political instability, shipping delays in both our products and receiving delays of raw materials, changes in applicable laws, including assessments of income and non-income related taxes, reduced protection of intellectual property and regulatory policies and various trade restrictions including potential changes to export taxes or countervailing and anti-dumping duties for exported products from these countries. Any of these risks could have a negative impact on our ability to deliver products to customers on a competitive and timely basis. This could reduce or impair our net sales, profits, cash flows and financial position. We have not historically hedged our exposure to foreign currency risk except for risk associated with certain capital spending projects or acquisitions.
We may not realize certain productivity enhancements or improvements in costs.
As part of our business strategy, we must continuously identify opportunities to improve profitability by reducing costs and enhancing productivity to improve our results. Any cost savings or productivity enhancements that we realize from such efforts may differ materially from our estimates. We cannot assure you that these initiatives will be completed as anticipated or that the benefits we expect will be achieved on a timely basis or if they will be achieved at all. If we are unable to reduce costs or improve productivity, our competitive position and profitability could be adversely affected.
We have experienced losses in the past, and we may experience similar losses in the future.
For each of the fiscal years ended December 31, 2014, December 28, 2013 and December 29, 2012 we experienced net losses. Please see the section under “Management’s Discussion and Analysis of Financial Condition and Results of Operations” and our consolidated financial statements and the notes thereto included elsewhere in this prospectus for a discussion of our operational history and the factors accounting for such losses. We cannot assure you that in the future we will be profitable.
We generate most of our revenue from the sale of manufactured products that are used in a wide variety of consumer and industrial applications and the potential for product liability exposure could be significant.
We manufacture a wide variety of products that are used in consumer and industrial applications, such as disposable diapers, baby wipes, surgical gowns, wound dressings, carpet backing and industrial packaging. As a
28
Table of Contents
result, we may face exposure to product liability claims in the event that the failure of our products results, or is alleged to result, in property damage, bodily injury and/or death. In addition, if any of our products are, or are alleged to be, defective, we may be required to make warranty payments or to participate in a recall of those products.
The future costs associated with defending product liability claims or responding to product warranty claims could be material and we may experience significant losses in the future as a result. A successful product liability claim brought against us in excess of available insurance coverage or a requirement to participate in any product recall could substantially reduce our profitability and cash generated from operations.
Reductions in our selling prices to customers could reduce our profit margins.
In cases where changes in our selling prices to customers are determined via contract based on changes in an underlying raw material price index, such as the index for polypropylene, and the index decreases, sales would decrease and our operating income would correspondingly decrease if we are not able to obtain corresponding reductions in our raw material costs. Such decreases in operating income could be material. There can be no assurance that the index used in such contracts will not decrease in the future or that we will be able to obtain corresponding reductions in our raw material costs. Additionally, unfavorable competitive dynamics could cause us to lower our selling prices without a change in raw material cost.
Delay in the procurement of raw materials could reduce our revenues and profits.
In certain regions of the world, we may source certain key raw materials from a limited number of suppliers or on a sole source basis. To the extent that we cannot procure our raw material requirements from a local country supplier, we seek to import raw materials from outside refiners. The loss of any of our key suppliers or the delay in the import of raw materials could, in the short-term, adversely affect our business until alternative supply arrangements are secured and the respective suppliers are qualified with our customers, or until importation delays of raw material are resolved. Accordingly, a delay in the procurement of raw materials could reduce product sales, lower our profits and impair our financial condition.
A material disruption at one of our manufacturing facilities could prevent us from meeting customer demand, reduce our sales or negatively affect our results of operation and financial condition.
Any of our manufacturing facilities, or any of our machines or equipment within an otherwise operational facility, could cease operations unexpectedly due to a number of events, including:
| • | unscheduled maintenance outages; |
| • | prolonged power failures; |
| • | an equipment failure; |
| • | a chemical spill or release; |
| • | labor difficulties; |
| • | disruptions in transportation infrastructure, including roads, bridges, railroad tracks and tunnels; |
| • | fires, floods, windstorms, earthquakes, hurricanes or other catastrophes; |
| • | terrorism or threats of terrorism; |
| • | governmental regulations; and |
| • | other operational problems. |
For example, on May 15, 2014, Providência announced that production on three of its spunmelt lines at its São José dos Pinhais facility had been partially interrupted. The interruption was the result of an order by the
29
Table of Contents
Brazilian Ministry of Labor, pending remedial action by Providência to bring the facility into compliance with applicable Brazilian workplace safety regulations. The shutdown impacted sales volumes in excess of 6,500 metric tons of nonwovens during the 2014 fiscal year. Any such future disruption could prevent us from meeting customer orders, reduce our sales or profits and negatively affect our results of operations and financial condition.
We must continue to invest significant resources in developing innovative products in order to maintain a competitive edge in the highly specialized markets in which we operate.
Our continued success depends, in part, upon our ability to maintain our technological capabilities and to continue to identify, develop and commercialize innovative products for the nonwoven and oriented polymer industries. We must also protect the intellectual property rights underlying our new products to realize the full benefits of our efforts. If we fail to continue to develop products or to keep pace with technological developments by our competitors, we may lose market share, reduce product sales and lower our margins, which would impair our results of operations and financial condition.
We may not be able to utilize our production capacity efficiently due to variability in customer demand or unexpected events.
Our ability to utilize our production capacity efficiently may be affected by variability in customer demand or interruptions in production. We have a relatively versatile production base with 22 production facilities worldwide, which facilitates effective use of capacity by, for example, allowing for the redirection of resources to reflect changes in demand. Any interruption in production at our production sites, whether due to lack of orders, labor action, environmental incidents, breakdown of major production machines, fire, accidents or other factors, has the potential to affect adversely our ability to meet production goals for the year and result in lost business opportunities in the future. Also, any failure to fill customer orders on schedule could lead customers to seek alternative sources of supply.
We typically only produce goods against orders received, rather than for stock. Although we believe that close customer relationships have helped us to make accurate estimates of future orders in the past, there could be significant or numerous reductions, delays or cancellations in anticipated or confirmed orders by a customer or group of customers in the future, which could cause us to incur downtime on our machines and thereby have an adverse effect on our business, results of operations or financial condition.
Because a significant number of our employees are represented by labor unions or trade councils and work under collective bargaining agreements, any employee slowdown or strikes or the failure to renew our collective bargaining agreements could disrupt our business.
As of December 31, 2014, approximately 49% of our employees were represented by labor unions or trade councils and worked under collective bargaining agreements, all of which expire within one year. We may not be able to maintain constructive relationships with these labor unions or trade councils. We may not be able to successfully negotiate new collective bargaining agreements on satisfactory terms in the future. The loss of a substantial number of these employees or a prolonged labor dispute could disrupt our business. Any such disruption could reduce our revenues, increase our costs and result in significant losses.
We rely on a limited number of suppliers to provide raw materials, significant machinery and components used in our production facilities. A material interruption in supply or delivery could prevent or limit our ability to accept and fill orders for our products.
We currently depend upon a limited number of outside unaffiliated suppliers for key machinery and components used in our manufacturing and converting facilities. We cannot produce most of our nonwoven and oriented polyolefin products within the specifications required by our customers without such key machinery and
30
Table of Contents
components. If any of our suppliers cease to provide new machinery and components or replacement parts for existing machinery and components in sufficient quantity to meet our needs, there may not be adequate alternative sources of supply. To date, we have been able to obtain the required machinery and components to allow us to expand our business and supply products to our customers within their required specifications without any significant delays or interruptions. Obtaining alternative sources of such machinery and components could involve significant delays and other costs, and these supply sources may not be available to us on reasonable terms or at all. In some cases, we expect that it would take several months, or longer, for a new supplier to begin providing machinery and components to specification. Any disruption of machinery and component supplies could result in lost or deferred sales which could adversely affect our business and financial results.
We purchase raw materials from an array of suppliers, some of which supply a significant portion of our raw materials. Our top five suppliers of raw materials accounted for over 48% of our total purchases and our largest supplier represented approximately 26% of our total purchases, in each case for the year ended December 31, 2014. A loss of a significant supplier could cause us to experience substantial production delays and may impact our business and financial results. We use third-party transportation providers for our shipment of raw materials and our final products, including shipment tracking and freight dispatch services. Our use of transportation services for shipments is subject to risks, including increases in fuel prices, which would increase our shipping costs, and employee strikes and inclement weather, which may impact the ability of providers to provide delivery services that adequately meet our shipping needs. Any material shipping interruptions can adversely affect our ability to meet our production goals or result in significant additional costs.
We could be subject to substantial costs to comply with, and liabilities under, environmental laws, and violations of such laws may increase costs or require us to change certain business practices.
We use and generate a variety of chemicals in our manufacturing operations and we are subject to a broad range of federal, state, local and foreign environmental laws and regulations. These environmental laws govern, among other things, air emissions, wastewater discharges, the handling, storage, disposal and release of wastes and hazardous substances, cleanup of contaminated sites and human health and safety. We regularly incur costs to comply with environmental requirements, and such costs could increase significantly, or our business or operations could be materially affected, with changes in legal requirements or their interpretation or enforcement. For example, certain local governments have adopted ordinances prohibiting or restricting the use or disposal of certain plastic products, such as certain of the plastic wrapping materials that we produce. Widespread adoption of such prohibitions or restrictions could adversely affect demand for our products and thereby have a material adverse effect upon us. In addition, a decline in consumer preference for plastic or disposable products due to environmental considerations could have a material adverse effect upon us. We could incur substantial costs, including clean-up and capital costs, fines and sanctions and third-party property damage or personal injury claims, as a result of violations of environmental laws. Failure to comply with environmental requirements could also result in enforcement actions that materially limit or otherwise affect our operations. We are also subject to laws, such as the Comprehensive Environmental Response, Compensation, and Liability Act, or CERCLA, that may impose liability retroactively and without fault for releases or threatened releases of regulated materials at on-site or off-site locations.
Additionally, greenhouse gas (“GHG”) emissions have increasingly become the subject of a large amount of international, national, regional, state and local attention. Cap and trade initiatives to limit GHG emissions have been enacted in the European Union. Numerous bills related to climate change have been introduced in the U.S. Congress, and various states and federal agencies, including the U.S. Environmental Protection Agency, have taken or are considering actions to regulate GHG emissions, which could adversely impact us and many other industries including our suppliers or customers, which may result in higher costs or other impacts to our business. Within the U.S., most of these actions and proposals have resulted or would result in the regulation and/or taxation, in one fashion or another, of the production of carbon dioxide and other GHGs to facilitate the reduction of GHG emissions to the atmosphere, and provide tax and other incentives to produce and use more clean energy.
31
Table of Contents
Our insurance policies may be insufficient to cover certain eventualities
We have extensive insurance policies that we believe provide coverage consistent with industry practice. However, there is a possibility that these insurance policies may not adequately cover all risks and catastrophic events, and that any particular claim may not be paid. For example, in December 2010, a severe rainy season impacted many parts of Colombia and caused us to temporarily cease manufacturing at our Cali, Colombia facility due to a breach of a levy and flooding at the industrial park where our manufacturing facility is located. Although we carried flood insurance, it was insufficient to cover all of our losses and we incurred additional liability for costs associated with the flood and restoration of the facility. A catastrophic event or multiple catastrophic events may cause large losses and could have a material adverse effect on our business, results of operations or financial condition. Natural catastrophic events to which we are exposed include fires, windstorms, hurricanes, earthquakes, tornadoes, severe hail, severe winter weather and floods, which are inherently unpredictable in terms of both their occurrence and severity. We are also exposed to man-made catastrophic events, which may have a significant adverse impact on the industry where we operate and our business.
If we are unable to adequately protect our intellectual property, we could lose a significant competitive advantage.
Our success depends, in part, on our ability to protect our technologies and products against competitive pressure and to defend our intellectual property rights. If we fail to adequately protect our intellectual property rights, competitors may manufacture and market similar products, which could adversely affect our market share and results of operations. We consider our patents and trademarks, in the aggregate, to be important to our business and seek to protect our proprietary know-how in part through United States and foreign patent and trademark registrations. We have a total of over 1,300 pending and approved trademark and domain name registrations worldwide and over 600 pending and approved patents worldwide, and maintain certain trade secrets. We may not receive patents for all our pending patent applications, and existing or future patents or licenses may not provide competitive advantages for our products. Our competitors may challenge, invalidate or avoid the application of any existing or future patents, trademarks, or other intellectual property rights that we receive or license. In addition, patent rights may not prevent our competitors from developing, using or selling products that are similar or functionally equivalent to our products. The loss of protection for our intellectual property could reduce the value of our products, reduce product sales, lower our profits, and impair our financial condition.
We may not be able to recover the carrying value of our long-lived assets, which could require us to record asset impairment charges and materially and adversely affect our results of operations.
Property, plant and equipment represent a significant portion of our assets. Restructuring initiatives and changing conditions can impact our ability to recover the carrying value of our long-lived assets. The continuing presence of these factors, as well as other factors, could require us to record asset impairment charges in future periods which could materially and adversely affect our results of operations.
Goodwill and other identifiable intangible assets represent a significant portion of our total assets, and we may never realize the full value of our intangible assets.
Goodwill and other intangible assets represent a significant portion of our assets. Goodwill is the excess of cost over the fair market value of net assets acquired in business combinations. In the future, goodwill and intangible assets may increase as a result of future acquisitions. We review goodwill and intangible assets at least annually for impairment. Impairment may result from, among other things, deterioration in performance, adverse competitive conditions, adverse changes in applicable laws or regulations, including changes that restrict the activities of or affect the products and services we sell, challenges to the validity of certain registered intellectual property, reduced sales of certain products incorporating registered intellectual property, and a variety of other factors. Any impairment of goodwill or other intangible assets would result in a non-cash charge against earnings, which would adversely affect our results of operations.
If we fail to maintain effective internal control over financial reporting at a reasonable assurance level, we may not be able to accurately report our financial results, and may require the restatement of previously
32
Table of Contents
published financial information which could have a material adverse effect on our operations, investor confidence in our business and the trading prices of our securities.
We recently identified an error in the accounting for noncontrolling interest in the financial statements of our subsidiary, PGI Group, for the unaudited interim periods ended June 28, 2014 and September 27, 2014 relating to our Providência Acquisition, which resulted in the restatement of PGI Group’s consolidated financial statements for such periods. The restatement only impacted the Consolidated Balance Sheets, the Consolidated Statement of Changes in Equity and certain footnote disclosures for such periods. The restatement has no impact on the Consolidated Statements of Comprehensive Income (Loss) or the Consolidated Statements of Cash Flows for such periods. As a result of the restatement, we concluded that we had a material weakness in internal controls over financial reporting. In addition, in the past we have identified and remediated material weaknesses and other deficiencies in our internal control over financial reporting.
A material weakness is a deficiency, or a combination of deficiencies, in internal control over financial reporting such that there is a reasonable possibility that a material misstatement of our annual or interim financial statements will not be prevented or detected on a timely basis.
As of February 6, 2015, we implemented additional procedures that we believe are sufficient to remediate the existing material weakness. However, if we determine that these material weaknesses have not been fully remediated or if additional material weaknesses in our internal controls are discovered in the future, they may adversely affect our ability to record, process, summarize and report financial information timely and accurately and, as a result, we may fail to prevent or detect material misstatements in our annual or interim financial statements.
In addition, it is possible that control deficiencies could be identified by our management or by our independent registered public accounting firm in the future or may occur without being identified. Such a failure could result in regulatory scrutiny, cause investors to lose confidence in our reported results, lead to a default under our indebtedness or a decline in our stock price and otherwise materially adversely affect our business and financial condition.
The failure of our information technology systems could disrupt our business operations which could have a material adverse effect on our business, financial condition and/or results of operations.
The operation of our business depends on our information technology systems. The failure of our information technology systems to perform as we anticipate could disrupt our business and could result in, among other things, transaction errors, processing inefficiencies, loss of data and the loss of sales and customers, which could cause our business and results of operations to suffer. In addition, our information technology systems may be vulnerable to damage or interruption from circumstances beyond our control, including, without limitation, fire, natural disasters, power outages, systems failure, system conversions, security breaches, cyber-attacks, viruses and/or human error. In any such event, we could be required to make a significant investment to fix or replace information technology systems, and we could experience interruptions in our ability to service our customers. Any such damage or interruption could adversely affect our business, financial condition and/or results of operations.
The loss of our senior management could disrupt our business.
Our senior management is important to the success of our business. However, the specialty materials and nonwovens industries are characterized by significant competition for a limited pool of experienced executive personnel and, as a result, we may not be able to retain our existing senior management. In addition, we may not be able to fill new positions or vacancies created by expansion or turnover. The loss of any member of our senior management team without retaining a suitable replacement (either from inside or outside our existing management team) could restrict our ability to enhance existing products in a timely manner, sell products to our customers or manage the business effectively.
33
Table of Contents
Risks Relating to Our Indebtedness
Our substantial indebtedness could adversely affect our financial condition and prevent us from fulfilling our obligations under our indebtedness.
We have a substantial amount of debt, which requires significant interest and principal payments. As of December 31, 2014, on an as adjusted basis giving effect to the Offering, our total debt would have been approximately $ million. Our high level of debt could have important consequences, including the following:
| • | making it more difficult for us to satisfy our obligations with respect to our debt; |
| • | limiting our ability to obtain additional financing to fund future working capital, capital expenditures, acquisitions or other general corporate requirements; |
| • | requiring a substantial portion of our cash flows to be dedicated to debt service payments instead of other purposes, thereby reducing the amount of cash flows available for working capital, capital expenditures, acquisitions and other general corporate purposes; |
| • | increasing our vulnerability to general adverse economic and industry conditions; |
| • | exposing us to the risk of increased interest rates as certain of our borrowings are at variable rates of interest; |
| • | limiting our flexibility in planning for and reacting to changes in the industry in which we compete; |
| • | placing us at a disadvantage compared to other, less leveraged competitors; and |
| • | increasing our cost of borrowing. |
Despite our current level of indebtedness, we may be able to incur substantially more debt. This could further exacerbate the risks to our financial condition described above.
We may be able to incur significant additional indebtedness in the future. Although the indentures governing the Senior Secured Notes and the Senior Unsecured Notes and the credit agreements governing the ABL Facility, the Term Loans, the Additional Term Loans and the 2015 Additional Term Loans contain restrictions on the incurrence of additional indebtedness, these restrictions are subject to a number of qualifications and exceptions and additional indebtedness incurred in compliance with these restrictions could be substantial.
The restrictions contained in the indentures and the credit agreements also will not prevent us from incurring obligations, such as trade payables, that do not constitute indebtedness as defined under our debt instruments. In addition, as of December 31, 2014, on an as adjusted basis giving effect to the Offering, our ABL Facility would have provided for unused commitments of $43.6 million (subject to availability under a borrowing base and after giving effect to $19.3 million of outstanding letters of credit). Furthermore, we may increase our commitments under our ABL Facility without the consent of lenders under our ABL Facility, other than those lenders who, in their discretion, issue a commitment to provide all or a portion of such increase, by up to an additional $75.0 million, subject to certain customary conditions, and available debt capacity under the indentures governing the Senior Secured Notes and the Senior Unsecured Notes and the credit agreement governing the Term Loans. To the extent new debt is added to our currently anticipated debt levels, the substantial leverage risks described in the previous risk factor would increase. See “Management’s Discussion and Analysis of Financial Condition and Results of Operations—Indebtedness.”
Our variable rate indebtedness subjects us to interest rate risk, which could cause our indebtedness service obligations to increase significantly.
Borrowings under our ABL Facility, the Term Loans, the Additional Term Loans and the 2015 Additional Term Loans and certain of our foreign indebtedness are at variable rates of interest and expose us to interest rate
34
Table of Contents
risk. If interest rates increase, our debt service obligations on the variable rate indebtedness would increase even though the amount borrowed remained the same, and our net income and cash flows, including cash available for servicing our indebtedness, would correspondingly decrease.
We may be unable to service our indebtedness.
Our ability to make scheduled payments on and to refinance our indebtedness depends on and is subject to our financial and operating performance, which in turn is affected by general and regional economic, financial, competitive, business and other factors beyond our control, including the availability of financing in the international banking and capital markets. We cannot assure you that our business will generate sufficient cash flow from operations or that future borrowings will be available to us in an amount sufficient to enable us to service our debt, to refinance our debt or to fund our other liquidity needs. If we are unable to meet our debt service obligations or to fund our other liquidity needs, we will need to restructure or refinance all or a portion of our debt which could cause us to default on our debt obligations and impair our liquidity. Any refinancing of our indebtedness could be at higher interest rates and may require us to comply with more onerous covenants that could further restrict our business operations.
Moreover, in the event of a default, the holders of our indebtedness, including the Senior Secured Notes, the Senior Unsecured Notes, the ABL Facility, the Term Loans, the Additional Term Loans and the 2015 Additional Term Loans, could elect to declare all the funds borrowed to be due and payable, together with accrued and unpaid interest. The lenders under our ABL Facility could also elect to terminate their commitments thereunder and cease making further loans. The lenders and holders of our secured debt could institute foreclosure proceedings against their collateral, and we could be forced into bankruptcy or liquidation. If our operating performance declines, we may in the future need to obtain waivers from the required lenders under our ABL Facility to avoid being in default. If we breach our covenants under our ABL Facility, the lenders could exercise their rights, as described above, and we could be forced into bankruptcy or liquidation.
The agreements governing our indebtedness and the Lease Agreements (as defined below) impose significant operating and financial restrictions on us, which may prevent us from capitalizing on business opportunities.
The indentures governing the Senior Secured Notes and the Senior Unsecured Notes, the credit agreements governing our ABL Facility, the Term Loans, the Additional Term Loans and the 2015 Additional Term Loans, and the lease agreements associated with two of our U.S. spunmelt lines (the “Lease Agreements”) impose significant operating and financial restrictions on us. These restrictions limit our ability to, among other things:
| • | incur additional indebtedness, issue preferred stock or enter into sale and leaseback obligations; |
| • | pay certain dividends or make certain distributions on our capital stock or repurchase or redeem our capital stock; |
| • | make certain capital expenditures; |
| • | make certain loans, investments or other restricted payments; |
| • | place restrictions on the ability of subsidiaries to pay dividends or make other payments to us; |
| • | engage in transactions with stockholders or affiliates; |
| • | sell certain assets or engage in mergers, acquisitions and other business combinations; |
| • | amend or otherwise alter the terms of our indebtedness; |
| • | alter the business that we conduct; |
| • | guarantee indebtedness or incur other contingent obligations; and |
| • | create liens. |
35
Table of Contents
In addition, the restrictive covenants in our ABL Facility and Lease Agreements may require us to maintain a specified financial ratio and satisfy other financial condition tests. Our ability to comply with those financial ratios and tests can be affected by factors beyond our control. As a result, we are limited as to how we conduct our business and we may be unable to raise additional debt or equity financing to compete effectively or to take advantage of new business opportunities. Our failure to comply with the terms of the Lease Agreements could result in a default thereunder which, if not cured or waived, could result in our being required to make substantial unscheduled payments in respect of the applicable Lease Agreement. The terms of any future indebtedness we may incur could include more restrictive covenants or could impact compliance with existing restrictive covenants.
We cannot assure you that we will be able to maintain compliance with these covenants in the future and, if we fail to do so, that we will be able to obtain waivers from the lenders and/or amend the covenants. Our failure to comply with the restrictive covenants described above as well as other terms of our existing indebtedness and/or the terms of any future indebtedness from time to time could result in an event of default, which, if not cured or waived, could result in our being required to repay these borrowings before their due date. If we are forced to refinance these borrowings on less favorable terms or cannot refinance these borrowings, our results of operations and financial condition could be adversely affected.
Our failure to comply with the agreements relating to our outstanding indebtedness, including as a result of events beyond our control, could result in an event of default that could materially and adversely affect our results of operations and our financial condition.
If there were an event of default under any of the agreements relating to our outstanding indebtedness, the holders of the defaulted debt could cause all amounts outstanding with respect to that debt to be due and payable immediately. We cannot assure you that our assets or cash flow would be sufficient to fully repay borrowings under our outstanding debt instruments if accelerated upon an event of default. Further, if we are unable to repay, refinance or restructure our indebtedness under our secured debt, the holders of such debt could proceed against the collateral securing that indebtedness. In addition, any event of default or declaration of acceleration under one debt instrument could also result in an event of default under one or more of our other debt instruments.
Risks Related to our Acquisitions
The success of our business depends, in part, on achieving our objectives for strategic acquisitions and dispositions.
We may pursue acquisitions or joint ventures as part of our long-term business strategy. In pursuing these transactions, we may encounter significant challenges and risks including that the transaction does not advance our business strategy, that we do not realize a satisfactory return on the investment made, that we increase our debt levels beyond what the acquired business can support, that we may incur unknown liabilities or that we experience difficulty in completing such transactions or in the integration of new operations, employees, business systems, and technology, or diversion of management’s attention from our other businesses. These factors could adversely affect our operating results or financial condition.
We may, as part of our long-term business strategy, evaluate the potential disposition of assets and businesses that may no longer be in alignment with our strategic direction. When we decide to sell assets or businesses, we may encounter difficulty finding buyers or alternative exit strategies on acceptable terms in a timely manner, which could delay the accomplishment of strategic objectives, or we may dispose of a business at a price or on terms which are less than optimal. In addition, there is a risk that we sell a business whose subsequent performance exceeds expectations, in which case the decision would have potentially sacrificed enterprise value. Alternatively, we may be too optimistic about a particular business’s prospects, in which case we may be unable to find a buyer at an acceptable price or sacrifice enterprise value by retaining such business.
36
Table of Contents
Our recent acquisitions, including the Fiberweb Acquisition and Providência Acquisition, may not achieve their intended results, including anticipated cost savings.
Although we completed the Fiberweb Acquisition and Providência Acquisition with the expectation that each transaction will result in various benefits, including a significant amount of cost savings and other financial and operational benefits, there can be no assurance regarding when or the extent to which we will be able to realize any of these benefits. Achieving the anticipated benefits of an acquisition, including cost savings, is subject to a number of uncertainties, including whether the businesses acquired can be operated in the manner we intend. The integration may be subject to delays or changed circumstances, and we can give no assurance that the acquired businesses will perform in accordance with our expectations or that our expectations with respect to integration or cost savings as a result of acquisitions will materialize. In addition, we expect to incur additional costs and charges in connection with integrating the acquired businesses, including severance payments and other restructuring and transitional charges. Additional unanticipated costs, expenses, liabilities, competitive responses, or loss of customer and supplier relationships may also arise during the integration process. The integration of acquired businesses, including the Fiberweb and Providência businesses, may place an additional burdens on our management and internal resources, and the diversion of management’s attention during the integration and restructuring process could have an adverse effect on our profit margins, results of operations and financial condition.
The Providência Acquisition exposes us to additional risks and uncertainties with respect to the acquired businesses and their operations.
We expect that the Providência Acquisition will rebalance our business mix to a greater percentage of international operations. The acquired businesses will generally be subject to risks similar to those that we are subject to in our existing international businesses. In addition, we will be subject to increased foreign currency exchange rate risks because a greater portion of our cash flows will be generated by our international business operations. These risks relate primarily to changes in the relative value of the Brazilian real and the U.S. dollar between the time we initially invest U.S. dollars in our Brazilian business and the time that cash is repatriated to the United States from Brazil. In addition, our consolidated reported earnings on a GAAP basis may be subject to increased currency translation risk, which is the result of the conversion of earnings as reported in our Brazilian businesses on a Brazilian real basis to a U.S. dollar basis in accordance with GAAP requirements. In addition, regulatory requirements, political and/or competitive conditions associated with aspects of the acquired businesses may differ from those of our existing business, which may increase our costs.
In connection with the Providência Acquisition, approximately R$106.9 million (or $47.9 million) of the total consideration due to the selling shareholders pursuant to the stock purchase agreement constitutes Deferred Purchase Price, payable to the selling shareholders to the extent the Providência Tax Claims are resolved in Providência’s favor. See “Business—Expansion and Optimization—Providência Acquisition.” In addition, to the extent minority shareholders participate in the Mandatory Tender Offer, a pro rata amount of the consideration due to such tendering shareholders will be treated as Deferred Purchase Price with respect to such tendering holders. Based on currently available information, we do not anticipate that the actual tax liability will materially exceed the Deferred Purchase Price. However, the actual tax liability will be determined according to applicable Brazilian law, and to the extent the actual tax liability is in excess of the Deferred Purchase Price, we will be responsible for such excess.
Our subsidiary Providência is a Brazilian company and may remain a public company following completion of the tender offer in Brazil.
We may not succeed in acquiring 100% of the share capital of Providência. If Providência remains a public company in Brazil, it will remain subject to Brazilian laws and regulations applicable to domestic public companies, including Brazilian Corporation Law and the Sao Paulo stock exchange listing requirements, some of which may differ from the legal principles and rules that would apply if Providência were incorporated in a jurisdiction in the United States. In addition, we will continue to incur costs and expenses associated with being a public company in Brazil.
37
Table of Contents
The Providência business may also be adversely affected by any changes to Brazilian economic conditions. The Brazilian economy has historically been characterized by interventions by the Brazilian government and unstable economic cycles. The Brazilian government has often changed monetary, taxation, credit, tariff and other policies. For example, the government’s actions to control inflation have at times involved setting wage and price controls, blocking access to bank accounts, imposing exchange controls and limiting imports into Brazil. We have no control over, and cannot predict, what policies or actions the Brazilian government may take in the future. Providência’s business, results of operations, financial condition and prospects may be adversely affected by, among others, the following factors:
| • | exchange rate movements; |
| • | exchange control policies; |
| • | expansion or contraction of the Brazilian economy; |
| • | inflation; |
| • | tax policies; |
| • | other economic political, diplomatic and social developments in or affecting Brazil; |
| • | interest rates; |
| • | energy shortages or rationalization; |
| • | liquidity of domestic capital and lending markets; |
| • | changes in environmental regulation; and |
| • | social and political instability, particularly in light of recent protests against public policy and related vandalism in major Brazilian cities. |
These factors, as well as uncertainty over whether the Brazilian government may implement changes in policy or regulations relating to these factors, may adversely affect Providência and its business and financial performance. The Brazilian government has considerable power to determine governmental policies and actions that relate to the Brazilian economy and, consequently, affect the operations and financial performance of businesses in Brazil. The government may face domestic pressure to retreat from the current macroeconomic policies in an attempt to achieve higher rates of economic growth. We cannot predict what policies will be adopted by the Brazilian government and whether these policies will negatively affect the economy or Providência’s business or financial performance. In addition, uncertainty leading up to and after the election over whether the Brazilian government may implement changes in policy or regulations may contribute to economic uncertainty in Brazil.
The market for securities issued by Brazilian public companies is influenced, to varying degrees, by economic and market conditions in other emerging market countries, especially other Latin American countries. Accordingly, developments in one country may cause capital and credit markets in other countries to fluctuate and such fluctuations may be significant. Developments or adverse economic conditions in other emerging market countries have at times resulted in significant outflows of funds from, and declines in the amount of foreign currency invested in, Brazil. The Brazilian economy also is affected by international economic and market conditions generally, especially economic and market conditions in the United States. Share prices on the São Paulo Stock Exchange, for example, have historically been sensitive to fluctuations in U.S. interest rates, as well as movements of the major U.S. stocks indexes.
Following the Providência Acquisition, we have minority shareholders, who may interfere with our business plans and adversely affect our business strategy, or our future operating performance, financial condition, cash flows or results of operations.
Following the completion of the Providência Acquisition, we indirectly own approximately 71.25% of the outstanding capital stock of Providência, and other shareholders unrelated to us own approximately the
38
Table of Contents
remaining 28.75%. While we filed the Mandatory Tender Offer registration request with the CVM, as required under Brazilian law, completion of the Mandatory Tender offer may be delayed due to the ongoing approval process of the CVM, certain minority shareholders may choose not to participate and/or we may incur additional costs in connection with the acquisition of the minority shareholders’ shares. In the event we own less than 100% of Providência, any such minority shareholders may have interests that are contrary to our business plans with respect to Providência, which may include de-listing of Providência’s common stock. In addition, minority shareholders may seek to assert certain rights that they may purport to have under Brazilian law. If we are not able to implement our business plan with respect to Providência, we may incur additional costs. In addition, it could also adversely affect our business strategy, or our future operating performance, financial condition, cash flows or results of operations.
We may not receive dividends from Providência.
According to the bylaws of Providência, the company must pay to its shareholders, including us, at least 25% of its annual net income as dividends, calculated and adjusted pursuant to Brazilian Law No. 6,404 of December 15, 1976, as amended. Providência’s net income may be used to absorb losses or otherwise retained as allowed by Brazilian law, and may not be available to be paid as dividends. In addition, Providência is allowed to suspend the mandatory distribution of dividends in any particular fiscal year if its Board of Directors decides and informs its shareholders that such distribution would negatively impact its financial condition. While we indirectly own approximately 71.25% of the outstanding capital stock of Providência following the completion of the Providência Acquisition, 20% of the Board of Directors will be independent from us, pursuant to applicable Brazilian law.
Risks Related to this Offering and Ownership of Our Common Stock
No market currently exists for our common stock, and an active, liquid trading market for our common stock may not develop, which may cause our common stock to trade at a discount from the initial offering price and make it difficult for you to sell the common stock you purchase.
Prior to this offering, there has not been a public market for our common stock. We cannot predict the extent to which investor interest in the Company will lead to the development of an active trading market on the or otherwise or how active and liquid that market may become. If an active and liquid trading market does not develop or continue, you may have difficulty selling any of our common stock that you purchase. The initial public offering price for the shares will be determined by negotiations between us and the underwriters and may not be indicative of prices that will prevail in the open market following this offering. The market price of our common stock may decline below the initial offering price, and you may not be able to sell your shares of our common stock at or above the price you paid in this offering, or at all.
You will incur immediate and substantial dilution in the net tangible book value of the shares you purchase in this offering.
Prior stockholders have paid substantially less per share of our common stock than the price in this offering. The initial public offering price of our common stock will be substantially higher than the net tangible book value per share of outstanding common stock prior to completion of the offering. Based on our net tangible book value as of December 31, 2014 and upon the issuance and sale of shares of common stock by us at an assumed initial public offering price of $ per share, which is the mid-point of the range set forth on the cover page of this prospectus, if you purchase our common stock in this offering, you will pay more for your shares than the amounts paid by our existing stockholders for their shares and you will suffer immediate dilution of approximately $ per share in net tangible book value. Dilution is the amount by which the offering price paid by purchasers of our common stock in this offering will exceed the pro forma net tangible book value per share of our common stock upon completion of this offering. A total of shares of common stock has been reserved for future issuance under the 2015 Omnibus Incentive Plan. You may experience additional dilution
39
Table of Contents
upon future equity issuances or the exercise of stock options to purchase common stock granted to our employees, executive officers and directors under our current and future stock incentive plans, including our 2015 Omnibus Incentive Plan. See “Dilution.”
Our stock price may change significantly following the offering, and you may not be able to resell shares of our common stock at or above the price you paid or at all, and you could lose all or part of your investment as a result.
The trading price of our common stock is likely to be volatile. The stock market recently has experienced extreme volatility. This volatility often has been unrelated or disproportionate to the operating performance of particular companies. We and the underwriters will negotiate to determine the initial public offering price. You may not be able to resell your shares at or above the initial public offering price due to a number of factors such as those listed in “—Risks Related to Our Business” and the following:
| • | results of operations that vary from the expectations of securities analysts and investors; |
| • | results of operations that vary from those of our competitors; |
| • | changes in expectations as to our future financial performance, including financial estimates and investment recommendations by securities analysts and investors; |
| • | declines in the market prices of stocks generally, particularly those of food distribution companies; |
| • | strategic actions by us or our competitors; |
| • | announcements by us or our competitors of significant contracts, new products, acquisitions, joint marketing relationships, joint ventures, other strategic relationships or capital commitments; |
| • | changes in general economic or market conditions or trends in our industry; |
| • | changes in business or regulatory conditions; |
| • | future sales of our common stock or other securities; |
| • | investor perceptions or the investment opportunity associated with our common stock relative to other investment alternatives; |
| • | the public’s response to press releases or other public announcements by us or third parties, including our filings with the Securities and Exchange Commission (the “SEC”); |
| • | announcements relating to litigation; |
| • | guidance, if any, that we provide to the public, any changes in this guidance or our failure to meet this guidance; |
| • | the development and sustainability of an active trading market for our stock; |
| • | changes in accounting principles; and |
| • | other events or factors, including those resulting from natural disasters, war, acts of terrorism or responses to these events. |
These broad industry fluctuations may adversely affect the market price of our common stock, regardless of our actual operating performance. In addition, price volatility may be greater if the public float and trading volume of our common stock is low.
In the past, following periods of market volatility, stockholders have instituted securities class action litigation. If we were involved in securities litigation, it could have a substantial cost and divert resources and the attention of executive management from our business regardless of the outcome of such litigation.
40
Table of Contents
Because we have no current plans to pay cash dividends on our common stock for the foreseeable future, you may not receive any return on investment unless you sell your common stock for a price greater than that which you paid for it.
We intend to retain future earnings, if any, for future operations, expansion, and debt repayment and have no current plans to pay any cash dividends for the foreseeable future. The declaration, amount, and payment of any future dividends on shares of common stock will be at the sole discretion of our Board of Directors. Our Board of Directors may take into account general and economic conditions, our financial condition, and results of operations, our available cash and current and anticipated cash needs, capital requirements, contractual, legal, tax, and regulatory restrictions, implications on the payment of dividends by us to our stockholders or by our subsidiaries to us, and such other factors as our Board of Directors may deem relevant. In addition, our ability to pay dividends is limited by covenants of our existing and outstanding indebtedness and may be limited by covenants of any future indebtedness we or our subsidiaries incur. As a result, you may not receive any return on an investment in our common stock unless you sell our common stock for a price greater than that which you paid for it.
If securities analysts do not publish research or reports about our business or if they downgrade our stock or our sector, our stock price and trading volume could decline.
The trading market for our common stock will rely in part on the research and reports that industry or financial analysts publish about us or our business. We do not control these analysts. Furthermore, if one or more of the analysts who do cover us downgrade our stock or our industry, or the stock of any of our competitors, or publish inaccurate or unfavorable research about our business, the price of our stock could decline. If one or more of these analysts ceases coverage of the Company or fail to publish reports on us regularly, we could lose visibility in the market, which in turn could cause our stock price or trading volume to decline.
Future sales, or the perception of future sales, by us or our existing stockholders in the public market following this offering could cause the market price for our common stock to decline.
After this offering, the sale of shares of our common stock in the public market, or the perception that such sales could occur, could harm the prevailing market price of shares of our common stock. These sales, or the possibility that these sales may occur, also might make it more difficult for us to sell equity securities in the future at a time and at a price that we deem appropriate.
Upon consummation of this offering we will have a total of shares of common stock outstanding. All shares sold in this offering will be freely tradable without registration under the Securities Act, and without restriction by persons other than our “affiliates” (as defined under Rule 144 of the Securities Act (“Rule 144”)), including our directors, executive officers and other affiliates (including affiliates of the Sponsor) whose shares may be sold only in compliance with the limitations described in “Shares Eligible for Future Sale.”
The remaining shares, representing % of our total outstanding shares of common stock following this offering based on the number of shares outstanding as of December 31, 2014, will be “restricted securities” within the meaning of Rule 144 and subject to certain restrictions on resale following the consummation of this offering. Restricted securities may be sold in the public market only if they are registered under the Securities Act or are sold pursuant to an exemption from registration such as Rule 144, as described in “Shares Eligible for Future Sale.”
In connection with this offering, we, our directors and executive officers, and holders of substantially all of our common stock have each agreed with the underwriters, subject to certain exceptions, not to dispose of or hedge any of our or their common stock or securities convertible into or exchangeable for shares of common stock during the period from the date of this prospectus continuing through the date 180 days after the date of this prospectus, except with the prior written consent of the representatives of the underwriters. See “Underwriting” for a description of these lock-up agreements.
41
Table of Contents
Upon the expiration of the lock-up agreements described above, shares held by the Investor Group and certain of our directors, officers and employees will be eligible for resale, subject to volume, manner of sale and other limitations under Rule 144. In addition, pursuant to a registration rights agreement, our existing owners have the right, subject to certain conditions, to require us to register the sale of their shares of our common stock under the Securities Act. By exercising their registration rights and selling a large number of shares, our existing owners could cause the prevailing market price of our common stock to decline. Following completion of this offering, the shares covered by registration rights would represent approximately % of our outstanding common stock (or %, if the underwriters exercise in full their option to purchase additional shares). Registration of any of these outstanding shares of common stock would result in such shares becoming freely tradable without compliance with Rule 144 upon effectiveness of the registration statement. See “Shares Eligible for Future Sale.”
As restrictions on resale end or if these stockholders exercise their registration rights, the market price of our shares of common stock could drop significantly if the holders of these shares sell them or are perceived by the market as intending to sell them. These factors could also make it more difficult for us to raise additional funds through future offerings of our shares of common stock or other securities.
In addition, the shares of our common stock reserved for future issuance under the 2015 Omnibus Incentive Plan will become eligible for sale in the public market once those shares are issued, subject to provisions relating to various vesting agreements, lock-up agreements and Rule 144, as applicable. A total of shares of common stock has been reserved for future issuance under the 2015 Omnibus Incentive Plan. The special pricing committee of the Board of Directors may determine the exact number of shares to be reserved for future issuance under the 2015 Omnibus Incentive Plan at its discretion.
In the future, we may also issue our securities in connection with investments or acquisitions. The amount of shares of our common stock issued in connection with an investment or acquisition could constitute a material portion of our then-outstanding shares of our common stock. Any issuance of additional securities in connection with investments or acquisitions may result in additional dilution to you.
Anti-takeover provisions in our organizational documents could delay or prevent a change of control.
Certain provisions of our amended and restated certificate of incorporation and amended and restated bylaws may have an anti-takeover effect and may delay, defer or prevent a merger, acquisition, tender offer, takeover attempt or other change of control transaction that a stockholder might consider in its best interest, including those attempts that might result in a premium over the market price for the shares held by our stockholders.
These provisions provide for, among other things:
| • | a classified Board of Directors with staggered three-year terms; |
| • | the ability of our Board of Directors to issue one or more series of preferred stock; |
| • | advance notice for nominations of directors by stockholders and for stockholders to include matters to be considered at our annual meetings; |
| • | certain limitations on convening special stockholder meetings; |
| • | the removal of directors only for cause and only upon the affirmative vote of holders of at least % of the shares of common stock entitled to vote generally in the election of directors if the Sponsor and its affiliates hold less than % of our outstanding shares of common stock; and |
| • | that certain provisions may be amended only by the affirmative vote of at least % of the shares of common stock entitled to vote generally in the election of directors if the Sponsor and its affiliates hold less than % of our outstanding shares of common stock. |
42
Table of Contents
These anti-takeover provisions could make it more difficult for a third party to acquire us, even if the third-party’s offer may be considered beneficial by many of our stockholders. As a result, our stockholders may be limited in their ability to obtain a premium for their shares. See “Description of Capital Stock.”
Our amended and restated certificate of incorporation will designate the Court of Chancery of the State of Delaware as the sole and exclusive forum for certain types of actions and proceedings that may be initiated by our stockholders, which could limit our stockholders’ ability to obtain a favorable judicial forum for disputes with us or our directors, officers or employees.
Our amended and restated certificate of incorporation will provide that, subject to limited exceptions, the Court of Chancery of the State of Delaware will be the sole and exclusive forum for any (i) derivative action or proceeding brought on behalf of our Company, (ii) action asserting a claim of breach of a fiduciary duty owed by any director or officer of our Company to the Company or the Company’s stockholders, creditors, or other constituents, (iii) action asserting a claim against the Company or any director or officer of the Company arising pursuant to any provision of the General Corporation Law of the State of Delaware (the “DGCL”) or our amended and restated certificate of incorporation or our amended and restated bylaws, or (iv) action asserting a claim against the Company or any director or officer of the Company governed by the internal affairs doctrine. Any person or entity purchasing or otherwise acquiring any interest in shares of our capital stock shall be deemed to have notice of and to have consented to the provisions of our amended and restated certificate of incorporation described above. This choice of forum provision may limit a stockholder’s ability to bring a claim in a judicial forum that it finds favorable for disputes with us or our directors, officers or other employees, which may discourage such lawsuits against us and our directors, officers and employees. Alternatively, if a court were to find these provisions of our amended and restated certificate of incorporation inapplicable to, or unenforceable in respect of, one or more of the specified types of actions or proceedings, we may incur additional costs associated with resolving such matters in other jurisdictions, which could adversely affect our business and financial condition.
Affiliates of the Sponsor control us and their interests may conflict with ours or yours in the future.
Immediately following this offering of common stock, affiliates of the Sponsor will beneficially own approximately % of our common stock, or approximately % if the underwriters exercise in full their option to purchase additional shares. As a result, investment funds associated with or designated by affiliates of the Sponsor will have the ability to elect all of the members of our Board of Directors and thereby control our policies and operations, including the appointment of management, future issuances of our common stock or other securities, the payment of dividends, if any, on our common stock, the incurrence or modification of debt by us, amendments to our amended and restated certificate of incorporation and amended and restated bylaws and the entering into of extraordinary transactions, and their interests may not in all cases be aligned with your interests. In addition, the Sponsor may have an interest in pursuing acquisitions, divestitures and other transactions that, in its judgment, could enhance its investment, even though such transactions might involve risks to you. For example, the Sponsor could cause us to make acquisitions that increase our indebtedness or cause us to sell revenue-generating assets.
The Sponsor is in the business of making investments in companies and may from time to time acquire and hold interests in businesses that compete directly or indirectly with us.
Our amended and restated certificate of incorporation will provide that none of the Sponsor, any of its affiliates or any director who is not employed by us (including any non-employee director who serves as one of our officers in both his director and officer capacities) or his or her affiliates will have any duty to refrain from engaging, directly or indirectly, in the same business activities or similar business activities or lines of business in which we operate. The Sponsor also may pursue acquisition opportunities that may be complementary to our business, and, as a result, those acquisition opportunities may not be available to us. So long as the Sponsor continues to own a significant amount of our combined voting power, even if such amount is less than 50%, the
43
Table of Contents
Sponsor will continue to be able to strongly influence or effectively control our decisions and, so long as the Sponsor and its affiliates collectively own at least 5% of all outstanding shares of our stock entitled to vote generally in the election of directors, it will be able to appoint individuals to our Board of Directors under a stockholders agreement which we expect to adopt in connection with this offering. In addition, the Sponsor will be able to determine the outcome of all matters requiring stockholder approval and will be able to cause or prevent a change of control of the Company or a change in the composition of our Board of Directors and could preclude any unsolicited acquisition of the Company. The concentration of ownership could deprive you of an opportunity to receive a premium for your shares of common stock as part of a sale of the Company and ultimately might affect the market price of our common stock.
We will be a “controlled company” within the meaning of the rules of the NYSE and the rules of the SEC. As a result, we will qualify for, and intend to rely on, exemptions from certain corporate governance requirements that would otherwise provide protection to stockholders of other companies.
After completion of this offering, the Sponsor will continue to control a majority of the voting power of our outstanding common stock. As a result, we will be a “controlled company” within the meaning of the corporate governance standards of the NYSE. Under these rules, a company of which more than 50% of the voting power is held by an individual, group or another company is a “controlled company” and may elect not to comply with certain corporate governance requirements, including:
| • | the requirement that a majority of our Board of Directors consist of “independent directors” as defined under the rules of the NYSE; |
| • | the requirement that we have a compensation committee that is composed entirely of independent directors with a written charter addressing the committee’s purpose and responsibilities; |
| • | the requirement that we have a nominating and corporate governance committee that is composed entirely of independent directors with a written charter addressing the committee’s purpose and responsibilities; and |
| • | the requirement for an annual performance evaluation of the compensation and nominating and corporate governance committees. |
Following this offering, we intend to utilize these exemptions. As a result, we may not have a majority of independent directors, our nominating/corporate governance committee, if any, and compensation committee may not consist entirely of independent directors and such committees will not be subject to annual performance evaluations. Accordingly, you may not have the same protections afforded to stockholders of companies that are subject to all of the corporate governance requirements of the NYSE.
In addition, on June 20, 2012, the SEC passed final rules implementing provisions of the Dodd-Frank Wall Street Reform and Consumer Protection Act of 2010 pertaining to compensation committee independence and the role and disclosure of compensation consultants and other advisers to the compensation committee. The SEC’s rules direct each of the national securities exchanges (including the NYSE on which we intend to list our common stock) to develop listing standards requiring, among other things, that:
| • | compensation committees be composed of fully independent directors, as determined pursuant to new independence requirements; |
| • | compensation committees be explicitly charged with hiring and overseeing compensation consultants, legal counsel and other committee advisors; and |
| • | compensation committees be required to consider, when engaging compensation consultants, legal counsel or other advisors, certain independence factors, including factors that examine the relationship between the consultant or advisor’s employer and us. |
44
Table of Contents
As a “controlled company,” we will not be subject to these compensation committee independence requirements.
Our ability to use our net operating loss carryforwards to offset future taxable income for U.S. federal income tax purposes may be limited as a result of future changes in the ownership of our stock and the absence of taxable income in the United States.
As of December 31, 2014, we had U.S. federal net operating loss carryforwards (“NOLs”), of approximately $380.7 million available to offset future taxable income. A significant portion of these NOLs is currently subject to an annual limitation under Section 382 of the Internal Revenue Code of 1986, as amended (the “Code”) and these NOLs have been and will continue to be subject to a valuation allowance in our financial statements. Furthermore, our ability to use our NOLs may be limited if we undergo a future “ownership change,” as defined in Section 382 of the Code, that causes the NOLs to be subject to a greater limitation than the current limitation.
An ownership change could be triggered by substantial changes in the ownership of our outstanding stock. For example, an ownership change would occur if certain shareholders increase their aggregate percentage ownership of our stock by more than 50 percentage points over their lowest percentage ownership at any time during the testing period, which is generally the three-year period preceding any potential ownership change. Although this offering is not expected to cause a change of control for purposes of Section 382 of the Code, future changes in the ownership of our stock could cause an ownership change for purposes of Section 382 of the Code.
The amount of our NOLs has not been audited or otherwise validated by the Internal Revenue Service. The Internal Revenue Service could challenge the amount of our NOLs and other tax assets, which could result in an increase in our liability for income taxes in the future. Further, our NOLs only have value to the extent we generate taxable income in the United States. If we are unable to generate sufficient taxable income prior to the expiration of the NOLs or to the extent our earnings are subject to non-U.S. tax, we will be limited in our ability to utilize the tax benefits related to our NOLs. There can be no assurance that we will have sufficient taxable income to be able to utilize our NOLs prior to their expiration.
We will incur increased costs and obligations as a result of being a public company.
As a public company, we will incur significant legal, accounting, insurance, and other expenses that we have not incurred as a private company, including costs associated with public company reporting requirements. We also will incur costs associated with complying with the requirements of the Sarbanes-Oxley Act of 2002 and related rules implemented by the SEC and the NYSE. The expenses incurred by public companies generally for reporting and corporate governance purposes have been increasing. We expect these rules and regulations to increase our legal and financial compliance costs and to make certain activities more time-consuming and costly, although we are currently unable to estimate these costs with any degree of certainty. These laws and regulations could also make it more difficult or costly for us to obtain certain types of insurance, including director and officer liability insurance, and we may be forced to accept reduced policy limits and coverage or incur substantially higher costs to obtain the same or similar coverage. These laws and regulations could also make it more difficult for us to attract and retain qualified persons to serve on our Board of Directors, our board committees, or as our executive officers. Furthermore, if we are unable to satisfy our obligations as a public company, we could be subject to delisting of our common stock, fines, sanctions, other regulatory action, and potentially civil litigation.
45
Table of Contents
This prospectus contains “forward-looking statements” within the meaning of the federal securities laws. All statements, other than statements of historical facts included in this prospectus, including statements concerning our plans, objectives, goals, beliefs, business strategies, future events, business conditions, our results of operations, financial position and our business outlook, business trends and other information referred to under “Prospectus Summary,” “Risk Factors,” “Dividend Policy,” “Management’s Discussion and Analysis of Financial Condition and Results of Operations” and “Business” are forward-looking statements. When used in this prospectus, the words “anticipate”, “believe”, “estimate”, “expect”, “forecast”, “intend”, “may”, “plans”, “predict”, “project”, “schedule”, “seeks”, “should”, “target” and variations of such words or similar expressions are intended to identify forward-looking statements. The forward-looking statements are not historical facts, and are based upon our current expectations, beliefs, estimates and projections, and various assumptions, many of which, by their nature, are inherently uncertain and beyond our control. Our expectations, beliefs and projections are expressed in good faith and we believe there is a reasonable basis for them. However, there can be no assurance that management’s expectations, beliefs, estimates and projections will result or be achieved and actual results may vary materially from what is expressed in or indicated by the forward-looking statements.
There are a number of risks, uncertainties and other important factors, many of which are beyond our control, that could cause our actual results to differ materially from the forward-looking statements contained in this prospectus. Such risks, uncertainties and other important factors include, among others, the risks, uncertainties and factors set forth above under “Risk Factors,” and the following risks, uncertainties and factors:
| • | general economic factors including, but not limited to, changes in interest rates, foreign currency translation rates, consumer confidence, trends in disposable income, changes in consumer demand for goods produced, and cyclical or other downturns; |
| • | cost and availability of raw materials, labor and natural and other resources, and our ability to pass raw material cost increases along to customers |
| • | changes to selling prices to customers which are based, by contract, on an underlying raw material index; |
| • | ability to meet existing debt covenants or obtain necessary waivers; |
| • | achievement of objectives for strategic acquisitions and dispositions; |
| • | ability to achieve successful or timely start-up of new or modified production lines; |
| • | reliance on major customers and suppliers; |
| • | domestic and foreign competition; |
| • | information and technological advances; |
| • | risks related to operations in foreign jurisdictions; and |
| • | changes in, compliance with, and liabilities under, environmental laws and regulations, including climate change-related legislation and regulation. |
46
Table of Contents
We estimate that the net proceeds from our sale of shares of common stock in this offering based on an assumed initial public offering price of $ per share, which is the midpoint of the price range set forth on the cover page of this prospectus, after deducting estimated underwriting discounts and commissions and estimated offering expenses payable by us, will be approximately $ million (or $ million if the underwriters exercise in full their option to purchase additional shares).
We intend to use a portion of the net proceeds received by us from this offering to redeem $ aggregate principal amount of the Senior Secured Notes, which bear interest at 7.75% per annum and mature on February 1, 2019. As of December 31, 2014, the aggregate principal amount outstanding of the Senior Secured Notes was $504.0 million. On April 8, 2015, PGI Group issued a conditional notice of its election to redeem $200.0 million of the outstanding principal amount of its Senior Secured Notes. The $200.0 million Senior Secured Notes are expected to be redeemed on May 8, 2015. On and after February 1, 2015 and until February 1, 2016, PGI Group may redeem any or all of the Senior Secured Notes at a redemption price of 103.875%, plus accrued and unpaid interest to the redemption date.
In connection with this offering, we intend to terminate the Advisory Agreement. We will use approximately $ million of the net proceeds to us from this offering to pay a one-time termination fee to affiliates of the Sponsor in connection with the termination of the Advisory Agreement. See “Certain Relationships and Related Party Transactions—Advisory Agreement.”
We intend to use any remaining proceeds received by us from this offering for general corporate purposes.
A $1.00 increase or decrease in the assumed initial public offering price of $ per share would increase or decrease, as applicable, the net proceeds to us from this offering by approximately $ million (or $ million if the underwriters exercise in full their option to purchase additional shares), assuming the number of shares offered by us remains the same as set forth on the cover page of this prospectus and after deducting the estimated underwriting discounts and commissions and estimated offering expenses payable by us.
47
Table of Contents
We have no current plans to pay dividends on our common stock. Any decision to declare and pay dividends in the future will be made at the sole discretion of our Board of Directors and will depend on, among other things, our results of operations, cash requirements, financial condition, contractual restrictions, and other factors that our Board of Directors may deem relevant. Because we are a holding company and have no direct operations, we will only be able to pay dividends from funds we receive from our subsidiaries. In addition, our ability to pay dividends will be limited by covenants in our existing indebtedness and may be limited by the agreements governing other indebtedness we or our subsidiaries incur in the future. See “Management’s Discussion and Analysis of Financial Condition and Results of Operations—Indebtedness.”
48
Table of Contents
The following table sets forth our consolidated cash and cash equivalents and capitalization as of December 31, 2014 on:
| • | an actual basis; and |
| • | an as adjusted basis to give effect to: |
| • | the sale by us of shares of common stock in this offering at an assumed initial public offering price of $ per share, which is the midpoint of the price range set forth on the cover page of this prospectus; and |
| • | the application of net proceeds from this offering as described under “Use of Proceeds,” as if this offering and the application of the net proceeds therefrom had occurred on December 31, 2014. |
You should read this table in conjunction with the information contained in “Use of Proceeds,” “Selected Historical Consolidated Financial Data” and “Management’s Discussion and Analysis of Financial Condition and Results of Operations,” as well as our audited and unaudited consolidated financial statements included elsewhere in this prospectus and the notes thereto included elsewhere in this prospectus.
| As of December 31, 2014 | ||||||||
| Actual | As Adjusted(1) | |||||||
| (dollars in thousands)* (unaudited) |
||||||||
| Cash and cash equivalents |
$ | 178,491 | $ | |||||
|
|
|
|
|
|||||
| Short-term borrowings(2) |
$ | 17,665 | ||||||
| Long-term debt, including current portion: |
||||||||
| ABL Facility(3) |
— | |||||||
| Term Loans(4) |
703,029 | |||||||
| Senior Secured Notes(5) |
504,000 | |||||||
| Senior Unsecured Notes |
210,000 | |||||||
| Other existing debt and capital lease obligations(6) |
48,146 | |||||||
|
|
|
|
|
|||||
| Total short-term borrowings and long-term debt, including current portion |
1,482,840 | |||||||
| Deferred Purchase Price(7) |
47,931 | |||||||
| Redeemable noncontrolling interest(8) |
89,181 | |||||||
| Equity: |
||||||||
| Common stock, $0.01 par value, 1,000,000 shares authorized, actual; 292,491 shares issued and outstanding, actual; shares authorized, as adjusted; and shares issued and outstanding, as adjusted)(9) |
3 | |||||||
| Additional paid-in capital |
277,245 | |||||||
| Retained earnings (deficit) |
(242,439 | ) | ||||||
| Accumulated other comprehensive income (loss) |
(59,164 | ) | ||||||
|
|
|
|
|
|||||
| Total PGI Specialty Materials, Inc. shareholders’ equity |
(24,355 | ) | ||||||
| Noncontrolling interest(10) |
554 | |||||||
|
|
|
|
|
|||||
| Total equity |
(23,801 | ) | ||||||
|
|
|
|
|
|||||
| Total capitalization(11) |
$ | 1,596,151 | $ | |||||
|
|
|
|
|
|||||
| * | Amounts may reflect rounding. |
| (1) | Each $1.00 increase or decrease in the assumed initial public offering price of $ per share would increase or decrease, as applicable, cash and cash equivalents, additional paid-in capital and total |
49
Table of Contents
| shareholders’ equity by approximately $ million, assuming the number of shares offered by us remains the same as set forth on the cover page of this prospectus and after deducting the estimated underwriting discounts and commissions and estimated offering expenses that we must pay. |
| (2) | Represents $17.0 million under short-term credit facilities used to finance short-term working capital needs and $0.7 million of short-term indebtedness of Terram Geosynthetics. |
| (3) | As of December 31, 2014, we had $43.6 million of availability under our ABL Facility, after giving effect to $19.3 million issued but undrawn letters of credit. See “Management’s Discussion and Analysis of Financial Condition and Results of Operations-Indebtedness—ABL Facility.” |
| (4) | On April 17, 2015, PGI Group borrowed an additional $283.0 million under the Second Incremental Amendment. See “Summary—Recent Developments—Term Loan Facility Amendment.” |
| (5) | On April 8, 2015, PGI Group issued a conditional notice of its election to redeem $200.0 million of the outstanding principal amount of its Senior Secured Notes. The $200.0 million Senior Secured Notes are expected to be redeemed on May 8, 2015. |
| (6) | Actual column represents (i) $5.0 million outstanding under our Argentina—Nacion facility; (ii) $2.0 million outstanding under our Argentina—Galicia facility; (iii) $18.9 million outstanding under our China Hygiene facility; (iv) $2.4 million indebtedness of Terram Geosynthetics; (v) $0.9 million of capital lease obligations; and (vi) $18.9 million of indebtedness of Providência that remains outstanding after the completion of the Providência Acquisition, comprised of (a) $0 million in respect of a U.S. dollar-denominated export credit facility and (b) $18.9 million in respect of a Brazilian real-denominated export credit facility. |
| (7) | Reflects $47.9 million in respect of the Deferred Purchase Price for Providência (see “Business—Expansion and Optimization—Providência Acquisition”), which is treated as “Indebtedness” under the indentures governing the Senior Secured Notes and the Senior Unsecured Notes and the credit agreements governing our ABL Facility and Term Loan Facility. |
| (8) | Following the Providência Acquisition, we indirectly own approximately 71.25% of the outstanding capital stock of Providência. As required by Brazilian law, we intend to launch, subject to CVM approval, the Mandatory Tender Offer to acquire the remaining outstanding capital stock of Providência from the minority shareholders. |
| (9) | The number of shares of our common stock to be outstanding immediately after the consummation of this offering is based on 292,491 shares of common stock outstanding as of December 31, 2014, plus shares of common stock to be sold by the Company in this offering, and does not give effect to shares of common stock reserved for future issuance under the 2015 Omnibus Incentive Plan or shares of common stock issued in connection with our long-term incentive compensation program after December 31, 2014. |
| (10) | Noncontrolling interest represent the minority partners’ interest in the income or loss of Terram Geosynthetics Private Limited, a joint venture located in Gujarat, India, in which we maintain a 65% controlling interest. |
| (11) | Does not reflect (i) our future minimum rental payments required under operating lease obligations of $58.2 million over the next 5 years and $20.3 million thereafter, (ii) our financing obligation related to the Old Hickory facility acquired in the Fiberweb Acquisition, which had an outstanding balance as of December 31, 2014 of $18.4 million or (iii) $15.0 million of undrawn letters of credit to raw material vendors outstanding as of December 31, 2014. See “Management’s Discussion and Analysis of Financial Condition and Results of Operations-Indebtedness.” |
50
Table of Contents
If you invest in shares of our common stock in this offering, your investment will be immediately diluted to the extent of the difference between the initial public offering price per share of common stock and the net tangible book value per share of common stock after this offering. Dilution results from the fact that the per share offering price of the shares of common stock is substantially in excess of the net tangible book value per share attributable to the shares of common stock held by existing owners.
Our net tangible book value as of December 31, 2014 was a deficit of approximately $242.4 million, or $ per share of common stock. We calculate net tangible book value per share by taking the amount of our total tangible assets, reduced by the amount of our total liabilities, and then dividing that amount by the total number of shares of common stock outstanding.
Dilution is determined by subtracting pro forma net tangible book value per share of common stock, as adjusted to give effect to this offering, from the initial public offering price per share of common stock.
After giving effect to our sale of the shares in this offering at an assumed initial public offering price of $ per share, the midpoint range described on the cover of this prospectus, and after deducting estimated underwriting discounts and commissions and offering expenses payable by us, our net tangible book value as of December 31, 2014 would have been $ , or $ per share of common stock. This represents an immediate increase in net tangible book value of $ per share of common stock to our existing owners and an immediate and substantial dilution in net tangible book value of $ per share of common stock to investors in this offering at the assumed initial public offering price.
The following table illustrates this dilution on a per share of common stock basis assuming the underwriters do not exercise their option to purchase additional shares of common stock:
| Assumed initial public offering price per share of common stock |
$ | |||
| Net tangible book value per share of common stock as of December 31, 2014 |
$ | |||
| Increase in net tangible book value per share of common stock attributable to investors in this offering |
$ | |||
|
|
|
|||
| As adjusted net tangible book value per share of common stock after the offering |
$ | |||
|
|
|
|||
| Dilution per share of common stock to investors in this offering |
$ | |||
|
|
|
A $1.00 increase in the assumed initial public offering price of $ per share of our common stock would increase our net tangible book value after giving to the offering by $ million, or by $ per share of our common stock, assuming the number of shares offered by us remains the same and after deducting the underwriting discount and the estimated offering expenses payable by us. A $1.00 decrease in the assumed initial public offering price per share would result in equal changes in the opposite direction.
51
Table of Contents
The following table summarizes, as of December 31, 2014, the total number of shares of common stock purchased from us, the total cash consideration paid to us, and the average price per share paid by existing owners and by new investors. As the table shows, new investors purchasing shares in this offering will pay an average price per share substantially higher than our existing owners paid. The table below assumes an initial public offering price of $ per share, the midpoint of the range set forth on the cover of this prospectus, for shares purchased in this offering and excludes underwriting discounts and commissions and estimated offering expenses payable by us:
| Shares of Common Stock Purchased |
Total Consideration |
Average Price Per Share of Common Stock |
||||||||||||||||
| Number | Percent | Amount | Percent | |||||||||||||||
| (dollar amounts in thousands, except for per share data) |
||||||||||||||||||
| Existing owners |
% | $ | % | $ | ||||||||||||||
| Investors in this offering |
% | $ | % | $ | ||||||||||||||
|
|
|
|
|
|
|
|
|
|
||||||||||
| Total |
% | $ | % | $ | ||||||||||||||
|
|
|
|
|
|
|
|
|
|
||||||||||
Each $1.00 increase in the assumed offering price of $ per share would increase total consideration paid by investors in this offering and total consideration paid by all stockholders by $ million, assuming the number of shares offered by us remains the same and after deducting the underwriting discount and the estimated offering expenses payable by us. A $1.00 decrease in the assumed initial public offering price per share would result in equal changes in the opposite direction.
The dilution information above is for illustration purposes only. Our net tangible book value following the consummation of this offering is subject to adjustment based on the actual initial public offering price of our shares and other terms of this offering determined at pricing.
52
Table of Contents
UNAUDITED PRO FORMA CONDENSED COMBINED FINANCIAL INFORMATION
The unaudited pro forma condensed combined financial information herein is based upon the historical consolidated financial statements and/or financial information of the Company and Providência and has been prepared to illustrate the effects of the Transactions and the Offering.
The accompanying unaudited pro forma condensed combined statements of operations for the year ended December 31, 2014 have been prepared to give pro forma effect to the Transactions and the Offering as if they had occurred on December 29, 2013. Since the most recent balance sheet presented in this prospectus as of December 31, 2014 includes the impact of the Transactions, a pro forma balance sheet as of December 31, 2014 has not been presented.
The following unaudited pro forma condensed combined financial information includes only adjustments that are directly attributable to the Transactions and the Offering, factually supportable and, with respect to the statements of operations, expected to have a continuing impact on the combined results. The Providência Acquisition has been accounted for using the acquisition method of accounting in accordance with ASC 805. ASC 805 requires, among other things, that the assets acquired and liabilities assumed be recognized at their acquisition date fair values, with any excess of the consideration transferred over the estimated fair values of the identifiable net assets acquired recorded as goodwill. The estimated fair values of Providência assets acquired, liabilities assumed and resulting goodwill are subject to adjustment as the Company finalizes its fair value analysis. The Company has not completed the detailed valuation work necessary to arrive at the required estimates of the fair value of Providência net assets and related allocation of purchase price. The Company is still waiting for additional information to finalize the valuation of its acquired intangible assets and property, plant and equipment as well as the accounting for certain tax matters. The Company expects to complete its final purchase price allocation during the second quarter of 2015. Upon completion of detailed valuation studies and the final determination of fair value, the Company may make additional adjustments to the purchase price allocation, which may differ significantly from the valuations set forth in the unaudited pro forma condensed combined financial information.
The unaudited pro forma condensed combined financial information has been presented for informational purposes only and is not necessarily indicative of what the combined company’s results of operations actually would have been had the Transactions and the Offering, as applicable, been completed as of the dates indicated, nor is it necessarily indicative of future operating results of the combined company. As a result, the pro forma condensed combined statements of operations have not been adjusted to reflect future events that may have occurred after the Transactions and/or that are expected to occur after the Offering, including, but not limited to, the anticipated realization of ongoing savings from operating synergies and certain one-time charges we expect to incur in connection with the Providência Acquisition, including but not limited to, costs in connection with the integration of the operations of the Company and Providência.
The information presented below should be read in conjunction with information included under the headings “Summary,” “Capitalization,” “Selected Historical Consolidated Financial Data,” “Management’s Discussion and Analysis of Financial Condition and Results of Operations” and the historical financial statements of the Company, Fiberweb, and Providência, including the related notes, included elsewhere in this prospectus. All pro forma adjustments and their underlying assumptions are described more fully in the notes to our unaudited pro forma condensed combined financial information.
53
Table of Contents
Unaudited Pro Forma Condensed Combined Statement of Operations
For the Fiscal Year Ended December 31, 2014
| In thousands, except for per share data |
PGI Specialty Materials, Inc. |
Providência U.S. GAAP (Note 2 (a)) |
Providência Pro Forma Adjustments (Note 2 (b)) |
Offering and Adjustments (Note 3) |
Pro Forma Combined |
|||||||||||||||
| USD | USD | USD | USD | USD | ||||||||||||||||
| Net sales |
$ | 1,859,914 | $ | 145,764 | $ | — | $ | $ | 2,005,678 | |||||||||||
| Cost of goods sold |
(1,526,406 | ) | (123,550 | ) | 822 | (1,649,134 | ) | |||||||||||||
|
|
|
|
|
|
|
|
|
|
|
|||||||||||
| Gross profit |
333,508 | 22,214 | 822 | 356,544 | ||||||||||||||||
| Selling, general and administrative expenses |
(254,280 | ) | (26,754 | ) | 544 | (280,490 | ) | |||||||||||||
| Special charges, net |
(59,185 | ) | (8,728 | ) | 27,280 | (40,633 | ) | |||||||||||||
| Other operating, net |
(1,845 | ) | (1,501 | ) | — | (3,346 | ) | |||||||||||||
|
|
|
|
|
|
|
|
|
|
|
|||||||||||
| Operating income (loss) |
18,198 | (14,769 | ) | 28,646 | 32,075 | |||||||||||||||
| Other income (expense): |
||||||||||||||||||||
| Interest expense |
(96,153 | ) | (5,782 | ) | (9,242 | ) | (111,177 | ) | ||||||||||||
| Debt modification and extinguishment costs |
(15,725 | ) | — | 13,138 | (2,587 | ) | ||||||||||||||
| Foreign currency and other, net |
(27,083 | ) | 631 | (16,552 | ) | (43,004 | ) | |||||||||||||
|
|
|
|
|
|
|
|
|
|
|
|||||||||||
| Income (loss) before income taxes |
(120,763 | ) | (19,920 | ) | 15,990 | (124,693 | ) | |||||||||||||
| Income tax (provision) benefit |
1,523 | (1,307 | ) | (5,616 | ) | (5,400 | ) | |||||||||||||
|
|
|
|
|
|
|
|
|
|
|
|||||||||||
| Net income (loss) |
(119,240 | ) | (21,227 | ) | 10,374 | (130,093 | ) | |||||||||||||
| Less: Earnings attributable to noncontrolling interest and redeemable noncontrolling interest |
(3,943 | ) | (6,103 | ) | 473 | (9,573 | ) | |||||||||||||
|
|
|
|
|
|
|
|
|
|
|
|||||||||||
| Net income (loss) attributable to PGI Specialty Materials, Inc. |
$ | (115,297 | ) | $ | (15,124 | ) | $ | 9,901 | $ | $ | (120,520 | ) | ||||||||
|
|
|
|
|
|
|
|
|
|
|
|||||||||||
| Per share data: |
||||||||||||||||||||
| Common shareholders per share |
||||||||||||||||||||
| Basic and Diluted |
$ | (467.89 | ) | |||||||||||||||||
|
|
|
|||||||||||||||||||
| Weighted Average Shares Outstanding |
||||||||||||||||||||
| Basic and Diluted |
292,178 | |||||||||||||||||||
|
|
|
|||||||||||||||||||
54
Table of Contents
Notes to Unaudited Pro Forma Condensed Combined Financial Information
Note 1. Basis of Presentation
The unaudited pro forma condensed combined financial information herein is based upon the historical consolidated financial statements of the Company and Providência and has been prepared to illustrate the effects of the Transactions and the Offering in accordance with GAAP and pursuant to Article 11 of Regulation S-X as if they had occurred on December 29, 2013.
The following unaudited pro forma condensed combined financial statements give effect to the Providência Acquisition under the acquisition method of accounting in accordance with ASC 805. ASC 805 requires, among other things, that the assets acquired and liabilities assumed be recognized at their acquisition date fair values, with any excess of the consideration transferred over the estimated fair values of the identifiable net assets acquired recorded as goodwill. The estimated fair values of Providência assets acquired, liabilities assumed and resulting goodwill are subject to adjustment as the Company finalizes its fair value analysis. The Company has not completed the detailed valuation work necessary to arrive at the required estimates of the fair value of Providência net assets and related allocation of purchase price. The Company is still waiting for additional information to finalize the valuation of its acquired intangible assets and property, plant and equipment as well as the accounting for certain tax matters. The Company expects to complete its final purchase price allocation during the second quarter of 2015. Upon completion of detailed valuation studies and the final determination of fair value, the Company may make additional adjustments to the fair value allocation, which may differ significantly from the valuations set forth in the unaudited pro forma condensed combined financial information.
For purposes of measuring the estimated fair value, where applicable, of the assets acquired and the liabilities assumed as reflected in the unaudited pro forma condensed combined financial information, the Company has applied the guidance in ASC 820, Fair Value Measurements and Disclosures (“ASC 820”), which establishes a framework for measuring fair value. In accordance with ASC 820, fair value is an exit price and is defined as “the price that would be received to sell an asset or paid to transfer a liability in an orderly transaction between market participants at the measurement date.” Under ASC 805, acquisition-related transaction costs and acquisition-related restructuring charges are not included as components of consideration transferred but are accounted for as expenses in the period in which the costs are incurred.
Following the Providência Acquisition, we indirectly own approximately 71.25% of the outstanding capital stock of Providência. As required by Brazilian law, we intend to launch, subject to CVM approval, the Mandatory Tender Offer. While we intend to acquire the remaining outstanding capital stock of Providência pursuant to the Mandatory Tender Offer, there is no assurance that we will be able to do so. If we do acquire more shares, our combined statements of operations will reflect lower earnings attributable to redeemable noncontrolling interest for the percentage of Providência capital stock that we acquire. For the purposes of the following unaudited pro forma condensed combined financial information, we have assumed that we only own approximately 71.25% of the outstanding capital stock of Providência.
The historical financial statements of Providência have been prepared in accordance with IFRS as issued by the IASB. Any differences in accounting principles between IFRS and GAAP as they apply to Providência have been adjusted to reflect such results in accordance with GAAP. Adjustments have also been made to conform Providência’s accounting policies to the Company’s. In addition, Providência has historically reported its financial statements in its local currency, the Brazilian real (“BRL” or R$). In order to present the pro forma condensed combined financial statements in U.S. dollars, Providência’s statement of operations has been translated using the weighted-average exchange rate for the applicable period.
The unaudited pro forma condensed combined financial information does not reflect ongoing cost savings that the Company expects to achieve as a result of the Providência Acquisition or the costs necessary to achieve these costs savings or synergies.
55
Table of Contents
Note 2. Providência Acquisition
(a) Providência GAAP
Financial information reported under the column heading “Providência GAAP” represents unaudited Providência’s historical financial information prepared in accordance with IFRS (“Providência As Reported”) prior to the Providência Acquisition, translated from Providência’s local currency, the Brazilian real, to the U.S. dollar (“Providência Translated”) and adjusted to reflect Providência’s financial information on a GAAP basis and in accordance with the Company’s accounting policies (“Providência GAAP Adjustments”). These Providência GAAP Adjustments are unaudited. A reconciliation of Providência’s As Reported financial information to amounts presented in the unaudited pro forma condensed combined statement of operations under the column heading “Providência GAAP” is as follows:
| Period | Ended June 10, 2014 |
A reconciliation of Providência’s As Reported financial information to amounts presented in the unaudited pro forma condensed combined statement of operations under the column heading “Providência GAAP” for the period January 1, 2014 through June 10, 2014 is as follows:
Providência
Consolidated Statement of Operations
IFRS to GAAP Reconciliation
For the Period January 1, 2014 through June 10, 2014
| Providência, As Reported (BRL)(A) |
Providência Translated (USD)(B) |
Providência GAAP Adjustments (USD) |
Providência GAAP (USD) |
|||||||||||||||
| in thousands | ||||||||||||||||||
| Net sales |
R$ | 330,320 | $ | 143,260 | $ | 2,504 | E | $ | 145,764 | |||||||||
| Cost of goods sold |
(262,091 | ) | (113,669 | ) | (9,881 | ) | C, D, E | (123,550 | ) | |||||||||
|
|
|
|
|
|
|
|
|
|||||||||||
| Gross profit |
68,229 | 29,591 | (7,377 | ) | 22,214 | |||||||||||||
| Selling, general and administrative expenses |
(80,484 | ) | (34,906 | ) | 8,152 | C,E | (26,754 | ) | ||||||||||
| Special charges, net |
— | — | (8,728 | ) | E | (8,728 | ) | |||||||||||
| Other operating, net |
(311 | ) | (135 | ) | (1,366 | ) | E | (1,501 | ) | |||||||||
|
|
|
|
|
|
|
|
|
|||||||||||
| Operating income (loss) |
(12,566 | ) | (5,450 | ) | (9,319 | ) | (14,769 | ) | ||||||||||
| Other income (expense): |
||||||||||||||||||
| Interest expense |
(11,668 | ) | (5,060 | ) | (722 | ) | E | (5,782 | ) | |||||||||
| Foreign currency and other, net |
(2,773 | ) | (1,203 | ) | 1,834 | E | 631 | |||||||||||
|
|
|
|
|
|
|
|
|
|||||||||||
| Income (loss) before income taxes |
(27,007 | ) | (11,713 | ) | (8,207 | ) | (19,920 | ) | ||||||||||
| Income tax (provision) benefit |
(9,455 | ) | (4,101 | ) | 2,794 | F | (1,307 | ) | ||||||||||
|
|
|
|
|
|
|
|
|
|||||||||||
| Net income (loss) |
R$ | (36,462 | ) | $ | (15,814 | ) | $ | (5,413 | ) | $ | (21,227 | ) | ||||||
|
|
|
|
|
|
|
|
|
|||||||||||
The following is a summary of the adjustments reflected in the above IFRS to GAAP Reconciliation for the period ended June 10, 2014:
| A. | Represents historical financial information of Providência prepared in accordance with IFRS for the period January 1, 2014 through June 10, 2014, the date of the Providência Acquisition, and presented on a consistent format with the Company’s financial statement presentation. |
| B. | Historical financial information of Providência has been translated to U.S. dollars using the weighted-average rate of R$1.00 to $0.4337 for the period January 1, 2014 through June 10, 2014. |
| C. | In 2007, Providência was acquired by a group of private investors for an aggregate purchase price of R$932 million. In addition, Providência acquired ISOFILME in 2007, which was purchased for an |
56
Table of Contents
| aggregate purchase price of R$43.0 million (together the “Historical Providência Transactions”). For the Historical Providência Transactions, in accordance with local generally accepted accounting principles (prior to Providência adopting IFRS), Providência did not reflect the step-up in basis of its property, plant and equipment to fair value, resulting in a GAAP adjustment to increase Cost of goods sold and Selling, general and administrative expenses by $1.4 million and $0.1 million, respectively, for additional depreciation on the step-up basis of the acquired property, plant and equipment. |
| D. | Providência adopted IFRS during 2010. As part of the first time adoption, a retrospective revaluation adjustment was allowed to adjust the historical cost of property, plant and equipment to its current fair value with a corresponding adjustment to equity. Under GAAP, property, plant and equipment is recognized at historical cost and revaluation adjustments are not permitted. As such, a GAAP adjustment was recorded to reverse the revaluation adjustments recognized under IFRS, which resulted in a lower depreciation under GAAP, and a decrease to Cost of goods sold by $3.0 million. |
| E. | The historical financial information of Providência presented has been adjusted by reclassifying certain line items in order to conform to the Company’s financial statement presentation and by recording certain adjustments to align accounting policies. |
| The reclassification to conform to the Company’s financial statement presentation is as follows: |
| For the Period January 1, 2014 through June 10, 2014 |
||||
| Net Sales |
(0.3 | )(1) | ||
| Selling, general and administrative expenses |
8.7 | (2) | ||
| Special charges, net |
(8.7 | )(2) | ||
| Other operating, net |
(1.4 | )(3) | ||
| Interest expense |
(0.7 | )(3) | ||
| Foreign currency and other, net |
2.4 | (3) | ||
| (1) | The decrease in Net sales relates to adjustments of Providência’s revenue recognition presentation to that of the Company’s. |
| (2) | The decrease in Selling, general and administrative expenses and the increase in Special charges, net of $8.7 million relates to the reclassification of acquisition-related costs incurred by Providência associated with the Providência Acquisition. Per the Company’s financial statement presentation, such costs are presented within Special charges, net. |
| (3) | The increase in other operating, net and in interest expense and the decrease in Foreign currency and other, net primarily relates to the reclassification of Providência derivatives. Per the Company’s financial statement presentation, changes in the fair value of foreign exchange contracts and call option contracts are recorded within Other operating, net and of interest rate swaps are recorded within Interest expense. |
| Adjustments made to align Providência’s accounting policies to the Company’s are as follows: |
| For the Period January 1, 2014 through June 10, 2014 |
||||
| Net Sales |
2.8 | (1) | ||
| Cost of good sold |
(11.4 | )(2) | ||
| Selling, general and administrative expenses |
(0.4 | )(3) | ||
| Foreign currency and other, net |
(0.6 | )(4) | ||
| (1) | The increase in Net sales relates to the aligning of Providência’s revenue recognition policies to that of the Company’s. |
57
Table of Contents
| (2) | The increase in Cost of goods sold is driven by $2.2 million from the aligning of revenue recognition policies, $4.6 million from conforming capitalization policies and a further $4.6 million of aligning the useful lives of property, plant and equipment. |
| (3) | The increase in Selling, general and administrative expenses relates to the conforming of capitalization policies. |
| (4) | The increase in Foreign currency and other, net relates to the foreign currency impact associated with the aligning of Providência revenue recognition policies and other non-operating transactions to that of the Company. |
| F. | Adjustment reflects the income tax effects of the Providência GAAP Adjustments calculated at the statutory rates in effect in each significant jurisdiction for the time periods presented. This rate does not reflect Providência’s effective tax rate, which includes other income tax items, such as foreign taxes, as well as other income tax charges or benefits, and does not take into account any historical or possible future tax events that may impact Providência. |
(b) Providência Pro Forma Adjustments
The preliminary allocation of the purchase price of the Providência Acquisition is as follows:
| In thousands |
June 11, 2014 | |||
| Cash |
$ | 20,621 | ||
| Accounts receivable |
52,929 | |||
| Inventory |
34,077 | |||
| Other current assets |
31,848 | |||
|
|
|
|||
| Total current assets |
139,475 | |||
|
|
|
|||
| Property, plant and equipment |
305,306 | |||
| Goodwill |
133,647 | |||
| Intangible assets |
19,000 | |||
| Other noncurrent assets |
12,288 | |||
|
|
|
|||
| Total assets acquired |
$ | 609,716 | ||
|
|
|
|||
| Current liabilities |
$ | 31,605 | ||
| Total debt |
74,930 | |||
| Deferred income taxes |
(4,435 | ) | ||
| Other noncurrent liabilities |
1,992 | |||
|
|
|
|||
| Total liabilities assumed |
$ | 104,092 | ||
|
|
|
|||
| Redeemable noncontrolling interest |
80,792 | |||
|
|
|
|||
| Net assets acquired |
$ | 424,832 | ||
|
|
|
|||
The estimated fair values of Providência assets acquired, liabilities assumed and resulting goodwill are subject to adjustment as the Company finalizes its fair value analysis. The Company has not completed the detailed valuation work necessary to arrive at the required estimates of the fair value of Providência net assets and related allocation of purchase price. The Company is still waiting for additional information to finalize the valuation of its acquired intangible assets and property, plant and equipment as well as the accounting for certain tax matters. The Company expects to complete its final purchase price allocation during the second quarter of 2015. A decrease in the fair value of assets acquired or an increase in the fair value of liabilities assumed in the Providência Acquisition from those preliminary valuations presented in the Company’s audited consolidated financial statements would impact the amount of goodwill. In addition, if the value of the acquired assets is higher than the preliminary indication, it may result in higher amortization and depreciation expense than is presented in these unaudited pro forma condensed combined statements of operations.
58
Table of Contents
The following is a summary of the material adjustments for amounts reported in the unaudited pro forma condensed combined statements of operations under the “Providência Pro Forma Adjustments” column heading for the year ended December 31, 2014:
Cost of goods sold—Represents the preliminary adjustment to depreciation expense associated with the change in fair value of the property, plant and equipment recorded in relation to the Providência Acquisition. Based upon a preliminary valuation analysis, the fair value of acquired property, plant and equipment was $305 million. The estimated fair value of property, plant and equipment is expected to be amortized on a straight-line basis over the estimated average remaining useful life of 18 years. Depreciation expense has been estimated based upon the nature of activities associated with the property, plant and equipment acquired. Therefore, for purposes of this pro forma statement of operations, the Company has reflected a reduction of $0.9 million of estimated depreciation expense.
With other assumptions held constant, a change of 1 year in the useful life of the property, plant and equipment would result in a $1.2 million change in annual depreciation expense. With other assumptions held constant, a change of 10% in the fair value of the property, plant and equipment would result in a $1.7 million change in annual depreciation expense.
Selling, general and administrative expense—Adjustment represents the preliminary depreciation and amortization expense associated with the change in fair value of the property, plant and equipment and intangible assets recorded in relation to the Providência Acquisition. The net adjustments to Selling, general and administrative expenses is comprised of the following (dollars in millions):
| Fiscal Year Ended December 31, 2014 |
||||
| Pro forma adjustment to depreciation expense of property, plant and equipment(1) |
$ | 0.1 | ||
| Pro forma adjustment to amortization expense of intangible assets(2) |
0.4 | |||
|
|
|
|||
| Pro forma adjustment to Selling, general and administrative expenses |
$ | 0.5 | ||
|
|
|
|||
| (1) | For a discussion of Pro forma adjustment to depreciation expense of property, plant and equipment see footnote to the Cost of goods sold Pro Forma adjustment described above. |
| (2) | Represents the preliminary adjustment to amortization expense associated with the change in fair value of intangible assets recorded in relation to the Providência Acquisition. Based upon a preliminary valuation analysis, the fair value of acquired intangible assets, which consist of customer relationships, was $19.0 million. The estimated fair value of amortizable intangible assets is expected to be amortized on a straight-line basis over the estimated useful lives of 15 years. Amortization expense has been estimated based upon the nature of activities associated with the intangible assets acquired. Therefore, for purposes of this pro forma statements of operations, the Company has reflected a reduction of $0.4 million of amortization expense. |
With other assumptions held constant, a change of 1 year in the useful life of the intangible assets would result in a $0.1 million change in annual amortization expense. With other assumptions held constant, a change of 10% in the fair value of the intangible assets would result in a $0.1 million change in annual amortization expense.
59
Table of Contents
Special charges—The net adjustment to Special charges is calculated as follows (dollars in millions):
| Fiscal Year Ended December 31, 2014 |
||||
| Acquisition-related costs associated with the Providência Acquisition incurred by the Company(1) |
$ | 18.6 | ||
| Acquisition-related costs associated with the Providência Acquisition incurred by Providência(2) |
8.7 | |||
|
|
|
|||
| Pro forma adjustment to Special charges |
$ | 27.3 | ||
|
|
|
|||
| (1) | Adjustment represents the removal of $18.6 million of acquisition-related costs incurred by the Company associated with the Providência Acquisition during the year ended December 31, 2014 as such amounts are directly attributable to the Providência Acquisition and will not have a continuing impact on the combined results. |
| (2) | Adjustment represents the removal of $8.7 million of acquisition-related costs incurred by Providência associated with the Providência Acquisition during the period ended June 10, 2014 as such amounts are directly attributable to the Providência Acquisition and will not have a continuing impact on the combined results. |
Interest expense—Adjustment reflects the estimated interest expense that would have been incurred by the Company during the historical periods presented assuming the Transactions had occurred as of December 29, 2013 (dollars in millions):
| Fiscal Year Ended December 31, 2014 |
||||
| Reversal of Providência’s historical interest expense, including amortization of debt issuance costs, related to debt not assumed for the period January 1, 2014 through June 10, 2014 |
$ | 4.2 | ||
| Reversal of Providência’s historical expense related to changes in the fair value of interest rate swaps not assumed for the period January 1, 2014 through June 10, 2014(1) |
1.0 | |||
| Amortization of capitalized debt issuance costs related to new borrowings for the period December 29, 2013 through June 10, 2014(2) |
(1.0 | ) | ||
| Estimated interest expense on senior unsecured notes at 6.875% for the period December 29, 2013 through June 10, 2014(3) |
(6.3 | ) | ||
| Estimated interest expense on Additional Term Loans at 5.25% for the period December 29, 2013 through June 10, 2014(3) |
(7.1 | ) | ||
|
|
|
|||
| Pro forma adjustment to Interest expense |
$ | (9.2 | ) | |
|
|
|
|||
| (1) | Providência historically used derivative instruments to reduce the exposure to fluctuations in interest rates. The Company has eliminated the change in the fair value of such interest rate swaps not assumed as part of the Providência Acquisition; the respective impacts are reduced expenses of $1.0 million for the year ended December 31, 2014. |
| (2) | The Company incurred in total $21.3 million in debt issuance costs in conjunction with the senior unsecured notes and the Additional Term Loans which comprises $10.6 million of capitalized debt issuance costs and $10.7 million of debt issuance costs expensed as incurred based on ASC Topic 470, Debt (“ASC 470”). For purposes of these pro forma statements of operations, the Company has reversed the $10.7 million debt issuance costs expensed as such expenses are directly attributable to the Providência Refinancing and will not have a continuing impact on the combined results (see footnote to the Debt modification and extinguishment costs Pro Forma adjustments described below). The capitalized debt issuance costs of $10.6 million associated with the new borrowings will be amortized over approximately five years. Therefore, for purposes of this pro forma statement of operations, the Company has reflected $1.0 million of amortization expense of capitalized debt issuance costs related to new borrowings for the period ended June 10, 2014. |
60
Table of Contents
| (3) | On June 10, 2014, we entered into the Incremental Amendment, pursuant to which the Company obtained $415.0 million of commitments for incremental term loans from the existing lenders, of which the Company borrowed $310 million of Additional Term Loans. The remaining $105.0 million of commitments were available for borrowing until December 31, 2014 and were used to repay existing indebtedness during the third quarter of 2014. Borrowings bear interest at a fluctuating rate per annum equal to, at our option, (i) a base rate equal to the highest of (a) the federal funds rate plus 1⁄2 of 1%, (b) the rate of interest in effect for such day as publicly announced from time to time by Citicorp North America, Inc. as its “prime rate” and (c) the LIBOR rate for a one-month interest period plus 1.0% (provided that in no event shall such base rate with respect to the Term Loans be less than 2.0% per annum), in each case plus an applicable margin of 3.25% or (ii) a LIBOR rate for the applicable interest period (provided that in no event shall such LIBOR rate with respect to the Term Loans be less than 1.0% per annum) plus an applicable margin of 4.25%. The applicable margin for the Term Loans is subject to one 25 basis point step-down upon the achievement of a senior secured net leverage ratio of 3.50:1.00. We are required to repay installments on the Term Loans in quarterly installments in aggregate amounts equal to 1.0% per annum of their funded total principal amount, with the remaining amount payable on the maturity date. In addition, in connection with the Providência Acquisition, we issued on June 11, 2014 $210.0 million aggregate principal amount of 6.875% senior unsecured notes due 2019. |
The Additional Term Loans have a variable interest rate with a floor of 5.25%; however an increase of 1/8% (12.5 basis points) in the interest rate on the Company’s Additional Term Loans would result in a $0.4 million increase in our annual interest expense. An increase of 1/8% (12.5 basis points) in the interest rate on all of the Company’s total variable rate debt (including the Additional Term Loans) would result in a $0.8 million change in our annual interest expense.
Debt modification and extinguishment costs—The net adjustment to Debt modification and extinguishment costs is calculated as follows (dollars in millions):
| Fiscal Year Ended December 31, 2014 |
||||
| Reversal of debt issuance costs expensed as incurred associated with the Providência Refinancing(1) |
$ | 10.7 | ||
| Reversal of debt extinguishment costs associated with the Providência Refinancing(2) |
2.4 | |||
|
|
|
|||
| Pro forma adjustment to Debt modification and extinguishment costs |
$ | 13.1 | ||
|
|
|
|||
| (1) | The Company incurred in total $21.3 million in debt issuance costs in conjunction with the senior unsecured notes and the Additional Term Loans which comprises $10.6 million of capitalized debt issuance costs and $10.7 million of debt issuance costs expensed as incurred based on ASC 470 during the year ended December 31, 2014. For purposes of these pro forma statements of operations, we have reversed the $10.7 million debt issuance costs expensed as such expenses are directly attributable to the Providência Refinancing and will not have a continuing impact on the combined results. |
| (2) | On September 22, 2014, the Company entered into an assignment agreement with Itaú Unibanco S.A in order to transfer its rights and obligations under the agreement to the Company. The purchase price was funded with a portion of the proceeds from the Incremental Amendment. Pursuant to ASC 470, we recognized a loss on debt extinguishment of $2.4 million during the year ended December 31, 2014. A pro forma adjustment has been recorded to eliminate the $2.4 million debt extinguishment costs expensed as such expense is directly attributable to the Providência Refinancing and will not have a continuing impact on the combined results. |
61
Table of Contents
Foreign currency and other, net—The net adjustment to Foreign currency and other, net is calculated as follows (dollars in millions):
| Fiscal Year Ended December 31, 2014 |
||||
| Reversal of foreign exchange gains associated with the Providência Acquisition(1) |
$ | (18.9 | ) | |
| Reversal of Providência’s historical foreign currency impacts related interest rate swaps not assumed for the period January 1, 2014 through June 10, 2014(2) |
2.3 | |||
|
|
|
|||
| Pro forma adjustment to Foreign currency and other, net |
$ | (16.6 | ) | |
|
|
|
|||
| (1) | The Company entered into a series of financial instruments used to minimize foreign exchange risk on the future consideration to be paid for the Providência Acquisition and the Deferred Purchase Price. For purposes of these pro forma statements of operations, we have eliminated the $18.9 million foreign exchange gains associated with such financial instruments for the year ended December 31, 2014 as such gains will not have a continuing impact on the combined results. |
| (2) | Providência historically used derivative instruments to reduce the exposure to fluctuations in interest rates. Certain of these interest rate swaps were denominated in USD which resulted in foreign currency impacts recorded in the historical financial information of Providência. The Company has eliminated the historical foreign currency impacts of such interest rate swaps not assumed as part of the Providência’s acquisition of $2.3 million for the period ended June 10, 2014. |
Income tax (provision) benefit—Adjustment reflects the income tax effects of the pro forma adjustments made to the pro forma statements of operations calculated at the combined federal and state statutory rates in effect in each significant jurisdiction for the time periods presented. This rate, 35.1%, does not reflect the Company’s effective tax rate, which includes other income tax items, such as foreign taxes, as well as other income tax charges or benefits, and does not take into account any historical or possible future tax events that may impact the combined company. Fair value and other adjustments effective at the closing of the Providência Acquisition could be different based on factors including but not limited to tax rates, valuation differences, further information on taxes by jurisdiction, or other factors.
Earnings attributable to noncontrolling interest and to redeemable noncontrolling interest—Noncontrolling interest and redeemable noncontrolling interest represent the minority partners’ interest in the income or loss of consolidated subsidiaries which are not wholly-owned by the Company. For the purposes of the unaudited pro forma condensed combined financial information, we have assumed that we only own approximately 71.25% of the outstanding capital stock of Providência.
Note 3. The Offering
Reflects shares of common stock to be sold in this offering and the application of net proceeds of approximately $ therefrom to be received by us, assuming an initial public offering price of $ per share, the midpoint of the offering range set forth on the cover page of this prospectus, after deducting the estimated underwriting discounts and commissions and estimated offering expenses payable by us.
We intend to use a portion of the net proceeds received by us from this offering to repay $ million of our outstanding indebtedness, resulting in a decrease in pro forma interest expense of $ and $ for the the fiscal year ended December 31, 2014, respectively. This pro forma interest expense adjustment is inclusive of the reversal of amortization of deferred financing fees recognized during the fiscal year ended December 31, 2014 related to the indebtedness being repaid. Additionally, as a result of extinguishing our borrowings as discussed above, we will write-off $ in deferred financing costs; however, this charge has not been reflected in the unaudited pro forma condensed combined statements of operations as it is not expected to have a continuing impact on our operations.
62
Table of Contents
In connection with this offering, we intend to terminate the Advisory Agreement in accordance with its terms. We will use approximately $ million of the net proceeds to us from this offering to pay a one-time termination fee to affiliates of the Sponsor in connection with the termination of the Advisory Agreement. See “Certain Relationships and Related Party Transactions—Advisory Agreement.” The unaudited pro forma condensed combined statements of operations do not reflect the impacts on special charges, net of an increase of $ million related to this one-time termination fee as this amount is directly related to this offering and is not expected to have a continuing impact on our operations.
We intend to use any remaining proceeds received by us from this offering for general corporate purposes.
63
Table of Contents
SELECTED HISTORICAL CONSOLIDATED FINANCIAL DATA
The selected historical consolidated financial data presented below for, and as of the end of, the fiscal years ended December 31, 2014, December 28, 2013 and December 29, 2012, has been derived from our audited consolidated financial statements included elsewhere in this prospectus. The selected historical consolidated financial data presented below for, and as of the end of, the fiscal year ended December 31, 2011 for the Successor, and the one month ended January 28, 2011, and the fiscal year ended January 1, 2011 for the Predecessor has been derived from our audited consolidated financial statements not included in this prospectus. Our historical results are not necessarily indicative of the results expected for any future period.
You should read the selected consolidated financial data below together with our audited consolidated financial statements included elsewhere in this prospectus including the related notes thereto appearing elsewhere in this prospectus, as well as “Management’s Discussion and Analysis of Financial Condition and Results of Operations,” and the other financial information included elsewhere in this prospectus.
| (in thousands, except for per share data) | Fiscal Year Ended December 31, 2014 (Successor) |
Fiscal Year Ended December 28, 2013 (Successor) |
Fiscal Year Ended December 29, 2012 (Successor) |
Fiscal Year Ended December 31, 2011 (Successor) |
One Month Ended January 28, 2011 (Predecessor) |
Fiscal Year Ended January 1, 2011 (Predecessor) |
||||||||||||||||||
| Statement of Operations Data: |
||||||||||||||||||||||||
| Net sales |
$ | 1,859,914 | $ | 1,214,862 | $ | 1,155,163 | $ | 1,102,929 | $ | 84,606 | $ | 1,106,211 | ||||||||||||
| Cost of goods sold |
(1,526,406 | ) | (1,018,806 | ) | (957,917 | ) | (932,523 | ) | (68,531 | ) | (896,319 | ) | ||||||||||||
|
|
|
|
|
|
|
|
|
|
|
|
|
|||||||||||||
| Gross profit |
333,508 | 196,056 | 197,246 | 170,406 | 16,075 | 209,892 | ||||||||||||||||||
| Selling, general and administrative expenses |
(254,280 | ) | (153,188 | ) | (140,776 | ) | (134,483 | ) | (11,564 | ) | (141,461 | ) | ||||||||||||
| Special charges, net |
(59,185 | ) | (33,188 | ) | (19,592 | ) | (41,345 | ) | (20,824 | ) | (17,993 | ) | ||||||||||||
| Acquisition and integration expenses |
— | — | — | — | — | (1,742 | ) | |||||||||||||||||
| Other operating, net |
(1,845 | ) | (2,512 | ) | 287 | (2,634 | ) | 564 | 815 | |||||||||||||||
|
|
|
|
|
|
|
|
|
|
|
|
|
|||||||||||||
| Operating income (loss) |
18,198 | 7,168 | 37,165 | (8,056 | ) | (15,749 | ) | 49,511 | ||||||||||||||||
| Other income (expense): |
||||||||||||||||||||||||
| Interest expense |
(96,153 | ) | (55,974 | ) | (50,414 | ) | (46,409 | ) | (1,922 | ) | (31,728 | ) | ||||||||||||
| Debt modification and extinguishment costs |
(15,725 | ) | (3,334 | ) | — | — | — | — | ||||||||||||||||
| Foreign currency and other, net |
(27,083 | ) | (8,851 | ) | (5,134 | ) | (18,636 | ) | (82 | ) | (1,454 | ) | ||||||||||||
|
|
|
|
|
|
|
|
|
|
|
|
|
|||||||||||||
| Income (loss) before income taxes |
(120,763 | ) | (60,991 | ) | (18,383 | ) | (73,101 | ) | (17,753 | ) | 16,329 | |||||||||||||
| Income tax (provision) benefit |
1,523 | 36,024 | (7,655 | ) | 3,272 | (549 | ) | (4,534 | ) | |||||||||||||||
|
|
|
|
|
|
|
|
|
|
|
|
|
|||||||||||||
| Income (loss) from continuing operations |
$ | (119,240 | ) | $ | (24,967 | ) | $ | (26,038 | ) | $ | (69,829 | ) | $ | (18,302 | ) | $ | 11,795 | |||||||
|
|
|
|
|
|
|
|
|
|
|
|
|
|||||||||||||
| Discontinued operations, net of tax |
— | — | — | (6,283 | ) | 182 | (765 | ) | ||||||||||||||||
|
|
|
|
|
|
|
|
|
|
|
|
|
|||||||||||||
| Net income (loss) |
(119,240 | ) | (24,967 | ) | (26,038 | ) | (76,112 | ) | (18,120 | ) | 11,030 | |||||||||||||
| Earnings attributable to noncontrolling interest and redeemable noncontrolling interest |
(3,943 | ) | (34 | ) | — | 59 | 83 | 623 | ||||||||||||||||
|
|
|
|
|
|
|
|
|
|
|
|
|
|||||||||||||
| Net income (loss) attributable to PGI Specialty Materials, Inc. |
$ | (115,297 | ) | $ | (24,933 | ) | $ | (26,038 | ) | $ | (76,171 | ) | $ | (18,203 | ) | $ | 10,407 | |||||||
|
|
|
|
|
|
|
|
|
|
|
|
|
|||||||||||||
| Weighted average shares outstanding, basic |
292,178 | 264,998 | 260,403 | 259,895 | 21,626,038 | 20,785,000 | ||||||||||||||||||
| Basic Earnings (Loss) Per Share |
$ | (467.89 | ) | $ | (94.09 | ) | $ | (99.99 | ) | $ | (268.91 | ) | $ | (0.85 | ) | $ | 0.54 | |||||||
| Loss from discontinued operations |
— | — | — | (24.18 | ) | 0.01 | (0.04 | ) | ||||||||||||||||
| Basic Net Income (Loss) per Share |
$ | (467.89 | ) | $ | (94.09 | ) | $ | (99.99 | ) | $ | (293.09 | ) | $ | (0.84 | ) | $ | 0.50 | |||||||
| Weighted average shares outstanding, diluted |
292,178 | 264,998 | 260,403 | 259,895 | 21,626,038 | 21,196,000 | ||||||||||||||||||
| Diluted Earnings (Loss) Per Share |
$ | (467.89 | ) | $ | (94.09 | ) | $ | (99.99 | ) | $ | (268.91 | ) | $ | (0.85 | ) | $ | 0.53 | |||||||
| Loss from discontinued operations |
— | — | — | (24.18 | ) | 0.01 | (0.04 | ) | ||||||||||||||||
| Diluted Net Income (Loss) Per Share |
$ | (467.89 | ) | $ | (94.09 | ) | $ | (99.99 | ) | $ | (293.09 | ) | $ | (0.84 | ) | $ | 0.49 | |||||||
64
Table of Contents
MANAGEMENT’S DISCUSSION AND ANALYSIS OF FINANCIAL CONDITION
AND RESULTS OF OPERATIONS
The following discussion and analysis provides information which management believes is relevant to an assessment and understanding of our consolidated results of operations and financial condition. The discussion should be read in conjunction with the “Summary—Summary Historical and Pro Forma Condensed Combined Financial Information,” “Selected Historical Consolidated Financial Data” and our consolidated financial statements and notes thereto incorporated by reference in this prospectus. It should be noted that our gross profit margins may not be comparable to other companies since some entities classify shipping and handling costs in cost of goods sold and others, including us, include such costs in selling, general and administrative expenses. Similarly, some entities, including us, include foreign currency gains and losses resulting from operating activities as a component of operating income, and some entities classify all foreign currency gains and losses outside of operating income. The following discussion may contain forward-looking statements that reflect our plans, estimates and beliefs. Out actual results could differ materially from those discussed in these forward-looking statements. Factors that could cause or contribute to these differences include those factors discussed below and elsewhere in this prospectus, particular in the “Risk Factors” and “Forward-Looking Statements.”
Overview
We are a leading global innovator and manufacturer of specialty materials for use in a broad range of products that make the world safer, cleaner and healthier. We design and manufacture versatile high performance materials that can be engineered to possess specific value-added characteristics, including absorbency, tensile strength, softness and barrier properties. We serve customers focused on personal care, infection prevention, and high performance solutions, where our products are critical components used in a broad array of consumer and commercial products. For personal care applications, we supply specialty materials essential to the performance and feel of disposable baby diapers, feminine hygiene products, adult incontinence products, personal wipes and fabric softening dryer sheets. For infection prevention applications, our materials are utilized in products designed to ensure a clean environment, including disinfectant wipes, surgical gowns and drapes, face masks, wound care sponges, and water, air and blood filters. For high performance solutions, we supply protective house wrap, industrial cable wrap, construction and agricultural geosynthetics, as well as components for home and bedding products, industrial cleaning wipes, and various other applications.
We primarily manufacture nonwovens, which are fabric-like, value-added materials produced from polypropylene and other resins, along with natural and synthetic fibers and other components. The total nonwovens industry size is estimated to be worth in excess of $30 billion globally in 2013 and is expected to grow at a CAGR by volume of 6.6% from 2013 to 2018, according to Smithers Pira.
We are the largest global manufacturer of nonwovens based on our 2013 pro forma net sales, according to Nonwovens Industry. Over the past five years, we have undertaken a series of investments and acquisitions, including the Fiberweb Acquisition in November 2013 and the Providência Acquisition in June 2014, that have expanded our global presence, increased our product portfolio and broadened our technology base. As a result, we estimate that we generated approximately 70% of our 2014 pro forma net sales from applications for which we believe we have either the #1 or #2 position as measured by pro forma net sales or volume. We believe we have one of the largest global platforms in the nonwovens industry, with 22 manufacturing and converting facilities in 14 countries, including a significant presence in high-growth emerging markets such as South America and Asia. We have manufacturing capabilities in each of North America, South America, Europe and Asia, which we believe is a competitive advantage in serving our multi-national, blue-chip customers. Our manufacturing facilities are strategically located near the production facilities of many of our key customers in order to increase our effectiveness in addressing regional demand for our products, many of which do not ship economically over long distances.
65
Table of Contents
Our Industry
We compete primarily in the global nonwovens industry, estimated to be worth in excess of $30 billion globally in 2013 and expected to grow at a CAGR by volume of 6.6% from 2013 to 2018, according to Smithers Pira. Nonwovens are broadly defined as engineered sheet or web structures, made from polymers and/or natural fibers that are bonded together by entangling fiber or filaments mechanically, thermally or chemically. Nonwovens are flat sheets that are made directly from separate fibers or from molten plastic or plastic film and, by definition, are not made by weaving or knitting and do not require converting the fibers to yarn. See “Industry.”
Recent Developments
Dounor Acquisition
On March 25, 2015, we announced that PGI France Holdings SAS, our wholly-owned subsidiary, entered into an agreement to acquire Dounor, a French manufacturer of materials used in hygiene, healthcare and industrial applications. The acquisition of Dounor was completed on April 17, 2015 using the proceeds from borrowings under the Second Incremental Amendment.
European Restructuring
On March 7, 2014, we announced our plan to exit the European roofing business, which we acquired as part of the Fiberweb Acquisition, in an effort to optimize our portfolio. The plan included (1) the possible shutdown of selected manufacturing lines at our Berlin, Germany facility, (2) the possible closure of our manufacturing facility in Aschersleben, Germany with the consolidation of its converting activities to Berlin and (3) possible workforce reductions at both facilities.
In the second quarter of 2014, we commenced negotiations to sell selected equipment used to manufacture roofing materials at our Berlin, Germany location. In July 2014, we ceased production of roofing materials in Berlin and signed a contract to sell one manufacturing line for €1.6 million ($2.0 million) recognizing a $2.0 million gain on the sale. We also commenced negotiations in the third quarter of 2014 to sell the manufacturing facility located in Aschersleben, Germany. In November 2014, we completed such negotiations and entered into a definitive asset purchase and transfer agreement to sell the land, buildings, inventory, machinery and equipment, intellectual property and certain existing contracts for approximately €2.0 million ($2.4 million). As of December 31, 2014, the assets to be sold were reported as assets held for sale and included in Other current assets in the Consolidated Balance Sheets. The transaction closed on January 1, 2015. There will be no gain or loss recognized on the sale of the business since it was determined the proceeds received for the tangible and intangible assets approximated the carrying value of the assets sold.
Providência Acquisition
On January 27, 2014, we announced that Acquisition Co. entered into a stock purchase agreement with Providência and certain shareholders named therein. Pursuant to the terms and subject to the conditions of the stock purchase agreement, Acquisition Co. agreed to acquire an approximately 71.25% controlling interest in Providência. Providência is a leading manufacturer of nonwovens primarily used in hygiene applications as well as industrial and healthcare applications. Based in Brazil, Providência has three manufacturing locations, including one in the United States. Total consideration paid included $47.9 million of deferred purchase price (the “Deferred Purchase Price”) and $8.2 million deposited into an escrow account. The Deferred Purchase Price is held by the Company and relates to certain unaccrued tax claims of Providência (the “Providência Tax Claims”). The Deferred Purchase Price is denominated in Brazilian real and accretes at a rate of 9.5% per annum compounded daily. Upon final resolution of the Providência Tax Claims by the Brazilian court, either tax payments for the Providência Tax Claims will be made to the Brazilian tax authorities or the Deferred Purchase Price will be paid to the selling shareholders.
The Providência Acquisition was completed on June 11, 2014 for an aggregate purchase price of $424.8 million and funded with the proceeds from borrowings under the Incremental Amendment as well as the
66
Table of Contents
proceeds from the issuance of the Senior Unsecured Notes. As required by Brazilian law, we intend to launch, subject to CVM approval, the Mandatory Tender Offer to acquire the remaining outstanding capital stock of Providência from the minority shareholders.
On January 27, 2014, we entered into a series of financial instruments with a third-party financial institution used to minimize foreign exchange risk on the future consideration to be paid for the Providência Acquisition and the Mandatory Tender Offer (the “Providência Contracts”). Each contract allows us to purchase a fixed amounts of Brazilian reals (R$) in the future at specified U.S. dollar rates, coinciding with either the Providência Acquisition or the Mandatory Tender Offer. The primary financial instrument was related to the Providência Acquisition and consisted of a foreign exchange forward contract settled upon consummation of the transaction. The remaining financial instruments relate to a series of options that expire between 1 year and 5 years associated with the Mandatory Tender Offer and the deferred portion of the consideration paid for the Providência Acquisition.
Prior to completing the Providência Acquisition, Providência announced that production on three spunmelt lines at its Sao Jose dos Pinhais manufacturing facility was partially interrupted. The interruption was the result of an order by the Brazilian Ministry of Labor, pending remedial action by Providência to bring the facility into compliance with applicable Brazilian workplace safety regulations. The three lines were shut down from April 1, 2014 until early July 2014 when clearance was received from the Brazilian Ministry of Labor and production resumed. During the shutdown period, the impact to sales volumes is estimated to have been in excess of 6,500 metrics tons during 2014, which represents 5.5% and 5.9% of metric tons sold by Providência in 2014 and 2013, respectively. In addition, the lines experienced certain start-up inefficiencies during the third quarter which continued as the facility began to resume more normalized operations near the end of the third quarter. During the shutdown and the subsequent ramp-up period through the end of 2014, Providência incurred additional costs to bring the manufacturing lines into compliance as well as incurred higher relative overhead costs and increased scrap rates, which negatively impacted operating profit.
Expansion and Optimization Initiatives
Over the past five years, we have undertaken a series of initiatives to expand our global capabilities as well as to focus on operational excellence. Initiatives include capacity expansion projects, plant consolidations, plant alignment, acquisitions and divestitures. We believe these initiatives will help drive performance in our businesses and improve our overall cost structure.
Expansion Initiatives
In order to address the growing demand for hygiene and healthcare products, we have completed four capacity expansions since 2009. In addition, we recently commenced the upgrade of manufacturing lines at our facilities located in Tarragona, Spain and Benson, North Carolina, the expansion of our specialty materials manufacturing capabilities at our San Luis Potosi, Mexico, facility, and have completed an upgrade of a manufacturing line near Buenos Aires, Argentina, and our upgrade of machinery and the expansion of our manufacturing facility in Waynesboro, Virginia. A description of our completed expansion initiatives are as follows:
| • | In the second quarter of 2013, our spunmelt hygiene line in Suzhou, China commenced commercial production. The plant expansion increased capacity to meet demand for nonwoven materials in hygiene applications in China. |
| • | In the third quarter of 2011, our spunmelt line in Waynesboro, Virginia commenced commercial production. The plant expansion increased capacity to meet demand for nonwoven materials in hygiene and healthcare applications in the U.S. |
| • | In the third quarter of 2011, our spunmelt healthcare line in Suzhou, China commenced commercial production. The plant expansion increased capacity to meet demand for nonwoven materials in healthcare applications in China. |
67
Table of Contents
| • | In the second quarter of 2009, our spunmelt line in San Luis Potosi, Mexico commenced commercial production. The plant expansion increased capacity to meet demand for nonwoven materials in hygiene and healthcare applications in the U.S. and Mexico. |
Our expansion projects are funded using a combination of existing cash balances, internal cash flows as well as financing arrangements with third-party financial institutions. We intend to continue to expand in markets we believe have attractive supply and demand characteristics as well as maintain and upgrade manufacturing lines to improve our global competitive position.
Optimization Initiatives
We actively and continuously pursue initiatives to prolong the useful life of our assets through product and process innovation. In some instances, we have determined that our fixed cost structure would be enhanced through consolidation. While investing in several new manufacturing lines in high-growth regions, we have simultaneously undertaken a number of initiatives to rationalize low-margin legacy operations and relocate certain assets to improve our cost structure. These initiatives are intended to result in lower working capital levels and improve operating performance and profitability. Our strategy with respect to past consolidation efforts in the U.S. and Europe was focused on the elimination of costs associated with underutilized legacy capacity. During 2014, we exited the European roofing business, consolidated our German manufacturing operations to Berlin and entered into an agreement to sell the manufacturing operations in Aschersleben. We continually assess our global footprint to determine what we believe is an appropriate and sustainable asset base.
Other Acquisitions and Divestitures
On September 17, 2013, PGI Acquisition Limited, a wholly-owned subsidiary of the Company, entered into an agreement with Fiberweb containing the terms of a cash offer to purchase 100% of the issued and to be issued ordinary share capital of Fiberweb at a cash price of £1.02 per share. The offer was effected by a court sanctioned scheme of arrangement of Fiberweb under Part 26 of the UK Companies Act 2006 and consummated on November 15, 2013, whereby Fiberweb became a wholly-owned subsidiary of the Company. The aggregate purchase price was valued at $287.8 million and funded on November 27, 2013 with the proceeds of borrowings under a $268.0 million Senior Secured Bridge Credit Agreement and a $50.0 million Senior Unsecured Bridge Credit Agreement. The Bridge Facilities were subsequently refinanced, along with transaction expenses, with the proceeds from a $295.0 million Senior Secured Credit Agreement and a $30.7 million equity investment from Blackstone. Fiberweb is one of the largest global manufacturers of specialized technical fabrics with eight production sites in six countries.
On April 29, 2011, we entered into an agreement to sell certain assets and the working capital of Difco Performance Fibers, Inc. (“Difco”) for cash proceeds of $10.9 million. The agreement provided that Difco would continue to produce goods during the three month manufacturing transition services agreement that expired in the third quarter of 2011. The sale was completed on May 10, 2011 and resulted in a loss of $0.7 million recognized during the fiscal year ended December 31, 2011.
The results of operations of Difco, previously included in the North America segment, have been segregated from continuing operations and included in Discontinued operations, net in the Consolidated Statements of Operations as the cash flows of Difco were eliminated from our ongoing operations and we had no continuing involvement in the operations of the business after the disposition.
On May 26, 2010, we signed an equity transfer agreement (the “Nanhai Agreement”) to purchase the remaining 20% interest in our Chinese subsidiary, Nanhai Nanxin Non-Woven Co. Ltd, subject to Chinese government approval. Pursuant to the Nanhai Agreement, we deposited $1.5 million into an escrow account with a bank to serve as a performance guarantee. On March 9, 2011, we received government approval and
68
Table of Contents
subsequently completed the noncontrolling interest acquisition for a purchase price of $7.2 million. The acquisition was accounted as an equity transaction in which no gain or loss was recognized.
On December 2, 2009, we completed an acquisition from Grupo Corinpa S.L (“Grupo Corinpa”) of certain assets and the operations of the nonwovens business of Tesalca-99, S.A. and Texnovo, S.A. located in Barcelona, Spain. Consideration for the acquired assets consisted of 1.049 million shares of the Predecessor’s Class A common stock which had a fair value of $14.5 million on the date of acquisition. The agreement contained a provision under which Grupo Corinpa was granted a put option on its land, building and equipment that were included in a lease under which we were provided full and exclusive use of the assets. In addition, the agreement contained a provision under which we were granted a call option for the same assets. On January 28, 2011, immediately prior to the Merger, we exercised our call option and purchased the remaining assets for an aggregate purchase price of $41.2 million.
Results of Operations
We operate our business on a regional basis with profit accountability aligned with our physical presence. This reflects how the overall business is currently managed by our senior management and reviewed by our Board of Directors. In light of the Providência Acquisition, we realigned our reportable segments during the third quarter of 2014 to more closely reflect our corporate and business strategies and to promote additional productivity and growth. Reportable segments are now as follows: North America, South America, Europe and Asia. The operations previously reported in the Oriented Polymers segment are now included within the North America segment, along with the operations in Mexico. The South America segment includes the Providência operations in Brazil in addition to our previously existing operations in Colombia and Argentina. The Europe and Asia segments remain unchanged.
Gross Profit Drivers
Our net sales are driven principally by the following factors:
| • | Volumes sold, which are tied to our available production capacity and customer demand for our products; |
| • | Prices, which are tied to the quality of our products, the overall supply and demand dynamics in our regional markets, and the cost of our raw material inputs, as changes in input costs have historically been passed through to customers through either contractual mechanisms or business practices. This can result in significant increases in total net sales during periods of sustained raw material cost increases as well as significant declines in net sales during periods of raw material cost declines; and |
| • | Product mix, which is tied to demand from various markets and customers, along with the type of available capacity and technological capabilities of our facilities and equipment. Average selling prices can vary for different product types, which impacts our total revenue trends. |
Our primary costs of goods sold (“COGS”) include:
| • | Raw material costs (primarily polypropylene resins, which generally comprise over 75% of our raw material purchases) represent approximately 60% to 70% of COGS. We purchase raw materials, including polypropylene resins, from a number of qualified vendors located in the regions in which we operate. Polypropylene is a petroleum-based commodity material and its price historically has exhibited volatility. As discussed in the revenue factors above, we have historically been able to mitigate volatility in polypropylene prices through changes in our selling prices to customers, enabling us to maintain a more stable gross profit per kilogram; |
| • | Other variable costs include direct labor, utilities (primarily electricity), maintenance and variable overhead. Utility rates vary depending on the regional market and provider. Labor generally represents |
69
Table of Contents
| less than 10% of COGS and varies by region. Historically, we have been able to mitigate wage rate inflation with operating initiatives resulting in higher productivity and improvements in throughout and yield; and |
| • | Fixed overhead consists primarily of depreciation expense, which is impacted by our level of capital investments and structural costs related to our locations. We believe our strategically located manufacturing facilities provide sufficient scale to maintain competitive unit manufacturing costs. |
The level of our revenue and COGS vary due to changes in raw material cost. As a result, our gross profit margin as a percent of net sales can vary significantly from period to period. As such, we believe total gross profit provides a clearer representation of our operating trends. Changes in raw material costs historically have not resulted in a significant sustained impact on gross profit, as we have generally been able to effectively mitigate changes in raw material costs through changes in our selling prices to customers in order to maintain a more steady gross profit per kilogram sold.
Comparability of Periods
Prior to 2014, our fiscal year was based on a 52 week period ending on the Saturday closest to each December 31. As a result, the fiscal years ended December 28, 2013 and December 29, 2012 each contain operating results for 52 weeks. On December 11, 2014, our Board of Directors approved a change in our fiscal year end to a calendar year ending on December 31, beginning with the fiscal year 2014.
On June 11, 2014, the Providência Acquisition was completed whereby Providência became an indirect subsidiary of the Company. Pursuant to the terms and subject to the conditions of the Providência Acquisition, the Company acquired an approximately 71.25% controlling interest in Providência. As a result, the results of operations of Providência have been included in the Consolidated Balance Sheet at December 31, 2014 and the Consolidated Statement of Operations since June 11, 2014.
On November 15, 2013, the Fiberweb Acquisition became effective pursuant to a court sanctioned scheme of arrangement under Part 26 of the UK Companies Act of 2006 whereby Fiberweb became an indirect wholly-owned subsidiary of the Company. As a result, the results of operations of Fiberweb have been included in the Consolidated Balance Sheet at December 28, 2013 and the Consolidated Statement of Operations since November 15, 2013.
The global nonwovens market has historically experienced stable growth and favorable pricing dynamics. However, since late 2010, several of our competitors, primarily in the hygiene markets, installed or announced an intent to install, capacity in excess of what we believe to be current market demand in the regions that we conduct business. As additional nonwovens manufacturing capacity entered into commercial production, in excess of market demand, the short-term to mid-term excess supply created unfavorable market dynamics, resulting in a downward pressure on selling prices. In recent years, we believe growing demand has filled a portion of this excess capacity and we have observed fewer new capacity expansions, leading, in our view, to improved capacity utilization and resulting in a more stabilized pricing environment since the second half of 2013.
Our sales are impacted by our selling prices, which are influenced by the cost of our raw material inputs. Historically, changes in input costs have generally been passed through to customers either by contractual mechanisms or business practices. This can result in significant increases in total net sales during periods of sustained raw material cost increases as well as significant declines in net sales during periods of raw material cost declines. As a result, financial statement items that use percentage of net sales as an economic indicator are influenced by the changes in our selling prices. In general, average prices for polypropylene resin and other raw material modestly trended downward throughout 2012. The trend was reversed in 2013 and 2014, however, negatively impacting our results. As a result, we continue to operate in a volatile raw material environment. In recent months, we have seen raw material prices decline again.
70
Table of Contents
Our financial results are affected to a certain extent by changes in foreign currency exchange rates in the various countries in which our products are manufactured and/or sold. Our recent acquisitions have significant foreign operations which has increased our exposure to foreign currency volatility, and, more specifically, our exposure to volatility in connection with the Euro as a result of the Fiberweb Acquisition and the Brazilian real as a result of the Providência Acquisition. Hence, the financial results of our foreign subsidiaries can fluctuate as the respective local currencies weaken or strengthen against the U.S. dollar, the Company’s reporting currency.
Comparison of Fiscal Year Ended December 31, 2014 and Fiscal Year Ended December 28, 2013
The following table sets forth the period change for each category of the Consolidated Statement of Operations for the fiscal year ended December 31, 2014 as compared to the fiscal year ended December 28, 2013, as well as each category as a percentage of net sales:
| Fiscal Year Ended December 31, 2014 |
Fiscal Year Ended December 28, 2013 |
Period Change Favorable (Unfavorable) |
Percentage of Net Sales for the Respective Period End |
|||||||||||||||||
| In thousands |
December 31, 2014 |
December 28, 2013 |
||||||||||||||||||
| Net sales |
$ | 1,859,914 | $ | 1,214,862 | $ | 645,052 | 100.0 | % | 100.0 | % | ||||||||||
| Cost of goods sold |
(1,526,406 | ) | (1,018,806 | ) | (507,600 | ) | 82.1 | % | 83.9 | % | ||||||||||
|
|
|
|
|
|
|
|
|
|
|
|||||||||||
| Gross profit |
333,508 | 196,056 | 137,452 | 17.9 | % | 16.1 | % | |||||||||||||
| Selling, general and administrative expenses |
(254,280 | ) | (153,188 | ) | (101,092 | ) | 13.7 | % | 12.6 | % | ||||||||||
| Special charges, net |
(59,185 | ) | (33,188 | ) | (25,997 | ) | 3.2 | % | 2.7 | % | ||||||||||
| Other operating, net |
(1,845 | ) | (2,512 | ) | 667 | 0.1 | % | 0.2 | % | |||||||||||
|
|
|
|
|
|
|
|
|
|
|
|||||||||||
| Operating income (loss) |
18,198 | 7,168 | 11,030 | 1.0 | % | 0.6 | % | |||||||||||||
| Other income (expense): |
||||||||||||||||||||
| Interest expense |
(96,153 | ) | (55,974 | ) | (40,179 | ) | 5.2 | % | 4.6 | % | ||||||||||
| Debt modification and extinguishment costs |
(15,725 | ) | (3,334 | ) | (12,391 | ) | 0.8 | % | 0.3 | % | ||||||||||
| Foreign currency and other, net |
(27,083 | ) | (8,851 | ) | (18,232 | ) | 1.5 | % | 0.7 | % | ||||||||||
|
|
|
|
|
|
|
|
|
|
|
|||||||||||
| Income (loss) before income taxes |
(120,763 | ) | (60,991 | ) | (59,772 | ) | (6.5 | )% | (5.0 | )% | ||||||||||
| Income tax (provision) benefit |
1,523 | 36,024 | (34,501 | ) | (0.1 | )% | (3.0 | )% | ||||||||||||
|
|
|
|
|
|
|
|
|
|
|
|||||||||||
| Net income (loss) |
(119,240 | ) | (24,967 | ) | (94,273 | ) | (6.4 | )% | (2.1 | )% | ||||||||||
| Less: Earnings attributable to noncontrolling interest and redeemable noncontrolling interest |
(3,943 | ) | (34 | ) | (3,909 | ) | 0.2 | % | — | % | ||||||||||
|
|
|
|
|
|
|
|
|
|
|
|||||||||||
| Net income (loss) attributable to PGI Specialty Materials, Inc. |
$ | (115,297 | ) | $ | (24,933 | ) | $ | (90,364 | ) | (6.2 | )% | (2.1 | )% | |||||||
|
|
|
|
|
|
|
|
|
|
|
|||||||||||
71
Table of Contents
Net Sales
Net sales for the fiscal year ended December 31, 2014 were $1,859.9 million, a $645.0 million increase compared with the fiscal year ended December 28, 2013. A reconciliation presenting the components of the period change by each of our reportable segments is as follows:
| In millions |
North America |
South America |
Europe | Asia | Total | |||||||||||||||
| Beginning of period |
$ | 572.1 | $ | 153.8 | $ | 316.4 | $ | 172.6 | $ | 1,214.9 | ||||||||||
| Changes due to: |
||||||||||||||||||||
| Volume |
11.5 | 5.1 | 13.1 | 22.5 | 52.2 | |||||||||||||||
| Acquisitions |
241.8 | 144.6 | 201.7 | — | 588.1 | |||||||||||||||
| Price/product mix |
4.6 | 2.7 | (1.6 | ) | (1.0 | ) | 4.7 | |||||||||||||
| Currency translation |
(1.4 | ) | — | 0.9 | 0.5 | — | ||||||||||||||
|
|
|
|
|
|
|
|
|
|
|
|||||||||||
| Sub-total |
256.5 | 152.4 | 214.1 | 22.0 | 645.0 | |||||||||||||||
|
|
|
|
|
|
|
|
|
|
|
|||||||||||
| End of period |
$ | 828.6 | $ | 306.2 | $ | 530.5 | $ | 194.6 | $ | 1,859.9 | ||||||||||
|
|
|
|
|
|
|
|
|
|
|
|||||||||||
Volumes sold for the fiscal year ended December 31, 2014 were 456.8 thousand metric tons (“kMT”), a 145.4 kMT increase compared with the fiscal year ended December 28, 2013. A reconciliation presenting the components of the period change by each of our reportable segments is as follows:
| In kMT |
North America |
South America |
Europe | Asia | Total | |||||||||||||||
| Beginning of period |
148.9 | 46.3 | 68.6 | 47.6 | 311.4 | |||||||||||||||
| Changes due to: |
||||||||||||||||||||
| Volume |
2.4 | 1.5 | 1.9 | 5.8 | 11.6 | |||||||||||||||
| Acquisitions |
48.6 | 41.5 | 43.7 | — | 133.8 | |||||||||||||||
|
|
|
|
|
|
|
|
|
|
|
|||||||||||
| Sub-total |
51.0 | 43.0 | 45.6 | 5.8 | 145.4 | |||||||||||||||
|
|
|
|
|
|
|
|
|
|
|
|||||||||||
| End of period |
199.9 | 89.3 | 114.2 | 53.4 | 456.8 | |||||||||||||||
|
|
|
|
|
|
|
|
|
|
|
|||||||||||
For the fiscal year ended December 31, 2014, volumes increased by $640.3 million compared with the fiscal year ended December 28, 2013. The primary driver of the increase related to our acquisitions, with Fiberweb contributing an incremental $393.8 million for the period and Providência providing $194.3 million of net sales since the date of acquisition. Incremental volume growth of $22.5 million in Asia was driven by higher volumes sold in the healthcare and hygiene markets, both of which were supported by our recent capacity expansions. In Europe, stabilization of underlying demand in the healthcare, hygiene and wipes markets increased sales by $13.1 million. Improvements in the wipes and technical specialties markets provided $5.1 million of incremental volume growth in South America. Volumes increased $11.5 million in North America, primarily driven by the hygiene and construction markets. However, these improvements were partially offset by lower wipes volume driven by the reduction in demand by a key customer. In addition, lower filtration volume was driven by the exit of certain low margin customers during the year.
For the fiscal year ended December 31, 2014, net selling prices increased $4.7 million compared with the fiscal year ended December 28, 2013. The pricing increase was primarily driven by higher net selling prices of $4.6 million in North America, which reflects the positive impacts of certain pricing initiatives implemented during the year and the pass-through of higher raw material costs to our customers. In addition, we experienced pricing improvements of $2.7 million in South America. The pricing increase, which primarily resulted from our passing through higher raw material costs associated with index-based selling agreements and market-based pricing trends, more than offset lower selling prices of $1.6 million in Europe. Lower net selling prices in Asia impacted net sales by $1.0 million. The decrease was a result of a larger proportion of current year sales in the
72
Table of Contents
hygiene market compared with more prior year sales in the healthcare market (which have higher average selling prices) and was also impacted by a competitive pricing environment.
Gross Profit
Gross profit for the fiscal year ended December 31, 2014 was $333.5 million, a $137.5 million increase compared with the fiscal year ended December 28, 2013. The primary driver of the increase related to the contributions from Fiberweb, which represented an incremental $95.8 million for the period, including contributions associated with integration synergies. In addition, contributions from Providência were $33.9 million, including $4.5 million related to the non-recurring amortization expense of the inventory step-up established as a result of the acquisition as well as the negative impact of start-up inefficiencies in Brazil as certain lines were returning to normal operations during the second half of the year after being temporarily shut down in the second quarter due to required alterations to meet safety regulations.
Additional volume and net selling price increases provided $14.1 million of incremental gross profit, which included $14.0 million of lower net spreads (the difference between the change in raw material costs and selling prices). The reduction in spread was primarily driven by increases in the market prices for raw materials, primarily polypropylene, which impacted North America, South America and Asia. However, a $2.1 million reduction of our labor component of cost of goods sold reflects the positive benefits of our cost reduction initiatives. Other costs that impacted gross profit include an $8.3 million increase to our overhead component of cost of goods sold. The increase, primarily related to the increase in volume-related costs, was partially offset by manufacturing efficiencies in North America and South America. As a result, gross profit as a percentage of net sales for fiscal year ended December 31, 2014 increased to 17.9% from 16.1% for the fiscal year ended December 28, 2013.
The volatility of the Argentinean and Colombian peso in relation to the U.S. dollar has not materially impacted gross profit as the majority of raw material cost increases, including those caused by currency movements, have been passed through to our customers by formulaic or other mechanisms in our sales contracts. There are similar arrangements in place in Brazil, but not to the same magnitude as the rest of South America as such that the weakening of the Brazilian real modestly impacted gross profit. The weakening of the Euro in relation to the U.S. dollar, which started in the second half of 2014, did not materially impact gross profit in 2014 compared to 2013 as average exchange rates for the year were generally similar. All other currency changes did not have a material impact on gross profit which is primarily due to the combination of sales and costs in both U.S. dollar and non U.S. dollar and underlying mechanisms to manage.
73
Table of Contents
Operating Income (Loss)
Operating income for the fiscal year ended December 31, 2014 was $18.2 million, a $11.0 million increase compared with the fiscal year ended December 28, 2013. A reconciliation presenting the components of the period change by each of our reportable segments is as follows:
| In millions |
North America |
South America |
Europe | Asia | Sub-total | Corporate/ Other |
Total | |||||||||||||||||||||
| Beginning of period |
$ | 51.5 | $ | 7.7 | $ | 8.5 | $ | 17.8 | $ | 85.5 | $ | (78.3 | ) | $ | 7.2 | |||||||||||||
| Changes due to: |
||||||||||||||||||||||||||||
| Volume |
5.5 | 1.6 | 4.5 | 7.6 | 19.2 | — | 19.2 | |||||||||||||||||||||
| Acquisitions |
36.5 | 4.1 | 5.2 | (0.2 | ) | 45.6 | — | 45.6 | ||||||||||||||||||||
| Price/product mix |
4.6 | 2.7 | (1.6 | ) | (1.0 | ) | 4.7 | — | 4.7 | |||||||||||||||||||
| Raw material cost |
(8.8 | ) | (5.6 | ) | 1.9 | (6.2 | ) | (18.7 | ) | — | (18.7 | ) | ||||||||||||||||
| Manufacturing costs |
2.4 | (4.7 | ) | (1.8 | ) | 0.6 | (3.5 | ) | — | (3.5 | ) | |||||||||||||||||
| Currency translation |
(0.1 | ) | 6.9 | (0.2 | ) | 0.4 | 7.0 | 0.5 | 7.5 | |||||||||||||||||||
| Depreciation and amortization |
2.9 | 0.3 | — | (2.0 | ) | 1.2 | — | 1.2 | ||||||||||||||||||||
| Purchase accounting |
(3.8 | ) | (4.0 | ) | 5.1 | — | (2.7 | ) | — | (2.7 | ) | |||||||||||||||||
| Special charges |
— | — | — | — | — | (26.0 | ) | (26.0 | ) | |||||||||||||||||||
| All other |
(3.5 | ) | (2.2 | ) | (0.1 | ) | 0.3 | (5.5 | ) | (10.8 | ) | (16.3 | ) | |||||||||||||||
|
|
|
|
|
|
|
|
|
|
|
|
|
|
|
|||||||||||||||
| Sub-total |
35.7 | (0.9 | ) | 13.0 | (0.5 | ) | 47.3 | (36.3 | ) | 11.0 | ||||||||||||||||||
|
|
|
|
|
|
|
|
|
|
|
|
|
|
|
|||||||||||||||
| End of period |
$ | 87.2 | $ | 6.8 | $ | 21.5 | $ | 17.3 | $ | 132.8 | $ | (114.6 | ) | $ | 18.2 | |||||||||||||
|
|
|
|
|
|
|
|
|
|
|
|
|
|
|
|||||||||||||||
The amounts included in Special charges net have not been allocated to our reportable business divisions because our management does not evaluate such charges on a division-by-division basis. Division operating performance is measured and evaluated before such items.
Selling, General and Administrative Expenses
Selling, general and administrative expenses for the fiscal year ended December 31, 2014 were $254.3 million, a $101.1 million increase compared with the fiscal year ended December 28, 2013. The increase was primarily related to the inclusion of Fiberweb, which added an incremental $61.3 million of costs for the period. In addition, expenses related to our recent acquisition of Providência added $32.1 million to selling, general and administrative expenses. Other selling general and administrative expenses increased $7.7 million compared to the prior year. Factors that contributed to the increase include higher incentive compensation and Sponsor-related management fees as well as increased selling, marketing and freight expenses. In addition, we incurred higher employee-related expense and costs related to third-party fees and expenses. These costs were partially offset by lower stock-based compensation expense, depreciation and amortization expense. As a result, selling, general and administrative expenses as a percentage of net sales increased to 13.7% for the fiscal year ended December 31, 2014 from 12.6% for the fiscal year ended December 28, 2013. The fiscal year ended December 28, 2013 includes costs related to the announced retirement of our previous Chief Executive Officer and simultaneous appointment of our new Chief Executive Officer. Amounts recorded totaled $6.5 million, which included $2.0 million of non-cash stock compensation expense.
Special Charges, net
As part of our business strategy, we incur costs related to corporate-level decisions or Board of Director actions. These actions are primarily associated with initiatives attributable to restructuring and realignment of manufacturing operations and management structures as well as the pursuit of certain transaction opportunities when applicable. In addition, we evaluate our long-lived assets for impairment whenever events or changes in circumstances including the aforementioned, indicate that the carrying amounts may not be recoverable.
74
Table of Contents
Special charges for the fiscal year ended December 31, 2014 were $59.2 million and consisted of the following components:
| • | $24.4 million related to professional fees and other transaction costs associated with our acquisition of Providência; |
| • | $14.6 million related to professional fees and other transaction costs associated with our acquisition of Fiberweb; |
| • | $9.7 million related to separation and severance expenses associated with our plant realignment cost initiatives; |
| • | $6.9 million related to non-cash goodwill impairment charge in South America segment; and |
| • | $3.6 million related to other corporate initiatives. |
Special charges for the fiscal year ended December 28, 2013 were $33.2 million and consisted of the following components:
| • | $18.3 million related to professional fees and other transaction costs associated with our acquisition of Fiberweb; |
| • | $8.6 million related to separation and severance expenses associated with our plant realignment cost initiatives; and |
| • | $2.3 million non-cash impairment charge related to the fair value adjustment of property and equipment at our manufacturing facility in Buenos Aires, Argentina; and |
| • | $4.0 million related to other corporate initiatives. |
The amounts included in Special charges, net have not been allocated to our reportable business divisions because our management does not evaluate such charges on a division-by-division basis. Division operating performance is measured and evaluated before such items.
Other Operating, net
For the fiscal year ended December 31, 2014, other operating expense totaled $1.8 million, of which $5.4 million was associated with foreign currency losses. These losses were partially offset by $3.6 million related to other operating income. Other operating expense for the fiscal year ended December 28, 2013 was $2.5 million. Amounts associated with foreign currency losses on operating assets and liabilities totaled $2.8 million. These losses were partially offset by $0.3 million of other operating income.
Other Income (Expense)
Interest expense for the fiscal year ended December 31, 2014 and the fiscal year ended December 28, 2013 was $96.2 million and $56.0 million, respectively. The increase primarily relates to interest expense and amortization of debt issuance costs associated with the Term Loans and the Senior Unsecured Notes, both of which were used to fund our recent acquisitions. Interest expense on third-party debt assumed in the Providência Acquisition also contributed to the increase. Combined, we realized an additional $37.0 million of expense associated with changes to our debt structure as a result of the Fiberweb and Providência transactions. The fiscal year ended December 28, 2013 included $4.4 million of interest expense related to the acquisition of Fiberweb, primarily related to interest expense and amortization of debt issuance costs associated with the Bridge Facilities, which were used to initially fund the acquisition of Fiberweb. Interest expense on the Term Loans, which were used to partially repay the Bridge Facilities, was an additional component of the balance.
During the fiscal year ended December 31, 2014, we redeemed $56.0 million of the Senior Secured Notes at a redemption price of 103.0% of the aggregate principal amount plus any accrued and unpaid interest. As a result,
75
Table of Contents
we recognized a loss on debt extinguishment of $2.6 million. In addition, we entered into an assignment agreement with a third-party financial institution to transfer, to us, their rights and obligations under an export credit facility acquired in the Providência Acquisition. Fees related to the assignment totaled $2.4 million during the period. In association with the Providência Acquisition, we incurred $21.3 million of loan acquisition costs, of which $10.7 million was expensed as incurred during the second quarter of 2014. These amounts are included within Debt modification and extinguishment costs.
Foreign currency and other, net was a loss of $27.1 million for the fiscal year ended December 31, 2014. The main driver of the expense related to $35.6 million associated with foreign currency losses on non-operating assets and liabilities. A majority of the loss occurred in South America as the U.S. dollar strengthened significantly against local currencies in Brazil and Argentina. In addition, non-operating asset values in Europe created currency losses as the Euro weakened against the U.S. dollar. Other non-operating income totaled $8.5 million and included the settlement of a foreign exchange forward contracts associated with the Providência Acquisition, which provided $18.9 million of income realized at the date of acquisition. In addition, we realized $1.1 million in gains on the sale of assets, primarily associated with our European restructures. However, these amounts were partially offset by $1.7 million of non-operating expenses, primarily associated with factoring fees as well as $4.5 million of expenses associated with Providência. Other costs recognized included $5.3 million associated with the changes in fair value of a series options related to the Mandatory Tender Offer and the deferred portion of the purchase price. Foreign currency and other was an expense of $8.9 million for the fiscal year ended December 28, 2013. Items impacting the results include $6.7 million associated with foreign currency losses on non-operating assets and liabilities as well as $1.7 million of other non-operating expenses, primarily associated with factoring fees. In addition, we incurred $0.5 million related to the release of a tax indemnification asset that was established in the opening balance sheet in connection with the merger.
Income Tax (Provision) Benefit
During the fiscal year ended December 31, 2014, we recognized an income tax benefit of $1.5 million on consolidated pre-tax book loss from continuing operations of $120.8 million for a 1.3% effective benefit. During the fiscal year ended December 28, 2013, we recognized an income tax benefit of $36.0 million on consolidated pre-tax book loss from continuing operations of $61 million for a 59.1% effective tax benefit.
The change in our effective tax rate was primarily driven by incremental operating losses in the U.S. of $1.8 million for which we recorded a full valuation allowance and the absence of certain discrete benefits recorded in the U.S. in 2013. Specifically Fiberweb entities in the U.S. carried a deferred tax liability of $36.7 million that could be used as a source of income against the Company’s U.S. deferred tax assets. Shortly after the completion of the Fiberweb acquisition the Company elected then to disregard the U.S. Fiberweb parent entities in the United Kingdom. The Fiberweb entities in the U.S. were treated as directly owned by the Company for tax purposes and included in the Company’s U.S. consolidated federal tax return. Making this election resulted in the release of $36.7 million of our valuation allowance which was reflected as a discrete tax benefit in 2013.
Additionally our effective tax rate in 2014 was impacted by losses in certain jurisdictions for which no income tax benefits are anticipated, foreign withholding taxes for which tax credits are not anticipated, changes in the amounts recorded for tax uncertainties, foreign taxes calculated at statutory rates different than the U.S. federal statutory rate, and the application of intraperiod tax allocation rules.
Earnings Attributable to Noncontrolling Interest and to Redeemable Noncontrolling Interest
Earnings attributable to noncontrolling interest and to redeemable noncontrolling interest for the fiscal year ended December 31, 2014 was a loss of $3.9 million. Noncontrolling interest and redeemable noncontrolling interest represent the minority partners’ interest in the income or loss of consolidated subsidiaries which are not wholly-owned by us. Our acquisition of Providência represents approximately a 71.25% controlling interest and the remaining 28.75% is recorded as redeemable noncontrolling interest on our Consolidated Balance Sheets. As a result, we incurred $3.6 million related to the redeemable noncontrolling interest during the current period. In
76
Table of Contents
association with the acquisition of Fiberweb, the Company assumed control of Terram Geosynthetics Private Limited, a joint venture located in Gujarat, India in which we maintain a 65% controlling interest. As a result, we incurred $0.3 million related to the noncontrolling interest during the current period. Earnings attributable to noncontrolling interests for the fiscal year ended December 28, 2013 was $0.1 million, all of which related to Terram Geosynthetics Private Limited.
Comparison of Fiscal Year Ended December 28, 2013 and Fiscal Year Ended December 29, 2012
The following table sets forth the period change for each category of the Statement of Operations for the fiscal year ended December 28, 2013 as compared to the fiscal year ended December 29, 2012, as well as each category as a percentage of net sales:
| Fiscal Year Ended December 28, 2013 |
Fiscal Year Ended December 29, 2012 |
Period Change |
Percentage of Net Sales for the Respective Period End |
|||||||||||||||||
| In thousands |
December 28, 2013 |
December 29, 2012 |
||||||||||||||||||
| Net sales |
$ | 1,214,862 | $ | 1,155,163 | $ | 59,699 | 100.0 | % | 100.0 | % | ||||||||||
| Cost of goods sold |
(1,018,806 | ) | (957,917 | ) | (60,889 | ) | 83.9 | % | 82.9 | % | ||||||||||
|
|
|
|
|
|
|
|
|
|
|
|||||||||||
| Gross profit |
196,056 | 197,246 | (1,190 | ) | 16.1 | % | 17.1 | % | ||||||||||||
| Selling, general and administrative expenses |
(153,188 | ) | (140,776 | ) | (12,412 | ) | 12.6 | % | 12.2 | % | ||||||||||
| Special charges, net |
(33,188 | ) | (19,592 | ) | (13,596 | ) | 2.7 | % | 1.7 | % | ||||||||||
| Other operating, net |
(2,512 | ) | 287 | (2,799 | ) | 0.2 | % | — | ||||||||||||
|
|
|
|
|
|
|
|
|
|
|
|||||||||||
| Operating income (loss) |
7,168 | 37,165 | (29,997 | ) | 0.6 | % | 3.2 | % | ||||||||||||
| Other income (expense): |
||||||||||||||||||||
| Interest expense |
(55,974 | ) | (50,414 | ) | (5,560 | ) | 4.6 | % | 4.4 | % | ||||||||||
| Debt modification and extinguishment charges |
(3,334 | ) | — | (3,334 | ) | 0.3 | % | — | % | |||||||||||
| Foreign currency and other, net |
(8,851 | ) | (5,134 | ) | (3,717 | ) | 0.7 | % | 0.4 | % | ||||||||||
|
|
|
|
|
|
|
|
|
|
|
|||||||||||
| Income (loss) before income taxes |
(60,991 | ) | (18,383 | ) | (42,608 | ) | (5.0 | )% | (1.6 | )% | ||||||||||
| Income tax (provision) benefit |
36,024 | (7,655 | ) | 43,679 | (3.0 | )% | 0.7 | % | ||||||||||||
|
|
|
|
|
|
|
|
|
|
|
|||||||||||
| Net income (loss) |
(24,967 | ) | (26,038 | ) | 1,071 | (2.1 | )% | (2.3 | )% | |||||||||||
| Less: Earnings attributable to noncontrolling interest |
(34 | ) | — | (34 | ) | — | — | |||||||||||||
|
|
|
|
|
|
|
|
|
|
|
|||||||||||
| Net income (loss) attributable to PGI Specialty Materials, Inc. |
$ | (24,933 | ) | $ | (26,038 | ) | $ | 1,105 | (2.1 | )% | (2.3 | )% | ||||||||
|
|
|
|
|
|
|
|
|
|
|
|||||||||||
Net Sales
Net sales for the fiscal year ended December 28, 2013 were $1,214.9 million, a $59.7 million increase compared with the fiscal year ended December 29, 2012. A reconciliation presenting the components of the period change by each of our reportable segments is as follows:
| In millions |
North America |
South America |
Europe | Asia | Total | |||||||||||||||
| Beginning of period |
$ | 542.8 | $ | 161.5 | $ | 294.1 | $ | 156.8 | $ | 1,155.2 | ||||||||||
| Changes due to: |
||||||||||||||||||||
| Volume |
(3.3 | ) | (5.2 | ) | (13.0 | ) | 19.7 | (18 | ) | |||||||||||
| Acquisitions |
27.1 | — | 24.8 | — | 51.9 | |||||||||||||||
| Price/product mix |
5.9 | (2.5 | ) | 2.6 | (5.2 | ) | 0.8 | |||||||||||||
| Currency translation |
(0.4 | ) | — | 7.9 | 1.3 | 8.8 | ||||||||||||||
|
|
|
|
|
|
|
|
|
|
|
|||||||||||
| Sub-total |
29.3 | (7.7 | ) | 22.3 | 15.8 | 59.7 | ||||||||||||||
|
|
|
|
|
|
|
|
|
|
|
|||||||||||
| End of period |
$ | 572.1 | $ | 153.8 | $ | 316.4 | $ | 172.6 | $ | 1,214.9 | ||||||||||
|
|
|
|
|
|
|
|
|
|
|
|||||||||||
77
Table of Contents
Volumes sold for the fiscal year ended December 28, 2013 were 311.4 kMT, a 7.0 kMT increase compared with the fiscal year ended December 29, 2012. A reconciliation presenting the components of the period change by each of our reportable segments is as follows:
| In kMT |
North America |
South America |
Europe | Asia | Total | |||||||||||||||
| Beginning of period |
146.5 | 47.9 | 67.7 | 42.3 | 304.4 | |||||||||||||||
| Changes due to: |
||||||||||||||||||||
| Volume |
(2.0 | ) | (1.6 | ) | (3.8 | ) | 5.3 | (2.0 | ) | |||||||||||
| Acquisitions |
4.4 | — | 4.7 | — | 9.0 | |||||||||||||||
|
|
|
|
|
|
|
|
|
|
|
|||||||||||
| Sub-total |
2.4 | (1.6 | ) | 0.9 | 5.3 | 7.0 | ||||||||||||||
|
|
|
|
|
|
|
|
|
|
|
|||||||||||
| End of period |
148.9 | 46.3 | 68.6 | 47.6 | 311.4 | |||||||||||||||
|
|
|
|
|
|
|
|
|
|
|
|||||||||||
For the fiscal year ended December 28, 2013, volumes increased by $50.1 million compared with the fiscal year ended December 29, 2012. The primary driver of the increase related to the contribution of Fiberweb results since the acquisition date, which represented an incremental $51.9 million for the period. Excluding acquisitions, volumes decreased 1.8 million primarily driven by volume reductions in North America and Europe. European results reflected the stabilization of underlying demand in our industrial, consumer disposables and healthcare markets. However, they were more than offset by reductions in the hygiene market. Volumes were lower in North America, primarily driven by the exit of certain low-margin business in the healthcare market during 2012 as well as lower consumer disposable volume. Combined, these reductions had a $16.3 million net impact to volumes. In addition, the volume reduction of $5.2 million in South America was primarily attributable to lower demand in the hygiene market. Incremental volume growth of $19.7 million in Asia was driven by higher volumes sold in the hygiene and healthcare markets, both of which were supported by our recent capacity expansions.
For the fiscal year ended December 28, 2013, net selling prices increased $0.8 million compared with the fiscal year ended December 29, 2012. The pricing increase was primarily driven by increases in the North American and European industrial and consumer disposable markets. The pricing increases, which resulted from our passing through higher raw material costs associated with index-based selling agreements and market-based pricing trends, provided an incremental $8.5 million to net sales. However, these amounts were partially offset by product mix movements in Asia, a result of a larger proportion of current year sales in the hygiene market compared with more prior year sales in the healthcare market, which have higher average selling prices. In addition, product mix movements in South America impacted results as we shifted products between sites and end-uses. Combined, these factors impacted net sales by $7.7 million.
Gross Profit
Gross profit for the fiscal year ended December 28, 2013 was $196.0 million, a $1.2 million decrease compared with the fiscal year ended December 29, 2012. The decrease in gross profit was primarily driven by higher overall cost for the raw materials of resin and fibers, especially polypropylene resin. The increase impacted gross profit by $16.3 million (resulting in lower net spreads of $12.0 million) primarily driven by competitive pricing influenced by the continuing market surplus. Included in gross profit are the results of Fiberweb since the date of acquisition, which represented an incremental $3.4 million for the period and included $7.3 million associated with the non-recurring amortization of the inventory step-up established as a result of the Fiberweb Acquisition. In addition, our overhead component increased $4.3 million primarily associated with volume-related inefficiencies in North America and South America as well as increased depreciation in Asia. However, the decrease in gross profit was partially offset by the improvement in our labor component of cost of goods sold of $8.2 million which reflects the positive benefits of our cost reduction initiatives implemented during 2012. As a result, gross profit as a percentage of net sales for the fiscal year ended December 28, 2013 decreased to 16.1% from 17.1% for the fiscal year ended December 29, 2012.
78
Table of Contents
The volatility of the Argentinean and Colombian peso in relation to the U.S. dollar has not materially impacted gross profit as the majority of raw material cost increases, including those caused by currency movements, have been passed through to our customers by formulaic or other mechanisms in our sales contracts. The Euro in relation to the U.S. dollar did not materially impact gross profit in 2013 compared to 2012 as average exchange rates for the year were generally similar. All other currency changes did not have a material impact on gross profit which is primarily due to the combination of sales and costs in both U.S. dollar and non U.S. dollar and underlying mechanisms to manage.
Operating Income (Loss)
Operating income for the fiscal year ended December 28, 2013 was $7.2 million, a $30.0 million decrease compared with the fiscal year ended December 29, 2012. A reconciliation presenting the components of the period change by each of our reportable segments is as follows:
| In millions |
North America |
South America |
Europe |
Asia | Sub-total | Corporate/ Other |
Total | |||||||||||||||||||||
| Beginning of period |
$ | 50.0 | $ | 18.1 | $ | 11.1 | $ | 18.1 | $ | 97.3 | $ | (60.1 | ) | $ | 37.2 | |||||||||||||
| Changes due to: |
||||||||||||||||||||||||||||
| Volume |
(1.6 | ) | (1.7 | ) | (2.9 | ) | 7.8 | 1.6 | — | 1.6 | ||||||||||||||||||
| Acquisitions |
3.7 | — | (.8 | ) | — | 2.9 | — | 2.9 | ||||||||||||||||||||
| Price/product mix |
6.0 | (2.5 | ) | 2.6 | (5.2 | ) | 0.9 | — | 0.9 | |||||||||||||||||||
| Raw material cost |
(6.8 | ) | (4.8 | ) | (0.2 | ) | (1.1 | ) | (12.9 | ) | — | (12.9 | ) | |||||||||||||||
| Manufacturing costs |
3.9 | (2.4 | ) | (0.6 | ) | 4.8 | 5.7 | — | 5.7 | |||||||||||||||||||
| Currency translation |
(0.8 | ) | 1.0 | 1.5 | (0.4 | ) | 1.3 | — | 1.3 | |||||||||||||||||||
| Depreciation and amortization |
2.5 | 0.7 | (1.1 | ) | (6.2 | ) | (4.1 | ) | — | (4.1 | ) | |||||||||||||||||
| Purchase accounting |
(5.0 | ) | — | (2.7 | ) | — | (7.7 | ) | — | (7.7 | ) | |||||||||||||||||
| Special charges |
— | — | — | — | — | (13.6 | ) | (13.6 | ) | |||||||||||||||||||
| All other |
(0.4 | ) | (0.7 | ) | 1.6 | — | 0.5 | (4.6 | ) | (4.1 | ) | |||||||||||||||||
|
|
|
|
|
|
|
|
|
|
|
|
|
|
|
|||||||||||||||
| Sub-total |
1.5 | (10.4 | ) | (2.6 | ) | (0.3 | ) | (11.8 | ) | (18.2 | ) | (30.0 | ) | |||||||||||||||
|
|
|
|
|
|
|
|
|
|
|
|
|
|
|
|||||||||||||||
| End of period |
$ | 51.5 | $ | 7.7 | $ | 8.5 | $ | 17.8 | $ | 85.5 | $ | (78.3 | ) | $ | 7.2 | |||||||||||||
|
|
|
|
|
|
|
|
|
|
|
|
|
|
|
|||||||||||||||
The amounts for acquisition and integration expenses as well as special charges have not been allocated to our reportable business divisions because our management does not evaluate such charges on a division-by-division basis. Division operating performance is measured and evaluated before such items.
Selling, General and Administrative Expenses
Selling, general and administrative expenses for the fiscal year ended December 28, 2013 were $153.2 million, a $12.4 million increase compared with the fiscal year ended December 29, 2012. As a result, selling, general and administrative expenses as a percentage of net sales increased to 12.6% for the fiscal year ended December 28, 2013 from 12.2% for the fiscal year ended December 29, 2012. The increase was primarily related to the inclusion of Fiberweb results since the Acquisition Date, which added an incremental $8.5 million for the period. In addition, costs related to the announced retirement of our previous Chief Executive Officer and simultaneous appointment of our new Chief Executive Officer totaled $6.5 million, which included $2.0 million of non-cash stock compensation expense. Combined, these expenses had a 1.3 point impact on selling, general and administrative expenses as a percentage of net sales. Other factors that contributed to the increase include shipping and handling costs as activity between regions increased with the ramp up of certain new products, higher depreciation and amortization on new capital investments as well as increase in third-party fees and expenses. However, these amounts were more than offset by lower short-term incentive compensation as well as the impacts of our cost reduction initiatives implemented during the year which reduced employee-related expenses.
Special Charges, net
As part of our business strategy, we incur costs related to corporate-level decisions or Board of Directors actions. These actions are primarily associated with initiatives attributable to restructuring and realignment of
79
Table of Contents
manufacturing operations and management structures as well as the pursuit of certain transaction opportunities when applicable. In addition, we evaluate our long-lived assets for impairment whenever events or changes in circumstances including the aforementioned, indicate that the carrying amounts may not be recoverable.
Special charges for the fiscal year ended December 28, 2013 were $33.2 million and consisted of the following components:
| • | $18.3 million related to professional fees and other transaction costs associated with our acquisition of Fiberweb; |
| • | $8.5 million related to separation and severance expenses associated with our plant realignment cost initiatives; |
| • | $2.3 million related to cost associated with our internal redesign and restructuring of global operations initiatives; |
| • | $2.2 million non-cash impairment charge related to the fair value adjustment of property and equipment at our manufacturing facility in Buenos Aires, Argentina; and |
| • | $1.9 million related to other corporate initiatives. |
Special charges for the fiscal year ended December 29, 2012 were $19.6 million and consisted of the following components:
| • | $12.4 million related to cost associated with our internal redesign and restructuring of global operations initiatives; |
| • | $4.1 million related to separation and severance expenses associated with our plant realignment cost initiatives; |
| • | $0.9 million related to separation and severance expenses associated with our IS support initiative; |
| • | $0.5 million related to professional fees and other transaction costs associated with the Merger; and |
| • | $1.7 million related to other corporate initiatives. |
The amounts included in Special charges, net have not been allocated to our reportable business divisions because our management does not evaluate such charges on a division-by-division basis. Division operating performance is measured and evaluated before such items.
Other Operating, net
Other operating expense for the fiscal year ended December 28, 2013 was $2.5 million. Amounts associated with foreign currency losses on operating assets and liabilities totaled $2.8 million. These losses were partially offset by $0.3 million of other operating income. For the fiscal year ended December 29, 2012, other operating income totaled $0.3 million, of which $0.2 million was associated with foreign currency gains and $0.1 million related to other operating income.
Other Income (Expense)
Interest expense for the fiscal year ended December 28, 2013 and the fiscal year ended December 29, 2012 was $56.0 million and $50.4 million, respectively. The increase primarily relates to interest expense and amortization of debt issuance costs associated with the Secured Bridge Facility and the Unsecured Bridge Facility, which were used to fund the acquisition of Fiberweb. Interest expense on the Senior Secured Credit Agreement, which was used to partially repay both bridge facilities, also contributed to the increase. Combined, we realized an additional $4.4 million associated with changes to our debt structure as a result of the Fiberweb transaction.
80
Table of Contents
In association with the acquisition of Fiberweb, we refinanced the Bridge Facilities with a Senior Secured Credit Agreement during the fourth quarter of 2013. As a result, we recognized a loss on the extinguishment of debt of $3.3 million during the period. This amount represented debt issuance costs that were previously capitalized and required to be written off upon the refinancing and included within Debt modification and extinguishment costs.
Foreign currency and other was an expense of $8.9 million for the fiscal year ended December 28, 2013. Items impacting the results include $6.7 million associated with foreign currency losses on non-operating assets and liabilities as well as $1.7 million of other non-operating expenses, primarily associated with factoring fees. In addition, we incurred $0.5 million related to the release of a tax indemnification asset that was established in the opening balance sheet in connection with the Merger.
For the fiscal year ended December 29, 2012, foreign currency and other was an expense of $5.1 million. Items impacting the results include $3.4 million associated with foreign currency losses on non-operating assets and liabilities as well as $1.0 million of other non-operating expenses, primarily associated with factoring fees. In addition, we incurred $0.7 million related to the release of a tax indemnification asset that was established in the opening balance sheet in connection with the Merger.
Income Tax (Provision) Benefit
During the fiscal year ended December 28, 2013, we recognized an income tax benefit of $36.0 million on consolidated pre-tax book loss from continuing operations of $61.0 million for a 59.1% effective tax benefit. During the fiscal year ended December 29, 2012, we recognized income tax expense of $7.7 million on consolidated pre-tax book loss from continuing operations of $18.4 million for a (41.6%) effective tax expense.
The change in our effective tax rate was primarily driven by incremental operating losses in the U.S. of $24.7 million for which we recorded a full valuation allowance and a certain discrete benefit recorded in the U.S. in 2013. Specifically Fiberweb entities in the U.S. carried a deferred tax liability of $36.7 million that could be used as a source of income against the Company’s U.S. deferred tax assets. Shortly after the completion of the Fiberweb acquisition the Company elected to disregard the U.S. Fiberweb parent entities in the United Kingdom. Therefore the Fiberweb entities in the U.S. were then treated as directly owned by the Company for tax purposes and included in the Company’s U.S. consolidated federal tax return. Making this election resulted in the release of $36.7 million of our valuation allowance which was reflected as a discrete tax benefit in 2013.
Additionally our effective tax rate in 2013 was impacted by due to losses in certain jurisdictions for which no income tax benefits are anticipated, foreign withholding taxes for which tax credits are not anticipated, changes in the amounts recorded for Personal Holding Company (“PHC”) tax uncertainties, foreign taxes calculated at statutory rates different than the U.S. federal statutory rate, and the application of intraperiod tax allocation rules.
Earnings Attributable to Noncontrolling Interest
Earnings attributable to noncontrolling interest for the fiscal year ended December 28, 2013 were $0.1 million. Noncontrolling interest represents the minority partners’ interest in the income or loss of consolidated subsidiaries which are not wholly-owned by us. In association with the acquisition of Fiberweb, the Company assumed control of Terram Geosynthetics Private Limited, a joint venture located in Gujarat, India in which we maintain a 65% controlling interest. As a result, we incurred $0.1 million related to the noncontrolling interest.
81
Table of Contents
Liquidity and Capital Resources
The following table contains several key measures of our financial condition and liquidity:
| In millions |
December 31, 2014 |
December 28, 2013 |
||||||
| Balance Sheet Data: |
||||||||
| Cash and cash equivalents |
$ | 178.5 | $ | 86.1 | ||||
| Operating working capital(1) |
$ | 100.1 | $ | 43.2 | ||||
| Total assets |
$ | 2,035.2 | $ | 1,464.5 | ||||
| Total debt |
$ | 1,482.8 | $ | 896.7 | ||||
| Deferred purchase price |
$ | 42.4 | $ | — | ||||
| Redeemable noncontrolling interest |
$ | 89.2 | $ | — | ||||
| Total PGI Specialty Materials Inc., shareholders’ equity |
$ | (24.4 | ) | $ | 158.9 | |||
| (1) | Operating working capital represents accounts receivable plus inventory less accounts payable and accrued liabilities |
We assess our liquidity in terms of our ability to generate cash to fund our operating, investing and financing activities. In doing so, we review and analyze our current cash on hand, the number of days our sales are outstanding, inventory turns, capital expenditure commitments and income tax rates. Our cash requirements primarily consist of the following:
| • | debt service requirements; |
| • | funding of working capital; and |
| • | funding of capital expenditures. |
Our primary sources of liquidity include cash balances on hand, cash flows from operations, cash inflows from the sale of certain accounts receivables through our factoring arrangements, proceeds from notes offerings, borrowing availability under our existing credit facilities and our ABL Facility. We expect our cash on hand and cash flow from operations (which may fluctuate due to short-term operational requirements), combined with the current borrowing availability under our existing credit facilities and our ABL Facility, to provide sufficient liquidity to fund our current obligations, projected working capital requirements and capital spending during the next twelve month period and our ongoing operations, projected working capital requirements and capital spending during the foreseeable future.
On January 28, 2011, pursuant to an Agreement and Plan of Merger, dated as of October 4, 2010, we were acquired by affiliates of Blackstone along with certain members of the Company’s management for an aggregate purchase price of $403.5 million. In addition, we have subsequently increased our debt balances in connection with our acquisitions of Fiberweb and Providência. As a result, we are highly leveraged. Accordingly, our liquidity requirements are significant, primarily due to our debt service requirements. Cash interest payments for the fiscal year ended December 31, 2014 were $86.6 million. We had $178.5 million of cash and cash equivalents on hand and an additional $43.6 million of undrawn availability under our ABL Facility as of December 31, 2014. The availability under our ABL Facility is determined in accordance with a borrowing base which can fluctuate due to various factors.
We currently have significant net operating losses in the U.S., multiple intercompany loan agreements, and in certain circumstances, management services agreements in place that allow us to repatriate foreign subsidiary cash balances to the U.S. without being subject to significant amounts of either foreign jurisdiction withholding taxes or adverse U.S. taxation. In addition, our U.S. legal entities have royalty arrangements, associated with our foreign subsidiaries’ use of U.S. legal entities intellectual property rights that allow us to repatriate foreign subsidiary cash balances, subject to foreign jurisdiction withholding tax requirements. Should we decide to
82
Table of Contents
permanently repatriate foreign jurisdiction earnings by means of a dividend, the repatriated cash would be subject to foreign jurisdiction withholding tax requirements. We believe that any such dividend activity and the related tax effect would not be material.
At December 31, 2014, we had $178.5 million and $86.1 million of cash and cash equivalents on hand respectively, of which $67.0 million was held by subsidiaries outside of the U.S., the majority of which was available for repatriation through various intercompany arrangements. In addition, our U.S. legal entities in the past have also borrowed cash, on a temporary basis, from our foreign subsidiaries to meet U.S. obligations via short-term intercompany loans. Our U.S. legal entities may in the future borrow from our foreign subsidiaries. Only $7.4 million of cash and cash equivalents held by subsidiaries outside of the U.S. is considered permanently reinvested. If management decided to repatriate these earnings we do not believe we would incur significant tax liability in the U.S. due to our net operating losses.
Our liquidity and our ability to fund our capital requirements is dependent on our future financial performance, which is subject to general economic, financial and other factors that are beyond our control and many of which are described in “Risk Factors.” If those factors significantly change or other unexpected factors adversely affect us, our business may not generate sufficient cash flow from operations or we may not be able to obtain future financings to meet our liquidity needs. We anticipate that to the extent additional liquidity is necessary to fund our operations, it would be funded through borrowings under our ABL Facility, incurring other indebtedness, additional equity financings or a combination of these potential sources of liquidity. We may not be able to obtain this additional liquidity on terms acceptable to us or at all.
Cash Flows
The following table sets forth the major categories of cash flows:
| In millions |
Fiscal Year Ended December 31, 2014 |
Fiscal Year Ended December 28, 2013 |
Fiscal Year Ended December 29, 2012 |
|||||||||
| Net cash provided by (used in) operating activities |
$ | 49.1 | $ | 16.9 | $ | 75.5 | ||||||
| Net cash provided by (used in) investing activities |
(436.7 | ) | (337.8 | ) | (50.2 | ) | ||||||
| Net cash provided by (used in) financing activities |
487.4 | 308.2 | (0.1 | ) | ||||||||
|
|
|
|
|
|
|
|||||||
| Total |
$ | 99.8 | $ | (12.7 | ) | $ | 25.2 | |||||
|
|
|
|
|
|
|
|||||||
Operating Activities
Net cash provided by operating activities for the fiscal year ended December 31, 2014 was $49.1 million, of which net income provided $12.3 million after adjusting for non-cash transactions. In addition, net income was significantly impacted by cash outflows for transaction and integration related spending during the current year. Working capital requirements used $15.7 million, after adjusting for the net assets purchased in the Providência Acquisition of $89.0 million, and was significantly impacted by cash outflows for transaction and integration related spending during the current period. The primary driver of the working capital outflow related to a $18.1 million increase in accounts receivable, which resulted from increased sales during the period as well as from our passing through higher raw material costs associated with index-based selling agreements and market-based pricing trends. Days sales outstanding was 45 days at December 31, 2014 and December 28, 2013. Inventory increased $4.0 million as a result of the higher average purchase price of raw materials. Inventory on hand was 39 days at December 31, 2014 compared with 41 days at December 28, 2013. Other current assets increased $2.3 million (after a $4.7 million adjustment for the non-cash impact of the Providência Contracts) primarily due to the timing of prepaid items as well as the timing of payments from our factoring agents. In addition, accounts payables and accrued expenses increased $8.8 million. Trade accounts payable were impacted by the timing of supplier payments while accrued expenses were impacted by the timing of vendor payments and the bi-annual
83
Table of Contents
interest payment associated with our Senior Secured Notes, restructuring programs and employee-related expenses. As a result, accounts payable days decreased to 72 days at December 31, 2014 from 80 days at December 28, 2013. We continue to focus on working capital management, however, changes in raw material prices and the associated lag effect on selling prices can impact accounts receivable and inventory balances.
Net cash provided by operating activities for the fiscal year ended December 28, 2013 was $16.9 million, of which net income provided $23.0 million after adjusting for non-cash transactions. In addition, net income was impacted by cash outflows for transaction related spending during the year. Working capital requirements provided $19.9 million after adjusting for $65.7 million for the net assets purchased in the Fiberweb Acquisition. The primary driver of the inflow related to a $22.5 million increase in accounts payable and accruals. Trade accounts payable were impacted by the timing of supplier payments while accrued expenses were impacted by the timing of vendor payments, restructuring programs and employee-related expenses. As a result, accounts payable days increase to 80 days at December 28, 2013. In addition, inventory decreased $4.4 million as a result of the lower average purchase price of raw materials. Inventory on hand was 41 days at December 28, 2013. These amounts were partially offset by an increase in accounts receivable, which reduced net cash provided by operating activities by $12.4 million. The increase, which resulted from our passing through higher raw material costs associated with index-based selling agreements and market-based pricing trends, increased days sales outstanding to 45 days.
Net cash provided by operating activities for the fiscal year ended December 29, 2012 was $75.5 million, of which working capital requirements provided $33.2 million. The primary driver of the inflow related to decreases in both accounts receivable and inventory during the year. Accounts receivable decreased $9.4 million as a result of lower selling prices coupled with an increase of amounts sold through factoring agreements. The $9.3 million decrease in inventory was impacted by the lower overall purchase price of raw materials. At December 29, 2012, days sales outstanding was 44 days and inventory on hand was 38 days. Accounts payable and accruals increased $13.2 million. The increase was driven by the lower overall purchase price of raw materials partially offset by savings related to our internal redesign and restructure of our global operations. Accounts payable days was 79 days at December 29, 2012.
As sales volume and raw material costs vary, inventory and accounts receivable balances are expected to rise and fall accordingly, which in turn, result in changes in our levels of working capital and cash flows going forward. In addition, we review our business on an ongoing basis relative to current and expected market conditions, attempting to match our production capacity and cost structure to the demands of the markets in which we participate, and strive to continuously streamline our manufacturing operations consistent with world-class standards. Accordingly, in the future we may decide to undertake certain restructuring efforts to improve our competitive position. To the extent from time to time further decisions are made to restructure our business, such actions could result in cash restructuring charges and asset impairment charges, which could be material. Cash tax payments are significantly influenced by, among other things, actual operating results in each of our tax jurisdictions, changes in tax law, changes in our tax structure and any resolutions of uncertain tax positions.
Investing Activities
Net cash used in investing activities for the fiscal year ended December 31, 2014 was $436.7 million. The primary driver of the outflow related to the Providência Acquisition, where we acquired Providência for an aggregate purchase price of $424.8 million, of which $356.3 million was cash consideration, net of cash acquired. Property, plant and equipment expenditures totaled $82.5 million and primarily related to machinery and equipment upgrades that extend the useful life and/or increased the functionality of the asset. In addition, a portion of the expenditures relate to capacity expansions in certain manufacturing facilities as well as costs related to the plan to relocate our Nanhai, China manufacturing facilities.
Net cash used in investing activities for the fiscal year ended December 28, 2013 was $337.8 million. The primary driver of the outflow related to the Fiberweb Acquisition, where we acquired Fiberweb for an aggregate
84
Table of Contents
purchase price of $287.8 million. Property, plant and equipment expenditures totaled $54.6 million, primarily associated with our manufacturing expansion project in China which was completed in May 2013. Other items included in our capital expenditures relates to machinery and equipment upgrades that extend the useful life and/or increased the functionality of the asset. In addition, we acquired $4.6 million of intangible assets, primarily related to the purchase of land-use rights in connection with the plan to relocate our Nanhai, China manufacturing facilities.
Net cash used in investing activities for the fiscal year ended December 29, 2012 was $50.2 million. The primary driver of the balance related to $51.6 million of property, plant and equipment expenditures associated with our manufacturing expansion project in China. In addition, other items included in our capital expenditures relates to machinery and equipment upgrades that extend the useful life and/or increased the functionality of the asset. These amounts were partially offset by $1.7 million of proceeds recognized in the first quarter of 2012 associated with the sale of a former manufacturing facility in North Little Rock, Arkansas.
Financing Activities
Net cash provided by financing activities for the fiscal year ended December 31, 2014 was $487.4 million. The primary driver of the inflow related to the $415.0 million of proceeds from borrowings under our Senior Secured Credit Agreement as well as the proceeds from the issuance of $210.0 million of 6.875% Senior Unsecured Notes. These amounts were used to fund the Providência Acquisition and repay a portion of our outstanding debt. Other borrowings totaled $32.1 million and primarily related to short-term credit facilities used to finance various investments in non-U.S. jurisdictions and certain liquidity requirements. These amounts were partially offset by repayments of $148.3 million and $25.3 million of costs associated with our debt.
Net cash provided by financing activities for the fiscal year ended December 28, 2013 was $308.2 million. The primary driver of the inflow related to the proceeds received from a Senior Secured Credit Agreement and an additional equity investment from our owners used to repay outstanding borrowings under our Senior Secured Bridge Credit Agreement and the Senior Unsecured Bridge Credit Agreement used in connection with the Fiberweb Acquisition. Proceeds from other borrowings included $13.9 million related to a credit facility funding our manufacturing expansion project in China. In addition, proceeds of $3.5 million related to a new credit facility in Argentina used to fund the upgrade of one of our manufacturing lines. Other amounts were related to short-term facilities.
Net cash used in financing activities for the fiscal year ended December 29, 2012 was $0.1 million. Proceeds from borrowings totaled $16.7 million and primarily related to our credit facility in China funding our manufacturing expansion project in China. Other proceeds were related to short-term facilities. These amounts were more than offset by repayments of $17.6 million.
85
Table of Contents
Indebtedness
The following table summarizes our outstanding debt at December 31, 2014:
| In thousands |
Currency | Matures | Interest Rate |
Outstanding Balance |
||||||||
| Term Loans |
USD | 2018 | 5.25 | % | $ | 703,029 | ||||||
| Senior Secured Notes |
USD | 2019 | 7.75 | % | 504,000 | |||||||
| Senior Unsecured Notes |
USD | 2019 | 6.875 | % | 210,000 | |||||||
| ABL Facility |
USD | 2016 | — | — | ||||||||
| Argentina credit facilities: |
||||||||||||
| Nacion Facility |
USD | 2016 | 3.13 | % | 5,010 | |||||||
| Galicia Facility |
ARS | 2016 | 15.25 | % | 2,047 | |||||||
| China Credit Facility |
USD | 2015 | 5.43 | % | 18,920 | |||||||
| Brazil export credit facilities: |
||||||||||||
| Itaú Facility ($) |
USD | 2018 | 4.85 | % | — | |||||||
| Itaú Facility (R$) |
BRL | 2016 | 8.00 | % | 18,871 | |||||||
| Recovery Zone Facility Bonds |
USD | 2018 | 2.50 | % | — | |||||||
| India Loans |
INR | 2017 | 14.70 | % | 2,437 | |||||||
| Capital lease obligations |
Various | 2015-2019 | Various | 861 | ||||||||
|
|
|
|||||||||||
| Total long-term debt |
1,465,175 | |||||||||||
| Short-term borrowings |
Various | 2015 | Various | 17,665 | ||||||||
|
|
|
|||||||||||
| Total debt |
$ | 1,482,840 | ||||||||||
|
|
|
|||||||||||
Term Loans
On December 19, 2013, our subsidiary, PGI Group, entered into a Senior Secured Credit Agreement with a maturity date upon the earlier of (i) December 19, 2019 and (ii) the 91st day prior to the scheduled maturity of our 7.75% Senior Secured Notes; provided that on such 91st day, our 7.75% Senior Secured Notes have an outstanding aggregate principal amount in excess of $150.0 million. The Term Loans provide for a commitment by the lenders to make secured term loans in an aggregate amount not to exceed $295.0 million, the proceeds of which were used to partially repay amounts outstanding under the Senior Secured Bridge Credit Agreement and the Senior Unsecured Bridge Credit Agreement. In connection with the refinancing of the Bridge Facilities with the Term Loans, we recognized a loss on the extinguishment of debt of $3.3 million during the fourth quarter of 2013. This amount, included within Debt modification and extinguishment costs, represented debt issuance costs that were previously capitalized and required to be written off upon the refinancing.
Borrowings bear interest at a fluctuating rate per annum equal to, at PGI Group’s option, (i) a base rate equal to the highest of (a) the federal funds rate plus 1⁄2 of 1%, (b) the rate of interest in effect for such day as publicly announced from time to time by Citicorp North America, Inc. as its “prime rate” and (c) the LIBOR rate for a one-month interest period plus 1.0% (provided that in no event shall such base rate with respect to the Term Loans be less than 2.0% per annum), in each case plus an applicable margin of 3.25% or (ii) a LIBOR rate for the applicable interest period (provided that in no event shall such LIBOR rate with respect to the Term Loans be less than 1.0% per annum) plus an applicable margin of 4.25%. The applicable margin for the Term Loans is subject to a 25 basis point step-down upon the achievement of a certain senior secured net leverage ratio. We are required to repay installments on the Term Loans in quarterly installments in aggregate amounts equal to 1.0% per annum of their funded total principal amount, with the remaining amount payable on the maturity date.
On June 10, 2014, PGI Group entered into the Incremental Amendment to the existing Term Loans in which we obtained $415.0 million of commitments for incremental term loans from the existing lenders, the terms of which are substantially identical to the terms of the Term Loans. Pursuant to the Incremental Amendment, we borrowed $310.0 million, the proceeds of which were used to fund a portion of the consideration paid for the
86
Table of Contents
Providência Acquisition. The remaining commitments were used during the third quarter of 2014 to repay existing indebtedness.
The Term Loans are secured (i) together with the Tranche 2 (as defined below) loans, on a first-priority lien basis by substantially all of the assets of PGI Group, and any existing and future subsidiary guarantors (other than collateral securing the ABL Facility on a first-priority basis), including all of the capital stock of PGI Group and each restricted subsidiary (which, in the case of foreign subsidiaries, will be limited to 65% of the capital stock of each first-tier foreign subsidiary) and (ii) on a second-priority basis by the collateral securing the ABL Facility, in each case, subject to certain exceptions and permitted liens. We may voluntarily repay outstanding loans at any time without premium or penalty, other than a voluntary prepayment of Term Loans in connection with a repricing transaction on or prior to the date that is six months after the closing date of the Incremental Amendment and customary “breakage” costs with respect to LIBOR loans.
The agreement governing the Term Loans, among other restrictions, limits PGI Group’s ability and the ability of its restricted subsidiaries to: (i) incur or guarantee additional debt or issue disqualified stock or preferred stock; (ii) pay dividends and make other distributions on, or redeem or repurchase, capital stock; (iii) make certain investments; (iv) repurchase stock; (v) incur certain liens; (vi) enter into transactions with affiliates; (vii) merge or consolidate; (viii) enter into agreements that restrict the ability of subsidiaries to make dividends or other payments to PGI Group; (ix) designate restricted subsidiaries as unrestricted subsidiaries; and (x) transfer or sell assets. In addition, the Term Loans contain certain customary representations and warranties, affirmative covenants and events of default.
Under the credit agreement governing the Term Loans, PGI Group’s ability to engage in activities such as incurring additional indebtedness, making investments, refinancing certain indebtedness, paying dividends and entering into certain merger transactions is governed, in part, by its ability to satisfy tests based on Adjusted EBITDA (defined as Consolidated EBITDA in the credit agreement governing the Terms Loans).
Senior Secured Notes
In connection with the Merger, PGI Group issued $560.0 million of 7.75% Senior Secured Notes due 2019 on January 28, 2011. The Senior Secured Notes are fully and unconditionally guaranteed, jointly and severally on a senior secured basis, by each of PGI Group’s wholly-owned domestic subsidiaries. Interest on the Senior Secured Notes is paid semi-annually on February 1 and August 1 of each year. On July 23, 2014, we redeemed $56.0 million aggregate principal amount of the Senior Secured Notes at a redemption price of 103.0% of the aggregate principal amount plus any accrued and unpaid interest, to, but excluding, July 23, 2014. The redemption amount was funded by proceeds from the Incremental Amendment. Pursuant to ASC 470, “Modifications and Extinguishments” (“ASC 470”), we recognized a loss on debt extinguishment of $2.6 million, which included $0.9 million related to unamortized debt issuance costs. As the nature of this transaction related to a non-operating event, the loss on extinguishment is included in Debt modifications and extinguishment costs in the current period.
The indenture governing the Senior Secured Notes limits, subject to certain exceptions, the ability of PGI Group and its restricted subsidiaries to: (i) incur or guarantee additional debt or issue disqualified stock or preferred stock; (ii) pay dividends and make other distributions on, or redeem or repurchase, capital stock; (iii) make certain investments; (iv) incur certain liens; (v) enter into transactions with affiliates; (vi) merge or consolidate; (vii) enter into agreements that restrict the ability of subsidiaries to make dividends or other payments to PGI Group; (viii) designate restricted subsidiaries as unrestricted subsidiaries; and (ix) transfer or sell assets. It does not limit the activities of Holdings or the amount of additional indebtedness that Holdings or its parent entities may incur. In addition, it also provides for specified events of default, which, if any of them occurs, would permit or require the principal of and accrued interest on the Senior Secured Notes to become or to be declared due and payable.
87
Table of Contents
Under the indenture governing the Senior Secured Notes, PGI Group’s ability to engage in certain activities such as incurring additional indebtedness, making investments, refinancing certain indebtedness, paying dividends and entering into certain merger transactions is governed, in part, by its ability to satisfy tests based on Adjusted EBITDA (defined as EBITDA in the indenture governing the Senior Secured Notes).
Senior Unsecured Notes
In connection with the Providência Acquisition, PGI Group issued $210.0 million of 6.875% Senior Unsecured Notes due 2019 on June 11, 2014. The Senior Unsecured Notes are fully and unconditionally guaranteed, jointly and severally, on a senior unsecured basis, by each of PGI Group’s wholly-owned domestic subsidiaries. Interest on the Senior Unsecured Notes is paid semi-annually on June 1 and December 1 of each year.
The indenture governing the Senior Unsecured Notes limits, subject to certain exceptions, the ability of PGI Group and its restricted subsidiaries to: (i) incur or guarantee additional debt or issue disqualified stock or preferred stock; (ii) pay dividends and make other distributions on, or redeem or repurchase, capital stock; (iii) make certain investments; (iv) incur certain liens; (v) enter into transactions with affiliates; (vi) merge or consolidate; (vii) enter into agreements that restrict the ability of subsidiaries to make dividends or other payments to PGI Group; (viii) designate restricted subsidiaries as unrestricted subsidiaries; and (iv) transfer or sell assets. It does not limit the activities of Holdings or the amount of additional indebtedness that Holdings or its parent entities may incur. In addition, it also provides for specified events of default which, if any occurs, would permit or require the principal of and accrued interest on the Senior Unsecured Notes to become or to be declared due and payable.
Under the indenture governing the Senior Unsecured Notes, PGI Group’s ability to engage in certain activities such as incurring additional indebtedness, making investments, refinancing certain indebtedness, paying dividends and entering into certain merger transactions is governed, in part, by its ability to satisfy tests based on Adjusted EBITDA (defined as EBITDA in the indenture governing the Senior Unsecured Notes).
ABL Facility
On January 28, 2011, PGI Group entered into a senior secured asset-based revolving credit facility which was amended and restated on October 5, 2012 to provide for borrowings not to exceed $50.0 million, subject to borrowing base availability. The ABL Facility provides borrowing capacity available for letters of credit and borrowings on a same-day basis and is comprised of (i) a revolving tranche of up to $42.5 million (“Tranche 1”) and (ii) a first-in, last out revolving tranche of up to $7.5 million (“Tranche 2”). Provided that no default or event of default was then existing or would arise therefrom, we had the option to request that the ABL Facility be increased by an amount not to exceed $20.0 million. The facility matures on October 5, 2017.
On November 26, 2013, PGI Group entered into an amendment to the ABL Facility which increased the Tranche 1 revolving credit commitments by $30.0 million (for a total aggregate revolving credit commitment of $80.0 million) as well as made certain other changes to the agreement. In addition, we increased the amount by which we can request that the ABL Facility be increased at our option to an amount not to exceed $75.0 million. The effectiveness of the amendment was subject to the satisfaction of certain specified closing conditions by no later than January 31, 2014, all of which were satisfied prior to such date.
Based on current average excess availability, the borrowings under the ABL Facility will bear interest at a rate per annum equal to, at PGI Group’s option, either (A) British Bankers Association LIBOR Rate (“LIBOR”) (adjusted for statutory reserve requirements) plus a margin of (i) 2.00% in the case of Tranche 1 or (ii) 4.00% in the case of Tranche 2 or (B) the higher of (a) the rate of interest in effect for such day as publicly announced from time to time by Citibank, N.A. as its “prime rate” and (b) the federal funds effective rate plus 1⁄2 of 1.0% (“ABR”) plus a margin of (x) 1.00% in the case of Tranche 1 or (y) 3.00% in the case of the Tranche 2. As of December 31, 2014, we had no outstanding borrowings under the ABL Facility. The borrowing base availability
88
Table of Contents
was $62.9 million, however, outstanding letters of credit in the aggregate amount of $19.3 million left $43.6 million available for additional borrowings. The aforementioned letters of credit were primarily provided to certain administrative service providers and financial institutions. None of these letters of credit had been drawn on as of December 31, 2014.
The ABL Facility contains certain restrictions which limit PGI Group’s ability and the ability of its restricted subsidiaries to: (i) incur or guarantee additional debt; (ii) pay dividends and make other distributions on, or redeem or repurchase, capital stock; (iii) make certain investments; (iv) repurchase stock; (v) incur certain liens; (vi) enter into transactions with affiliates; (vii) merge or consolidate or other fundamental changes; (viii) enter into agreements that restrict the ability of subsidiaries to make dividends or other payments; (ix) designate restricted subsidiaries as unrestricted subsidiaries; (x) transfer or sell assets and (xi) prepay junior financing or other restricted debt. In addition, it contains certain customary representations and warranties, affirmative covenants and events of default. If such an event of default occurs, the lenders under the ABL Facility would be entitled to take various actions, including the acceleration of amounts due under the ABL Facility and all actions permitted to be taken by a secured creditor.
Under the credit agreement governing the ABL Facility, PGI Group’s ability to engage in activities such as incurring additional indebtedness, making investments, refinancing certain indebtedness, paying dividends and entering into certain merger transactions is governed, in part by, its ability to satisfy tests based on Adjusted EBITDA (defined as Consolidated EBITDA in the credit agreement governing the ABL Facility).
Nación Facility
In January 2007, our subsidiary in Argentina entered into an arrangement with banking institutions in Argentina in order to finance the installation of a new spunmelt line at its facility located near Buenos Aires, Argentina. The maximum borrowings available under the facility, excluding any interest added to principal, were 33.5 million Argentine pesos with respect to an Argentine peso-denominated loan and $26.5 million with respect to a U.S. dollar-denominated loan. The loans are secured by pledges covering (i) the subsidiary’s existing equipment lines; (ii) the outstanding stock of the subsidiary; and (iii) the new machinery and equipment being purchased, as well as a trust assignment agreement related to a portion of receivables due from certain major customers of the subsidiary.
The interest rate applicable to borrowings under these term loans is based on LIBOR plus 290 basis points for the U.S. dollar-denominated loan and Buenos Aires Interbanking Offered Rate plus 475 basis points for the Argentine peso-denominated loan. Principal and interest payments began in July 2008 with the loans maturing as follows: annual amounts of $3.5 million beginning in 2011 and continuing through 2015, and the remaining $1.7 million in 2016.
In connection with the Merger, we repaid and terminated the Argentine peso-denominated loans. In addition, the U.S. dollar-denominated loan was adjusted to reflect its fair value as of the date of the Merger. As a result, we recorded a contra-liability in Long-term debt and will amortize the balance over the remaining life of the facility. At December 31, 2014, the face amount of the outstanding indebtedness under the U.S. dollar-denominated loan was $5.2 million, with a carrying amount of $5.0 million and a weighted average interest rate of 3.13%.
Galicia Facility
On September 27, 2013, our subsidiary in Argentina entered into an arrangement with a banking institution in Argentina in order to partially finance the upgrade of a manufacturing line at its facility located near Buenos Aires, Argentina. The maximum borrowings available under the facility, excluding any interest added to principal, is 20.0 million Argentine pesos (approximately $3.5 million). The three-year term of the agreement began with the date of the first draw down on the facility, which occurred in the third quarter of 2013, with
89
Table of Contents
payments required in twenty-five equal monthly installments beginning after one year. Borrowings will bear interest at 15.25%. As of December 31, 2014, the outstanding balance under the facility was $2.0 million. The remainder of the upgrade is expected to be financed by existing cash balances and cash generated from operations.
China Credit Facility
In the third quarter of 2012, our subsidiary in China entered into a three-year U.S. dollar-denominated construction loan agreement (the “Hygiene Facility”) with a banking institution in China to finance a portion of the installation of a new spunmelt line at its manufacturing facility in Suzhou, China. The interest rate applicable to borrowings under the Hygiene Facility is based on three-month LIBOR plus an amount to be determined at the time of funding based on the lender’s internal head office lending rate (520 basis points at the time the credit agreement was executed).
The maximum borrowings available under the facility, excluding any interest added to principal, were $25.0 million. At December 28, 2013, the outstanding balance under the Hygiene Facility was $24.9 million with a weighted-average interest rate of 5.46%. We repaid $6.0 million of the principal balance during 2014 using a combination of existing cash balances and cash generated from operations. As a result, the outstanding balance under the Hygiene Facility was $18.9 million at December 31, 2014 with a weighted average interest rate of 5.43%.
Brazil Export Credit Facilities
As a result of the acquisition of Providência, we assumed a U.S. dollar-denominated export credit facility with Itaú Unibanco S.A., pursuant to which Providência borrowed $52.4 million in the third quarter of 2011 for the purpose of financing certain export transactions from Brazil. Borrowings bear interest at 4.85% per annum, payable semi-annually. Principal payments are due in 11 equal installments, beginning in September 2013 and ending at final maturity in September 2018. The facility is secured by interests in the receivables related to the exports financed by the facility.
On September 22, 2014, we entered into an assignment agreement with Itaú Unibanco S.A in order to transfer their rights and obligations under the agreement to us. The purchase price for the assigned interest totaled $45.2 million, which we funded with a portion of the proceeds from the Incremental Amendment. Pursuant to ASC 470, we recognized a loss on debt extinguishment of $2.4 million. As the nature of this transaction related to a non-operating event, the loss on extinguishment is included in Debt modifications and extinguishment costs in the current period.
As a result of the Providência Acquisition, we assumed a Brazilian real-denominated export credit facility with Itaú Unibanco S.A., pursuant to which Providência borrowed R$50.0 million in the first quarter of 2013 for the purpose of financing certain export transactions from Brazil. Borrowings bear interest at 8.0% per annum, payable quarterly. The facility matures in February 2016 and is unsecured. At December 31, 2014, outstanding borrowings under the facility totaled $18.9 million.
Recovery Zone Facility Bonds
As a result of the Providência Acquisition, we assumed a loan agreement in connection with the issuance of a like amount of recovery zone facility bonds by the Iredell County Industrial Facilities and Pollution Control Financing Authority. The proceeds of $9.1 million were used to finance, in part, the construction of a manufacturing facility in Statesville, North Carolina. The borrowings bear interest at a floating rate, which is reset weekly, and are supported by a letter of credit. On July 21, 2014, the Company repaid the aggregate principal amount of indebtedness with a portion of the proceeds from the Incremental Amendment.
90
Table of Contents
India Indebtedness
As a result of the Fiberweb Acquisition, we indirectly assumed control of Terram Geosynthetics Private Limited, a joint venture located in Mundra, India in which we maintain a 65% controlling interest. As part of the net assets acquired, we assumed $3.8 million of debt (including short-term borrowings) that was entered into with a banking institution in India. Amounts outstanding primarily relate to a 14.70% term loan, due in 2017, used to purchase fixed assets. Other amounts relate to a short-term credit facility used to finance working capital requirements (included in Short-term borrowings in the consolidated balance sheets) and an existing automobile loan. Combined, the outstanding balances totaled $3.1 million at December 31, 2014.
Other Indebtedness
We periodically enter into short-term credit facilities in order to finance various liquidity requirements, including insurance premium payments and short-term working capital needs. At December 31, 2014 and December 28, 2013, outstanding amounts related to such facilities were $17.0 million and $0.4 million, respectively. Borrowings under these facilities are included in Short-term borrowings in the Consolidated Balance Sheets.
We also have documentary letters of credit not associated with the ABL Facility or the Hygiene Facility. These letters of credit were primarily provided to certain raw material vendors and amounted to $7.8 million and $8.5 million at December 31, 2014 and December 28, 2013. None of these letters of credit have been drawn on.
Factoring Agreements
In the ordinary course of business, we may utilize accounts receivable factoring arrangements with third-party financial institutions in order to accelerate its cash collections from product sales. These arrangements involve the ownership transfer of eligible U.S. and non-U.S. trade accounts receivable, without recourse or discount, to a third party financial institution in exchange for cash. The maximum amount of outstanding advances at any one time is $20.0 million under the U.S. based program and $84.4 million (measured at December 31, 2014 foreign exchange rates) under the non-U.S. based program. At December 31, 2014, the net amount of trade accounts receivable sold to third-party financial institutions, and therefore excluded from our accounts receivable balance, was $92.5 million. Amounts due from the third-party financial institutions were $13.6 million at December 31, 2014. In the future, we may increase the sale of receivables or enter into additional factoring agreements.
Contractual Obligations
As of December 31, 2014, we had certain cash obligations associated with contractual commitments. The amounts due under these commitments are as follows:
| Payments Due by Period | ||||||||||||||||||||
| In millions |
Total | Less than 1 Year |
1 – 3 Years |
3 – 5 Years |
More than 5 Years |
|||||||||||||||
| Short-term borrowings |
$ | 17.7 | $ | 17.7 | $ | — | $ | — | $ | — | ||||||||||
| Long-term debt (fixed) |
732.9 | 0.1 | 18.8 | 714.0 | — | |||||||||||||||
| Long-term debt (variable) |
732.8 | 31.7 | 18.2 | 682.9 | — | |||||||||||||||
| Estimated interest payments(1) |
384.6 | 93.5 | 181.4 | 109.7 | — | |||||||||||||||
| Financing obligations |
20.4 | 3.4 | 6.7 | 6.7 | 3.6 | |||||||||||||||
| Capital lease obligation(2) |
0.9 | 0.3 | 0.5 | 0.1 | — | |||||||||||||||
| Operating lease obligations(3) |
78.5 | 15.4 | 27.4 | 15.4 | 20.3 | |||||||||||||||
| Purchase commitments(4) |
92.1 | 92.1 | — | — | — | |||||||||||||||
|
|
|
|
|
|
|
|
|
|
|
|||||||||||
| Total |
$ | 2,059.9 | $ | 254.2 | $ | 253.0 | $ | 1,528.8 | $ | 23.9 | ||||||||||
|
|
|
|
|
|
|
|
|
|
|
|||||||||||
| (1) | Represents the annual interest expense on fixed and variable rate debt. Projections on variable rate debt are based on current interest rates. |
91
Table of Contents
| (2) | Represents rental payments under capital leases with initial or remaining non-cancelable terms in excess of one year. |
| (3) | We lease certain manufacturing, warehousing and other facilities and equipment under operating leases. The leases on most of the properties contain renewal provisions. |
| (4) | Represents our commitments related to the purchase of raw materials and capital projects. |
Future expected obligations under our pension and postretirement benefit plans as well as our unrecognized tax obligations have not been included in the Contractual Obligations table as these items are difficult to make reasonably reliable estimates of the timing and amount to be paid.
Operating Lease Obligations
We lease certain manufacturing, warehousing and other facilities and equipment under operating leases. The leases on most of the properties contain renewal provisions. Rent expense (net of sub-lease income), including incidental leases, was $20.1 million, $15.4 million and $14.5 million during the fiscal years ended December 31, 2014, December 28, 2013 and December 29, 2012, respectively. These expenses are recognized on a straight-line basis over the life of the lease.
In the third quarter of 2011, our state-of-the-art spunmelt line in Waynesboro, Virginia commenced commercial production. The plant expansion increased capacity to meet demand for nonwoven materials in the hygiene and healthcare applications in the U.S. The line was principally funded by a seven year equipment lease with a capitalized cost of $53.6 million. From the commencement of the lease to its fourth anniversary date, we will make annual lease payments of $8.3 million. From the fourth anniversary date to the end of the lease term, our annual lease payments may change, as defined in the lease agreement. The aggregate monthly lease payments under the agreement, subject to adjustment, are expected to approximate $58 million. The lease includes covenants, events of default and other provisions that requires us to maintain certain financial ratios and other requirements.
Purchase Commitments
At December 31, 2014, we had purchase commitments of $92.1 million, of which $77.1 million related to the purchase of raw materials in the normal course of business. The remaining $15.0 million related to capital projects, primarily associated with the plan to relocate our Nanhai, China manufacturing facilities and the warehouse expansion project at the Company’s Old Hickory, Tennessee manufacturing facilities.
Financing Obligation
As a result of the acquisition of Fiberweb, we acquired a manufacturing facility in Old Hickory, Tennessee, the assets of which included a utility plant used to generate steam for use in its manufacturing process. Upon completion of its construction in 2011, the utility plant was sold to an unrelated third-party and subsequently leased back by Fiberweb for a period of 10 years. We have accounted for this transaction as a direct financing lease, recognizing the assets as part of property, plant and equipment and a related financing obligation as a long-term liability. Cash payments to the lessor are allocated between interest expense and amortization of the financing obligation. At the end of the lease term, we will recognize the sale of the utility plant, however, no gain or loss will be recognized as the financing obligation will equal the expected carrying value of the assets. At December 31, 2014, the outstanding balance of the financing obligation was $18.4 million.
Deferred Purchase Price
Total consideration paid for the acquisition of Providência includes $47.9 million of Deferred Purchase Price. The Deferred Purchase Price is held by the Company and relates to the Providência Tax Claims. The Deferred Purchase Price is denominated in Brazilian real and accretes at a rate of 9.5% per annum compounded
92
Table of Contents
daily. Upon resolution of the Providência Tax Claims by the Brazilian court, either tax payments for the Providência Tax Claims will be made to the Brazilian tax authorities or the Deferred Purchase Price will be paid to the selling shareholders. We will be responsible for any actual tax payment in excess of the Deferred Purchase Price. The Deferred Purchase Price is reflected on the Consolidated Balance Sheet as a Noncurrent liability as resolution of the Providência Tax Claims is expected to take longer than a year. At December 31, 2014, the outstanding balance of the Deferred Purchase Price was $42.4 million.
Redeemable Noncontrolling Interest
In connection with the Providência Acquisition, as required by Brazilian law, PGI Acquisition Company filed the Mandatory Tender Offer registration request with the CVM in order to launch, after its approval, a tender offer to acquire all of the remaining outstanding capital stock of Providência from the minority shareholders. As of December 31, 2014, the Mandatory Tender Offer was still under review by the CVM. Hence, the conditions for the launch of the Mandatory Tender Offer have not been met as of December 31, 2014. However, once the Mandatory Tender Offer is approved and launched, the minority shareholders will have the right, but not the obligation, to sell their remaining outstanding capital stock of Providência. Given such right of the minority shareholders, we determined that ASC 480 requires the noncontrolling interest to be presented as mezzanine equity on the Consolidated Balance Sheets and adjusted to its estimated maximum redemption amount at each balance sheet date. At December 31, 2014, the redemption value of the redeemable noncontrolling interest was $89.2 million.
Deferred Benefit Pension Plans
At December 31, 2014, we had a net surplus of $10.0 million related to our pension plans. It is our objective to contribute to pension plans to ensure adequate funds are available in the plans to make benefit payments to plan participants and beneficiaries when required. Because the timing and amounts of long-term funding requirements for pension obligations are uncertain, they have been excluded from the Contractual Obligations table.
Postretirement Benefit Plans
At December 31, 2014, we had postretirement benefit obligations of $5.5 million. We fund postretirement benefit costs principally on a pay-as-you-go basis as medical costs are incurred by covered retiree populations. Because the timing and amounts of long-term funding requirements for postretirement obligations are uncertain, they have been excluded from the Contractual Obligations table.
Uncertain Tax Positions
At December 31, 2014, we have total unrecognized tax benefits for uncertain tax positions of $13.0 million, which includes $9.1 million of related accrued interest and penalties as well as $1.8 million of operating loss carry forwards for which unrecognized tax benefits have been established. The liability has been excluded from the Contractual Obligations table as we are unable to reasonably estimate the amount and period in which these liabilities might be paid.
Covenant Compliance
Under our credit agreements and indentures governing our Senior Secured Notes and our Senior Unsecured Notes, our ability to engage in certain activities such as incurring certain additional indebtedness, making certain investments, and making restricted payments is tied to ratios based on Adjusted EBITDA.
93
Table of Contents
We believe that the most directly comparable GAAP measure to Adjusted EBITDA is Net income (loss) attributable to PGI Specialty Materials, Inc. The following table reconciles Net income (loss) attributable to PGI Specialty Materials, Inc to Adjusted EBITDA.
| In thousands |
Fiscal Year Ended December 31, 2014 |
|||
| Net income (loss) attributable to PGI Specialty Materials, Inc. |
$ | (115,297 | ) | |
| Net income (loss) attributable to noncontrolling interest and redeemable noncontrolling interest |
(3,943 | ) | ||
| Interest expense |
96,153 | |||
| Income and franchise tax |
(297 | ) | ||
| Depreciation and amortization(a) |
112,557 | |||
| Purchase accounting adjustments(b) |
6,976 | |||
| Non-cash compensation(c) |
1,931 | |||
| Special charges, net(d) |
59,185 | |||
| Foreign currency and other non-operating, net(e) |
32,531 | |||
| Loss on debt modification |
15,725 | |||
| Severance and relocation expenses(f) |
3,542 | |||
| Business optimization expense(g) |
1,263 | |||
| Management, monitoring and advisory fees(h) |
5,546 | |||
| Other(i) |
2,899 | |||
|
|
|
|||
| Adjusted EBITDA before contribution from acquisitions and contribution from estimated synergies |
$ | 218,771 | ||
|
|
|
|||
| Contribution from acquisitions(j) |
13,366 | |||
| Contribution from estimated synergies(k) |
27,840 | |||
|
|
|
|||
| Adjusted EBITDA |
$ | 259,977 | ||
|
|
|
|||
| (a) | Excludes amortization of loan acquisition costs that are included in interest expense. |
| (b) | Reflects fair market value adjustments as a result of purchase accounting associated with acquisitions, primarily related to the step-up in inventory value and its amortization into earnings over the period of the acquired company’s normal inventory turns. |
| (c) | Reflects non-cash compensation costs related to employee and director restricted stock, restricted stock units and stock options. |
| (d) | Reflects costs associated with non-cash asset impairment charges, the restructuring and realignment of manufacturing operations and management organizational structures, pursuit of certain transaction opportunities, including expenses related to the Fiberweb and Providência acquisitions, and other charges included in Special charges, net in our Consolidated Statement of Operations. |
| (e) | Reflects (gains) losses from foreign currency translation of intercompany loans, unrealized (gains) losses on interest rate and foreign currency hedging transactions, (gains) losses on sales of assets outside the ordinary course of business, factoring costs and certain other non-operating (gains) losses recorded in Foreign Currency and Other, net as well as (gains) losses from foreign currency transactions recorded in Other Operating, net. |
| (f) | Reflects severance and relocation expenses not included under Special charges, net as well as costs incurred with the CEO transition in 2013. |
| (g) | Reflects costs incurred to improve IT and accounting functions, costs associated with establishing new facilities and certain other expenses. |
| (h) | Reflects management, monitoring and advisory fees paid under the Sponsor management agreement. We intend to terminate the Advisory Agreement in connection with this offering. See “Certain Relationships and Related Party Transactions—Advisory Agreement.” |
| (i) | Reflects charges such as gain/loss on disposals and start-up costs. |
94
Table of Contents
| (j) | Pursuant to the indentures governing our Senior Secured Notes and our Senior Unsecured Notes and the credit agreements governing our Term Loans and our ABL Facility, we are permitted to include in our Adjusted EBITDA calculation the Adjusted EBITDA contributions from acquisitions for the portion of the fiscal year prior to the closing of the acquisition. The fiscal year ended December 31, 2014, reflects the Adjusted EBITDA contribution from estimated synergies from the Providência Acquisition for the period from January 1, 2014 through June 11, 2014. |
| (k) | Pursuant to the indentures governing our Senior Secured Notes and our Senior Unsecured Notes and the credit agreements governing our Term Loans and our ABL Facility, we are permitted to include to our calculation of Adjusted EBITDA contributions from estimated synergies resulting from acquisitions (subject to certain limitations). The adjustment represents management’s estimate of synergies expected to be realized within 12 months following the applicable acquisition. The fiscal year ended December 31, 2014 includes the Adjusted EBITDA contribution from estimated synergies from the Providência Acquisition. |
The credit agreement governing our Term Loans limits the amount of estimated synergies included in the calculation of Adjusted EBITDA for any consecutive four quarter period to 20% of Adjusted EBITDA, while the indenture governing our Senior Secured Notes and the credit agreement governing our ABL Facility limit such amount to the greater of $20 million or 10% of Adjusted EBITDA. The indenture governing our Senior Unsecured Notes does not include such limitation. Accordingly, Adjusted EBITDA for the fiscal year ended December 31, 2014 presented in the table above includes $1.8 million of estimated synergies that exceed the limitations in our Senior Secured Notes and ABL Facility. Therefore, we are not permitted to include that portion of estimated synergies in Adjusted EBITDA for purposes of determining our compliance with certain covenants in the Senior Secured Notes and ABL Facility. The limitation under the credit agreement governing the Term Loans has not been reached for the amount of synergies presented in the table above.
We present these synergy adjustments as they are permitted under the terms of our debt instruments, but you should not view these adjustments as a projection of future results. Our ability to realize these anticipated synergies is subject to significant uncertainties and you should not place undue reliance on the adjustments.
Off Balance Sheet Arrangements
We do not have any off-balance sheet arrangements.
Recent Accounting Standards
Changes to GAAP are established by the FASB in the form of Accounting Standards Updates (“ASUs”) to the FASB’s ASC. The Company considers the applicability and impact of all ASUs. ASUs not listed below were assessed and determined not to be applicable or are expected to have minimal impact on the Company’s Condensed Financial Statements.
In April 2015, the FASB issued ASU No. 2015-03, “Imputation of Interest (Subtopic 835-30): Simplifying the Presentation of Debt Issuance Costs” (“ASU 2015-03”) which requires an entity to present debt issuance costs related to a recognized debt liability in the balance sheet as a direct deduction from the carrying amount of the debt liability, consistent with debt discounts. The recognition and measurement guidance for debt issuance costs are not affected by the amendments in this update. ASU 2015-03 is effective on a retrospective basis for financial statements issued for fiscal years beginning after December 15, 2015, and interim periods within those fiscal years beginning after December 15, 2016. The adoption of this guidance concerns presentation only and will not have any impact on the Company’s financial results.
In January 2015, the FASB issued ASU No. 2015-01, “Income Statement—Extraordinary and Unusual Items” (“ASU 2015-01”), which eliminates from GAAP the concept of extraordinary items. If an event or transaction meets the criteria for extraordinary classification, it is segregated from the results of ordinary operations and is shown as a separate item in the income statement, net of tax. ASU 2015-01 is effective for
95
Table of Contents
annual periods, and interim periods within those annual periods, beginning after December 15, 2015. Early adoption is permitted provided that the guidance is applied from the beginning of the fiscal year of adoption. We are currently assessing the adoption and impact of this ASU, however, we do not anticipate that adoption of this ASU will impact our consolidated financial position and results of operations.
In August 2014, the FASB issued ASU No. 2014-15, “Presentation of Financial Statements—Going Concern” (“ASU 2014-15”). The new guidance addresses management’s responsibility to evaluate whether there is substantial doubt about an entity’s ability to continue as a going concern and to provide related footnote disclosures. Substantial doubt is defined as an indication that it is probable that an entity will be unable to meet its obligations as they become due within one year after the date that financial statements are issued. Management’s evaluation should be based on relevant conditions or events, considered in the aggregate, that are known and reasonably knowable at the date that the financial statements are issued. ASU 2014-15 is effective prospectively for reporting periods beginning after December 15, 2016, with early adoption permitted. We do not expect that the adoption of this guidance will have a material effect on our financial results.
In May 2014, the FASB issued ASU No. 2014-09, “Revenue from Contracts with Customers” (“ASU 2014-09”), which creates a comprehensive, five-step model for revenue recognition that requires a company to recognize revenue to depict the transfer of promised goods or services to a customer at an amount that reflects the consideration it expects to receive in exchange for those goods or services. Under the new guidance, a company will be required to use more judgment and make more estimates when considering contract terms as well as relevant facts and circumstances when identifying performance obligations, estimating the amount of variable consideration in the transaction price and allocating the transaction price to each separate performance obligation. In addition, ASU 2014-09 enhances disclosures about revenue, provides guidance for transactions that were not previously addressed comprehensively and improves guidance for multiple-element arrangements. ASU 2014-09 is effective for annual reporting periods beginning after December 15, 2016 and allows for either full retrospective or modified retrospective adoption. Early application is not permitted. We are currently evaluating the impact of adopting ASU 2014-09 on our financial results.
In April 2014, the FASB issued ASU No. 2014-08, “Reporting Discontinued Operations and Disclosures of Disposals of Components of and Entity” (“ASU 2014-08”), which changes the criteria for determining which disposals can be presented as discontinued operations and modifies related disclosure requirements. Under the new guidance, a discontinued operation is defined as a disposal of a component or a group of components that is disposed of or is classified as held for sale and represents a strategic shift that has (or will have) a major effect on an entity’s operations and financial results. In addition, ASU 2014-08 enhances disclosures for reporting discontinued operations. ASU 2014-08 is effective prospectively for reporting periods beginning after December 15, 2014, with early adoption permitted. We do not expect that the adoption of this guidance will have a material effect on our financial results.
In July 2013, the FASB issued ASU No. 2013-11, “Presentation of an Unrecognized Tax Benefit When a Net Operating Loss Carryforward, a Similar Tax Loss, or a Tax Credit Carryforward Exists” (“ASU 2013-11”), which requires an unrecognized tax benefit, or a portion of an unrecognized tax benefit, be presented in the financial statements as a reduction of a deferred tax asset for a net operating loss carryforward, a similar tax loss, or a tax credit carryforward if such settlement is required or expected in the event the uncertain tax position is disallowed. In situations where a net operating loss carryforward, a similar tax loss, or a tax credit carryforward is not available at the reporting date under the tax law of the applicable jurisdiction or the tax law of the jurisdiction does not require, and the entity does not intend to use, the deferred tax asset for such purpose, the unrecognized tax benefit should be presented in the financial statements as a liability and should not be combined with deferred tax assets. ASU 2013-11 is effective prospectively for reporting periods beginning after December 15, 2013, with retroactive application permitted. We adopted this accounting pronouncement effective December 29, 2013.
In February 2013, the FASB issued ASU No. 2013-02, “Reporting of Amounts Reclassified Out of Accumulated Other Comprehensive Income” (“ASU 2013-02”), which requires an entity to provide information
96
Table of Contents
about the amounts reclassified out of accumulated other comprehensive income by component. In addition, ASU 2013-02 requires an entity to present, either on the face of the income statement or in the notes to the financial statements, significant amounts reclassified out of accumulated other comprehensive income by the respective line items of net income but only if the amount reclassified is required under GAAP to be reclassified to net income in its entirety in the same reporting period. For other amounts, an entity is required to cross-reference to other disclosures required under GAAP that provide additional detail about those amounts. The amendments in ASU 2013-02 do not change the current requirements for reporting net income or other comprehensive income in the financial statements. ASU 2013-02 is effective prospectively for reporting periods beginning after December 15, 2012. The adoption of this guidance concerns disclosure only and did not have an impact on our financial results.
In July 2012, the FASB issued ASU No. 2012-02, “Testing Indefinite-Lived Intangible Assets for Impairment” which amended the guidance on the annual impairment testing of indefinite-lived intangible assets other than goodwill. The amended guidance will allow a company the option to first assess qualitative factors to determine whether it is more-likely-than-not that the fair value of an indefinite-lived intangible asset is less than its carrying amount. If, based on the qualitative assessment, it is more-likely-than-not that the fair value of an indefinite-lived intangible asset is less than its carrying amount, quantitative impairment testing is required. However, if a company concludes otherwise, quantitative impairment testing is not required. This new guidance was adopted in the fourth quarter of 2012 and its adoption did not significantly impact the Company’s consolidated financial statements.
Critical Accounting Policies and Other Matters
Management’s Discussion and Analysis of Financial Condition and Results of Operations are based upon our consolidated financial statements, which have been prepared in accordance with GAAP. The preparation of financial statements in conformity with those accounting principles requires management to use judgment in making estimates and assumptions based on the relevant information available at the end of each period. These estimates and assumptions have a significant effect on reported amounts of assets and liabilities, revenue and expenses as well as the disclosure of contingent assets and liabilities because they result primarily from the need to make estimates and assumptions on matters that are inherently uncertain. Actual results may differ from estimates. The following is a summary of certain accounting estimates and assumptions made by management that we consider critical.
Long-Lived Assets
Management reviews long-lived assets, which consist of property, leasehold improvements, equipment and definite-lived intangibles for impairment whenever events or changes in circumstances indicate that the carrying value of an asset may not be recoverable. For long-lived assets to be held and used, management evaluates recoverability by comparing the carrying value of the asset to future undiscounted cash flows expected to be generated by the asset. If the undiscounted cash flows are less than the carrying value of the asset, an impairment loss is recognized for the amount by which the carrying value of the asset exceeds the fair value of the asset. For long-lived assets for which we have committed to a disposal plan, we report such assets at the lower of the carrying value or fair value less the cost to sell.
In determining the fair value of long-lived assets, we make judgments relating to the expected useful lives of long-lived assets and our ability to realize any undiscounted cash flows in excess of the carrying amounts of such assets. Factors that impact these judgments include the ongoing maintenance and improvements of the assets, changes in the expected use of the assets, changes in economic conditions, changes in operating performance and anticipated future cash flows. If actual fair value is less than our estimates, long-lived assets may be overstated on the balance sheet, which would adversely impact our financial position.
97
Table of Contents
Goodwill and Indefinite-Lived Intangible Assets
Goodwill and intangible assets with indefinite useful lives are no longer amortized, but are tested and reviewed annually for impairment during the fourth quarter or whenever there is a significant change in events or circumstances that indicate that the fair value of the asset may be less than the carrying amount of the asset.
Between annual impairment tests, the Company continues to monitor for potential indicators of impairment of goodwill whenever events or changes in circumstances occur, such as a significant decline in the expected future cash flows, a significant adverse change in legal factors or in the business climate, adverse assessment or action by a regulator, and unanticipated competition.
Recoverability of goodwill is measured at the reporting unit level and begins with a qualitative assessment to determine, as a basis for whether it is necessary to perform the two-step impairment test under GAAP, if it more likely than not that the fair value of each reporting unit is less than its carrying amount. For the reporting units where it is required, the first step compares the carrying amount of the reporting unit to its estimated fair value. If the estimated fair value of a reporting unit exceeds its carrying amount, goodwill of the reporting unit is not impaired and the second step of the impairment test is not necessary. To the extent that the carrying value of the reporting unit exceeds its estimated fair value, a second step is performed, wherein the reporting unit’s carrying value of goodwill is compared to the implied fair value of goodwill. To the extent that the carrying value exceeds the implied fair value, impairment exists and must be recognized.
2014 Interim Impairment Test
In connection with the Providência Acquisition, the Company realigned its internal reporting structure to reflect its new organizational structure and business focus. Per ASC 350, “Goodwill and Other” (“ASC 350”), goodwill is required to be tested for impairment both before and after a reorganization. As a result, the Company performed a qualitative assessment during the third quarter and determined that goodwill was not impaired at any of the reporting units prior to the reorganization. Subsequent to the reorganization, the Company performed an interim goodwill impairment test and determined that the fair value of goodwill at the Argentina/Colombia reporting unit was zero and that all of its goodwill was impaired. As a result, the Company recorded a non-cash impairment charge of $6.9 million. The decline in fair value resulted from changes in the outlook on the operations, primarily in Argentina, as the local economic environment shifted compared to prior periods.
2014 Impairment Test
For our annual impairment test performed during the fourth quarter of 2014, we calculated the fair value of each of our reporting units. Based on the result of these calculations, we determined that the fair values of all our reporting units exceeded their carrying amounts. As a result, no impairment was recognized. The excess of our reporting units estimated fair value over carrying value (expressed as a percentage of carrying value) was a minimum of 15%, except for our Brazil reporting unit. The fair value of our Brazil reporting unit approximates its carrying value due to the short passage of time between the close date of the Providência Acquisition and the annual impairment testing date. Goodwill allocated to our Brazil reporting unit was $107.4 million as of December 31, 2014. Small variations to our assumptions and estimates used to determine the fair value of our Brazil reporting unit, particularly the expected growth rates, discount rate, cash expenditures embedded in our cash flow projections and the residual capitalization rate could have a significant impact on fair value. An unfavorable change in any of these assumptions could have caused us to fail step 1 of the goodwill impairment test, and step 2 of the goodwill impairment test would have been necessary and could have yielded an impairment of up to the entire goodwill allocated to our Brazil reporting unit of $107 million as of December 31, 2014. If the Brazil reporting unit does not achieve the operating results anticipated, we could record an impairment charge to goodwill in a future period.
Recoverability of other intangible assets with indefinite useful lives begins with a qualitative assessment to determine, as a basis for whether it is necessary to calculate the fair value of the indefinite-lived intangible asset,
98
Table of Contents
if it is more likely than not that the asset is impaired. When required, recoverability is measured by a comparison of the carrying amount of the intangible assets to the estimated fair value of the respective intangible assets. Any excess of the carrying value over the estimated fair value is recognized as an impairment loss equal to that excess. The determination of estimated fair value requires management to make assumptions about estimated cash flows, including profit margins, long-term forecasts, discount rates, royalty rates and terminal growth rates. Management developed these assumptions based on the best information available as of the date of the assessment. We completed our assessment of intangible assets with indefinite useful lives during the fourth quarter of 2014 and determined that no impairment existed at that date.
Although no impairment was recognized, there can be no assurances that future impairments will not occur. Future adverse developments in market conditions or our current or projected operating results could cause the fair value of our goodwill and intangible assets with indefinite useful lives to fall below carrying value, which would result in an impairment charge that would adversely affect our financial position.
Income Taxes
We record an income tax valuation allowance when, based on the weight of the evidence, it is more likely than not that some portion, or all, of the deferred tax asset will not be realized. The ultimate realization of the deferred tax asset depends on our ability to generate sufficient taxable income of the appropriate character in the future and in the appropriate taxing jurisdictions. In assessing the realization of the deferred tax assets, consideration is given to, among other factors, the trend of historical and projected future taxable income, the scheduled reversal of deferred tax liabilities, the carryforward period for net operating losses and tax credits, as well as tax planning strategies available to us. Additionally, we have not provided U.S. income taxes for undistributed earnings of certain foreign subsidiaries that are considered to be retained indefinitely for reinvestment. Certain judgments, assumptions and estimates are required in assessing such factors and significant changes in such judgments and estimates may materially affect the carrying value of the valuation allowance and deferred income tax expense or benefit recognized in our consolidated financial statements.
We recognize a tax benefit associated with an uncertain tax position when, in our judgment, it is more likely than not that the position will be sustained upon examination by a taxing authority. For a tax position that meets the more-likely-than-not recognition threshold, we initially and subsequently measure the tax benefit as the largest amount that we judge to have a greater than 50% likelihood of being realized upon ultimate settlement with a taxing authority. The liability associated with unrecognized tax benefits is adjusted periodically due to changing circumstances, such as the progress of tax audits, case law developments and new or emerging legislation. Such adjustments are recognized entirely in the period in which they are identified. The effective tax rate includes the net impact of changes in the liability for unrecognized tax benefits and subsequent adjustments as considered appropriate by management.
A number of years may elapse before a particular matter for which a liability related to an unrecognized tax benefit is audited and finally resolved. The number of years with open tax audits varies by jurisdiction. While it is often difficult to predict the final outcome or the timing of resolution of any particular tax matter, we believe our liability for unrecognized tax benefits is adequate. Favorable resolution of an unrecognized tax benefit could be recognized as a reduction in the effective tax rate in the period of resolution. Unfavorable settlement of an unrecognized tax benefit could increase the effective tax rate and may require the use of cash in the period of resolution. Accordingly, our future results may include favorable or unfavorable adjustments due to the closure of tax examinations, new regulatory or judicial pronouncements, changes in tax laws or other relevant events.
Revenue Recognition
Revenue is recognized and earned when all of the following criteria are satisfied: (a) persuasive evidence of a sales arrangement exists; (b) price is fixed or determinable; (c) collectability is reasonably assured; and (d) delivery has occurred or service has been rendered. We recognize revenue when the title and the risks and
99
Table of Contents
rewards of ownership have substantially transferred to the customer. We permit customers from time to time to return certain products and we continuously monitor and track such returns and record an estimate of such future returns, which is based on historical experience and recent trends. While such returns have historically been within management’s expectations and the provisions established have been adequate, we cannot guarantee that we will continue to experience the same return rates that we have in the past. If future returns increase significantly, it could adversely impact our results of operations.
Stock-Based Compensation
We account for stock-based compensation awards in accordance with ASC 718, “Compensation—Stock Compensation” (“ASC 718”), which requires a fair value based method for measuring the value of stock-based compensation. Fair value is measured once at the date of grant and is not adjusted for subsequent changes. We estimate the grant date fair value, and the resulting stock-based compensation expense, using the Black-Scholes option-pricing model. The Black-Scholes option-pricing model requires the use of highly subjective assumptions which determine the fair value of stock-based awards. These assumptions include the expected term, expected volatility, risk-free interest rate and the expected dividend. In the absence of a public trading market, we determine the fair value of our common stock utilizing methodologies, approaches and assumptions consistent with the American Institute of Certified Public Accountants Practice Aid, “Valuation of Privately-Held-Company Equity Securities Issued as Compensation.” Our approach considered contemporaneous common stock valuations in determining the equity value of our company using a weighted combination of various methodologies, each of which can be categorized under either of the following two valuation approaches: the income approach and the market approach. The assumptions used in calculating the fair value of stock-based payment awards represent our best estimates, but these estimates involve inherent uncertainties and the application of management judgment.
Employee Benefit Plans
We provide a range of benefits to eligible employees and retired employees, including pension and postretirement benefits. Determining the cost associated with such benefits is dependent on various actuarial assumptions including discount rates, expected return on plan assets, compensation increases, employee mortality and turnover rates and healthcare cost trend rates. Actuarial valuations are performed to determine expense in accordance with GAAP. Actual results may differ from the actuarial assumptions and are generally accumulated and amortized into earnings over future periods. The expected return on plan assets assumption impacts our net periodic benefit cost, since it is our practice to fund amounts for our qualified pension plans at least sufficient to meet the minimum requirements set forth in applicable employee benefit laws and local tax laws. For 2014, the range of return on assets assumptions for our pension plan assets, including U.S. Pension and Non-U.S. Pension Plans, was between 3.0% and 7.0%. The process for setting the expected rates of return is described in Note 14., Pension and Postretirement Benefit Plans, to the Consolidated Financial Statements. In 2014, an increase in the rate of return of 100 basis points for our U.S. Pension Plan assets and Non-U.S. Pension Plan assets would decrease our fiscal 2014 annual net periodic benefit cost by approximately $1 million and $1.4 million, respectively. In 2014, a decrease in the rate of return of 100 basis points for our U.S. Pension Plan assets and Non-U.S. Pension Plan assets would increase our fiscal 2014 annual net periodic benefit cost by approximately $1.0 million and $1.4 million, respectively.
For 2014, the range of return on assets assumptions for our pension plan assets, including U.S. pension and non-U.S. pension plans, was between 3.0% and 7.0%. The process for setting the expected rates of return is described in Note 14, Pension and Postretirement Benefit Plans, to the Consolidated Financial Statements. In 2014, an increase in the rate of return of 100 basis points for both U.S. and non-U.S. pension plan assets would decrease our fiscal 2014 net periodic benefit cost by approximately $2.4 million. In 2014, a decrease in the rate of return of 100 basis points for both U.S. and non-U.S. pension plan assets would increase our fiscal 2014 net periodic benefit cost by approximately $2.4 million.
100
Table of Contents
Since pension liabilities are measured on a discounted basis, the discount rate impacts our projected net benefit obligation and net periodic benefit cost. Discount rates used for our U.S. pension plans are based on a yield curve constructed from a portfolio of high quality bonds for which the timing and amount of cash outflows approximate the estimated payouts of the plan. For our non-U.S. pension plans, the discount rates are set by benchmarking against investment grade corporate bonds rated AA or better. The average discount rate on the defined benefit pension plans, including U.S. pension and non-U.S. pension plans, was between 1.7% and 8.0%. A 100-basis point increase in the pension discount rate for both U.S. and non-U.S. pension plans would decrease our 2014 annual net periodic benefit cost by approximately $0.3 million. A 100-basis point decrease in the pension discount rate for both U.S. and non-U.S. pension plans would increase our fiscal 2014 net periodic benefit cost by approximately $1.7 million.
We review our actuarial assumptions at each measurement date and make modifications to the assumptions based on current rates and trends, if appropriate. We believe that the assumptions utilized in recording our obligations under our plans are reasonable based on input from actuaries, outside investment advisors and information as to assumptions used by plan sponsors.
Quantitative and Qualitative Disclosures About Market Risk
We are exposed to fluctuations in currency exchange rates, interest rates and commodity prices which could impact our results of operations and financial condition. As a result, we employ a financial risk management program, whose objective is to seek a reduction in the potential negative earnings impact of changes in interest rates, foreign exchange rates and raw material pricing arising in our business activities. To manage these exposures, we primarily use operational means. However, to manage certain of these exposures, we used derivative instruments as described below. Derivative instruments utilized by us in our hedging activities are viewed as risk management tools, involve little complexity and are not used for trading or speculative purposes. To minimize the risk of counterparty non-performance, agreements are made only through major financial institutions with significant experience in such derivative instruments.
Long-Term Debt and Interest Rate Market Risk
Our objective in managing exposure to interest rate changes is to manage the impact of interest rate changes on earnings and cash flows as well as to minimize our overall borrowing costs. To achieve these objectives, we may use financial instruments such as interest rate swaps, in order to manage our mix of floating and fixed-rate debt.
The majority of our long-term financing consists of our $504.0 million of 7.75% fixed-rate, Senior Secured Notes due 2019 and $210 million of 6.875% fixed-rate, Senior Unsecured Notes due 2019. However, the remaining portion of our indebtedness, including the Term Loans, have variable interest rates, for which we have not hedged the risks attributable to fluctuations in interest rates. Hypothetically, a 1% change in the interest rate affecting our outstanding variable interest rate indebtedness, as of December 31, 2014 and December 28, 2013, would change our interest expense by approximately $7.3 million and $3.3 million, respectively.
Foreign Currency Exchange Rate Risk
Outside of the United States, we maintain assets and operations primarily in South America, Europe and Asia. As a result, our financial results are affected to a certain extent by changes in foreign currency exchange rates in the various countries in which our products are manufactured and/or sold. The reported income of our foreign subsidiaries will be higher or lower depending on a weakening or strengthening of the U.S. dollar, the Company’s reporting currency, against the respective foreign currency. We assess the market risk of changes in foreign currency exchange rates utilizing a sensitivity analysis that measures the potential impact on our operating income. If the average exchange rate used to translate revenue from our major currencies relative to the U.S. dollar hypothetically depreciated 10%, it would have resulted in a reduction of operating income by approximately $3.9 million and $2.6 million for the fiscal years ended December 31, 2014 and December 28, 2013, respectively.
101
Table of Contents
On January 27, 2014, we entered into a series of financial instruments with a third-party financial institution used to minimize foreign exchange risk on the future consideration to be paid for the Providência Acquisition and the Mandatory Tender Offer. Each contract allows us to purchase a fixed amounts of Brazilian reals in the future at specified U.S. dollar rates, coinciding with either the Providência Acquisition or the Mandatory Tender Offer. At June 28, 2014, the remaining financial instruments relate to a series of options that expire between 1 and 5 years associated with the Mandatory Tender Offer and the deferred portion of the consideration paid for the Providência Acquisition. In addition, we assumed a variety of derivative instruments in the Providência Acquisition used to reduce the exposure to fluctuations in interest rates and foreign currencies. These financial instruments include an interest rate swap, forward foreign exchange contracts and call option contracts.
Raw Material and Commodity Risks
The primary raw materials used in the manufacture of most of our products are polypropylene resin, polyester fiber, polyethylene resin, and, to a lesser extent, rayon and tissue paper. The prices of polypropylene, polyethylene and polyester are a function of, among other things, manufacturing capacity, demand and the price of crude oil and natural gas liquids. In certain regions of the world, we may source certain key raw materials from a limited number of suppliers or on a sole source basis. In addition, to the extent that we cannot procure our raw material requirements from a local country supplier, we will import raw materials from outside refiners. We believe that the loss of any one or more of our suppliers would not have a long-term material adverse effect on us because other suppliers with whom we conduct business would be able to fulfill our long-term requirements. However, the loss of certain of our suppliers or the delay in the import of raw materials could, in the short-term, adversely affect our business until alternative supply arrangements are secured and the respective suppliers were qualified with our customers, or when importation delays of raw material are resolved. We have not historically experienced, and do not expect, any significant disruptions in the long-term supply of raw materials.
We have not historically hedged our exposure to raw material increases with synthetic financial instruments. However, we have certain customer contracts with price adjustment provisions which provide for index-based pass-through of changes in the underlying raw material costs, although there is often a delay between the time we incur the new raw material cost and the time that we are able to adjust the selling price to our customers. On a global basis, raw material costs continue to fluctuate in response to certain global economic factors, including the regional supply versus demand dynamics for the raw materials and the volatile price of oil.
In periods of rising raw material costs, to the extent we are not able to pass along price increases of raw materials, or to the extent any such price increases are delayed, our cost of goods sold would increase and our operating profit would correspondingly decrease. Based on budgeted purchase volume for fiscal 2014 and fiscal 2013, if the price of polypropylene was to rise $.01 per pound and we were not able to pass along any of such increase to our customers, we would realize a $8.4 and a $5.6 million increase, respectively, million in our cost of goods sold. Significant increases in raw material prices that cannot be passed on to customers could have a material adverse effect on our results of operations and financial condition. In periods of declining raw material costs, if sales prices do not decrease at a corresponding rate, our cost of goods sold would decrease and our operating profit would correspondingly increase.
102
Table of Contents
We compete primarily in the global nonwovens industry, estimated to be worth in excess of $30 billion globally in 2013, according to Smithers Pira. Nonwovens are broadly defined as engineered sheet or web structures, made from polymers and/or natural fibers that are bonded together by entangling fiber or filaments mechanically, thermally or chemically. They are flat sheets that are made directly from separate fibers or from molten plastic or plastic film. By definition, they are not made by weaving or knitting and do not require converting the fibers to yarn.
Nonwovens are an extremely versatile specialty material that can be engineered and customized for various applications. These specialty materials take many forms, some have single-use or limited lives, while others can be very durable and long-lived. Nonwovens are engineered to provide specific characteristics such as absorbency, liquid repellency, resilience, stretch, softness, strength, flame retardancy, washability, cushioning, filtering, bacterial barriers and sterility. These properties are often combined to create fabrics suited for specific applications while achieving a good balance between product durability and cost. They can mimic the appearance, texture and strength of a woven fabric.
The global nonwoven fabrics industry is highly fragmented with many single-site and regional participants and only a few true global players. The top four companies in the industry accounted for approximately 20% of total market in 2013.
| 2013A Global Volume by Geography |
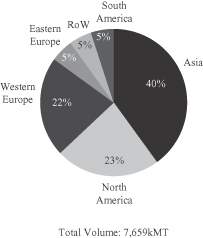
|
Source: Smithers Pira
According to Smithers Pira, global volume demand for nonwovens was approximately 7,659 thousand metric tons (“kMT”) in 2013 and is projected to grow at a CAGR by volume of 6.6% from 2013 to 2018 driven by:
| • | overall population growth; |
| • | aging population demanding products with a high content of nonwoven materials (such as adult diapers, wipes, and other products); |
| • | increases in global demand for disposable products driven by the increase of health standards; |
| • | a growing middle class in emerging markets driving greater consumption and penetration of sanitary products; |
103
Table of Contents
| • | environmental standards driving air filtration and water purification; |
| • | global economic development coupled with the development of new nonwoven applications and technologies; and |
| • | agricultural efficiency. |
Emerging markets, and in particular Asia and South America are expected to be the fastest growing areas of demand. Demand in Asia and South America is estimated to grow at 9.2% and 6.4% respectively annually through 2018. European and North American annual demand growth is also estimated to be robust at 4.5% and 5.2% through 2018.
| 2013A – 2018E Nonwovens Volume CAGR by Region |
|
|
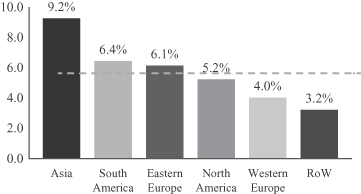
Source: Smithers Pira
From an end-use perspective, the hygiene and technical specialties and other market segments are the largest and accounted for approximately two-thirds of total nonwovens volumes in 2013. Hygiene applications represented 2,021kMT or $8.5 billion of the nonwovens market in 2013, according to Smithers Pira. Hygiene applications include baby diapers, baby training pants, feminine hygiene products and adult incontinence products. The technical specialties and other segment is the nonwovens industry’s largest and most-diverse segment with 2,909kMT of demand worth approximately $13.5 billion in 2013. Within this application, end-products include furniture, apparel and footwear, geosynthetics, and other durable nonwovens which serve a variety of end-uses including, for example, furniture and bedding, composites, and other industrial and infrastructure applications.
104
Table of Contents
Building and construction applications represented 1,101kMT of demand worth approximately $4.1 billion in 2013, according to Smithers Pira. Applications within the segment include housewrap and road underlayment liners for construction, geosynthetics for agricultural, forestry, military, and landscaping purposes. Healthcare applications represented 282kMT or $1.1 billion of the nonwovens industry in 2013, according to Smithers Pira. Healthcare applications include drapes and gowns, sterile packaging, other medical apparel, wound care (such as dressings/pads, sponges/gauze, cast paddings/wraps, tapes and swabs), and other medical nonwovens. Filtration applications represented 406kMT or $2.9 billion of the nonwovens industry in 2013, according to Smithers Pira. Within this category, end-products include air filtration (HEPA and standard), liquid filtration (pool and spa, and others) and medical filtration. Wipes represented 940kMT or $2.9 billion of the nonwovens industry in 2013, according to Smithers Pira. Applications include dryer sheets, personal care wipes, healthcare wipes, baby wipes, industrial wipes (such as auto, graphic arts, general purpose and other industrial) and all other wipes.
| 2013A Global Volume by End Market |
|
|
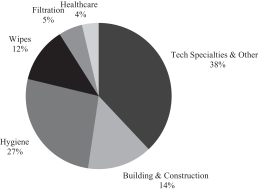
| (1) | Wipes end market comprises personal wipes, dryer sheets, disinfectant wipes and industrial wipes. |
| (2) | Filtration end market includes medical and industrial filtration applications. |
| 2013A – 2018E Volume CAGR by End Market |
|
|
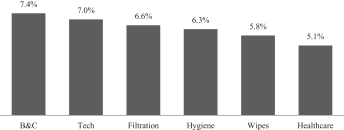
| (1) | Wipes end market comprises personal wipes, dryer sheets, disinfectant wipes and industrial wipes. |
| (2) | Filtration end market includes medical and industrial filtration applications. |
105
Table of Contents
Company Overview
We are a leading global innovator and manufacturer of specialty materials for use in a broad range of products that make the world safer, cleaner and healthier. We design and manufacture versatile high performance materials that can be engineered to possess specific value-added characteristics, including absorbency, tensile strength, softness and barrier properties. We serve customers focused on personal care, infection prevention, and high performance solutions, where our products are critical components used in a broad array of consumer and commercial products. For personal care applications, we supply specialty materials essential to the performance and feel of disposable baby diapers, feminine hygiene products, adult incontinence products, personal wipes and fabric softening dryer sheets. For infection prevention applications, our materials are utilized in products designed to ensure a clean environment, including disinfectant wipes, surgical gowns and drapes, face masks, wound care sponges, and water, air and blood filters. For high performance solutions, we supply protective house wrap, industrial cable wrap, construction and agricultural geosynthetics, as well as components for home and bedding products, industrial cleaning wipes, and various other applications.
We primarily manufacture nonwovens, which are fabric-like, value-added materials produced from polypropylene and other resins, along with natural and synthetic fibers and other components. The total nonwovens industry size is estimated to be worth in excess of $30 billion globally in 2013 and is expected to grow at a CAGR by volume of 6.6% from 2013 to 2018, according to Smithers Pira.
We are the largest global manufacturer of nonwovens based on our 2013 pro forma net sales, according to Nonwovens Industry. Over the past five years, we have undertaken a series of investments and acquisitions, including the Fiberweb Acquisition in November 2013 and the Providência Acquisition in June 2014, that have expanded our global presence, increased our product portfolio and broadened our technology base. As a result, we estimate that we generated approximately 70% of our 2014 pro forma net sales from applications for which we believe we have either the #1 or #2 position as measured by pro forma net sales or volume. We believe we have one of the largest global platforms in the nonwovens industry, with 22 manufacturing and converting facilities in 14 countries, including a significant presence in high-growth emerging markets such as South America and Asia. We have manufacturing capabilities in each of North America, South America, Europe and Asia, which we believe is a competitive advantage in serving our multi-national, blue-chip customers. Our manufacturing facilities are strategically located near the production facilities of many of our key customers in order to increase our effectiveness in addressing regional demand for our products, many of which do not ship economically over long distances.
Segment Overview
We manage our business through four reportable operating segments organized by geographic region: North America, South America, Europe and Asia. Each of our regional manufacturing facilities has a diverse range of capabilities and technologies to serve local demand trends and our customers’ specific requirements, which vary by region. Consequently, each of our regions serves a unique mix of customer applications; however, certain of our applications and customers are consistent across our regions. We believe that our ability to provide consistent, high-quality products across a variety of geographies is a strong competitive advantage in serving our global customers. In addition, our geographic breadth and broad range of applications reduce exposure to any one region, manufacturing facility, application, or customer.
North America
Our North America segment includes five manufacturing and converting facilities in the United States, one in Canada and one in Mexico. Our North America segment includes a broad array of product technologies, including our proprietary Reemay, Spinlace, Apex and TYPAR technologies, that collectively serve a wide spectrum of product applications. Within personal care, we believe we are a leading manufacturer of nonwovens
106
Table of Contents
for hygiene applications, such as baby diapers and feminine hygiene products, based on pro forma volume. Within infection prevention, we believe we are the largest provider of substrates for household cleaning wipes, based on pro forma volume and a leading supplier of specialty materials for use in various medical garments, such as surgical gowns and drapes. Within high performance solutions, we believe we are the largest provider of filtration media for pool and spa filters, as well as the #1 provider of protective house wrap in Canada, based on pro forma volume, and the #2 provider in the United States.
South America
Our South America segment includes two manufacturing facilities in Brazil, one in Argentina and one in Colombia. This footprint enables us to efficiently serve the Caribbean and Central America, the Andean Community (CAN) and the Southern Common Market (MERCOSUR) economic trade zones. All of our facilities in the region utilize leading-edge spunmelt technology and specialize in serving personal care applications, such as baby diapers and feminine hygiene products. We believe consumer adoption of these products is expected to grow rapidly with disposable incomes rising towards the levels of developed economies. We believe we are the leading provider of nonwovens for personal care applications in South America, based on pro forma volume. Within high performance solutions, we also serve certain specialty agriculture and industrial customers in this region.
Europe
Our Europe segment includes two manufacturing facilities in the United Kingdom, two in France, and one in each of Germany, Italy, Spain and the Netherlands. Our Europe segment also includes our India joint venture with one manufacturing facility located in India. Our European segment includes our most diverse set of technologies, such as our proprietary S-tex spunmelt and hydroentanglement technologies, and serves a broad array of personal care, infection prevention and high performance solutions applications. We believe we are the leading global provider of industrial cable wrap and have significant positions in geosynthetics for civil engineering, landscape and military use. We also have meaningful positions in hygiene applications, such as baby diapers and adult incontinence products, and healthcare products, such as surgical drapes, blood filtration and face masks.
107
Table of Contents
Asia
Our Asia segment consists of two manufacturing facilities in China. Infection Prevention applications currently represent approximately 60% of our pro forma net sales in Asia, with personal care applications accounting for 31% and high performance solutions applications accounting for the remaining 9%, for the fiscal year ended December 31, 2014. Our Asia region is the primary manufacturing base for servicing our global healthcare customers. For these applications, we supply our specialty materials to regional converters in Asia who cut and sew our products into finished goods for sale primarily in Europe and North America. In addition, we plan to utilize our leading-edge spunmelt technologies to participate in the rapid growth expected in the Asia region from rising disposable incomes and consumer adoption of personal care products.
| 2014 Pro Forma Net Sales by Geography |
2014 Pro Forma Adjusted EBITDA by Geography(1)(2) | |
|
|
| |
| (1) | For information about how we calculate pro forma Adjusted EBITDA, please see “Summary Historical and Pro Forma Condensed Combined Financial Information.” |
| (2) | Percentages in chart are presented before unallocated corporate expenses. |
Industry Overview
We compete primarily in the global nonwovens market, which was estimated to be worth in excess of $30 billion globally in 2013 and is estimated to grow at a CAGR by volume of 6.6% from 2013 to 2018, according to Smithers Pira. Nonwovens are broadly defined as engineered sheet or web structures, made from polymers and/or natural fibers that are bonded together by entangling fiber or filaments mechanically, thermally or chemically. Nonwovens are flat sheets that are made directly from separate fibers or from molten plastic or plastic film and, by definition, are not made by weaving or knitting and do not require converting the fibers to yarn. See “Industry.”
108
Table of Contents
Our Competitive Strengths
Global Leader with Strong Competitive Positions
We are a leading global supplier of specialty materials and the largest global manufacturer of nonwovens based on our 2013 pro forma net sales, according to Nonwovens Industry. The nonwovens industry has experienced significant consolidation in recent years, including our own acquisitions of Fiberweb and Providência, which we believe has improved our competitive position and enhanced our opportunities for growth across each of our geographic regions.
| 2013 Nonwovens Sales (in billions of $) |
|
|
Source: Nonwovens Industry.
| (1) | Includes $1.2 billion of revenue from PGI, $398 million of revenue from Fiberweb and $360 million of revenue from Providência. |
| (2) | Production is primarily for internal consumption. |
| (3) | Represents companies primarily focused on nonwovens for disposable applications, such as hygiene, healthcare, and wipes. |
We estimate that we generated approximately 70% of our 2014 pro forma net sales from applications for which we believe we have either the #1 or #2 position as measured by pro forma net sales or volume. Specifically, we believe that we are an industry leader in serving disposable applications as measured by pro forma net sales or volume, which accounted for approximately 70% of our 2014 pro forma net sales. We also believe we are the leading global supplier of nonwovens for applications in personal care and healthcare.
In addition, we believe we have leading positions in a number of niche applications. We believe that we hold a leading position in pool and spa filtration in the United States through our Reemay branded products, which are sold to filter manufacturers. We also believe that we are the leading manufacturer of substrates for dryer sheets in the United States. Through our Typar brand, we believe that we are the #1 provider of house wrap in Canada, based on pro forma volume, and the #2 provider in the United States. As we continue to evolve to higher value specialty materials, we believe there is meaningful opportunity to grow in each of the key applications which we serve: personal care, infection prevention and high performance solutions. We believe that our innovative and differentiated technology platforms position us well to gain share in these applications as we work to broaden the use of our products.
Our market positions in numerous applications are a reflection of our differentiated technologies, customer service and global footprint. These capabilities enable us to effectively serve global customers, such as Procter & Gamble and Cardinal Health, who are among the industry leaders in their respective product applications. Our marketing and research and development teams collaborate closely with customers to develop new products
109
Table of Contents
through the application of new technologies, as well as meet our customers’ stringent product qualifications and process standards. These factors encourage customer loyalty, leading to an average relationship length of approximately 15 years with our key customers.
Attractive Long-Term Industry Growth Outlook Driven by Socio-Economic Trends
According to Smithers Pira, global demand for nonwovens is projected to grow at a CAGR of 6.6% by volume from 2013 to 2018 driven by several socio-economic trends, including overall population growth, a growing middle class in emerging markets, an aging population, increasing health standards, product innovation and agricultural efficiency. These trends favorably impact the various applications which we serve. For example, population growth and rising incomes impact the consumption of personal care products, such as baby diapers and wipes. In addition, increasing life expectancy and an aging population in many developed countries present a growing opportunity for adult incontinence and healthcare products. For example, the market for adult incontinence products, which uses up to 60% more of our specialty materials than baby diapers, was estimated at $2.4 billion in 2013 and is expected to grow to $3.4 billion in 2018. Increasingly stringent health standards and consumer focus on infection prevention are also driving greater consumption of disposable medical gowns, drapes, face masks, sanitary wipes and disinfectant wipes. Our specialty materials also serve a number of attractive niche applications, such as house wrap, industrial cable wrap and geosynthetics, which could benefit from a recovery in construction spending.
Our specialty materials are primarily used to manufacture disposable products, which accounted for approximately 74% of our pro forma net sales for the fiscal year ended December 31, 2014. We believe disposable products, such as baby diapers and medical gowns, have attractive long-term growth trends and are less cyclical than durable products, strengthening our financial profile through economic cycles (as demonstrated in the table below by the sale volumes of disposable products from 2008 to 2012). We believe that this resilience, combined with the diversification of our revenues across regions and applications, enhance our long-term financial profile and mitigates the risk of disruptions within any region, application, facility or customer.
| Historical Disposable Application Growth | Expected Nonwoven Application Growth
|
Source: Smithers Pira.
Significant Exposure to Attractive Emerging Markets
We believe that emerging markets represent a significant long-term secular growth opportunity for our specialty materials, especially in personal care applications. In many emerging markets, penetration rates for personal care products that utilize specialty nonwoven materials, such as disposable baby diapers, are significantly lower relative to developed markets. For example, the penetration of baby diapers is only 27% in China and 62% in Central and South America, compared to 98% in the United States and Canada, according to Price Hanna Consultants estimates. We believe growth will be driven by increasing disposable product penetration resulting from rising per capita incomes as well as population growth. According to Smithers Pira, total nonwovens volume demand in South America and Asia is projected to grow at a CAGR of 6.4% and 9.2%, respectively, from 2013 to 2018.
110
Table of Contents
The chart below contrasts the high penetration rates in developed regions in diaper consumption with the significantly lower current penetration rates seen in developing markets, which present a sizable growth opportunity. According to Smithers Pira, a 1% increase in the penetration rate of disposable diapers in China in 2013 would result in approximately $30 million of incremental materials market value, assuming current product design and pricing. Additionally, under-developed regions, such as India, Africa, and other emerging markets in Asia, represent additional longer-term growth opportunities.
| 2012 Actual and Estimated Potential Diaper Consumption by Region (in Billions of Diapers) |
|
|
Source: Price Hanna Consultants estimates.
| * | Represents potential market size if these regions achieve a penetration rate of 100%. Actual future penetration rates will vary. |
We believe that we are well-positioned to capitalize on this anticipated demand. The Providência Acquisition strengthened our presence in South America, providing us with the #1 nonwovens position in the region based on pro forma volume and two attractive manufacturing assets in Brazil to complement our existing production facilities in Colombia and Argentina. Pro forma for the Providência Acquisition, we are the leading manufacturer of nonwovens for hygiene and medical products in the region. Additionally, recent capacity expansions in Nanhai, China (expected to be completed in 2015) and Suzhou, China (completed in mid-2013) have enhanced our manufacturing capabilities in Asia. In 2014, we derived approximately 30% of our pro forma net sales and 32% of our Adjusted EBITDA from our South America and Asia segments.
Scalable Cost Structure and Operational Excellence To Drive Margin Expansion
Our scalable global infrastructure and focus on operational excellence position us to reduce our costs and increase our operating margins as we expand both organically and through acquisitions. We have increased our gross profit margin and Adjusted EBITDA margin from 15.5% and 11.8%, respectively, in 2011 on a stand alone basis to 17.9% and 13.0%, respectively, for the year ended December 31, 2014, on a pro forma basis. We have achieved this margin expansion through a combination of annual productivity and cost saving initiatives as well as realization of cost synergies associated with our recent acquisitions. For example, as of the December 31, 2014, we have fully implemented initiatives at Fiberweb accounting for approximately $39.2 million of annualized savings (above our initial estimates of $28 million) and we continue to pursue initiatives aimed at achieving additional savings. Likewise, we have also identified initiatives that are estimated to generate meaningful synergies in connection with the Providência Acquisition.
111
Table of Contents
In addition to executing on the identified acquisition synergies, we have recently implemented a robust business excellence program designed to generate annual productivity savings, achieve a low-cost position, and prolong the useful life of our assets through product and process innovation. These initiatives have included continuous improvement programs focused on procurement, manufacturing, and distribution costs, facility consolidation and optimization, and optimization of our fixed cost structure. For example, in 2012, we restructured our global operations in order to consolidate our global footprint, align resources and capabilities with future growth opportunities, and provide a more efficient structure to serve existing customers. We believe we have the opportunity to continue to accelerate our annual productivity savings, which would serve to offset inflation in our business and benefit our margins.
Strong Free Cash Flow Generation
For the years ended December 29, 2012, December 28, 2013 and December 31, 2014, we have consistently generated strong free cash flow, which we define as Adjusted EBITDA minus capital expenditures, of $78.0 million, $155.8 million and $177.5 million, respectively. For the same periods, our Net cash provided by (used in) operating activities was $75.5 million, $16.9 million and $49.1 million, respectively. Our strong cash flow generation has benefited from pass-through pricing mechanisms in many of our customer contracts, which allow us to pass through increases in certain raw material costs by changing our prices, thereby mitigating the potential impact of fluctuations in raw material costs on our profitability.
Our cash flow generation also benefits from our disciplined approach to capital investments. We believe our maintenance capital requirements (defined as investments required to maintain current production capabilities) range from 2 to 2.5% of our annual net sales, enabling us to deploy a meaningful portion of our capital investments toward projects designed to expand our capacity and/or capabilities or to reduce our operating costs. For instance, over the past five years, we have commercialized four new state-of-the-art spunmelt lines to expand our capacity to meet growing demand as well as realize their lower relative production cost per unit and their ability to produce lower basis weight products suited for certain hygiene applications. Additionally, we have invested in commercializing proprietary technologies, such as our Spinlace and Arium platforms, that provide differentiated product capability and cost performance. Our cash flow generation in the future may also benefit from our significant net operating losses, which were $284.1 million as of December 31, 2014 and may result in reduced U.S. tax payments in the future.
Successful Track Record of Value-Enhancing Acquisitions
We have completed two significant acquisitions, Providência and Fiberweb, which enhanced our competitive position by expanding our capabilities in existing regions (like the US and Europe) and new regions (such as Brazil). These acquisitions also enhanced our technology positions in several new applications, such as filtration, where we believe there are significant growth opportunities. Additionally, given our scalable global infrastructure, we believe these acquisitions will result in meaningful cost savings and enhance our operating margins.
The Providência Acquisition was completed in June 2014 and strengthened our competitive position in North and South America. With three well-invested manufacturing facilities (two in Brazil and one in the United States) focused on hygiene applications, Providência’s operations were highly complementary with our existing operations. In particular, as a result of the acquisition, we are the largest producer of nonwovens in South America, with facilities in Brazil, Argentina and Colombia that enable us to cost-effectively serve customers across the continent. We have begun the integration of Providência into our existing regional operations and expect to generate meaningful cost savings from the elimination of duplicative costs, implementation of best practices, and by leveraging our enhanced scale.
The Fiberweb Acquisition was completed in November 2013. With operations in North America and Europe, Fiberweb improved our capabilities in several existing applications (such as hygiene and healthcare) but
112
Table of Contents
also meaningfully expanded our positions in several complementary applications, such as filtration, dryer sheets and house wrap. Fiberweb also provided access to several new technologies such as S-Tex (hygiene) and Nano fiber (filtration), which offer differentiated products to address our customers’ needs for innovation and customized solutions. Fiberweb has been fully integrated into our European and North American regions and we believe will generate significant cost savings, in excess of our initial estimates. As of December 31, 2014, we have fully implemented initiatives at Fiberweb accounting for approximately $39.2 million of annualized savings (above our initial estimates of $28 million).
Experienced Management Team
Our senior management team has extensive industry and operational experience and has been instrumental in developing and executing our growth strategy. Our nine person senior management team has an average of over 20 years of experience, including significant experience with specialty materials and similar businesses, and has successfully integrated numerous acquisitions. Our Chief Executive Officer, J. Joel Hackney Jr., who joined us in 2013 after holding a variety of senior executive roles with General Electric, Nortel and Avaya, has 21 years of relevant experience, including significant experience with leading global organizations and executing organic and acquisition-driven growth programs. Since mid-2012, we have successfully implemented an enhanced business strategy designed to significantly expand our business, both organically and through acquisitions, and to improve our cost structure and capital efficiency. We believe the proven abilities of our senior management team will allow us to continue to execute on our strategy, grow our global business, and deliver value to our stakeholders.
Our Strategy
Our mission is to provide superior products and services to enable our customers to create a safer, cleaner and healthier world. By leveraging our global team and broad portfolio of assets and technologies, we engineer customized solutions to meet our customers’ needs. We are focused on supplying consistent high quality products from our global manufacturing footprint, supported by knowledgeable local sales and technical service teams. We believe that our global presence and breadth of application expertise (further enhanced by the recent acquisitions of Fiberweb and Providência) provide a strong foundation for us to grow with our existing customers across the globe as well as for enhanced access to new customers across an array of highly specialized applications. As a result, we strive to grow our revenues consistent with the demand growth of the applications which we serve, while enhancing our operating efficiencies to improve our margins. To accomplish our mission and drive continued success, we are focused on the following strategies:
Support Continued Growth of Our Existing Customers Globally
We will invest to support the continued growth of our existing customers across the globe. As previously discussed, many of our customers’ products benefit from attractive growth trends and, consequently, our customers demand an increasing amount of our specialty materials. We will seek to enhance our competitive positions by providing cutting edge innovations, high quality and cost-effective products, and dedicated customer service. We will do so through initiatives to expand the production capacity of our current asset base as well as prudent capital investments to expand our capabilities. Many of our customers are increasingly growing their business globally, and we believe we are well positioned to gain market share with these customers given our global presence and ability to reliably deliver consistent products across the globe.
Further Strengthen our Positions in Emerging Markets
We intend to establish stronger positions in emerging markets through partnerships with new customers, as well as by accelerating growth with existing accounts where we are viewed as a strategic supplier. For example, the Providência Acquisition enhanced our position in South America, particularly Brazil, where we are now the leading supplier of hygiene products to a broad and long standing customer base. Additionally, in China, we have
113
Table of Contents
recently made significant capital investments in new production capacity designed to meet the growing demand for our products. In 2014, we generated 30% of our net sales and 32% of our Adjusted EBITDA in South America and Asia, on a pro forma basis. We believe there will be significant growth in our existing markets in South America and Asia. Additionally, in the future, we believe there may be growth opportunities in currently under-developed regions, where current penetration rates for many of the applications we serve are lower compared to other regions. As these emerging markets develop, we will continue to make careful, disciplined investments to expand our global capabilities and operations.
Pursue Growth in Complementary Businesses
We intend to use our industry expertise and capabilities to pursue growth opportunities in complementary products that share one or more key characteristics with our core businesses, including customers, products, manufacturing technologies or supply chain. We will prioritize opportunities in higher value applications with greater product differentiation, higher margins and lower capital intensity. For example, the Fiberweb Acquisition resulted in a significant improvement in our standing in several complementary applications, including filtration, dryer sheets and house wrap. By leveraging Fiberweb’s position and certain of our existing technologies and capabilities, we believe there may be opportunities to expand in these adjacent applications. We may pursue these opportunities organically or through targeted acquisitions depending on the specific industry dynamics and required capabilities.
Drive Business Excellence to Pursue Economic Leadership and Enhance Margins
Our success is dependent upon our ability to offer an attractive value proposition to our customers and to maximize customer satisfaction through our innovation, product quality and reliability. Consequently, we will seek to use our global platform and capabilities to offer solutions which maximize customers’ value and streamline their operations. We will also seek to improve our supply chain management to improve our cost position. We will seek to accelerate our business excellence initiatives to generate recurring annual productivity savings to offset inflation, enable reinvestment in growth, and improve our margins. These initiatives are focused on procurement savings, manufacturing yield optimization, lean initiatives, preventative maintenance and logistics savings. Over the past three years, we have increased our gross profit margin and Adjusted EBITDA margin from 15.5% and 11.8%, respectively, in 2011 on a stand alone basis to 17.9% and 13%, respectively, for the year ended December 31, 2014, on a pro forma basis. Through the realization of acquisition-related cost savings and our business excellence initiatives, we plan to continue to pursue improved cost positions and operating margins in the future.
Opportunistically Pursue Value-Enhancing Acquisitions
The nonwovens industry has experienced significant consolidation in recent years, including our acquisitions of Fiberweb and Providência. However, the industry remains relatively fragmented with many smaller regional players. In the future, we will continue to opportunistically evaluate potential acquisitions that enhance our business. We will prioritize transactions that complement our existing businesses, offer a potential for meaningful cost savings, enhance our capabilities in complementary products or regions or improve our growth profile by leveraging our existing customer relationships, technologies, global manufacturing and distribution network, and expertise in engineered materials.
Develop and Attract Top Talent
We strive to attract and develop the best talent in the industry. We work as a team to make a positive impact to our organization, our customers and suppliers, and the community. We believe that our history of growth and innovation coupled with our strong global position will highlight the Company as an attractive career opportunity for talented business leaders. Over the past several years, we have redesigned our global organization structure and significantly enhanced the senior leadership team adding resources and capabilities in several key areas to address our strategic growth priorities.
114
Table of Contents
Expansion and Optimization
Providência Acquisition
On January 27, 2014, we announced that Acquisition Co. entered into a stock purchase agreement with Providência and certain shareholders named therein. On June 11, 2014, Acquisition Co., our wholly-owned subsidiary, completed the acquisition of approximately 71.25% of the outstanding capital stock of Providência. The cash consideration due at closing of the Providência Acquisition was approximately R$437.8 million (or $196.1 million, based on our effective exchange rate of R$1.00 = $0.4481 as of June 11, 2014), of which (i) approximately R$419.4 million was paid to the selling shareholders (subject to specified deductions for certain transaction expenses), and (ii) R$18.4 million was deposited into an escrow account. Approximately R$106.9 million (or $47.9 million, based on our effective exchange rate of R$1.00 = $0.4481 as of June 11, 2014) relates to deferred purchase price (the “Deferred Purchase Price”). The Deferred Purchase Price is held by the Company and relates to certain unaccrued tax claims of Providência (the “Providência Tax Claims”). The Deferred Purchase Price is denominated in Brazilian real and accretes at a rate of 9.5% per annum compounded daily. Upon final resolution of the Providência Tax Claims by the Brazilian court, either tax payments for the Providência Tax Claims will be made to the Brazilian tax authorities or the Deferred Purchase Price will be paid to the selling shareholders. We will be responsible for any actual tax payment made to settle the Providência Tax Claims in excess of the Deferred Purchase Price.
In connection with the Providência Acquisition, on June 10, 2014, PGI Group entered into the Incremental Amendment providing for $415.0 million of commitments for incremental term loans, of which it borrowed $310.0 million. The remaining $105.0 million of commitments were available for borrowing until December 31, 2014 and were used to repay existing indebtedness during the third quarter of 2014. In addition, PGI Group issued the Senior Unsecured Notes pursuant to an indenture dated as of June 11, 2014. PGI Group used the borrowings under the Incremental Amendment and the proceeds from the Senior Unsecured Notes to fund a portion of the consideration due in respect of the Providência Acquisition, repay certain existing debt of Providência, pay related fees and expenses and for general corporate purposes. The borrowings under the Incremental Amendment, the Senior Unsecured Notes and the use of proceeds therefrom are collectively referred to in this prospectus as the “Providência Refinancing.”
As required by Brazilian law, Acquisition Co., our wholly-owned subsidiary, filed the Mandatory Tender Offer registration request with the CVM in order to launch, after its approval, a tender offer to acquire the remaining approximately 28.75% of the outstanding capital stock of Providência that is currently held by minority shareholders. The price per share to be paid to minority shareholders in connection with the Mandatory Tender Offer will be substantially the same paid to the selling shareholders upon acquisition of control, subject to a portion of such amount being held in escrow and subject to deferral as described above. Assuming all outstanding shares held by the minority shareholders are tendered, the total consideration, including accreted interest, for the Mandatory Tender Offer will be approximately Brazilian R$237.0 million as of December 31, 2014 (or $89.2 million, based on our effective exchange rate of R$1.00=$0.3763 as of December 31, 2014). In addition, we voluntarily opted to amend the Mandatory Tender Offer to provide minority shareholders with an alternative price structure with no escrow or deferred purchase price. Based on the alternative offer, the minority shareholders would receive an all-cash purchase price at closing. Assuming all minority shareholders tender their shares at the alternate price, the total consideration, including accreted interest, for the Mandatory Tender Offer will be approximately Brazilian R$202.5 million as of December 31, 2014 (or $76.2 million, based on our effective exchange rate of R$1.00=$0.3763 as of December 31, 2014). The Mandatory Tender Offer registration request is currently under review by the CVM. As of the date of this prospectus, we are not able to determine whether and when such approval to launch the Mandatory Tender Offer will be obtained. See “Risk Factors—Risks Related to our Acquisitions.”
Providência is a leading manufacturer of spunmelt nonwoven products based in Brazil, with a presence throughout the Americas, offering nonwoven fabrics under the KAMI brand. Its products are primarily used in hygiene and personal care applications, such as disposable diapers, sanitary pads, cleansing tissues and adult
115
Table of Contents
incontinence products. Providência’s products are also used for durable applications including furniture and bedding; various packaging applications; apparel; and agricultural applications. Providência operates state-of-the-art spunmelt technology, utilizing 13 Reicofil lines situated in three sites in North and South America. Providência was founded in 1963 and is based in São José dos Pinhais, Brazil. Following the completion of the Providência acquisition, Herminio Vicente Smania de Freitas joined PGI as President—South America & Global Hygiene. He continues to serve as chief executive officer of Providência.
Fiberweb Acquisition
On September 17, 2013, PGI Acquisition Limited, an indirect wholly-owned subsidiary of the Company, entered into an agreement with Fiberweb containing the terms of a cash offer to purchase 100% of the issued and to be issued ordinary share capital of Fiberweb at a cash price of £1.02 per share. The offer was effected by a court sanctioned scheme of arrangement of Fiberweb under Part 26 of the UK Companies Act 2006. On November 15, 2013, PGI Acquisition Limited, our indirect wholly-owned subsidiary, completed the acquisition of the entire issued ordinary share capital of Fiberweb for total cash consideration of approximately £180.1 million (or $287.8 million, based on our effective exchange rate of £1.00 = $1.5980), which was funded on November 27, 2013. To fund the cash consideration and to pay certain related fees and expenses, PGI Group borrowed $268.0 million under the Secured Bridge Facility and $50.0 million under the Unsecured Bridge Facility.
On December 19, 2013, PGI Group entered into the Term Loan Facility and borrowed $295.0 million of Term Loans thereunder. In addition, Blackstone made the Equity Contribution. The proceeds of such borrowings under the Term Loans and the Equity Contribution were used to repay in full the amounts outstanding under the Bridge Facilities. Following such repayment, the Bridge Facilities were terminated.
Fiberweb is one of the largest global manufacturers of specialized technical fabrics with eight production sites in six countries. Fiberweb creates materials that are found in many critical applications, including filtration, civil engineering, medical devices and products, railways, aerospace, buildings and agriculture. In each area, Fiberweb helps its customers meet a range of technical challenges from precise filtration to reducing the energy demands of housing.
Expansion Initiatives
In order to address the growing demand for hygiene and healthcare products, we have completed four capacity expansions since 2009. In addition, we recently commenced the upgrade of manufacturing lines at our facilities located in Tarragona, Spain and Benson, North Carolina, the expansion of our specialty materials manufacturing capabilities at our San Luis Potosi, Mexico, facility, and have completed an upgrade of a manufacturing line near Buenos Aires, Argentina, and our upgrade of machinery and the expansion of our manufacturing facility in Waynesboro, Virginia. A description of our completed expansion initiatives are as follows:
| • | In the second quarter of 2013, our spunmelt hygiene line in Suzhou, China commenced commercial production. The plant expansion increased capacity to meet demand for nonwoven materials in hygiene applications in China. |
| • | In the third quarter of 2011, our spunmelt line in Waynesboro, Virginia commenced commercial production. The plant expansion increased capacity to meet demand for nonwoven materials in hygiene and healthcare applications in the U.S. |
| • | In the third quarter of 2011, our spunmelt healthcare line in Suzhou, China commenced commercial production. The plant expansion increased capacity to meet demand for nonwoven materials in healthcare applications in China. |
| • | In the second quarter of 2009, our spunmelt line in San Luis Potosi, Mexico commenced commercial production. The plant expansion increased capacity to meet demand for nonwoven materials in hygiene and healthcare applications in the U.S. and Mexico. |
116
Table of Contents
Our expansion projects are funded using a combination of existing cash balances, internal cash flows and financing arrangements with third-party financial institutions. We intend to continue to expand where we believe there are attractive supply and demand characteristics as well as maintain and upgrade manufacturing lines to improve our global competitive position.
Optimization Initiatives to Achieve Economic Leadership
We actively and continuously pursue initiatives to prolong the useful life of our assets through product and process innovation. In some instances, we have determined that our fixed cost structure would be enhanced through consolidation. While investing in several new manufacturing lines in high-growth regions, we have simultaneously undertaken a number of initiatives to rationalize low-margin legacy operations and relocate certain assets to improve our cost structure. These initiatives are intended to result in lower working capital levels and improve operating performance and profitability. Our strategy with respect to past consolidation efforts in the U.S. and Europe was focused on the elimination of costs associated with underutilized legacy capacity, and we believe our current footprint reflects an appropriate and sustainable asset base.
Other Acquisitions and Divestitures
On April 29, 2011, we entered into an agreement to sell certain assets and the working capital of Difco for cash proceeds of $10.9 million. The agreement provided that Difco would continue to produce goods during the three month manufacturing transition services agreement that expired in the third quarter of 2011. The sale was completed on May 10, 2011 and resulted in a loss of $0.7 million recognized during the fiscal year ended December 31, 2011.
On May 26, 2010, we entered into the Nanhai Agreement. Pursuant to the Nanhai Agreement, we deposited $1.5 million into an escrow account with a bank to serve as a performance guarantee. On March 9, 2011, we received government approval and subsequently completed the noncontrolling interest acquisition for a purchase price of $7.2 million. The acquisition was accounted as an equity transaction in which no gain or loss was recognized.
On December 2, 2009, we completed an acquisition from Grupo Corinpa of certain assets and the operations of their nonwovens business located in Barcelona, Spain. Consideration for the acquired assets consisted of 1.049 million shares of the Predecessor’s Class A common stock which had a fair value of $14.5 million on the date of acquisition. The agreement contained a provision under which Grupo Corinpa was granted a put option on its land, building and equipment that were included in a lease under which we were provided full and exclusive use of the assets. In addition, the agreement contained a provision under which we were granted a call option for the same assets. On January 28, 2011, immediately prior to the Merger, we exercised our call option and purchased the remaining assets for an aggregate purchase price of $41.2 million.
Competition
Our industry is highly competitive throughout the world. Due to the diversity of the products we sell and the variety of segments we serve, we encounter a wide variety of regional and global competitors that vary by product line. They include well-established regional competitors, competitors who are more specialized than we are in particular applications, as well as larger companies or divisions of larger companies with substantial sales, marketing, research, and financial capabilities. Generally, the principal methods of competition relate to product innovation and performance, product quality, service, distribution and cost. In addition, technical support is highly valued by the largest customers.
Our primary competitors include Ahlstrom Corporation, Avgol Industries Ltd., E.I. du Pont de Nemours & Co., First Quality Enterprises, Inc., Fitesa, Toray Saehan, Inc., Intertape Polymer Group Inc. and Mitsui Chemicals, Inc., among others.
117
Table of Contents
Raw Materials
The primary raw materials used to manufacture most of our products are polypropylene resin, polyester fiber, polyethylene resin and, to a lesser extent, rayon and tissue paper. These raw materials are available from multiple sources and we purchase such materials from a variety of global suppliers. In certain regions of the world, we may source certain raw materials from a limited number of suppliers or on a sole-source basis. In addition, to the extent that we cannot procure our raw material requirements from a local country supplier, we will import raw materials from outside refiners.
We believe that the loss of any one or more of our suppliers would not have a long-term material adverse effect on us because other suppliers with whom we conduct business would be able to fulfill our long-term requirements. However, the loss of certain of our suppliers or the delay in the import of raw materials could, in the short-term, adversely affect our business until alternative supply arrangements are secured and the respective suppliers were qualified with our customers, or when importation delays of raw material are resolved. We have not historically experienced, and do not expect, any significant disruptions in the long-term supply of raw materials.
Sales and Marketing
We sell a majority of our products through our regional direct sales force of approximately 140 individuals worldwide. Our sales and marketing activities are organized primarily on a regional basis to provide customers with local sales and technical support. We combine our local technical sales capabilities with key account management support provided by our global product application groups to offer an attractive overall value proposition and to provide customers with the benefits of our global scale. We endeavor to extend these commercial and technical relationships to multiple levels within our customers’ organization using our direct sales force and technical service group to accomplish this objective.
Our global product application groups are responsible for global market development and product positioning, expansion of our business and the design and implementation of short and mid-term marketing strategies activities. They monitor relevant market trends, gather market intelligence and set pricing parameters for our key products. Additionally, our global product application groups coordinate with our sales force and technical specialists to ensure that the needs of our customers are addressed, and assist with the development and commercialization of new products.
Inventory and Backlogs
At December 31, 2014 and December 28, 2013, our inventory balance was $173.7 million and $156.1 million, respectively. As a result, our days of inventory on hand represented 39 days at December 31, 2014 and 41 days at December 28, 2013. Unfilled orders as of December 31, 2014 amounted to approximately $171.4 million. The level of unfilled orders is affected by many factors, including the timing of orders and the delivery time for the specific products. Unfilled orders typically represent approximately 30 to 40 days of annualized sales. Historically, we have not experienced a high level of unfilled order volatility. Consequently, we do not consider the amount of unfilled orders a meaningful indicator of future sales.
Patents and Trademarks
We consider our patents and trademarks to be important to our business and seek to protect our proprietary know-how in part through United States and foreign patent and trademark registrations. We have over 1,300 pending and approved trademark and domain name registrations worldwide and over 600 pending and approved patents worldwide, and maintain certain trade secrets.
118
Table of Contents
Research and Development
We engage in research and development activities in an effort to introduce new products, enhance existing products effectiveness, increase safety, improve ease of use and reliability as well as expand the various applications for which our products may be appropriate. In addition, we continually evaluate developing technologies in areas that we believe will enhance our business for possible investment or acquisition. We will continue to make expenditures for research and development activities as we look to maintain and improve our competitive position.
Environmental Regulations
We are subject to a broad range of federal, foreign, state and local laws and regulations relating to the pollution and protection of the environment. Various environmental requirements are applicable to us, including laws relating to air emissions, wastewater discharges, the handling, storage, disposal and release of solid and hazardous substances and wastes, remediation of soil, surface and groundwater contamination and human health and safety. We do not currently anticipate any material adverse effect on our operations or financial or competitive position as a result of our efforts to comply with environmental requirements. However, some risk of environmental liability is inherent due to the nature of our business and, accordingly, there can be no assurance that material environmental liabilities will not arise.
Seasonality
Historically, use and consumption of our products in most regions and applications do not fluctuate significantly due to seasonality. However, with the acquisition of Fiberweb, we have seen increased exposure to seasonality in certain applications, such as building and construction, agriculture and geosynthetics, as sales volumes correspond to the applicable building or growing season as the case may be.
Employees
As of December 31, 2014, the Company had approximately 4,400 employees worldwide. Of this total, approximately 49% of these employees are represented by labor unions or trade councils that have entered into separate collective bargaining agreements with the Company. All of these collective bargaining agreements will expire within one year. We believe our employee relations are satisfactory.
119
Table of Contents
Properties
The Company and its subsidiaries operate several manufacturing plants and facilities, a majority of which are owned by us, with the remainder under long-term lease agreements. The Company believes that its facilities are generally well-maintained, in good condition and adequate for our current needs. As of January 1, 2015, a list of our principal manufacturing plants and facilities in addition to the principal functions performed at each respective location is as follows:
| Principal Function | ||||||||||
| Location |
Manufacturing | Warehousing | Research and Development |
Sales and Marketing |
Administration | |||||
| North America |
||||||||||
| Benson, North Carolina |
X | X | X | — | — | |||||
| Mooresville, North Carolina |
X | X | X | — | — | |||||
| Old Hickory, Tennessee |
X | X | X | X | X | |||||
| Portland (Clackamas), Oregon |
— | — | — | — | — | |||||
| Waynesboro, Virginia |
X | X | X | — | — | |||||
| North Bay (Ontario), Canada |
X | X | X | X | X | |||||
| San Luis, Potosi, Mexico |
X | X | X | X | X | |||||
| Statesville, North Carolina |
X | X | X | — | X | |||||
| South America |
||||||||||
| Buenos Aires, Argentina |
X | X | X | X | X | |||||
| Cali, Colombia |
X | X | X | X | X | |||||
| São José dos Pinhais, Brazil |
X | X | X | X | X | |||||
| Pouso Alegre, Brazil |
X | X | X | X | X | |||||
| Europe |
||||||||||
| Bailleul, France |
X | X | X | X | X | |||||
| Biesheim, France |
X | X | X | X | X | |||||
| Berlin, Germany (leased) |
X | X | — | X | X | |||||
| Terno d’Isola, Italy |
X | X | — | X | X | |||||
| Cuijk, the Netherlands |
X | X | X | X | X | |||||
| Tarragona, Spain |
X | X | X | X | — | |||||
| Aberdare, United Kingdom |
X | X | — | — | — | |||||
| Maldon, United Kingdom |
X | X | X | X | X | |||||
| Mundra, India |
X | X | — | — | X | |||||
| Asia |
||||||||||
| Nanhai, China |
X | X | — | X | X | |||||
| Suzhou, China |
X | X | X | X | X | |||||
| Global Headquarters |
||||||||||
| Charlotte, NC (leased) |
— | — | X | X | X | |||||
Capacity utilization during 2014 varied by geographic location and manufacturing capabilities. However, most of the facilities operated moderately below capacity.
Litigation
We are engaged in the defense of certain claims and lawsuits arising out of the ordinary course and conduct of our business, the outcomes of which are not determinable at this time. We have insurance policies covering such potential losses where such coverage is cost effective. In our opinion, any liability that might be incurred by us upon the resolution of these claims and lawsuits will not, in the aggregate, have a material adverse effect on our financial condition or results of operations.
120
Table of Contents
The following chart summarizes our organizational structure, equity ownership and our principal indebtedness immediately following the consummation of the Offering. This chart is provided for illustrative purposes only and does not represent all legal entities of the Company and its consolidated subsidiaries or all obligations of such entities.
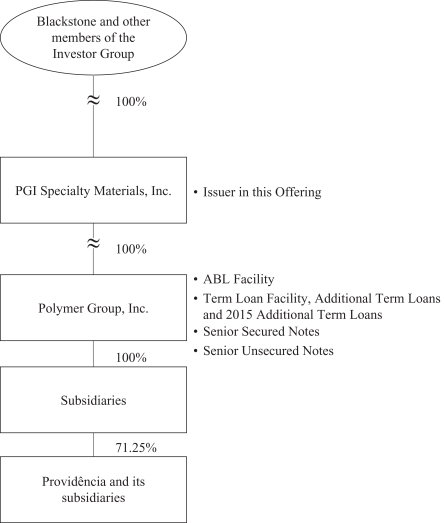
121
Table of Contents
Directors and Executive Officers
The following table sets forth certain information regarding our directors and executive officers (age as of April 15, 2015):
| Name |
Age |
Position | ||
| J. Joel Hackney, Jr. |
45 | President & Chief Executive Officer and Director | ||
| Mike S. Zafirovski |
61 | Director and Non-Executive Chairman | ||
| James S. Alder |
66 | Director | ||
| Peter N. Foss |
71 | Director | ||
| Jason Giordano |
36 | Director | ||
| Veronica Hagen |
68 | Director | ||
| Christine St.Clare |
64 | Director | ||
| Dennis Norman |
40 | Executive Vice President & Chief Financial Officer | ||
| Robert Dale |
58 | President, APAC & Global Healthcare | ||
| Jean-Marc Galvez |
48 | President, EMEA & Global Building and Geosynthetics | ||
| Scott Tracey |
46 | President, Americas & Global Wipes and Technical Specialties | ||
| Herminio de Freitas |
53 | President, South America and Global Hygiene | ||
| Barry Murash |
51 | President, Global Operations & Business Excellence | ||
| Daniel Guerrero |
49 | Senior Vice President, Strategy & Business Development | ||
| Robert Holmes |
51 | Senior Vice President, Global Human Resources & Employee Communications | ||
| April Miller Boise |
46 | Senior Vice President, General Counsel, Head of Global Mergers & Acquisitions and Secretary |
J. Joel Hackney, Jr. has served as the President, Chief Executive Officer and Director of the Company since June 2013. Prior to joining the Company, Mr. Hackney served as the Senior Vice President and General Manager of Avaya Cloud Solutions since January 2013. Prior to that and since June 2010, he served as Avaya’s Senior Vice President of Global Sales and Marketing and President of Field Operations. From December 2009 until June 2010, he was Avaya’s Senior Vice President and President of Avaya Government and Data Solutions. Previously, he spent four years at Nortel Networks Corporation where, from September 2007 to December 2009, he served as the President of Nortel Enterprise Solutions and, from December 2005 to September 2007, he served as the Senior Vice President of Global Operations and Quality. Prior to his career at Nortel Networks Corporation, Mr. Hackney was a member of the senior executive team within General Electric, where he had a 14-year career leading varied businesses and functions in the U.S. and Europe. He holds a B.S. degree in Business Administration from the University of North Carolina at Chapel Hill.
Mike S. Zafirovski has served as a Director of the Company and non-executive Chairman of the Board since December 2012. Mr. Zafirovski is the founder and president of The Zaf Group LLC, which he established in November 2012. Since October 2011, Mr. Zafirovski has served as an Executive Advisor to The Blackstone Group, L.P. Previously, he served as director, President and Chief Executive Officer of Nortel Networks Corporation from November 2005 to August 2009. Prior to that, Mr. Zafirovski was director, President and Chief Operating Officer of Motorola, Inc. from July 2002 to January 2005, and remained a consultant to and a director of Motorola until May 2005. He served as Executive Vice President and President of the Personal Communications Sector (mobile devices) of Motorola from June 2000 to July 2002. Prior to joining Motorola, Mr. Zafirovski spent nearly 25 years with General Electric Company, where he served in management positions, including 13 years as President and Chief Executive Officer of five businesses in the industrial and financial services arenas, his most recent being President and Chief Executive Officer of GE Lighting from July 1999 to May 2000. Mr. Zafirovski also serves as Chairman of the Board of DJO Global, Inc. and on the boards of The Boeing Company, Stericycle, Inc., and Apria Healthcare Group, Inc. Mr. Zafirovski received a BA in Mathematics from Edinboro University.
122
Table of Contents
James S. Alder has served as a Director of the Company since March 2011. Until his retirement in October 2011, Mr. Alder served as Senior Vice President, Operations and Technical of Celanese Corporation overseeing Celanese’s global manufacturing, supply chain, EHS, and technology operations, as well as the overall productivity efforts, including Six Sigma and operational excellence. Mr. Alder joined Celanese in 1974 and held various roles within Celanese in manufacturing, research and development, and business management. Mr. Alder has a BS in Chemical Engineering from the Massachusetts Institute of Technology.
Peter N. Foss has served as a Director of the Company since December 2014. Mr. Foss is currently the General Manager of the GE/NFL Brain Research Program within GE Healthcare, a unit of General Electric Company, since his appointment in November 2013. Until his retirement in February 2013, Mr. Foss served as the President of General Electric Company’s Olympic Sponsorship and Corporate Accounts since 2003. Prior to his most recent positions, Mr. Foss spent nearly 25 years in various leadership positions within General Electric Company, including General Manager of Enterprise Selling, Regional General Manager of four GE Plastics regions and President of GE Polymerland, Inc., as well as various other commercial roles. Mr. Foss currently serves as a director of Capital Bank, N.A., a subsidiary of Capital Bank Financial Corp. Mr. Foss has a BS in Chemistry from the Massachusetts College of Pharmacy.
Jason Giordano is a Managing Director in Blackstone’s Private Equity Group and has served as a Director of the Company since January 2011. Since joining Blackstone in 2006, Mr. Giordano has been involved in Blackstone’s investments in PGI Group, Pinnacle Foods, Birds Eye Foods, Outerstuff, and Crocs. Before joining Blackstone, Mr. Giordano was with Bain Capital where he evaluated and executed global private equity investments in a wide range of industries. Prior to that, he worked in investment banking at Goldman, Sachs, & Co. focused on Communications, Media and Entertainment clients. Mr. Giordano received an AB from Dartmouth College and an MBA from Harvard Business School. Mr. Giordano serves as a director of Pinnacle Foods, Crocs, Outerstuff and HealthMarkets.
Veronica Hagen has served as a Director of the Company since April 2007. From April 2007 until June 2013 she was Chief Executive Officer and was President between January 2011 and June 2013. Prior to joining the Company, Ms. Hagen served as the President and Chief Executive Officer of Sappi Fine Paper North America, a $1.4 billion division of the South African-based Sappi Limited, since November 2004. Prior to working for Sappi, Ms. Hagen served in various executive roles with Alcoa, Inc. since 1998, including Chief Customer Officer from 2003 to 2004 and President, Alcoa Engineered Products from 2001 to 2003. Ms. Hagen also serves as a director of Newmont Mining Corporation and Southern Company. Ms. Hagen holds a BS in International Relations from the University of Southern California and has participated in an Executive Education program in Finance from the Wharton School, University of Pennsylvania and an Executive Leadership program at Harvard University.
Christine St.Clare has served as a Director of the Company since February 2013. Ms. St.Clare is the founder and president of St.Clare Advisors, LLC, a firm she founded after retiring from KPMG LLP in September 2010 following a 35-year career with the firm. While at KPMG, Ms. St.Clare served a four-year term on the firm’s Board of Directors from 1994 to 1998 and chaired the board’s Audit and Finance Committee. As an Audit Partner from 1986 to 2005, she served as the engagement partner for some of KPMG’s largest clients. She subsequently served as an Advisory Partner from 2005 to 2010 focusing on the Internal Audit, Risk and Compliance Practice. Concurrently, she was the Partner-in-Charge of the Southeast Consumer Markets practice. She currently serves as a director and audit committee chair of Fibrocell Science, Inc. and as a director and audit committee member of AquaBounty Technologies Inc. Ms. St.Clare holds a BS in accounting from California State University, Long Beach.
Dennis Norman was appointed Chief Financial Officer in December 2009. Prior to his current role as Chief Financial Officer, Mr. Norman served as Vice President, Strategy and Corporate Development with responsibilities for long-term planning, capital markets, mergers and acquisitions and investor relations. Mr. Norman joined the Company in November 1999 in investor relations and in 2001 he became Director of Investor Relations & Business Planning. In 2003, he was appointed as a member of the new global management
123
Table of Contents
team as Vice President, Strategic Planning and Communications. In 2008, his title changed to Vice President, Strategy & Corporate Development, reflecting a greater concentration on corporate strategy, development and capital markets activities. Prior to joining the Company, Mr. Norman was with First American Corporation, a regional financial services company, working in various roles in commercial banking then investor relations and strategic planning. Mr. Norman received a BA in both Business Administration and Accounting from Samford University in Birmingham, Alabama and an MBA from The Citadel.
Robert Dale was appointed President, APAC & Global Healthcare in June 2014. Mr. Dale is responsible for the strategic and operational management of our business in the Asia region and the Company’s global strategy and growth of our hygiene segment. Prior to his current role, Mr. Dale served as the President, APAC & Global Hygiene since January 2014 and served as the Senior Vice President and General Manager of the Asia region since January 2013. From April 2012 to January 2013, Mr. Dale served as Vice President & Global Segment Manager-Wipes & Filtration. From July 2007 to April 2012, Mr. Dale was our Senior Vice President, Research & Development. Mr. Dale has been a key employee of the Company since 1991, serving in a variety of commercial and operating roles. Prior to joining the Company, Mr. Dale held progressively more responsible positions in operations, process engineering, quality management and regulatory affairs at Johnson & Johnson, Kendall Health Care and Milliken. Mr. Dale is a graduate of the University of Georgia and received an MBA from Georgia Regents University.
Jean-Marc Galvez was appointed President, EMEA & Global Building and Geosynthetics in January 2014. Mr. Galvez is responsible for the strategic and operational management of our business in the EMEA region and the Company’s global strategy and growth of our building and geosynthetics segments. Prior to his current role, since April 2012, Mr. Galvez served as the Senior Vice President and General Manager of the EMEA region. Mr. Galvez joined the Company in July 2011 as the Vice President of Sales, Marketing and Development for the EMEA region. Prior to joining the Company, he was the Global Commercial General Manager at Merquinsa from May 2002 to July 2011. He has also held various commercial roles of increasing responsibility at Monsanto and Dow Chemical. Mr. Galvez holds a master’s and bachelor’s degree in chemical engineering from École Nationale Supérieure de Chimie of Montpellier, a PDG (general manager executive education) from IESE Business School, and has completed an executive finance course at Insead.
Scott Tracey was appointed President, North America & Global Wipes and Technical Specialties in May 2014. Mr. Tracey is responsible for the strategic and operational management of our business in the North America region and the Company’s global strategy and growth of our wipes and technical specialties segments. Prior to his current role, Mr. Tracey served as the President, Americas & Global Wipes and Technical Specialties from April 2012 to May 2014. From December 2009 to April 2012, Mr. Tracey served as the Senior Vice President and General Manager of the EMEA region. Mr. Tracey joined the Company in 2004 as Vice President, Sales and Marketing, Branded and has held various positions including U.S. Vice President of Sales, Marketing and Business Development. Prior to joining the Company, Mr. Tracey held multiple leadership positions at SOLO, Sweetheart Cup, Fonda Group and Anchor Packaging. Mr. Tracey received a BS in Marketing from Indiana University and an MBA from Georgia State University.
Herminio de Freitas joined the Company in June of 2014 as President, South America & Global Hygiene following the acquisition of Companhia Providência Industria e Comercio. Mr. de Freitas is responsible for the strategic and operational management of our business in the South American region and the Company’s global strategy and growth of our hygiene segment. Prior to joining the Company, Mr. de Freitas was Chief Executive Officer of Providência since 2007. During the period from 1983 to 2006, he held several positions in Petropar S.A. and its subsidiaries, among them, Plant Manager of Fitesa North America, Director of Fitesa S.A. and Chief Financial and Investor Relations Officer for Petropar S.A. Mr. de Freitas holds a degree in Chemical Engineering from the Universidade Federal do Rio Grande do Sul. He also completed a Program for Management Development (PMD) at Harvard Business School.
Barry Murash joined the Company in January 2014 as the President, Global Operations & Business Excellence. In this role, Mr. Murash assumed leadership of the Company’s global supply chain, business
124
Table of Contents
excellence, employee health and safety, capital engineering and regional manufacturing functions. Prior to joining the Company, since January 2013, Mr. Murash was the Corporate Vice President, Global Fulfillment for Applied Materials where he was responsible for procurement, logistics, service parts distribution and order management, leading an organization of over 650 employees. While at Applied Materials, Mr. Murash also served as Vice President, Global Sourcing from May 2012 to January 2013 and Vice President, Services Product Operations from November 2010 to May 2012. Prior to that, he served as Vice President, Global Operations for Avaya from November 2009 to November 2010. Prior to Avaya, and since 1987, Mr. Murash held several roles of increasing responsibility with Nortel. Mr. Murash holds a BA and an MBA from the University of Manitoba and is a Certified Management Accountant.
Daniel Guerrero was appointed Senior Vice President, Strategy & Business Development in January 2014. Mr. Guerrero is responsible for strategic planning, marketing, research & development, and business development, including pricing strategy. Prior to his current role, since July 2013, Mr. Guerrero served as the Senior Vice President, Global Supply Chain and from April 2012 to July 2013, as Vice President, Procurement & Process Excellence within the Global Supply Chain function. Previously, since November 2011, he was Senior Vice President, Global Operations and Business Excellence, and from November 2009 to November 2011, was Senior Vice President and General Manager for the U.S. Region. Mr. Guerrero joined the Company in 1999 as part of the leadership team at our Colombia manufacturing facility and over the course of his career has held various roles in finance, administration, sales and marketing, operations, and supply chain. Mr. Guerrero holds a BS in Business Administration and a Masters in Finance from the ICESI University.
Robert Holmes joined the Company in July 2014 as the Senior Vice President of Global Human Resources and Employee Communications. In this role, Mr. Holmes assumed responsibility for the global talent, development, recruiting, total rewards and all aspects of the human resources agenda for the Company. Prior to joining the Company, Mr. Holmes was with Applied Materials from January 2013 to July 2014 where he served as Vice President of Human Resources, Worldwide Operations from January 2013 to September 2013, and then was asked to serve as Vice President of Human Resources for all of the Global Corporate Functions. Prior to joining Applied Materials, Mr. Holmes held executive roles with Nokia Networks from May 2009 to January 2013, and before that, held several roles of increasing responsibility with Nortel. Mr. Holmes holds a BS in Computer Engineering from The Ohio State University and an MBA for the Kelly School of Business at Indiana University.
April Miller Boise joined the Company in March 2015 as Senior Vice President, General Counsel, Head of Global Mergers & Acquisitions and Secretary. Ms. Boise is responsible for the legal affairs of the Company and is the Company’s chief compliance officer. Additionally, Ms. Boise leads the Company’s mergers and acquisitions efforts. Ms. Boise has more than twenty years of experience advising executive leaders in public and private companies on corporate governance, mergers, acquisitions, joint ventures, and capital market transactions. Prior to joining the Company, Ms. Boise served as Vice President, General Counsel and Corporate Secretary and member of the senior leadership team of Veyance Technologies, Inc. (formerly Goodyear Engineered Products) from January 2011. Prior to Veyance Technologies, Inc., Ms. Boise was Managing Partner of Thompson Hine’s Cleveland office and member of the law firm’s executive committee. She also served as the chair of the firm’s Private Equity group and was a founder and chair of the women’s initiative. Ms. Boise received a Bachelor’s of Business Administration from the University of Michigan Business School and a Juris Doctor from the University of Chicago Law School.
Our Corporate Governance
We have structured our corporate governance in a manner we believe closely aligns our interests with those of our stockholders. Notable features of our corporate governance include:
| • | our Board of Directors will be divided into three classes of directors, with the classes to be as nearly equal in number as possible, and with the directors serving three-year terms; |
125
Table of Contents
| • | we will have independent director representation on our audit, compensation and nominating and corporate governance committees immediately at the time of the offering, and our independent directors will meet regularly in executive sessions without the presence of our corporate officers or non-independent directors; |
| • | we anticipate that at least one of our directors will qualify as an “audit committee financial expert” as defined by the SEC; and |
| • | we will implement a range of other corporate governance best practices, including placing limits on the number of directorships held by our directors to prevent “overboarding” and implementing a robust director education program. |
Composition of the Board of Directors after this Offering
Prior to the completion of this offering, we expect that , additional independent directors, will be elected to our Board of Directors.
Our business and affairs are managed under the direction of our Board of Directors. In connection with this offering, we will amend and restate our certificate of incorporation to provide for a classified Board of Directors, with directors in Class I (expected to be ), directors in Class II (expected to be ) and directors in Class III (expected to be ). See “Description of Capital Stock—Anti-Takeover Effects of our Amended and Restated Certificate of Incorporation and Amended and Restated Bylaws and Certain Provisions of Delaware Law—Classified Board of Directors.” In addition, we intend to enter into a shareholders agreement with certain affiliates of our Sponsor and other stockholders in connection with this offering. This agreement will grant our Sponsor the right to designate nominees to our Board of Directors subject to the maintenance of certain ownership requirements in us. As of the time of this offering our Sponsor would have the right to nominate at least a majority of the total number of directors comprising our Board of Directors. See “Certain Relationships and Related Party Transactions—Shareholders Agreement.”
Background and Experience of Directors
When considering whether directors and nominees have the experience, qualifications, attributes or skills, taken as a whole, to enable our Board of Directors to satisfy its oversight responsibilities effectively in light of the Company’s business and structure, our Board of Directors focuses primarily on each person’s background and experience as reflected in the information discussed in each of the directors’ individual biographies set forth immediately above. We believe that our directors provide an appropriate mix of experience and skills relevant to the size and nature of the Company’s business. In particular, the members of our Board of Directors considered the following important characteristics of our directors: (i) Mr. Giordano has significant financial and investment experience from his involvement in The Blackstone Group’s investment in numerous portfolio companies and has played active roles in overseeing those businesses, (ii) Mr. Zafirovski has significant experience leading high-technology enterprises with significant international operations and his senior executive leadership at Nortel, Motorola and GE enable him to provide unique perspectives on general management, strategy planning, technology development, security and financial matters, (iii) Ms. Hagen, our Director and former Chief Executive Officer and President, has extensive experience in leading corporations in the manufacturing sector, including her knowledge and skills in senior management and operations of the Company, among other attributes, (iv) Mr. Alder has extensive knowledge in global manufacturing businesses, as well as manufacturing, technology and executive leadership experience; (v) Mr. Hackney brings financial and executive leadership in a diverse range of businesses; (vi) Ms. St.Clare has expertise in the areas of accounting, audit, governance, risk and compliance matters; and (vii) Mr. Foss brings extensive managerial and sales experience in a diverse range of businesses.
In January 2009, Nortel Networks Corporation, for which Mr. Zafirovski served as director, President and Chief Executive Officer, and subsidiary companies, including Nortel Enterprise Solutions, for which Mr. Hackney served as President, filed for bankruptcy protection in the United States, Canada and Europe. Our
126
Table of Contents
Board of Directors has concluded that these events do not impair Mr. Zafirovski’s or Mr. Hackney’s ability to continue to serve as a director. Mr. Zafirovski resigned from Nortel on August 9, 2009. Mr. Hackney remained with Nortel Enterprise Solutions until its acquisition by Avaya in December 2009.
Role of Board in Risk Oversight
The Board of Directors has extensive involvement in the oversight of risk management related to us and our business and accomplishes this oversight through the regular reporting by the Audit Committee. The Audit Committee represents the Board of Directors by periodically reviewing our accounting, reporting and financial practices, including the integrity of our financial statements, the surveillance of administrative and financial controls and our compliance with legal and regulatory requirements. Through its regular meetings with management, including the finance, legal, and internal audit functions, the Audit Committee reviews and discusses all significant areas of our business and summarizes for the Board of Directors all areas of risk and the appropriate mitigating factors. In addition, our Board of Directors receives periodic detailed operating performance reviews from management.
Controlled Company Exception
After the completion of this offering, affiliates of our Sponsor who are party to the shareholders agreement will continue to beneficially own shares representing more than 50% of the voting power of our shares eligible to vote in the election of directors. As a result, we will be a “controlled company” within the meaning of corporate governance standards. Under these corporate governance standards, a company of which more than 50% of the voting power is held by an individual, group or another company is a “controlled company” and may elect not to comply with certain corporate governance standards, including the requirements (1) that a majority of our Board of Directors consist of independent directors, (2) that our Board of Directors have a compensation committee that is comprised entirely of independent directors with a written charter addressing the committee’s purpose and responsibilities and (3) that our Board of Directors have a nominating and corporate governance committee that is comprised entirely of independent directors with a written charter addressing the committee’s purpose and responsibilities. For at least some period following this offering, we may utilize these exemptions since our board has not yet made a determination with respect to the independence of any directors other than Messrs. , and . Following this offering, our audit committee will be comprised entirely of these three directors, and Mr. will serve on both our compensation committee and nominating and governance committee. In the future, we expect that our board will make a determination as to whether other directors, including directors associated with Blackstone, are independent for purposes of the corporate governance standards described above. Pending such determination, you may not have the same protections afforded to stockholders of companies that are subject to all of these corporate governance requirements. In the event that we cease to be a “controlled company” and our shares continue to be listed on the , we will be required to comply with these standards and, depending on the board’s independence determination with respect to our then-current directors, we may be required to add additional directors to our board in order to achieve such compliance within the applicable transition periods.
Board Committees
After the completion of this offering, the standing committees of our Board of Directors will consist of an Audit Committee, a Compensation Committee and a Nominating and Governance Committee.
Our president and chief executive officer and other executive officers will regularly report to the non-executive directors and the Audit, the Compensation and the Nominating and Governance Committees to ensure effective and efficient oversight of our activities and to assist in proper risk management and the ongoing evaluation of management controls. The vice president of internal audit will report functionally and administratively to our chief financial officer and directly to the Audit Committee. We believe that the leadership structure of our Board of Directors provides appropriate risk oversight of our activities given the controlling interests held by our Sponsor.
127
Table of Contents
Audit Committee
Upon the completion of this offering, we expect to have an Audit Committee, consisting of , who will be serving as the Chair, and . qualifies as an independent director under the NYSE corporate governance standards and the independence requirements of Rule 10A-3 of the Securities Exchange Act of 1934, as amended (the “Exchange Act”). We expect a second new independent director to be placed on the Audit Committee within ninety days of the effective date of this registration statement and we expect a third new independent director to replace within one year of the effective date of this registration statement so that all of our Audit Committee members will be independent as such term is defined in Rule 10A-3(b)(i) under the Exchange Act and under the NYSE rules and regulations. Following this offering, our Board of Directors will determine which member of our Audit Committee qualifies as an “audit committee financial expert” as such term is defined in Item 407(d)(5) of Regulation S-K.
The purpose of the Audit Committee will be to prepare the audit committee report required by the SEC to be included in our proxy statement and to assist our Board of Directors in overseeing and monitoring (1) the quality and integrity of our financial statements, (2) our compliance with legal and regulatory requirements, (3) our independent registered public accounting firm’s qualifications and independence, (4) the performance of our internal audit function and (5) the performance of our independent registered public accounting firm.
Our Board of Directors will adopt a written charter for the Audit Committee which will be available on our website upon the completion of this offering.
Compensation Committee
Upon the completion of this offering, we expect to have a Compensation Committee, consisting of , who will be serving as the Chair, and .
The purpose of the Compensation Committee will be to assist our Board of Directors in discharging its responsibilities relating to (1) setting our compensation program and compensation of our executive officers and directors, (2) monitoring our incentive and equity-based compensation plans and (3) preparing the compensation committee report required to be included in our proxy statement under the rules and regulations of the SEC.
Our Board of Directors will adopt a written charter for the Compensation Committee which will be available on our website upon the completion of this offering.
Nominating and Governance Committee
Upon the completion of this offering, we expect to have a Nominating and Governance Committee, consisting of , who will be serving as the Chair, and . The purpose of our Nominating and Governance Committee will be to assist our Board of Directors in discharging its responsibilities relating to (1) identifying individuals qualified to become new Board of Directors members, consistent with criteria approved by the Board of Directors, subject to the stockholders agreement with our Sponsor; (2) reviewing the qualifications of incumbent directors to determine whether to recommend them for reelection and selecting, or recommending that the Board of Directors select, the director nominees for the next annual meeting of stockholders; (3) identifying Board of Directors members qualified to fill vacancies on any Board of Directors committee and recommending that the Board of Directors appoint the identified member or members to the applicable committee, subject to the stockholders agreement with our Sponsor; (4) reviewing and recommending to the Board of Directors corporate governance principles applicable to us; (5) overseeing the evaluation of the Board of Directors and management; and (6) handling such other matters that are specifically delegated to the committee by the Board of Directors from time to time.
Our Board of Directors will adopt a written charter for the Nominating and Governance Committee which will be available on our website upon completion of this offering.
128
Table of Contents
Compensation Committee Interlocks and Insider Participation
We currently do not have a compensation committee. In connection with this offering, our Board of Directors will establish a compensation committee that will assume responsibility for establishing, maintaining and administering our compensation and benefits policies. See “—Executive Compensation—Compensation Discussion and Analysis.”
Code of Ethics
We will adopt a new Code of Business Conduct that applies to all of our directors, officers and employees, including our principal executive officer, principal financial officer and principal accounting officer, which will be available on our website upon the completion of this offering. Our Code of Business Conduct is a “code of ethics,” as defined in Item 406(b) of Regulation S-K. We will make any legally required disclosures regarding amendments to, or waivers of, provisions of our code of ethics on our Internet website.
Executive Compensation
Compensation Discussion and Analysis
This section provides an analysis of our compensation program and policies, the material compensation decisions made under those programs and policies, and the material factors considered in making those decisions. This section should be read together with the compensation tables and related footnotes and narratives that appear below that contain specific information about the compensation earned in fiscal 2014 by the following individuals, referred to as our named executive officers:
| • | J. Joel Hackney, Jr., President and Chief Executive Officer; |
| • | Dennis Norman, Executive Vice President and Chief Financial Officer; |
| • | Barry Murash, President, Global Operations & Business Excellence; |
| • | Scott Tracey, President, Americas & Global Wipes and Technical Specialties; |
| • | Daniel L. Rikard, former Senior Vice President, General Counsel, Secretary & Ethics Compliance Officer; and |
| • | Michael W. Hale, former Senior Vice President and Advisor to Chief Executive Officer. |
On July 8, 2013, Mr. Hale, formerly Senior Vice President, Global Supply Chain Lead, accepted the position of Senior Vice President and Advisor to the Chief Executive Officer effective July 1, 2013 and, on July 9, 2013, announced his planned retirement from the Company effective January 31, 2014. Effective December 31, 2014, Mr. Rikard resigned from the Company to pursue other opportunities.
Prior to this offering, executive compensation and related decisions have been made at the level of our subsidiary, PGI Group. Following the Merger and continuing through fiscal 2012, PGI Group did not have a compensation committee and executive compensation and related decisions were approved by the Board of Directors of PGI Group. On February 20, 2013, PGI Group established a compensation committee. In connection with this offering, our Board of Directors will establish a compensation committee that will assume responsibility for overseeing our compensation and benefit policies.
Except where the context requires otherwise, the terms “Compensation Committee” and “Board of Directors” as used in this “Executive Compensation” section refer to the Board of Directors and Compensation Committee of PGI Group.
129
Table of Contents
Compensation Philosophy
The Compensation Committee has approved the following four primary objectives of our executive compensation program:
| • | provide an externally competitive and internally equitable base salary and other current compensation necessary to attract, retain and motivate highly qualified executives who possess the skills and talent required for our success; |
| • | compensate executives in recognition of new responsibilities or new positions and motivate each executive to perform at the highest level; |
| • | encourage executive performance to fulfill our annual and long-term business objectives and strategy by balancing short-term and long-term compensation; and |
| • | provide variable compensation opportunities based on our performance and align executive compensation with the interests of stockholders through long-term equity compensation programs. |
To achieve these objectives, we implemented and maintain compensation plans and policies to ensure that executive compensation was fair, reasonable and competitive and rewarded our executives’ contributions to our overall short-term and long-term growth as follows:
| • | short-term compensation elements, which include: base salary, cash payouts under annual incentive plans, and other annual compensation, including perquisites; and |
| • | long-term compensation elements, which include: grants of stock options under the 2011 Scorpio Holdings Corporation Stock Incentive Plan, (the “Holdings Plan”), that vest over a prescribed service period or upon the achievement of financial performance targets, and other benefits provided under retirement plans and termination agreements. |
The compensation levels provided under these plans varied based on the relative management experience, leadership and performance of each executive officer. The Compensation Committee reviewed our compensation plans to ensure that pay levels and the elements of compensation were consistent with our compensation philosophy. The goals of our compensation plans and compensation policies were generally to create a meritocracy by considering individual performance and contribution in making compensation decisions and to invest in future potential in every aspect of compensation. Compensation structures were designed to deliver median compensation when median performance was achieved at the individual, operating unit, or corporate level. When superior performance was achieved, the compensation structures would deliver above median compensation.
Independent Compensation Consultant
In August 2014, the Compensation Committee retained Frederic W. Cook & Co., Inc., an independent compensation consulting firm, to provide guidance on executive compensation in connection with this offering and to provide information and guidance for our compensation program going forward.
Elements of Compensation
As described in greater detail below, each element of short-term and long-term compensation serves a different objective. Base salary provides a known amount of compensation on a regular basis for executive performance that is at an acceptable level. Base salary also reflects the executive officer’s position in the corporate hierarchy, and is primarily based on his or her scope of responsibility, relative value to the Company, and long-term potential. Merit-based increases to base salary are granted (typically within a range of 0% to 6%) to reflect the executive officer’s service and performance during the prior year. Base salary is normally not reduced. The Short Term Incentive Compensation Plan (the “Annual Incentive Plan”), when offered, provides payouts based on the achievement of our financial and operating performance objectives, which includes a modifier for significant personal performance. Equity awards under the Holdings Plan that contained
130
Table of Contents
performance or multi-year service vesting schedules are intended to motivate the executive officer to remain with us over the long term and provide performance that is aligned with stockholder interests.
Other than as described below with respect to 2014 base salary adjustments, in fiscal 2014, we did not, and generally we do not, use formalized benchmarking criteria or benchmark compensation to designated peer companies when determining compensation. Historically, material increases for executive officers’ compensation typically happened in three situations: when performance was so outstanding that the Compensation Committee or the Board of Directors, at the recommendation of our Chief Executive Officer (“CEO”) (other than with respect to the CEO himself), awarded a cash payout and/or special equity award; when market salary survey data indicated a disparity; or when there was an internal disparity in levels of executive compensation considering the executive officer’s relative responsibilities and experience.
Our compensation decisions are also influenced by the general status of global economic activity. In times of uncertain global economic activity, our short-term and long-term financial planning are impacted. This activity may cause us to be more conservative in our compensation decisions to manage employment stability and profitability in the face of uncertain economic conditions.
The following sections discuss in further detail the Company’s current and long-term incentive compensation components as well as retirement and termination benefits.
Employment Agreements
For retention purposes, PGI Group entered into employment agreements with Messrs. Hackney, Norman and Hale. See “—Narrative Disclosure to Summary Compensation Table and Grants of Plan-Based Awards Table—Summary of Certain Named Officer Employment Agreements” below for a full description of the material terms of these agreements.
Base Salary
Executive officer salary levels are designed to ensure that we attract the necessary executive talent in the marketplace and are negotiated at the time of initial employment or promotion. Base salaries are established based on a consideration of the following variables: the scope of individual responsibilities, relative value compared with our other executives, experience, such market factors as the general status of the U.S. and international labor market and economies, previous employer compensation, salary surveys and market intelligence available in relevant publications and from our compensation consultant resources, and the experiences of our directors and management.
Base salaries of employees, including named executive officers, are reviewed at least annually, typically during the first quarter. During this time, our CEO conducts executive performance reviews by identifying accomplishments and areas of strength and development based on performance during the prior year. Our CEO then recommends salary adjustments for the executive officers (other than himself) to the Compensation Committee based on these performance reviews. Salary decisions for the CEO are determined annually by the Compensation Committee after conducting a review of the CEO’s performance in the prior year. Merit-based salary changes, if available, are typically made early in the Company’s second quarter.
For fiscal 2014, merit-based salary changes for our named executive officers (other than Mr. Hale) were reviewed and approved by the Compensation Committee and were made in January 2014. Based on the merits of their personal performance in connection with their annual performance review the Compensation Committee, based on input from Mr. Hackney, determined to increase the base salaries of the following named executive officers effective January 1, 2014, as follows: Mr. Norman received an 18% increase (from $360,334 to $425,022), Mr. Tracey received a 17.5% increase (from $334,750 to $393,331) and Mr. Rikard received a 10.5% increase (from $338,780 to $374,323). The Compensation Committee reviewed data from the 2013 Towers Watson Compensation Data Bank (“CDB”) General Industry Executive Compensation Survey Report—U.S. as a reference point in determining the size of the salary increases. This survey collected data from over 1,000
131
Table of Contents
companies on base salary, actual and target bonus, total cash compensation, long-term incentive expected values and total direct compensation. It covered more than 150 benchmark positions and the data was available to participants only.
Payouts under the Annual Incentive Plan
Our Annual Incentive Plan is designed to reward our employees, including our executive officers, for achieving our annual financial and operating goals that are critical to our success and that are aligned with the interests of our stockholders. At the beginning of each fiscal year, the Compensation Committee, based on input from management, sets annual goals. These goals influence the level of performance-based compensation payable under our Annual Incentive Plan, which, if approved for a given year, is typically finalized in April.
During 2014, the Compensation Committee established, and the Board of Directors approved, an Annual Incentive Plan (the “2014 AIP”) and provided cash bonus opportunities under the 2014 AIP targeted at an annual target bonus of 100% of his base salary earned, with a maximum annual bonus of 200% of annual base salary earned for Mr. Hackney, an annual target bonus of 55% of base salary earned, with a maximum annual bonus of 110% of annual base salary earned for Messrs. Norman and Murash, and an annual target bonus of 40% of base salary earned, with a maximum annual bonus of 80% of annual base salary earned for Messrs. Tracey and Rikard.
Pursuant to the terms of the 2014 AIP, Mr. Rikard would not have been eligible for a 2014 AIP award since he resigned prior to the payment date. However, in recognition of his significant contributions made to the Company and given the fact that he was employed through the end of fiscal 2014, the Compensation Committee determined, based on input from management, that it was appropriate to pay him a full-year 2014 AIP award based on actual performance for fiscal 2014. In connection with his departure from the Company in January 2014, Mr. Hale was not entitled to an annual, performance-based cash bonus with respect to fiscal 2014.
Bonus opportunities under the 2014 AIP for the executive officers were based upon achievement of a combination of three company-wide measures: Consolidated EBITDA (weighted at 75.0%), working capital (weighted at 12.5%) and productivity, as measured by net yield (weighted at 12.5%). The definitions of these measures are as follows:
| • | Consolidated EBITDA, means net income attributable to PGI Group (“Net Income”), as disclosed in accordance with GAAP or IFRS as applicable: (a) increased by the sum of the following amounts, to the extent decreasing Net Income, without duplication: (i) provision for taxes based on income or profits or capital gains, including, without limitation, state, franchise and foreign withholding taxes; plus (ii) Consolidated Interest Expense as defined in the credit agreement governing our ABL Facility; plus (iii) depreciation and amortization expense; plus (iv) non-cash charges relating to impairment of assets; plus (v) non-cash compensation expenses; plus (vi) restructuring and integration costs; plus (vii) management, monitoring and advisory fees (including termination fees) and related indemnities and expenses paid or accrued under the International Advisory Agreement; plus (viii) fees and expenses directly related to evaluation of potential acquisitions, mergers or consolidation; plus (ix) non-cash litigation charges to reserve for future liabilities; plus (x) factoring fees; plus (xi) lease expense associated with the GE Lease as defined in the credit agreement governing our ABL Facility; (b) decreased by non-cash gains, to the extent increasing Net Income, without duplication, excluding reversals of an accrual or reserve for a potential cash item that previously reduced Net Income; (c) increased or decreased by, to the extent decreasing or increasing Net Income, without duplication: (i) net unrealized gains or losses (after any offset) resulting in such period from hedging obligations and the application of ASC 815 “Derivatives and Hedging”; (ii) net non-operating gains or losses attributable to currency translation and financing transactions; (iii) net gains or losses attributable to asset dispositions; (iv) increases or decreases resulting from adjustments to the tax indemnity asset; (v) increases or decreases resulting from the impact of purchase accounting adjustments; and (vi) other items included in special charges, net or other non-operating items included in other expense (income), as reported on the Company’s Consolidated Statements of Operations; and (d) decreased by, to the extent increasing Net Income, without duplication, any net licensing profits earned by the Company related to its nanotechnology IP or related technologies. |
132
Table of Contents
| • | Working capital is defined as accounts receivable plus inventory less accounts payable and accrued liabilities. The target metric is calculated based on the average monthly ratio of operating working capital to annualized trailing three months sales. |
| • | The productivity performance target is measured by net yield, which is derived from the effective yield of the product when recycled or reclaimed material is added back to the product. |
We believe evaluating management’s performance based on Consolidated EBITDA and working capital motivated our executive officers and other key employees to focus on key aspects of stockholder value aligned with capital market value drivers and to work together to achieve the Company’s short- and long-term financial goals. Productivity performance was included as a component of our annual incentive compensation program in fiscal 2014 in place of safety performance. We determined to replace safety performance with a new performance measure since we have established a separate company-wide safety performance incentive program in which all employees, not just the participants in the Annual Incentive Plan, are eligible to receive safety performance awards. Productivity performance was chosen to replace safety performance because it reflects our enhanced focus on economic leadership.
Under the 2014 AIP, the Compensation Committee, based on input from management, set, and the Board of Directors approved, a Consolidated EBITDA target of $200.0 million, with a minimum threshold of $180.0 million and a maximum level of $220.0 million, and a working capital target of 11.5%, with a minimum threshold of 12.5% and maximum of 10.5%. The productivity performance target was set at 95.5%, with a minimum threshold of 94.5% and maximum of 96.5%. No payment would be made under a particular performance measure if the minimum threshold level of achievement was not achieved for that measure, and no additional amount would be paid under a particular performance measure if greater than the maximum level of achievement was achieved for that measure. The Company calculates the actual cash bonus independently for each component based on the assigned weightings and adds them together to determine the total annual cash bonus payout for each executive officer, which total amount is subject to adjustment by a personal performance modifier as described below. The payout percentage equals 50% for the minimum threshold level of achievement, 100% for the target level of achievement and 200% for the maximum level of achievement. For actual results that fall between the specified threshold, target and maximum levels, the resulting payout percentage is adjusted on a linear basis.
Achievement against the performance measures determines the funding of the global bonus pool. After reviewing the strategic, qualitative and quantitative results of the individual regions/countries (including corporate), management recommends an allocation of the global bonus pool among each of the regions/countries (including corporate), which allocation is then reviewed and approved by the Compensation Committee.
Under the 2014 AIP, we have also included a personal performance modifier to adjust individual incentive awards up or down to recognize individual performance or adjust for significant shortfalls in individual performance. The maximum potential upward adjustment was +50% of target based upon exceptional, “above and beyond” contributions, such as significant business impact (both financial/non-financial), results delivery, not just effort, embodiment of our core values, customer (internal/external) satisfaction, operational excellence and process improvement, and teamwork/leadership. The maximum potential downward adjustment was up to -100% of the award based upon performance deficiencies (results or behaviors) or code of conduct violations. The decision to adjust payouts with a personal performance modifier is discretionary and is not tied to a specific list of goals for any individual executives.
In 2014, we achieved Consolidated EBITDA of $200.6 million (outperforming the target and resulting in a payout percentage of 100.25% after adjusting for Annual Incentive Plan-related accruals); working capital of 9.6% (outperforming the maximum and resulting in a payout percentage of 200%); and a net yield of 95.54% (outperforming the target and resulting in a payout percentage of 104.0%). Based on the weightings for each of the performance measures, the global bonus pool was funded at a combined achievement factor of 113% of
133
Table of Contents
target. After reviewing the strategic, qualitative and quantitative results of the regions/countries (including corporate), the Compensation Committee, based on input from management, approved funding the corporate pool, in which Messrs. Hackney, Norman, Murash and Rikard participate, at 110% of target and approved funding the Americas regional pool, in which Mr. Tracey participates, at 100% of target. Based on these achievement factors, the total amounts awarded to the eligible named executive officers were as follows: Mr. Hackney, $935,020, Mr. Norman, $255,633, Mr. Murash, $209,436, Mr. Tracey, $156,440 and Mr. Rikard, $164,111. In addition, for 2014, the Compensation Committee awarded Messrs. Hackney and Norman personal performance modifiers of $187,040 and $51,127, respectively. Key factors that the Compensation Committee considered in making such determination with respect to Mr. Hackney were his role in recruiting and upgrading executive talent and his contributions to the successful completion and integration of the Fiberweb Acquisition and the completion of the Providência Acquisition. Key factors that the Compensation Committee considered in making such determination with respect to Mr. Norman were his leadership in executing significant financing transactions and his contributions to the successful completion and integration of the Fiberweb Acquisition and the completion of the Providência Acquisition. The total amounts awarded based on Consolidated EBITDA, working capital and net yield performance results are reported in the “Non-Equity Incentive Plan Compensation” column of the Summary Compensation Table under the “2014” designation, while the amounts awarded as a result of the application of the personal performance modifier are reported in the “Bonus” column.
2014 Integration Incentive Compensation Plan
On March 26, 2014, the Board of Directors approved the PGI Group, Inc. 2014 Integration Incentive Compensation Plan (the “Integration Plan”). The Integration Plan was established to:
| • | provide cash-based incentive compensation to certain key employees of the Company, including our named executive officers (other than Mr. Hale, who was no longer employed by the Company when the Integration Plan was established), by directly linking financial rewards to achieving synergies in connection with the Fiberweb Acquisition; |
| • | increase such key employees’ personal interest in achieving synergies among the Company’s operating units; and |
| • | enhance the Company’s ability to retain key employees who are integral to execution of integration activity, synergy attainment and overall performance of the Company. |
The Compensation Committee oversees the Integration Plan. This includes:
| • | selection of key employees as participants in the Integration Plan; |
| • | determination of the cost saving, growth opportunities, and other efficiency goals related to the post-acquisition integration of Fiberweb (“Synergy Goals”) upon which awards under the Integration Plan will be based and assessment of the extent to which they have been achieved (as described below); |
| • | determination of the applicable incentive percentage that will be multiplied by a participant’s base salary as in effect on March 18, 2014 to determine such participant’s potential award (the “Incentive Target Award”) (as described below); |
| • | interpretation of the Integration Plan and any document or instrument issued under the Integration Plan; and |
| • | establishment of rules and regulations for the Integration Plan’s administration. |
The potential awards under the Integration Plan are as follows:
| • | The Compensation Committee reviewed management’s evaluation of the Company’s performance, on a run-rate basis, as of June 30, 2014 for the “Base Synergy Target” (a specific dollar value of Synergy Goals, as determined by the Compensation Committee in its sole discretion). The Base Synergy Target of $28.0 million has been achieved on a run-rate basis. Therefore, if the Company achieves at least 95% of the Consolidated EBITDA target of $200.0 million for 2014, then each eligible participant will receive a cash payment equal to 10% of his or her Incentive Target Award. Since the Consolidated |
134
Table of Contents
| EBITDA target was achieved for 2014, each of the eligible named executive officers earned 10% of their respective Incentive Target Award, which amount was paid in April 2015. |
| • | The Compensation Committee will review management’s evaluation of the Company’s actual performance as of June 30, 2015 for the Base Synergy Target. If the Compensation Committee determines that the Base Synergy Target has been achieved, and the Company has achieved at least 95% of its Consolidated EBITDA target for 2014, then each eligible participant will receive a cash payment equal to 30% of his or her Incentive Target Award, anticipated to be paid in July 2015 or as soon as administratively practicable thereafter, subject to certain conditions. Since the Consolidated EBITDA target was achieved for 2014, each of the eligible named executive officers will earn 30% of their respective Incentive Target Award if the Base Synergy Target is realized as of June 30, 2015. |
| • | The Compensation Committee reviewed management’s evaluation of the Company’s performance, on a run-rate basis, as of December 31, 2014 for the “Enhanced Synergy Target” (a specific dollar value of Synergy Goals, as determined by the Compensation Committee in its sole discretion). The Enhanced Synergy Target of $36.0 million has been achieved on a run-rate basis. Therefore, if the Company achieves at least 95% of the Consolidated EBITDA target of $200.0 million for 2014, then each eligible participant will receive a cash payment equal to 15% of his or her Incentive Target Award. Since the Consolidated EBITDA target was achieved for 2014, each of the eligible named executive officers earned an additional 15% of their respective Incentive Target Award, which amount was paid in April 2015. |
| • | The Compensation Committee will review management’s evaluation of the Company’s performance in the aggregate as of December 31, 2015 for the Enhanced Synergy Target. If the Compensation Committee determines that the Enhanced Synergy Target has been achieved, and the Company achieves at least 95% of its consolidated EBITDA target for 2015 (as set by the Compensation Committee), then each eligible participant will receive a cash payment equal to 45% of his or her Incentive Target Award, anticipated to be paid in January 2016 or as soon as administratively practicable thereafter, subject to certain conditions. |
To receive payments, participants must remain continuously employed with the Company through the applicable payment date. The Integration Plan will terminate the day after the last incentive payments are made under the Integration Plan, subject to the right of the Compensation Committee to earlier amend or terminate the Integration Plan. The Compensation Committee determined to set the Incentive Target Awards for our named executive officers as follows: Mr. Hackney ($1,054,022), Mr. Norman ($527,027), Mr. Murash ($465,030), Mr. Tracey ($487,759) and Mr. Rikard ($464,192). Since Mr. Rikard resigned from the Company before the applicable payment dates, he is not eligible to receive a payment under the Integration Plan.
Sign-on Bonuses
From time to time, we may award sign-on bonuses in connection with the commencement of a named executive officer’s employment with us. Sign-on bonuses are used only when necessary to attract highly skilled officers to the Company. Generally they are used to incentivize candidates to leave their current employers, or may be used to offset the loss of unvested compensation they may forfeit as a result of leaving their current employers. In fiscal 2014, in order to attract to Mr. Murash to the position of President, Global Operations & Business Excellence, Mr. Murash was awarded a sign-on bonus of $500,000 in connection with the commencement of his employment with us. The sign-on bonus is payable in four equal installments of $125,000, subject to his continued employment through each applicable payment date. The first installment was paid after 30 days of employment with the Company, the second installment was paid on January 15, 2015 and the remaining installments are scheduled to be paid on January 15, 2016 and 2017. Any sign-on cash bonus received is subject to repayment to the Company on a prorated basis if Mr. Murash voluntarily leaves the Company before completing 24 months of continuous employment.
Perquisites and other Personal Benefits
We provide certain executive officers with several perquisites and other personal benefits as additional compensation that the Board of Directors believes are reasonable and consistent with our overall compensation
135
Table of Contents
philosophy. We believe that perquisites should not comprise a significant component of compensation. These benefits are not paid through any formal compensation plan and are paid on a case-by-case basis. Benefits may vary among the executive officers based on business purpose. In certain instances, we may reimburse relocation expenses, pay relocation bonuses and provide tax gross-ups to executives who are required to move to another Company location due to promotions, reorganization or relocation of offices.
For 2014, perquisites were paid in keeping with our compensation philosophy to enhance our ability to attract top-level management and to ensure the retention of key-impact executives. Please see footnote (8) to the “Summary Compensation Table” below for detail regarding the perquisites and other personal benefits received by our named executive officers during fiscal 2014.
Long-term Incentive Compensation
Upon consummation of the Merger, we adopted the Holdings Plan for our employees, directors, and certain other service providers and independent contractors. As part of our new equity-based arrangements with our employees, our senior management employees used cash proceeds from the sale of their PGI Group common stock and the cashing out of all outstanding equity awards to purchase shares of the Company. In addition, our Board of Directors granted options to purchase shares of the Company to those management employees who made the minimum required equity investment in the Company. These arrangements were designed to more closely align our management’s interest with those of our stockholders and to incentivize our management employees to remain in our service by providing them with an opportunity to acquire equity interests in the Company. The specific sizes of the option grants made to our named executive officers were determined based on the Board of Directors’ business judgment in light of Blackstone’s practices with respect to management equity programs at other private companies in its portfolio, the executive officer’s position and level of responsibilities within our company and the size of the executive officer’s equity investment in the Company. Historically, grants have not been made on an annual basis, and instead are made upon an executive’s commencement of employment with us, when an executive receives promotions into more senior level positions or in connection with the completion of special projects. For example, on February 5, 2014, we granted Messrs. Murash, Tracey and Rikard the following number of options under the Holdings Plan: Mr. Murash, 1,800 (including 600 time-vesting options and 1,200 exit-vesting options); Mr. Tracey, 100 (including 33.33 time-vesting options and 66.67 exit-vesting options); and Mr. Rikard, 134.8 (including 44.93 time-vesting options and 89.87 exit-vesting options). Mr. Murash’s award was granted in connection with his commencement of employment with us on January 20, 2014. Mr. Tracey’s award was granted in recognition of his promotion to President, Americas & Global Wipes and Technical Specialties. Mr. Rikard’s award was granted in recognition of his contributions to the completion of the Fiberweb Acquisition. The Holdings Plan also permits us to grant other types of equity-based awards, such as restricted stock units, stock appreciation rights, restricted stock and other “full value” awards. For example, in connection with Mr. Hackney’s appointment as President and Chief Executive Officer in fiscal 2013, we granted him 3,000 restricted stock units under the Holdings Plan. See “—Narrative Disclosure to Summary Compensation Table and Grants of Plan-Based Awards Table” below for a full description of the material terms of the equity awards granted to our named executive officers under the Holdings Plan.
Retirement Benefits
In addition to current and long-term incentive compensation, we provide retirement benefits to the named executive officers. The amount of retirement benefits provided are designed to attract and retain highly qualified executives and may depend on the retirement plans in place in the region where the named executive is employed. We currently provide defined contribution and savings plan benefits to our named executive officers in the form of a qualified 401(k) plan in the United States. The named executive officers are eligible to receive the same level of matching Company 401(k) contributions as all our employees under this plan. See footnote (8) to the “Summary Compensation Table” below for detailed information regarding this compensation. We do not have a defined benefit plan for any of our named executive officers.
136
Table of Contents
In 2012, the Board of Directors approved the establishment of an unfunded, deferred compensation plan for a select group of management or highly compensated employees of the Company (the “PGI Executive Savings Plan”). The PGI Executive Savings Plan is an unfunded plan maintained by the Company primarily for the purpose of providing a select group of management or highly compensated employees of the Company with an opportunity to defer all or part of the compensation payable to such employees (and is intended to be within the exemptions therefore in, without limitation, sections 201(2), 301(a)(3) and 401(a)(1) of ERISA and section 2520.104-23 of the U.S. Department of Labor Regulations). The PGI Executive Savings Plan is intended to be “unfunded” for purposes of both ERISA and the Code. The PGI Executive Savings Plan is not intended to be a qualified plan under section 401(a) of the Code; rather, the PGI Executive Savings Plan is intended to be a “nonqualified” plan. Our named executive officers do not currently participate in the PGI Executive Savings Plan.
Termination Benefits
We believe that severance protection arrangements are necessary to attract and retain the talent necessary for our long-term success. We view our severance protection arrangements as recruitment and retention devices that help secure the continued employment and dedication of our named executive officers, including when we are considering strategic alternatives.
Mr. Hackney and Mr. Norman each have severance protection arrangements as part of their respective employment agreements. Under the terms of these severance arrangements, each of these named executive officers is entitled to severance benefits if he is terminated by us without “cause” or by him for “good reason” (as such terms are defined in their respective employment agreements). In addition, Messrs. Murash and Tracey have each entered into a separate severance protection agreement with us. See “—Potential Payments Upon Termination or Change in Control” for descriptions of these arrangements.
In addition, Messrs. Rikard and Hale each had a severance protection arrangement with us either as part of his employment agreement, in the case of Mr. Hale, or separately, in the case of Mr. Rikard. Mr. Rikard resigned from the Company on December 31, 2014 and pursuant to the terms of his severance protection arrangement, he was not entitled to any severance payments or benefits. However, in recognition of his significant contributions made to the Company and given the fact that he was employed through the end of fiscal 2014, the Compensation Committee determined, based on input from management, that it was appropriate to pay him a full-year 2014 AIP award based on actual performance for fiscal 2014 and we agreed to extend the post-termination exercise period for his vested time-vesting options. See “—Potential Payments Upon Termination or Change in Control” for descriptions of these severance arrangements and the option award modification with respect to Mr. Rikard.
Certain Accounting and Tax Considerations
Accounting considerations
We accounted for awards issued under the Holdings Plan in accordance with the provisions of ASC 718. Under ASC 718, establishment of grant dates, vesting provisions, including performance-based vesting, the exercise prices for options, the maturity dates of the equity instruments and assumptions used for estimating fair value under the Black-Scholes methodology could all have a material impact on compensation relating to option awards.
Tax considerations
Following our initial public offering, we expect to be able to claim the benefit of a special exemption rule that applies to compensation paid (or compensation in respect of equity awards such as stock options or restricted stock granted) during a specified transition period. This transition period may extend until the first annual stockholders meeting that occurs after the close of the third calendar year following the calendar year in which our initial public offering occurred, unless the transition period is terminated earlier under the Section 162(m)
137
Table of Contents
post-offering transition rules. At such time as we are subject to the deduction limitations of Section 162(m), we expect that the Compensation Committee will take the deductibility limitations of Section 162(m) into account in its compensation decisions; however, the Compensation Committee may, in its judgment, authorize compensation payments that are not exempt under Section 162(m) when it believes that such payments are appropriate to attract or retain talent.
Summary Compensation Table
The following table presents a summary of compensation for our Chief Executive Officer, our Chief Financial Officer, and each of our other named executive officers.
| Name and Principal Position |
Year | Salary ($)(4) |
Bonus ($)(5) |
Stock Awards ($) |
Option Awards ($)(6) |
Non-Equity Incentive Plan Compensation ($)(7) |
Change in Pension Value and Nonqualified Deferred Compensation Earnings ($) |
All Other Compensation ($)(8) |
Total ($) |
|||||||||||||||||||||||||||
| J. Joel Hackney Jr.(1) |
2014 | 850,000 | 187,004 | — | — | 1,198,525 | — | 77,655 | 2,313,184 | |||||||||||||||||||||||||||
| President & Chief Executive |
2013 | 434,817 | 606,448 | 3,000,000 | 1,137,980 | — | — | 151,256 | 5,330,501 | |||||||||||||||||||||||||||
| Officer |
2012 | — | — | — | — | — | — | — | — | |||||||||||||||||||||||||||
| — | ||||||||||||||||||||||||||||||||||||
| Dennis Norman |
2014 | 425,022 | 51,127 | — | — | 387,390 | — | 17,466 | 881,005 | |||||||||||||||||||||||||||
| Executive Vice President & |
2013 | 357,506 | — | — | — | 108,146 | — | 16,021 | 481,673 | |||||||||||||||||||||||||||
| Chief Financial Officer |
2012 | 342,687 | 61,956 | — | — | 126,522 | — | 16,153 | 547,318 | |||||||||||||||||||||||||||
| — | ||||||||||||||||||||||||||||||||||||
| Barry Murash |
2014 | 360,600 | 125,000 | — | 305,568 | 325,694 | — | 69,903 | 1,186,765 | |||||||||||||||||||||||||||
| President, Global Operations & Business Excellence |
||||||||||||||||||||||||||||||||||||
| Scott Tracey |
2014 | 393,331 | — | — | 16,976 | 278,380 | — | 17,029 | 705,716 | |||||||||||||||||||||||||||
| President, Americas & Global Wipes and Technical Specialties |
||||||||||||||||||||||||||||||||||||
| Daniel L. Rikard(2) |
2014 | 374,323 | — | — | 22,883 | 164,111 | — | 18,109 | 579,426 | |||||||||||||||||||||||||||
| Former Senior Vice President, General Counsel, Secretary & Ethics Compliance Officer |
||||||||||||||||||||||||||||||||||||
| Michael W. Hale(3) |
2014 | 35,394 | — | — | — | — | — | 727,758 | 763,152 | |||||||||||||||||||||||||||
| Former Senior Vice President, Advisor to Chief Executive Officer |
2013 | 456,510 | — | — | — | 138,094 | — | 18,623 | 613,227 | |||||||||||||||||||||||||||
| 2012 | 437,584 | 79,113 | — | — | 161,558 | — | 17,841 | 696,096 | ||||||||||||||||||||||||||||
| (1) | Mr. Hackney joined the Company in June 2013 as President and Chief Executive Officer. |
| (2) | Mr. Rikard resigned from the Company on December 31, 2014. |
| (3) | Mr. Hale retired from the Company on January 31, 2014. |
| (4) | Mr. Murash joined the Company in January 2014 as President, Global Operations & Business Excellence. Amount reported for Mr. Murash reflects the portion of his $375,024 annual base salary earned in fiscal 2014. |
| (5) | For 2014, amounts reported for Messrs. Hackney and Norman reflect the portion of the bonus awarded by the Compensation Committee under the 2014 AIP as a result of the personal performance modifier. For 2014, amount reported for Mr. Murash reflects the first installment of his sign-on cash bonus in connection with him joining the Company as President, Global Operations & Business Excellence on January 20, 2014. This payment is subject to repayment to the Company on a prorated basis if Mr. Murash voluntarily leaves the Company before completing 24 months of continuous employment. Amount reported for Mr. Hackney for 2013 reflects a sign-on cash bonus in connection with him joining the Company as President and Chief Executive Officer on June 19, 2013. For 2012, amount reported reflects the portion of the bonus awarded by the Board of Directors under the 2012 AIP as a result of the application of the personal performance modifier. For 2013, the Compensation Committee determined not to adjust any of the 2013 AIP awards with a personal performance modifier. |
| (6) | Represents the grant date fair value of all option awards issued during the respective period, calculated pursuant to ASC 718. For a discussion of the assumptions and methodologies used to calculate the amounts reported for 2014, please see the discussion of non-qualified stock option awards contained in Note 15. Equity Compensation Plans to our audited consolidated financial statements included elsewhere in this prospectus. Achievement of the performance conditions for the exit-vesting portions of the option awards was not deemed probable on the date of grant, and, accordingly, pursuant to the SEC’s disclosure rules, no value is included in this table for those portions of the awards. |
| (7) | Amounts for non-equity incentive plan compensation reflect payments under the Annual Incentive Plan for annual performance prior to the application of the personal performance modifier, if any, paid in April of the subsequent year. For 2014, amounts also reflect 25% of the Incentive Target Award earned under the Integration Plan by the eligible named executive officers. In connection with his departure from the Company in 2014, Mr. Hale was not entitled to an annual, performance-based cash bonus with respect to fiscal 2014. In addition, in connection with their respective departures from the Company, Messrs. Rikard and Hale are not eligible for incentive payments under the Integration Plan. |
138
Table of Contents
| (8) | All Other Compensation for the named executive officers in fiscal 2014 is as follows: |
| Mr. Hackney ($) |
Mr. Norman ($) |
Mr. Murash ($) |
Mr. Tracey ($) |
Mr. Rikard ($) |
Mr. Hale ($) |
|||||||||||||||||||
| Company Contributions to Defined Contribution and Savings Plans |
14,131 | 15,600 | 13,858 | 15,600 | 15,600 | — | ||||||||||||||||||
| Life Insurance Premiums Paid by the Company |
1,864 | 612 | 1,273 | 819 | 983 | 721 | ||||||||||||||||||
| Severance Payments and Benefits(1) |
— | — | — | — | — | 727,037 | ||||||||||||||||||
| Perquisites: |
||||||||||||||||||||||||
| Car Usage(2) |
20,000 | — | — | — | — | — | ||||||||||||||||||
| Relocation(3) |
41,233 | — | 54,732 | — | — | — | ||||||||||||||||||
| Other Perquisites(4) |
427 | 1,254 | 40 | 610 | 1,526 | — | ||||||||||||||||||
|
|
|
|
|
|
|
|
|
|
|
|
|
|||||||||||||
| Total All Other Compensation |
77,655 | 17,466 | 69,903 | 17,029 | 18,109 | $ | 727,758 | |||||||||||||||||
|
|
|
|
|
|
|
|
|
|
|
|
|
|||||||||||||
| (1) | Amounts reflect $727,037 of severance payments and benefits pursuant to the terms of Mr. Hale’s employment agreement (consisting of a $653,757 in severance payments, $53,091 paid for accrued and unused vacation days and $20,189 paid for continued participation in our medical, dental, and hospitalization benefit plans from February 1, 2014 through the end of the fiscal year). See “—Potential Payments upon Termination or Change in Control—Departures of Mr. Hale and Mr. Rikard—Mr. Hale.” |
| (2) | Pursuant to Mr. Hackney’s employment agreement, he is responsible for any automobile costs in excess of $20,000 per year. |
| (3) | Mr. Murash’s relocation benefits are subject to repayment to the Company on a prorated basis if Mr. Murash voluntarily leaves the Company before completing 24 months of continuous employment. |
| (4) | Other perquisites are primarily comprised of reimbursement for subscriptions, seminars, professional membership fees and annual credit card fees. |
2014 Grants of Plan-Based Awards
The following table presents information regarding grants of plan-based awards to named executive officers during the 2014 fiscal year:
| Estimated Future Payouts Under Non-Equity Incentive Plan Awards |
Estimated Future Payouts Under Equity Incentive Plan Awards |
|||||||||||||||||||||||||||||||||||||||||||
| Name |
Grant Date |
Threshold ($) |
Target ($) |
Maximum ($) |
Threshold (#) |
Target (#)(4) |
Maximum (#) |
All Other Stock Awards; Number of Shares of Stock or Units (#) |
All Other Option Awards; Number of Securities Underlying Options (#)(4) |
Exercise or Base Price of Option Awards ($/Sh)(5) |
Grant Date Fair Value of Stock & Option Awards ($)(6) |
|||||||||||||||||||||||||||||||||
| Mr. Hackney |
$ | 53,125 | (1) | $ | 850,000 | (1) | $ | 1,700,000 | (1) | — | — | — | — | — | — | — | ||||||||||||||||||||||||||||
| 105,402 | (2) | 1,054,022 | (2) | 1,054,022 | (2) | — | — | — | — | — | — | — | ||||||||||||||||||||||||||||||||
| Mr. Norman |
14,610 | (1) | 233,762 | (1) | 467,524 | (1) | — | — | — | — | — | — | — | |||||||||||||||||||||||||||||||
| 52,702 | (2) | 527,027 | (2) | 527,027 | (2) | — | — | — | — | — | — | — | ||||||||||||||||||||||||||||||||
| Mr. Murash |
12,396 | (1) | 198,330 | (1) | 396,660 | (1) | — | — | — | — | — | — | — | |||||||||||||||||||||||||||||||
| 46,503 | (2) | 465,030 | (2) | 465,030 | (2) | — | — | — | — | — | — | — | ||||||||||||||||||||||||||||||||
| 2/5/2014 | — | 1,200.000 | — | — | 600.000 | 1,000 | 305,568 | |||||||||||||||||||||||||||||||||||||
| Mr. Tracey |
9,833 | (1) | 157,332 | (1) | 314,664 | (1) | — | — | — | — | — | — | — | |||||||||||||||||||||||||||||||
| 48,776 | (2) | 487,759 | (2) | 487,759 | (2) | — | — | — | — | — | — | — | ||||||||||||||||||||||||||||||||
| 2/5/2014 | — | 66.66 | — | — | 33.33 | 1,000 | 16,976 | |||||||||||||||||||||||||||||||||||||
| Mr. Rikard(3) |
9,358 | (1) | 149,729 | (1) | 299,458 | (1) | — | — | — | — | — | — | — | |||||||||||||||||||||||||||||||
| 46,419 | (2) | 464,192 | (2) | 464,192 | (2) | — | — | — | — | — | — | — | ||||||||||||||||||||||||||||||||
| 2/5/2014 | — | 89.86 | — | — | 44.93 | 1,000 | 22,883 | |||||||||||||||||||||||||||||||||||||
| Mr. Hale(3) |
— | — | — | — | — | — | — | — | — | — | ||||||||||||||||||||||||||||||||||
| (1) | Amounts represent awards payable under our 2014 AIP. See “—Elements of Compensation—Payouts under the Annual Incentive Plan” above for a description of our 2014 AIP. Amounts reported for Mr. Murash reflect a pro-rated 2014 AIP award based on his January 20, 2014 employment start date. |
| (2) | Amounts represent awards payable under the Integration Plan. See “—Elements of Compensation—2014 Integration Incentive Compensation Plan” above for a description of the Integration Plan. |
| (3) | In connection with his retirement from the Company in 2014, Mr. Hale was not eligible for an award under the Integration Plan and was not entitled to an annual, performance-based cash bonus with respect to fiscal 2014. In connection with his resignation from the Company on December 31, 2014, Mr. Rikard is not eligible for an incentive payment under the Integration Plan. |
139
Table of Contents
| (4) | The option awards reported above are divided into two tranches for vesting purposes: one-third are time-vesting options and two-thirds are exit-vesting options. The exit-vesting options are reported as an equity incentive plan award in the “Estimated Future Payouts Under Equity Incentive Plan Awards” column, while the time-vesting options are reported as an all other option award in the “All Other Option Awards: Number of Securities Underlying Options” column. See “—Narrative Disclosure to Summary Compensation Table and Grants of Plan-Based Awards Table” below. |
| (5) | The exercise price of $1,000 per share represents the fair market value of the Company’s common stock on the date of grant. |
| (6) | Represents the grant date fair value of the option awards, calculated in accordance with ASC 718 and utilizing the assumptions in Note 15. Equity Compensation Plans to our audited consolidated financial statements included elsewhere in this prospectus. The value at the grant date for the exit-vesting portions of the option awards is based upon the probable outcome of the performance conditions. See footnote (6) to the Summary Compensation Table. |
Narrative Disclosure to Summary Compensation Table and Grants of Plan-Based Awards Table
The items described below support the data reported in the Summary Compensation Table and the 2014 Grants of Plan-Based Awards table.
Summary of Certain Named Officer Employment Agreements
Employment Agreement with Mr. Hackney
PGI Group entered into an employment agreement with Mr. Hackney to serve as our President and Chief Executive Officer effective June 19, 2013 (the “2013 CEO Agreement”). The 2013 CEO Agreement entitles Mr. Hackney to receive an annual base compensation of $850,000 and an annual target bonus of 100% of his base compensation, with a maximum annual bonus of 200% of his base compensation, determined based upon the achievement of performance criteria as established by our Board of Directors in consultation with Mr. Hackney. In lieu of Mr. Hackney’s participation in the 2013 AIP, he received a sign-on bonus in an amount equal to his annual base salary adjusted by the number of days employed during 2013, plus $150,000, payable within 30 days of the effective date of his employment. A description of the potential payments and benefits that Mr. Hackney is entitled to upon his termination under the 2013 CEO Agreement is set forth below in “—Potential Payments Upon Termination or Change in Control.”
Employment Agreement with Mr. Norman
On January 28, 2011, in connection with the Merger, PGI Group entered into an employment agreement with Mr. Norman to serve as our Chief Financial Officer (the “2011 CFO Agreement”). The employment agreement initially entitled Mr. Norman to receive annual base compensation of $349,830 and an annual target bonus of 55% of his base compensation, with a maximum annual bonus of 110% of his base compensation, determined based upon the achievement of performance criteria as established by our Board of Directors in consultation with the Chief Executive Officer. A description of the potential payments and benefits that Mr. Norman is entitled to upon his termination under the 2011 CFO Agreement is set forth below in “—Potential Payments Upon Termination or Change in Control.”
Employment Agreement with Mr. Hale
On January 28, 2011, in connection with the Merger, PGI Group entered into an employment agreement with Mr. Hale to serve as our Chief Operating Officer (the “2011 COO Agreement”). The employment agreement entitled Mr. Hale to annual base compensation of $415,000 and an annual target bonus of 55% of his base compensation, with a maximum annual bonus of 110% of his base compensation, determined based upon the achievement of performance criteria as established by our Board of Directors in consultation with the Chief Executive Officer.
PGI Group and Mr. Hale entered into an amendment to the 2011 COO Agreement on June 14, 2012 (the “2012 COO Amendment”). The 2012 COO Amendment changed Mr. Hale’s title from Chief Operating Officer
140
Table of Contents
to Senior Vice President, Global Supply Chain Lead. In addition, the 2012 COO Amendment reduced Mr. Hale’s annual base salary from $431,600 to $275,002 effective June 14, 2012. As a result of the transition of his responsibilities, the 2012 COO Amendment also provided for a monthly payment of $13,050 (the “Transition Compensation”) for the period from May 1, 2012 to December 31, 2013 (the “Transition Period”).
For Mr. Hale, the 2012 COO Amendment also modified his bonus opportunity. Mr. Hale’s annual target bonus for his base compensation was lowered from 55% to 40% of his base compensation earned, with a maximum bonus opportunity equal to 80% of his base compensation. As a result of the transition of his responsibilities, the 2012 COO Amendment also provided for a transition bonus opportunity equal to the sum of (1) a target of 15% up to a maximum of 30% of his base compensation earned, and (2) a target of 55% up to a maximum of 110% of the Transition Compensation earned for each fiscal year or portion thereof during the Transition Period.
On July 8, 2013, Mr. Hale accepted the position of Senior Vice President and Advisor to Chief Executive Officer, effective July 1, 2013. Other than the change in title and role, all of the terms and conditions of his 2012 COO Amendment remained as indicated. However, the Company agreed to certain modifications to his option awards as described below in “—Awards Under the Holdings Plan—Additional Option Award Modifications.” On July 9, 2013, Mr. Hale notified the Company that he would be retiring from the Company on January 31, 2014. A description of the payments and benefits that Mr. Hale is entitled to under the 2011 COO Agreement, as amended by the 2012 COO Amendment, is set forth below in “—Potential Payments Upon Termination or Change in Control.”
Awards Under the Holdings Plan
Upon consummation of the Merger, we adopted the Holdings Plan for our employees, directors, and certain other service providers and independent contractors. All equity-based awards received by our named executive officers were granted under, and subject to the terms of, the Holdings Plan.
Of the initial options to purchase shares of the Company granted in connection with the Merger (and prior to the amendments discussed below), one-third vested based on the passage of time, one-third vested based on the achievement of certain annual performance goals established by our Board of Directors, and one-third vested based on the achievement of cumulative investment returns by Blackstone upon exiting its investment in the Company which satisfy both a total return on investment hurdle and an internal rate of return hurdle of 20%, in all cases generally subject to the holder’s continued employment through the applicable vesting date.
During 2013, our Board of Directors reviewed the historical and projected financial performance of the Company in regard to the satisfaction of the performance-vesting options and exit-vesting options. Under the then-current vesting conditions, a performance-based option would become vested if certain free cash flow targets were achieved in either a given fiscal year or based on cumulative targets over multiple fiscal years. As none of these targets had been achieved since the date of grant with respect to any outstanding performance-vesting options and, based on recent performance, were not expected to be satisfied in the next several years, we decided to commence an offer to all eligible option holders, including each of the named executive officers (other than Messrs. Hackney and Murash), to modify the terms of all performance-vesting and exit-vesting options. All of the eligible option holders elected to participate and, as a result, on August 30, 2013, the vesting terms for all performance-vesting options were modified to vest on terms similar to the existing exit-vesting options. In addition, the required annual internal rate of return for both the existing exit-vesting options and the modified performance-vesting options was reduced from 20% to 15%.
During 2014, the Company granted options to Messrs. Murash, Tracey and Rikard. One-third of the options are time-vesting options and two-thirds of the options are exit-vesting options.
141
Table of Contents
Vesting Terms of Option Awards
The following describes the general terms of the options granted to our named executive officers. The terms and vesting conditions are as of December 31, 2014 and reflect the modified vesting terms approved on August 30, 2013 described above.
| • | Time-Vesting Options. Other than with respect to the time-vesting options granted to Messrs. Murash, Tracey and Rikard in fiscal 2014, which vest in two equal annual installments on each of the first two anniversaries of the applicable vesting reference dates, the time-vesting options vest in five equal annual installments beginning on the respective grant date, subject to the executive’s continued employment with us. These options will become fully vested upon a change in control that occurs during his or her employment with us, or during the 90 days following terminations of his or her employment without “cause” or with “good reason” or due to death or “disability” (as such terms are defined in the option award agreement or the Holdings Plan, as applicable). In addition, if the executive’s employment is terminated (1) by us without cause, (2) by the executive as a result of his or her resignation with good reason or (3) as a result of the executive’s death or disability, an additional number of these time-vesting options will vest equal to the number that would have vested over the 12-month period following the applicable termination date. Any other time-vesting options that remain unvested on termination of employment or do not vest as described above will be forfeited. |
| • | Exit-Vesting Options. The exit-vesting options will vest on the date, if ever, that Blackstone receives cash proceeds from its investment in the Company aggregating in excess of 2.0 times Blackstone’s cumulative invested capital in the Company’s securities, and such cash proceeds also result in an annual internal rate of return of at least 15% on its cumulative invested capital in the Company’s securities, subject to her or his continued employment with us through such date. In addition, if an executive’s employment is terminated (1) by us without cause, (2) by the executive as a result of her or his resignation with good reason or (3) as a result of the executive’s death or disability, the exit-vesting options will remain outstanding and eligible to vest for 12 months following the applicable termination date. Any other exit-vesting options that remain unvested on termination of employment or do not vest as described above will be forfeited. |
| • | Post-Termination Exercise Rights. Any part of a named executive officer’s stock option award that is vested upon termination of employment by us without cause or by the executive with good reason will generally remain outstanding and exercisable for 90 days after termination of employment (or, if later, until the 90th day following the date on which the options vest), although this period is extended to one year (or, if later, the first anniversary of the date on which the option vests) if the termination of employment is due to death or disability, and is shortened to 10 days if the named executive officer resigns without good reason. Vested options will immediately terminate if the named executive officer’s employment is terminated by us for cause or if the named executive officer violates any of the restrictive covenants described below. |
Additional Option Award Modifications
In connection with Mr. Hale’s change in position from Senior Vice President, Global Supply Chain Leader to Senior Vice President and Advisor to the Chief Executive Officer, pursuant to a letter agreement dated as of July 3, 2013, the Company agreed to modify Mr. Hale’s option awards to provide that any unexercised time-vesting options vested upon a termination of employment will remain exercisable until the earlier of (1) the expiration date of the options or (2) such earlier date that he engages in a “competitive activity”, which is defined as providing services to one of our competitors at any time (regardless of whether the conduct would violate a restrictive covenant) or otherwise breaches any restrictive covenant. In addition, we agreed to waive any call rights with respect to any shares of Company stock acquired by Mr. Hale upon exercise of his vested stock options, unless Mr. Hale breaches any restrictive covenant.
142
Table of Contents
Mr. Hackney 2013 Awards
In connection with Mr. Hackney’s appointment as President and Chief Executive Officer, effective as of June 19, 2013, we granted Mr. Hackney 6,000 options (including 2,000 time-vesting options and 4,000 exit-vesting options) and 3,000 Restricted Stock Units under the Holdings Plan. The vesting terms of the time and exit-vesting options are the same as the vesting terms of the options previously granted to our other named executive officers, as modified and as described above. Under the Holdings Plan, the Restricted Stock Units will become vested and will be settled in shares of our common stock on the earlier of (1) the third anniversary of the date of grant and (2) termination of Mr. Hackney’s employment without “cause”, for “good reason”, or as result of death or “disability” (as such terms are defined in the restricted stock unit award agreement or the Holdings Plan, as applicable). Dividend equivalent shares will accrue if dividends are paid on our common stock and will vest proportionately with the Restricted Stock Units to which they relate. In the event that Mr. Hackney is terminated by the Company for cause or by Mr. Hackney while grounds for cause exist, all Restricted Stock Units granted (whether or not then vested) as well as any accrued dividend equivalent shares will be forfeited. In the event of a change in control, all Restricted Stock Units granted (whether or not then vested) shall be distributed to Mr. Hackney effective as of immediately prior to the change in control.
Additional Terms of Equity-Based Awards
| • | Call Rights. As a condition to purchasing shares of the Company (which was a condition to receiving equity-based awards at the time of the Merger), or as a condition to exercising any stock option, each named executive officer was required to enter into a management equity subscription agreement under the Holdings Plan with the Company. These agreements generally govern the named executive officer’s rights with respect to any common stock of the Company acquired on exercise of vested stock options or settlement of Restricted Stock Units, to the extent applicable. Under the subscription agreement, the Company and Blackstone have rights to repurchase any shares a named executive officer may have acquired upon exercise of his options or settlement of Restricted Stock Units, to the extent applicable. Specifically, if (1) the executive’s employment is terminated by us with “cause”, (2) the executive terminates employment when grounds for a termination with “cause” exist, (3) the executive commenced employment after the Transactions and terminates employment without “good reason” prior to the third anniversary of their hire date, or (4) the executive violates a restrictive covenant (as described below), then the Company and Blackstone have the right for a specified period following the applicable event to cause the executive (or her or his permitted transferees) to sell to us all shares held by her or him at the lesser of fair market value thereof and cost. For any shares so repurchased, this means any increase in value will effectively be forfeited. |
| • | Restrictive Covenants and Clawback. As a condition of receiving their equity-based awards, our named executive officers have also agreed to certain restrictive covenants, which are contained in the award agreements pursuant to which the options or Restricted Stock Units, as applicable, were granted and are in addition to any other restrictive covenants agreed to by our named executive officers. While employed and for 12 months following their termination of employment (or such longer period as the executive is eligible to receive severance payments pursuant to any other written agreement with the Company or its affiliates), named executive officers are prohibited from competing with us and from soliciting our employees and customers. The award agreements also contain covenants on the rights to work product and an indefinite restriction on the named executive officer’s disclosure of our confidential information. As described above, we have the right to purchase our named executive officers’ shares of our common stock in the event of a breach of these restrictive covenants during the periods covered by the restrictive covenants. In addition, if a named executive officer breaches any of these restrictive covenants or the Company determines after termination that grounds for a termination for cause existed, we have the right to “clawback” and recover any gains the named executive officer may have realized with respect to his or her awards or any shares issued in respect thereof. |
143
Table of Contents
2014 Outstanding Equity Awards at Fiscal Year-End
The following table presents information regarding outstanding equity awards held by named executive officers at the end of the 2014 fiscal year.
| Option Awards | Stock Awards | |||||||||||||||||||||||||||||||||||
| Name |
Number of Securities Underlying Unexercised Options (#) Exercisable |
Number of Securities Underlying Unexercised Options (#) Unexercisable (1) |
Equity Incentive Plan Awards; Number of Securities Underlying Unexercised Unearned Options (#) (2) |
Option Exercise Price ($) |
Option Expiration Date |
Number of Shares or Units of Stock That Have Not Vested (#)(3) |
Market Value of Shares or Units That Have Not Vested ($)(4) |
Equity Incentive Plan Awards; Number of Unearned Shares, Units, or Other Rights That Have Not Vested (#) |
Equity Incentive Plan Awards; Market or Payout Value of Unearned Shares, Units, or Other Rights That Have Not Vested ($) |
|||||||||||||||||||||||||||
| Mr. Hackney |
400.000 | 1,600.000 | 4,000.000 | $ | 1,000 | 6/19/2023 | 3,000.000 | 3,000,000 | — | — | ||||||||||||||||||||||||||
| Mr. Norman |
452.172 | 301.448 | 1,507.240 | 1,000 | 1/28/2021 | — | — | — | — | |||||||||||||||||||||||||||
| Mr. Murash |
— | 600.000 | 1,200.000 | 1,000 | 2/05/2024 | — | — | — | — | |||||||||||||||||||||||||||
| Mr. Tracey |
— | 33.333 | 66.667 | 1,000 | 2/05/2024 | — | — | — | — | |||||||||||||||||||||||||||
| 32.608 | 65.216 | 195.646 | 1,000 | 4/01/2023 | ||||||||||||||||||||||||||||||||
| 33.334 | 33.336 | 133.330 | 1,000 | 6/21/2022 | ||||||||||||||||||||||||||||||||
| 141.306 | 94.204 | 471.020 | 1,000 | 1/28/2021 | ||||||||||||||||||||||||||||||||
| Mr. Rikard(5) |
113.046 | — | — | 1,000 | 1/28/2021 | — | — | — | — | |||||||||||||||||||||||||||
| Mr. Hale(6) |
452.172 | — | — | 1,000 | 1/28/2021 | — | — | — | — | |||||||||||||||||||||||||||
| (1) | The vesting dates of the time-vesting options are set forth below. In addition, as described in “—Narrative Disclosure to Summary Compensation Table and Grants of Plan-Based Awards Table—Awards under the Holdings Plan” above and “—Potential Payments Upon Termination or Change in Control” below, all or a portion of each time-vesting option grant may vest earlier in connection with a change in control or certain terminations of employment. |
| Mr. Hackney | Mr. Norman | Mr. Murash | Mr. Tracey | Mr. Rikard | Mr. Hale | |||||||||||||||||||
| January 20, 2015 |
— | — | 300.000 | — | — | — | ||||||||||||||||||
| January 28, 2015 |
— | 150.724 | — | 47.102 | — | — | ||||||||||||||||||
| February 5, 2015 |
— | — | — | 16.666 | — | — | ||||||||||||||||||
| April 19, 2015 |
— | — | — | 32.608 | — | — | ||||||||||||||||||
| May 1, 2015 |
— | — | — | 16.668 | — | — | ||||||||||||||||||
| June 19, 2015 |
400.000 | — | — | — | — | — | ||||||||||||||||||
| January 20, 2016 |
— | — | 300.000 | — | — | — | ||||||||||||||||||
| January 28, 2016 |
— | 150.724 | — | 47.102 | — | — | ||||||||||||||||||
| February 5, 2016 |
— | — | — | 16.667 | — | — | ||||||||||||||||||
| April 19, 2016 |
— | — | — | 32.608 | — | — | ||||||||||||||||||
| May 1, 2016 |
— | — | — | 16.668 | — | — | ||||||||||||||||||
| June 19, 2016 |
400.000 | — | — | — | — | — | ||||||||||||||||||
| June 19, 2017 |
400.000 | — | — | — | — | — | ||||||||||||||||||
| June 19, 2018 |
400.000 | — | — | — | — | — | ||||||||||||||||||
|
|
|
|
|
|
|
|
|
|
|
|
|
|||||||||||||
| Total |
1,6000.000 | 301.448 | 600.000 | 226.089 | — | — | ||||||||||||||||||
|
|
|
|
|
|
|
|
|
|
|
|
|
|||||||||||||
| (2) | Reflects unvested outstanding exit-vesting options which ordinarily become vested as described in “—Narrative Disclosure to Summary Compensation Table and Grants of Plan-Based Awards Table—Awards Under the Holdings Plan” above. |
| (3) | Mr. Hackney’s Restricted Stock Units vest on June 19, 2016, the third anniversary of the date of grant. In addition, as described in “—Narrative Disclosure to Summary Compensation Table and Grants of Plan-Based Awards Table—Awards Under the Holdings Plan” above and “—Potential Payments Upon Termination or Change in Control” below, the Restricted Stock Units may vest earlier upon in connection with a change in control or certain terminations of employment. |
| (4) | Based upon a market value of the Company’s common stock of $1,000 per share as of December 31, 2014. |
| (5) | As described in “—Elements of Compensation—Termination Benefits” above and “—Potential Payments Upon Termination or Change in Control” below, in connection with Mr. Rikard’s resignation, the Company agreed to modify his option awards to provide that all of his remaining time-vesting options that were vested upon his departure date will remain exercisable until the earlier of (1) the expiration date of the options or (2) such earlier date that he breaches any restrictive covenant. All other time-vesting and exit-vesting options that were not vested upon his departure were immediately forfeited. |
144
Table of Contents
| (6) | As described in “—Narrative Disclosure to Summary Compensation Table and Grants of Plan-Based Awards Table—Awards Under the Holdings Plan Table—Additional Option Award Modifications” above and “—Potential Payments Upon Termination or Change in Control” below, in connection with Mr. Hale’s change in position from Senior Vice President, Global Supply Chain Leader to Senior Vice President and Advisor to the Chief Executive Officer, the Company agreed to modify his option awards, pursuant to a letter agreement dated July 1, 2013, to provide that all of his remaining time-vesting options that were vested upon his departure date will remain exercisable until the earlier of (1) the expiration date of the options or (2) such earlier date that he breaches any restrictive covenant or otherwise engages in a competitive activity. All other time-vesting and exit-vesting options that were not vested upon his departure were immediately forfeited. |
Option Exercises and Stock Vested in Fiscal 2014
During 2014, the named executive officers did not exercise any options or similar instruments or vest in any other stock or similar instruments.
Pension Benefits
We have no pension benefits for the named executive officers.
Nonqualified Defined Contribution and Other Nonqualified Deferred Compensation Plans
Our named executive officers do not currently participate in the PGI Executive Savings Plan.
Potential Payments Upon Termination or Change in Control
PGI Group entered into employment agreements with each of Messrs. Hackney, Norman, and Hale and severance protection agreements with each of Messrs. Murash, Tracey and Rikard. In general, our named executive officers will be entitled to receive severance payments, subject to executing a general release of claims, if they are terminated without “cause” or if they terminate their employment for “good reason” (as such terms are defined in their respective employment or severance protection agreements). These payments typically provide the payment of annual base compensation and bonus opportunities, as well as participation by each of them in benefit plans and programs.
Mr. Hackney
Under the 2013 CEO Agreement, subject to executing a general release of claims, if Mr. Hackney’s employment is terminated by us without “cause” or his voluntary resignation with “good reason”, he will be entitled to receive severance payments of an amount equal to the sum of 1.5 times his then-current annual base compensation and 1.5 times the amount of his target annual bonus. Mr. Hackney will also be entitled to a pro rata portion of the annual bonus he would have received for the year in which his termination occurred, if any, as determined in accordance with the terms of the applicable annual bonus plan as well as a lump sum equal to 18 months of COBRA premiums to cover continued medical benefits. These payments would generally be paid to him in equal installments over a 12-month period following his termination date, except that the pro rata portion of his annual bonus, if any, would be paid at such time annual bonuses are paid to our actively employed executives. The foregoing payments and benefits are contingent on Mr. Hackney’s compliance with certain restrictive covenants, including indefinite covenants regarding non-disparagement and confidentiality of our trade secrets and other confidential information and covenants prohibiting him from competing with us and from soliciting our employees and customers for 18 months following termination of employment.
If Mr. Hackney’s employment is terminated while he is disabled or as a result of his death, he (or his estate) will be entitled to any accrued but unpaid base salary, and any annual bonus which was earned in respect of any prior fiscal years which remains unpaid, if any.
Upon a termination of employment for any reason, Mr. Hackney would be entitled to any accrued but unpaid base salary and any other vested benefits under the company’s broad-based employee benefit plans. He is not entitled to any additional benefits if his employment is terminated by us for cause, or if he voluntarily resigns from his employment other than with good reason.
145
Table of Contents
Mr. Norman
Under the 2011 CFO Agreement, subject to executing a general release of claims, if Mr. Norman’s employment is terminated by us without “cause” or his voluntary resignation with “good reason”, he will be entitled to receive severance payments of an amount equal to the sum of 1.5 times his then-current annual base compensation and 1.5 times the amount of his target annual bonus. These payments would generally be paid to him in equal installments over an 18-month period following his termination date. Mr. Norman will also be entitled to participate in our medical, dental, and hospitalization benefit plans for 18 months at the Company’s expense, and will be entitled to receive a pro rata portion of the annual bonus he would have received for the year in which their termination occurred, if any, as determined in accordance with the terms of the applicable annual bonus plan, and paid at such time annual bonuses are paid to our actively employed executives. The foregoing payments and benefits are contingent on Mr. Norman’s compliance with certain restrictive covenants, including indefinite covenants regarding non-disparagement and confidentiality of our trade secrets and other confidential information and covenants prohibiting him from competing with us and from soliciting our employees and customers for 18 months following termination of employment.
If Mr. Norman’s employment is terminated while he is disabled or as a result of his death, he (or his estate) will be entitled to any accrued but unpaid base salary, and any annual bonus which was earned in respect of any prior fiscal years which remains unpaid, if any.
Upon a termination of employment for any reason, Mr. Norman would be entitled to any accrued but unpaid base salary and any other vested benefits under the company’s broad-based employee benefit plans. He is not entitled to any additional benefits if his employment is terminated by us for cause, or if he voluntarily resigns from his employment other than with good reason.
Mr. Murash and Mr. Tracey
Each of Mr. Murash and Mr. Tracey have entered into severance protection agreements with PGI Group that provide that if his employment is terminated by the Company without cause or by him for good reason before attaining age 70-1/2, he will be entitled to receive the following payments and benefits, subject to his execution of a general release of claims:
| • | a severance payment consisting of an amount equal to the sum of (1) twelve times his monthly base salary at the rate in effect at the time of a notice of qualifying termination and (2) an amount equal to his annual target bonus for the year which includes the date of termination; |
| • | COBRA benefits for a period of 12 months at the Company’s expense; and |
| • | up to $15,000 for reasonable outplacement services until employed on a full-time basis. |
The severance amount is payable in 12 equal monthly installments, beginning on the 53rd day following the termination date, with the second installment payable on the 60th day following the termination date and each other installment payable each month thereafter during the severance period.
The foregoing payments and benefits are contingent on the named executive officer’s compliance with certain restrictive covenants, including covenants prohibiting him from competing with us and from soliciting our employees and customers for 12 months following his termination of employment and indefinite covenants regarding disclosure of our confidential information.
Treatment of Equity Awards
Please see “—Narrative Disclosure to Summary Compensation Table and Grants of Plan-Based Awards Table—Awards Under the Holdings Plan” above for a description of (1) the potential vesting of the equity awards granted to our named executive officers that may occur in connection with a change in control or certain terminations of employment, (2) post-termination exercise rights that apply to the named executive officers’ stock options and (3) the call rights and restrictive covenants that apply in connection with a termination of employment.
146
Table of Contents
The following describes compensation and benefits payable to each named executive officer (other than Messrs. Hale and Rikard who terminated employment in 2014 and whose termination payments and benefits are described below) in connection with termination of employment or change in control pursuant to agreements that were in place at the end of 2014. The amounts shown assume that the applicable triggering event occurred on December 31, 2014, the last business day of the Company’s last completed fiscal year:
| Termination without “Cause”(1) |
Termination for “Good Reason” |
Additional Value if Termination without Cause, for Good Reason or Due to Death of Disability During 90 Days Prior to Change in Control |
Change in Control |
Death or Disability(4) |
||||||||||||||||
| Mr. Hackney |
||||||||||||||||||||
| Cash Severance(1) |
$ | 3,485,020 | $ | 3,485,020 | $ | — | $ | — | $ | — | ||||||||||
| Acceleration of Equity Awards(2) |
3,000,000 | 3,000,000 | — | 3,000,000 | 3,000,000 | |||||||||||||||
| Health Benefits(3) |
18,694 | 18,694 | — | — | — | |||||||||||||||
|
|
|
|
|
|
|
|
|
|
|
|||||||||||
| Total |
$ | 6,503,714 | $ | 6,503,714 | $ | — | $ | 3,000,000 | $ | 3,000,000 | ||||||||||
|
|
|
|
|
|
|
|
|
|
|
|||||||||||
| Mr. Norman |
||||||||||||||||||||
| Cash Severance(1) |
$ | 1,243,809 | $ | 1,243,809 | $ | — | $ | — | $ | — | ||||||||||
| Acceleration of Equity Awards(2) |
— | — | — | — | — | |||||||||||||||
| Health Benefits(3) |
18,694 | 18,694 | — | — | — | |||||||||||||||
|
|
|
|
|
|
|
|
|
|
|
|||||||||||
| Total |
$ | 1,262,503 | $ | 1,262,503 | $ | — | $ | — | $ | — | ||||||||||
|
|
|
|
|
|
|
|
|
|
|
|||||||||||
| Mr. Murash |
||||||||||||||||||||
| Cash Severance(1) |
$ | 581,250 | $ | 581,250 | $ | — | $ | — | $ | — | ||||||||||
| Acceleration of Equity Awards(2) |
— | — | — | — | — | |||||||||||||||
| Health Benefits(3) |
12,463 | 12,463 | — | — | — | |||||||||||||||
|
|
|
|
|
|
|
|
|
|
|
|||||||||||
| Total |
$ | 593,713 | $ | 593,713 | $ | — | $ | — | $ | — | ||||||||||
|
|
|
|
|
|
|
|
|
|
|
|||||||||||
| Mr. Tracey |
||||||||||||||||||||
| Cash Severance(1) |
$ | 550,663 | $ | 550,663 | $ | — | $ | — | $ | — | ||||||||||
| Acceleration of Equity Awards(2) |
— | — | — | — | — | |||||||||||||||
| Health Benefits(3) |
12,463 | 12,463 | — | — | — | |||||||||||||||
|
|
|
|
|
|
|
|
|
|
|
|||||||||||
| Total |
$ | 563,126 | $ | 563,126 | $ | — | $ | — | $ | — | ||||||||||
|
|
|
|
|
|
|
|
|
|
|
|||||||||||
| (1) | Cash severance includes the following: |
| • | Mr. Hackney—an amount equal to the sum of 1.5 times his then-current annual base compensation and 1.5 times the amount of his target annual bonus plus a full year 2014 AIP award (excluding amounts related to the discretionary personal performance modifier). |
| • | Mr. Norman—an amount equal to the sum of 1.5 times his then-current annual base compensation and 1.5 times the amount of his target annual bonus plus a full year 2014 AIP award (excluding amounts related to the discretionary personal performance modifier). |
| • | Mr. Murash—an amount equal to the sum of (1) twelve times his monthly base salary at the rate in effect at the time of a notice of qualifying termination and (2) an amount equal to his annual target bonus for 2014. |
| • | Mr. Tracey—an amount equal to the sum of (1) twelve times his monthly base salary at the rate in effect at the time of a notice of qualifying termination and (2) an amount equal to his annual target bonus for 2014. |
| (2) | As of December 31, 2014, the market value of the Company’s common stock was determined to be $1,000 per share, which equals the exercise price of the respective options. Thus, no value was associated |
147
Table of Contents
| with the acceleration of the time-vesting options. Amounts reported assume that the exit-vesting options do not vest upon a change in control. The amounts reported for Mr. Hackney represent accelerated vesting of his 3,000 Restricted Stock Units and are based on a market value of $1,000 per share on December 31, 2014. |
| (3) | Reflects the cost of providing the executive officer with continued participation in our medical, dental, and hospitalization benefit plans for a period of 12 months for Messrs. Murash and Tracey and for a period of 18 months for Messrs. Hackney and Norman, in each case, assuming 2015 rates. |
| (4) | In the event of death of a named executive officer, in addition to amounts reported in the table above, each named executive officer would receive benefits from third-party payors under our employer-paid premium life insurance plans. All of our executives are eligible for one times their regular annual eligible wages at death up to a maximum of $300,000. Therefore, if such benefits were triggered for the named executive officers on December 31, 2014 under our life insurance plans the legally designated beneficiary(ies) of each named executive officer would have received the following amounts: Mr. Hackney ($300,000); Mr. Norman ($300,000); Mr. Murash ($300,000); and Mr. Tracey ($300,000). |
Departures of Mr. Hale and Mr. Rikard
Mr. Hale
On July 9, 2013, Mr. Hale notified the Company that he would be retiring from the Company on January 31, 2014. For purposes of Mr. Hale’s employment agreement, as amended, Mr. Hale’s retirement constituted a termination by him after the Transition Period and on or before January 31, 2014 other than for good reason, and he became entitled to the following payments and benefits upon his execution of a general release of claims:
| • | a cash severance payment of $713,189 payable in 12 equal monthly installments (such amount equal to the sum of (1) his base salary plus Transition Compensation, and (2) his target annual bonus plus Transition Bonus, each as in effect immediately prior to the retirement date), beginning on the 53rd day following the termination date, with the second installment payable on the 60th day following the termination date and each other installment payable each month thereafter during the severance period; |
| • | his 2013 AIP award, including his annual and Transition Bonus, in the amount of $138,094 paid in a lump sum when annual bonuses were paid to other senior executives of the Company; |
| • | $53,091 for all accrued but unused vacation time through his termination date; and |
| • | $22,171 for continued participation in our medical, dental, and hospitalization benefit plans for 12 months at the Company’s expense. |
The foregoing payments and benefits are contingent on Mr. Hale’s compliance with certain restrictive covenants, including indefinite covenants regarding non-disparagement and confidentiality of our trade secrets and other confidential information and covenants prohibiting him from competing with us and from soliciting our employees and customers for 18 months following termination of his employment.
As described in “—Narrative Disclosure to Summary Compensation Table and Grants of Plan-Based Awards Table—Awards under the Holdings Plan—Additional Option Award Modifications” above, pursuant to a letter agreement dated as of July 3, 2013, the Company agreed to modify Mr. Hale’s option awards to provide that all his unexercised time-vesting options that were vested upon his departure date will remain exercisable until the earlier of (1) the expiration date of the options or (2) such earlier date that he engages in a competitive activity or otherwise breaches any restrictive covenant. All other time-vesting and exit-vesting options that were not vested upon his departure were immediately forfeited.
Mr. Rikard
On December 31, 2014, Mr. Rikard resigned from the Company to pursue other opportunities and pursuant to the terms of his severance protection arrangement he was not entitled to any severance payments or benefits.
148
Table of Contents
However, in recognition of his significant contributions made to the Company and given the fact that he was employed through the end of fiscal 2014, in January 2015, the Compensation Committee determined, based on input from management, that it was appropriate to pay him a full-year 2014 AIP award. Based on actual performance for fiscal 2014, Mr. Rikard’s 2014 AIP award was $164,111 and will be received at the same time as 2014 AIP awards are paid to the other eligible named executive officers. In addition, on January 9, 2015, the Company agreed to modify Mr. Rikard’s option awards to provide that all his unexercised time-vesting options that were vested upon his departure date will remain exercisable until the earlier of (1) the expiration date of the options or (2) such earlier date that he breaches any restrictive covenant. All other time-vesting and exit-vesting options that were not vested upon his departure were immediately forfeited.
2014 Compensation of Directors
The following table presents a summary of compensation for non-employee directors of the Company for the 2014 fiscal year.
| Name |
Fees Earned or Paid in Cash ($)(1) |
Stock Awards ($) |
Option Awards ($)(2)(3) |
Non-Equity Incentive Plan Compensation ($) |
Changes in Pension Value and Nonqualified Deferred Compensation Earnings ($) |
All Other Compensation ($)(8) |
Total ($) |
|||||||||||||||||||||
| Mr. Alder |
$ | 80,000 | $ | — | $ | — | $ | — | $ | — | $ | — | $ | 80,000 | ||||||||||||||
| Mr. Foss |
— | — | — | — | — | — | — | |||||||||||||||||||||
| Ms. Hagen(4) |
75,000 | — | — | — | — | 1,776,097 | 1,851,097 | |||||||||||||||||||||
| Ms. St. Clare(5) |
85,000 | — | — | — | — | — | 85,000 | |||||||||||||||||||||
| Mr. Zafirovski |
325,000 | — | — | — | — | — | 325,000 | |||||||||||||||||||||
| Mr. Mukherjee(6)(7) |
— | — | — | — | — | — | — | |||||||||||||||||||||
| Mr. Giordano(6) |
— | — | — | — | — | — | — | |||||||||||||||||||||
| (1) | Amounts reported in the column reflect the annual retainer and committee fees earned by the non-employee directors for services rendered in their capacities as directors of our subsidiary, PGI Group. |
| (2) | On June 30, 2014, we granted Mr. Zafirovski 1,333.33 exit-vesting options under the Holdings Plan. Achievement of the performance conditions for the exit-vesting option awards was not deemed probable on the date of grant, and, accordingly, pursuant to the SEC’s disclosure rules, no value is included in this table for these awards. For further discussion of the assumptions and methodologies used to calculate the amounts reported for 2014, please see the discussion of non-qualified stock option awards contained in Note 15. Equity Compensation Plans to our audited consolidated financial statements included elsewhere in this prospectus. |
| (3) | At fiscal year-end, the aggregate number of option awards (whether or not exercisable) for shares of the Company’s common stock that were outstanding was as follows: Mr. Alder—150 options; Ms. Hagen—1,809 options; Ms. St.Clare—50 options and Mr. Zafirovski—1,333.33 options. |
| (4) | Ms. Hagen resigned as President and Chief Executive Officer effective June 19, 2013 and retired from the Company on August 31, 2013. Ms. Hagen continues to serve on the Board of Directors as a non-employee director. |
| (5) | Ms. St.Clare serves as chair of the Audit Committee. |
| (6) | Employees of Blackstone were not entitled to receive any fees for their service on the Board of Directors. |
| (7) | Mr. Mukherjee resigned from the Company’s Board of Directors on December 23, 2014. |
| (8) | Amount reported for Ms. Hagen reflects $1,776,097 of payments and benefits paid during fiscal 2014 pursuant to the terms of Ms. Hagen’s retirement agreement (consisting of $1,771,616 in cash severance and $4,481 for continued participation in our medical, dental, and hospitalization benefit plans). In addition, as previously reported and pursuant to the terms of her retirement agreement, Ms. Hagen also received a lump sum amount of $266,656 for her continued service as a member of the Board of Directors through December 31, 2013. |
149
Table of Contents
Annual Board / Committee Retainer Fees
Under our current compensation program for directors, the non-employee directors, Mr. Alder, Mr. Foss, Ms. Hagen and Ms. St.Clare each receive an annual retainer of $75,000, payable in four equal installments on the date of each quarterly scheduled Board of Directors meeting. Mr. Zafirovski, as the non-executive chairman of the Board of Directors, receives an annual retainer of $350,000 (increased from $300,000 on July 1, 2014), payable in four equal installments at the beginning of each fiscal quarter. The Chair of the Audit Committee receives an additional $10,000 annually, while each of the Chairs of the Compensation Committee and Nominating and Governance Committee receives an additional $5,000 annually. Directors are also reimbursed for out-of-pocket expenses incurred in connection with attending Board of Directors meetings. In addition, generally, each independent director is eligible to receive an annual grant of options to acquire common stock of the Company, which vests annually over a 3 year period so long as the independent director continues to serve on the Board of Directors. Following the completion of this offering, we anticipate that our directors who are not our employees or employees of Blackstone will be entitled to compensation arrangements to be determined.
150
Table of Contents
CERTAIN RELATIONSHIPS AND RELATED PARTY TRANSACTIONS
Stockholders’ Agreement
In connection with this offering, we expect to amend and restate the stockholders agreement with our Sponsor. This agreement grants our Sponsor the right to nominate to our Board of Directors a number of designees equal to: (i) at least a majority of the total number of directors comprising our Board of Directors as long as our Sponsor and its affiliates beneficially own at least 50% of the shares of our common stock entitled to vote generally in the election of our directors; (ii) at least 40% of the total number of directors comprising our Board of Directors at such time as long as our Sponsor and its affiliates beneficially own at least 40% but less than 50% of the shares of our common stock entitled to vote generally in the election of our directors; (iii) at least 30% of the total number of directors comprising our Board of Directors at such time as long as our Sponsor and its affiliates beneficially own at least 30% but less than 40% of the shares of our common stock entitled to vote generally in the election of our directors; (iv) at least 20% of the total number of directors comprising our Board of Directors at such time as long as our Sponsor and its affiliates beneficially own at least 20% but less 30% of the shares of our common stock entitled to vote generally in the election of our directors; and (v) at least 10% of the total number of directors comprising our Board of Directors at such time as long as our Sponsor and its affiliates beneficially own at least 5% but less than 20% of the shares of our common stock entitled to vote generally in the election of our directors. For purposes of calculating the number of directors that our Sponsor is entitled to nominate pursuant to the formula outlined above, any fractional amounts would be rounded up to the nearest whole number (e.g., one and one quarter directors shall equate to two directors) and the calculation would be made on a pro forma basis after taking into account any increase in the size of our Board of Directors.
In addition, in the event a vacancy on the Board of Directors is caused by the death, retirement or resignation of our Sponsor’s director-designee, our Sponsor shall, to the fullest extent permitted by law, have the right to have the vacancy filled by our Sponsor’s new director-designee.
Registration Rights Agreement
In connection with this offering, we expect to amend and restate our registration rights agreement with the Sponsor. This agreement provides our Sponsor an unlimited number of “demand” registrations and customary “piggyback” registration rights. The registration rights agreement also provides that we will pay certain expenses relating to such registrations and indemnify the registration rights holders against certain liabilities that may arise under the Securities Act.
Advisory Agreement
Upon the completion of the Merger, PGI Group became subject to a transaction and fee advisory agreement (“Advisory Agreement”) with Blackstone Management Partners V L.L.C. (“BMP”), an affiliate of Blackstone. Under the Advisory Agreement, BMP (including through its affiliates) has agreed to provide certain monitoring, advisory and consulting services for an annual non-refundable advisory fee, to be paid at the beginning of each fiscal year, equal to the greater of (i) $3.0 million or (ii) 2.0% of PGI Group’s Consolidated EBITDA (as defined under the credit agreement governing our ABL Facility) for the immediately preceding fiscal year. The amount of such fee shall be initially paid based on PGI Group’s then most current estimate of PGI Group’s projected EBITDA amount for the fiscal year immediately preceding the date upon which the advisory fee is paid. After completion of the fiscal year to which the fee relates and following the availability of audited financial statements for such period, the parties will recalculate the amount of such fee based on the actual consolidated EBITDA for such period and PGI Group or BMP, as applicable, shall adjust such payment as necessary based on the recalculated amount. Since the Merger until fiscal 2014, the Company’s advisory fee has been $3.0 million, which is paid at the beginning of each year. In 2014, we incurred approximately $5.2 million of expenses related to the advisory fee. The amount is included in Selling, general and administrative expenses in the Consolidated Statements of Operations.
In addition, in the absence of an express agreement to provide investment banking or other financial advisory services to PGI Group, and without regard to whether such services were provided, BMP will be entitled to receive a fee equal to 1.0% of the aggregate transaction value upon the consummation of any
151
Table of Contents
acquisition, divestiture, disposition, merger, consolidation, restructuring, refinancing, recapitalization, issuance of private or public debt or equity securities (including an initial public offering of equity securities), financing or similar transaction by PGI Group. The fee associated with the Fiberweb transaction totaled $2.5 million and was paid in December of 2013. As of December 31, 2014, the Company has accrued $5.3 million payable to BMP related to the Providência Acquisition. This amount is included in Special charges, net in the Consolidated Statement of Operations.
At any time in connection with or in anticipation of a change of control of PGI Group, a sale of all or substantially all of PGI Group’s assets or an initial public offering of common equity of PGI Group or parent entity of PGI Group or their successors, BMP may elect to receive, in consideration of BMP’s role in facilitating such transaction and in settlement of the termination of the services, a single lump sum cash payment equal to the then-present value of all then-current and future annual advisory fees payable under the Advisory Agreement, assuming a hypothetical termination date of the Advisory Agreement to be the twelfth anniversary of such election. The Advisory Agreement will continue until the earlier of the twelfth anniversary of the date of the agreement or such date as PGI Group and BMP may mutually determine. PGI Group will agree to indemnify BMP and its affiliates, directors, officers, employees, agents and representatives from and against all liabilities relating to the services contemplated by the transaction and advisory fee agreement and the engagement of BMP pursuant to, and the performance of BMP and its affiliates of the services contemplated by, the Advisory Agreement.
BMP also received transaction fees in connection with services provided related to the Merger. Pursuant to the Advisory Agreement, BMP received, at the closing of the Merger, an $8.0 million transaction fee as consideration for BMP undertaking financial and structural analysis, due diligence and other assistance in connection with the Merger. In addition, PGI Group agreed to reimburse BMP for any out-of-pocket expenses incurred by BMP and its affiliates in connection with the Merger. As a result, we recognized $7.9 million within Special charges, net during the fiscal year ended December 31, 2011, as well as capitalized $0.8 million as deferred financing costs as of January 28, 2011. BMP also receives reimbursement for out-of-pocket expenses in connection with the provision of services under the Advisory Agreement.
In connection with this offering, we intend to terminate the Advisory Agreement. We will use approximately $ million of the net proceeds to us from this offering to pay a one-time termination fee to affiliates of the Sponsor in connection with the termination of the Advisory Agreement.
Other Relationships and Transactions
An affiliate of Blackstone, The Blackstone Group International Partners, LLP (“BGIP”), provided certain financial advisory services to PGI Group in connection with the acquisition of Fiberweb for which BGIP received an aggregate fee of $3.0 million. PGI Group also reimbursed BGIP for its reasonable documented expenses and agreed to indemnify BGIP and related persons against certain liabilities arising out of its engagement. As a result, we recognized $3.2 million during the year ended December 28, 2013, which is included within Special charges, net in the Consolidated Statement of Operations.
Blackstone and its affiliates have ownership interests in a broad range of companies. We have entered into commercial transactions in the ordinary course of our business with some of these companies, including the sale of goods and services and the purchase of goods and services. In addition, Blackstone Holdings Finance Co., LLC, an affiliate of Blackstone, participated in the Fiberweb financing group and received $0.6 million associated with their pro rata participation.
Repurchase of Securities
As market conditions warrant, we and our major stockholders, including our Sponsor, may from time to time, depending upon market conditions, seek to repurchase our debt securities or loans in privately negotiated or open market transactions, by tender offer or otherwise.
152
Table of Contents
Statement of Policy Regarding Transactions with Related Persons
Prior to the completion of this offering, our Board of Directors will adopt a written statement of policy regarding transactions with related persons, which we refer to as our “related person policy.” Our related person policy will require that a “related person” (as defined as in paragraph (a) of Item 404 of Regulation S-K) must promptly disclose to our General Counsel any “related person transaction” (defined as any transaction that we anticipate would be reportable by us under Item 404(a) of Regulation S-K in which we were or are to be a participant and the amount involved exceeds $120,000 and in which any related person had or will have a direct or indirect material interest) and all material facts with respect thereto. Our General Counsel will then promptly communicate that information to our Board of Directors. No related person transaction will be executed without the approval or ratification of our Board of Directors or a duly authorized committee of our Board of Directors. It will be our policy that directors interested in a related person transaction will recuse themselves from any vote on a related person transaction in which they have an interest.
153
Table of Contents
The following table and accompanying footnotes set forth information with respect to the beneficial ownership of our common stock, as of April 15, 2015, for:
| • | each person known by us to own beneficially more than 5% of our outstanding shares of common stock; |
| • | each of our directors; |
| • | each of our named executive officers; and |
| • | all of our directors and executive officers as a group. |
The number of shares and percentages of beneficial ownership prior to this offering set forth below are based on the number of shares of our common stock to be issued and outstanding immediately prior to the consummation of this offering. The number of shares and percentages of beneficial ownership after this offering set forth below are based on the number of shares of our common stock to be issued and outstanding immediately after the consummation of this offering.
Beneficial ownership for the purposes of the following table is determined in accordance with the rules and regulations of the SEC. A person is a “beneficial owner” of a security if that person has or shares “voting power,” which includes the power to vote or to direct the voting of the security, or “investment power,” which includes the power to dispose of or to direct the disposition of the security or has the right to acquire such powers within 60 days.
Unless otherwise noted in the footnotes to the following table, and subject to applicable community property laws, the persons named in the table have sole voting and investment power with respect to their beneficially owned common stock.
Except as otherwise indicated in the footnotes below, the address of each beneficial owner is c/o PGI Specialty Materials, Inc., 9335 Harris Corners Parkway, Suite 300, Charlotte, North Carolina 28269.
| Common Stock Beneficially Owned Prior to this Offering |
Shares of Common Stock Offered |
Common Stock Beneficially Owned After this Offering | ||||||||||||||||
| Assuming the Underwriters’ Option is not Exercised |
Assuming the Underwriters’ Option is Exercised in Full | |||||||||||||||||
| Name of Beneficial Owner |
Number(1) | % | Number | % | Number | % | ||||||||||||
| Principal Stockholders: |
||||||||||||||||||
| Blackstone(2) |
285,726 | 97.69 | % | |||||||||||||||
| Directors and Named Executive Officers: |
||||||||||||||||||
| J. Joel Hackney, Jr |
800 | * | ||||||||||||||||
| Dennis Norman |
906 | * | ||||||||||||||||
| Mike S. Zafirovski(3) |
1,694 | * | ||||||||||||||||
| James S. Alder |
133 | * | ||||||||||||||||
| Peter N. Foss |
— | — | ||||||||||||||||
| Jason Giordano(4) |
— | — | ||||||||||||||||
| Veronica Hagen |
3,974 | 1.35 | % | |||||||||||||||
| Christine St.Clare |
33 | * | ||||||||||||||||
| Scott Tracey |
430 | * | ||||||||||||||||
| Robert Dale |
375 | * | ||||||||||||||||
| Herminio de Freitas |
— | — | ||||||||||||||||
| Jean-Marc Galvez |
136 | * | ||||||||||||||||
| Daniel Guerrero |
291 | * | ||||||||||||||||
| Robert Holmes |
— | — | ||||||||||||||||
| Barry Murash |
300 | * | ||||||||||||||||
| Daniel L. Rikard(5) |
315 | * | ||||||||||||||||
| Directors and executive officers as a group (16 persons) |
9,387 | 3.17 | % | |||||||||||||||
154
Table of Contents
| * | Represents less than 1%. |
| (1) | Fractional shares beneficially owned have been rounded to the nearest whole share. |
| (2) | Shares of Common Stock shown as beneficially owned by the Blackstone Funds (as hereinafter defined) are held by the following entities: (i) Blackstone Capital Partners (Cayman) V L.P. (“BCP Cayman V”) owns 121,440.731 shares of Common Stock representing 41.5195% of the outstanding shares of Common Stock, (ii) Blackstone Capital Partners (Cayman) V-A L.P. (“BCP Cayman VA”) owns 108,648.173 shares of Common Stock representing 37.1458% of the outstanding shares of Common Stock, (iii) Blackstone Capital Partners (Cayman) V-AC L.P. (“BCP Cayman VAC”) owns 54,679.914 shares of Common Stock representing 18.6946% of the outstanding shares of Common Stock, (iv) Blackstone Family Investment Partnership (Cayman) V L.P. (“BFIP”) owns 696.314 shares of Common Stock representing 0.2381% of the outstanding shares of Common Stock and (v) Blackstone participation Partnership (Cayman) V L.P. (“BPP”) owns 260.868 shares of Common Stock representing 0.0892% of the outstanding shares of Common Stock (BCP Cayman V, BCP Cayman VA, BCP Cayman VAC, BFIP and BPP are collectively referred to as the “Blackstone Funds”). The general partner of BCP Cayman V, BCP Cayman VA and BCP Cayman VAC is Blackstone Management Associates (Cayman) V L.P. BCP V GP L.L.C. is a general partner and controlling entity of BFIP, BPP and Blackstone Management Associates (Cayman) V L.P. Blackstone Holdings III L.P. is the managing member and majority interest owner of BCP V GP L.L.C. Blackstone Holdings III L.P. is indirectly controlled by The Blackstone Group L.P. and is owned, directly or indirectly, by Blackstone professionals and The Blackstone Group L.P. The Blackstone Group L.P. is controlled by its general partner, Blackstone Group Management L.L.C., which is in turn wholly owned by Blackstone’s senior managing directors and controlled by its founder, Stephen A. Schwarzman. Each of such Blackstone entities and Mr. Schwarzman may be deemed to beneficially own the securities beneficially owned by the Blackstone Funds directly or indirectly controlled by it or him, but each disclaims beneficial ownership of such securities (other than the Blackstone Funds to the extent of their direct holdings). The address of each of the entities listed in this note is c/o The Blackstone Group, L.P., 345 Park Avenue, New York, New York 10154. |
| (3) | Shares of Common Stock shown as beneficially owned by Mr. Zafirovski are held by the Zaf Group, LLC. an Illinois limited liability company for which Mr. Zafirovski is a managing member. Mr. Zafirovski is an Executive Advisor to the Blackstone Group L.P. Mr. Zafirovski disclaims beneficial ownership of any shares of Common Stock owned directly or indirectly by the Blackstone Funds. |
| (4) | Mr. Giordano is a Managing Director in Blackstone’s Private Equity Group. Mr. Giordano disclaims beneficial ownership of any shares of Common Stock owned directly or indirectly by the Blackstone Funds. Mr. Giordano’s address is c/o The Blackstone Group, L.P., 345 Park Avenue, New York, New York 10154. |
| (5) | Mr. Rikard resigned from the Company effective December 31, 2014. |
155
Table of Contents
In connection with this offering, we will amend and restate our certificate of incorporation and our bylaws. The following is a description of the material terms of, and is qualified in its entirety by, our amended and restated certificate of incorporation and amended and restated bylaws, each of which will be in effect upon the consummation of this offering, the forms of which are filed as exhibits to the registration statement of which this prospectus is a part.
Our purpose is to engage in any lawful act or activity for which corporations may now or hereafter be organized under the DGCL. Upon the consummation of this offering, our authorized capital stock will consist of shares of common stock, par value $0.01 per share, and shares of preferred stock, par value $0.01 per share. No shares of preferred stock will be issued or outstanding immediately after the public offering contemplated by this prospectus. Unless our Board of Directors determines otherwise, we will issue all shares of our capital stock in uncertificated form.
Common Stock
Holders of our common stock are entitled to one vote for each share held of record on all matters submitted to a vote of stockholders, including the election or removal of directors. The holders of our common stock do not have cumulative voting rights in the election of directors. Upon our liquidation, dissolution or winding up and after payment in full of all amounts required to be paid to creditors and to the holders of preferred stock having liquidation preferences, if any, the holders of our common stock will be entitled to receive pro rata our remaining assets available for distribution. Holders of our common stock do not have preemptive, subscription, redemption or conversion rights. The common stock will not be subject to further calls or assessment by us. There will be no redemption or sinking fund provisions applicable to the common stock. All shares of our common stock that will be outstanding at the time of the completion of the offering will be fully paid and non-assessable. The rights, powers, preferences and privileges of holders of our common stock will be subject to those of the holders of any shares of our preferred stock we may authorize and issue in the future.
As of December 31, 2014, we had approximately 292,491 shares of our common stock outstanding.
Preferred Stock
Our amended and restated certificate of incorporation authorizes our Board of Directors to establish one or more series of preferred stock (including convertible preferred stock). Unless required by law or by the , the authorized shares of preferred stock will be available for issuance without further action by you. Our Board of Directors may determine, with respect to any series of preferred stock, the powers including preferences and relative participations, optional or other special rights, and the qualifications, limitations or restrictions thereof, of that series, including, without limitation:
| • | the designation of the series; |
| • | the number of shares of the series, which our Board of Directors may, except where otherwise provided in the preferred stock designation, increase (but not above the total number of authorized shares of the class) or decrease (but not below the number of shares then outstanding); |
| • | whether dividends, if any, will be cumulative or non-cumulative and the dividend rate of the series; |
| • | the dates at which dividends, if any, will be payable; |
| • | the redemption rights and price or prices, if any, for shares of the series; |
| • | the terms and amounts of any sinking fund provided for the purchase or redemption of shares of the series; |
156
Table of Contents
| • | the amounts payable on shares of the series in the event of any voluntary or involuntary liquidation, dissolution or winding-up of our affairs; |
| • | whether the shares of the series will be convertible into shares of any other class or series, or any other security, of us or any other corporation, and, if so, the specification of the other class or series or other security, the conversion price or prices or rate or rates, any rate adjustments, the date or dates as of which the shares will be convertible and all other terms and conditions upon which the conversion may be made; |
| • | restrictions on the issuance of shares of the same series or of any other class or series; and |
| • | the voting rights, if any, of the holders of the series. |
We could issue a series of preferred stock that could, depending on the terms of the series, impede or discourage an acquisition attempt or other transaction that some, or a majority, of the holders of our common stock might believe to be in their best interests or in which the holders of our common stock might receive a premium for your common stock over the market price of the common stock. Additionally, the issuance of preferred stock may adversely affect the rights of holders of our common stock by restricting dividends on the common stock, diluting the voting power of the common stock or subordinating the liquidation rights of the common stock. As a result of these or other factors, the issuance of preferred stock could have an adverse impact on the market price of our common stock.
Dividends
The DGCL permits a corporation to declare and pay dividends out of “surplus” or, if there is no “surplus,” out of its net profits for the fiscal year in which the dividend is declared and/or the preceding fiscal year. “Surplus” is defined as the excess of the net assets of the corporation over the amount determined to be the capital of the corporation by the Board of Directors. The capital of the corporation is typically calculated to be (and cannot be less than) the aggregate par value of all issued shares of capital stock. Net assets equals the fair value of the total assets minus total liabilities. The DGCL also provides that dividends may not be paid out of net profits if, after the payment of the dividend, capital is less than the capital represented by the outstanding stock of all classes having a preference upon the distribution of assets.
Declaration and payment of any dividend will be subject to the discretion of our Board of Directors. The time and amount of dividends will be dependent upon our financial condition, operations, cash requirements and availability, debt repayment obligations, capital expenditure needs and restrictions in our debt instruments, industry trends, the provisions of Delaware law affecting the payment of distributions to stockholders and any other factors our Board of Directors may consider relevant.
We have no current plans to pay dividends on our common stock. Any decision to declare and pay dividends in the future will be made at the sole discretion of our Board of Directors and will depend on, among other things, our results of operations, cash requirements, financial condition, contractual restrictions, and other factors that our Board of Directors may deem relevant. Because we are a holding company and have no direct operations, we will only be able to pay dividends from funds we receive from our subsidiaries. In addition, our ability to pay dividends will be limited by covenants in our existing indebtedness and may be limited by the agreements governing other indebtedness that we or our subsidiaries incur in the future. See “Management’s Discussion and Analysis of Financial Condition and Results of Operations-Indebtedness.”
Annual Stockholder Meetings
Our amended and restated bylaws provide that annual stockholder meetings will be held at a date, time and place, if any, as exclusively selected by our Board of Directors. To the extent permitted under applicable law, we may conduct meetings by remote communications, including by webcast.
157
Table of Contents
Anti-Takeover Effects of Our Amended and Restated Certificate of Incorporation and Amended and Restated Bylaws and Certain Provisions of Delaware Law
Our amended and restated certificate of incorporation, amended and restated bylaws and the DGCL contain provisions, which are summarized in the following paragraphs, that are intended to enhance the likelihood of continuity and stability in the composition of our Board of Directors. These provisions are intended to avoid costly takeover battles, reduce our vulnerability to a hostile change of control and enhance the ability of our Board of Directors to maximize stockholder value in connection with any unsolicited offer to acquire us. However, these provisions may have an anti-takeover effect and may delay, deter or prevent a merger or acquisition of the Company by means of a tender offer, a proxy contest or other takeover attempt that a stockholder might consider in its best interest, including those attempts that might result in a premium over the prevailing market price for the shares of common stock held by stockholders.
Authorized but Unissued Capital Stock
Delaware law does not require stockholder approval for any issuance of authorized shares. However, the listing requirements of the , which would apply if and so long as our common stock remains listed on the , require stockholder approval of certain issuances equal to or exceeding 20% of the then outstanding voting power or then outstanding number of shares of common stock. Additional shares that may be used in the future may be issued for a variety of corporate purposes, including future public offerings, to raise additional capital or to facilitate acquisitions.
Our Board of Directors may generally issue preferred shares on terms calculated to discourage, delay or prevent a change of control of the Company or the removal of our management. Moreover, our authorized but unissued shares of preferred stock will be available for future issuances without stockholder approval and could be utilized for a variety of corporate purposes, including future offerings to raise additional capital, to facilitate acquisitions and employee benefit plans.
One of the effects of the existence of unissued and unreserved common stock or preferred stock may be to enable our Board of Directors to issue shares to persons friendly to current management, which issuance could render more difficult or discourage an attempt to obtain control of the Company by means of a merger, tender offer, proxy contest or otherwise, and thereby protect the continuity of our management and possibly deprive our stockholders of opportunities to sell their shares of common stock at prices higher than prevailing market prices.
Classified Board of Directors
Our amended and restated certificate of incorporation provides that our Board of Directors will be divided into three classes of directors, with the classes to be as nearly equal in number as possible, and with the directors serving three-year terms. As a result, approximately one-third of our Board of Directors will be elected each year. The classification of directors will have the effect of making it more difficult for stockholders to change the composition of our Board of Directors. Our amended and restated certificate of incorporation and amended and restated bylaws provide that, subject to any rights of holders of preferred stock to elect additional directors under specified circumstances, the number of directors will be fixed from time to time exclusively pursuant to a resolution adopted by the Board of Directors.
Business Combinations
We have opted out of Section 203 of the DGCL; however, our amended and restated certificate of incorporation contains similar provisions providing that we may not engage in certain “business combinations” with any “interested stockholder” for a three-year period following the time that the stockholder became an interested stockholder, unless:
| • | prior to such time, our Board of Directors approved either the business combination or the transaction which resulted in the stockholder becoming an interested stockholder; |
158
Table of Contents
| • | upon consummation of the transaction that resulted in the stockholder becoming an interested stockholder, the interested stockholder owned at least 85% of our voting stock outstanding at the time the transaction commenced, excluding certain shares; or |
| • | at or subsequent to that time, the business combination is approved by our Board of Directors and by the affirmative vote of holders of at least 66 2⁄3% of our outstanding voting stock that is not owned by the interested stockholder. |
Generally, a “business combination” includes a merger, asset or stock sale or other transaction resulting in a financial benefit to the interested stockholder. Subject to certain exceptions, an “interested stockholder” is a person who, together with that person’s affiliates and associates, owns, or within the previous three years owned, 15% or more of our outstanding voting stock other than any person who acquired such stock from Blackstone (except in the context of a public offering). For purposes of this section only, “voting stock” has the meaning given to it in Section 203 of the DGCL.
Under certain circumstances, this provision will make it more difficult for a person who would be an “interested stockholder” to effect various business combinations with us for a three-year period. This provision may encourage companies interested in acquiring us to negotiate in advance with our Board of Directors because the stockholder approval requirement would be avoided if our Board of Directors approves either the business combination or the transaction which results in the stockholder becoming an interested stockholder. These provisions also may have the effect of preventing changes in our Board of Directors and may make it more difficult to accomplish transactions which stockholders may otherwise deem to be in their best interests.
Our amended and restated certificate of incorporation provides that our Sponsor and its affiliates, and any of their respective direct or indirect transferees and any group as to which such persons are a party, do not constitute “interested stockholders” for purposes of this provision.
Removal of Directors; Vacancies
Under the DGCL, unless otherwise provided in our amended and restated certificate of incorporation, directors serving on a classified board may be removed by the stockholders only for cause. Our amended and restated certificate of incorporation provides that directors may be removed with or without cause upon the affirmative vote of a majority in voting power of all outstanding shares of stock entitled to vote generally in the election of directors, voting together as a single class; provided, however, at any time when our Sponsor and its affiliates beneficially own in the aggregate, less than 30% of the voting power of all outstanding shares of our stock entitled to vote generally in the election of directors, directors may only be removed for cause, and only upon the affirmative vote of holders of at least 66 2⁄3% of the voting power of all the then outstanding shares of stock entitled to vote generally in the election of directors, voting together as a single class. In addition, our amended and restated certificate of incorporation also provides that, subject to the rights granted to one or more series of preferred stock then outstanding or the rights granted under the stockholders agreement with our Sponsor, any newly created directorship on the Board of Directors that results from an increase in the number of directors and any vacancies on our Board of Directors will be filled only by the affirmative vote of a majority of the remaining directors, even if less than a quorum, by a sole remaining director or by the stockholders; provided, however, at any time when our Sponsor and its affiliates beneficially own, in the aggregate, less than 30% of voting power of the stock of the Issuer entitled to vote generally in the election of directors, any newly created directorship on the Board of Directors that results from an increase in the number of directors and any vacancy occurring on the Board of Directors may only be filled by a majority of the directors then in office, although less than a quorum, or by a sole remaining director (and not by the stockholders).
No Cumulative Voting
Under Delaware law, the right to vote cumulatively does not exist unless the certificate of incorporation specifically authorizes cumulative voting. Our amended and restated certificate of incorporation does not authorize cumulative voting. Therefore, stockholders holding a majority of the shares of our stock entitled to vote generally in the election of directors will be able to elect all our directors.
159
Table of Contents
Special Stockholder Meetings
Our amended and restated certificate of incorporation provides that special meetings of our stockholders may be called at any time only by or at the direction of the Board of Directors or the chairman of the Board of Directors; provided, however, at any time when our Sponsor and its affiliates beneficially own, in the aggregate, at least 30% in voting power of the stock entitled to vote generally in the election of directors, special meetings of our stockholders shall also be called by the Board of Directors or the chairman of the Board of Directors at the request of our Sponsor and its affiliates. Our amended and restated bylaws prohibit the conduct of any business at a special meeting other than as specified in the notice for such meeting. These provisions may have the effect of deferring, delaying or discouraging hostile takeovers, or changes in control or management of the Company.
Director Nominations and Stockholder Proposals
Our amended and restated bylaws establish advance notice procedures with respect to stockholder proposals and the nomination of candidates for election as directors, other than nominations made by or at the direction of the Board of Directors or a committee of the Board of Directors. In order for any matter to be “properly brought” before a meeting, a stockholder will have to comply with advance notice requirements and provide us with certain information. Generally, to be timely, a stockholder’s notice must be received at our principal executive offices not less than 90 days nor more than 120 days prior to the first anniversary date of the immediately preceding annual meeting of stockholders. Our amended and restated bylaws also specify requirements as to the form and content of a stockholder’s notice. These provisions will not apply to our Sponsor and its affiliates so long as the stockholders agreement remains in effect. Our amended and restated bylaws allow the chairman of the meeting at a meeting of the stockholders to adopt rules and regulations for the conduct of meetings which may have the effect of precluding the conduct of certain business at a meeting if the rules and regulations are not followed. These provisions may also defer, delay or discourage a potential acquirer from conducting a solicitation of proxies to elect the acquirer’s own slate of directors or otherwise attempting to influence or obtain control of the Company.
Stockholder Action by Written Consent
Pursuant to Section 228 of the DGCL, any action required to be taken at any annual or special meeting of the stockholders may be taken without a meeting, without prior notice and without a vote if a consent or consents in writing, setting forth the action so taken, is or are signed by the holders of outstanding stock having not less than the minimum number of votes that would be necessary to authorize or take such action at a meeting at which all shares of our stock entitled to vote thereon were present and voted, unless our amended and restated certificate of incorporation provides otherwise. Our amended and restated certificate of incorporation will preclude stockholder action by written consent at any time when our Sponsor and its affiliates own, in the aggregate, less than 30% in voting power of our stock entitled to vote generally in the election of directors.
Supermajority Provisions
Our amended and restated certificate of incorporation and amended and restated bylaws will provide that the Board of Directors is expressly authorized to make, alter, amend, change, add to, rescind or repeal, in whole or in part, our bylaws without a stockholder vote in any matter not inconsistent with the laws of the State of Delaware or our amended and restated certificate of incorporation. For as long as our Sponsor and its affiliates beneficially own, in the aggregate, at least 30% in voting power of our stock entitled to vote generally in the election of directors, any amendment, alteration, change, addition or repeal of our bylaws by our stockholders requires the affirmative vote of a majority in voting power of the outstanding shares of our stock present in person or represented by proxy and entitled to vote on such amendment, alteration, rescission or repeal. At any time when our Sponsor and its affiliates beneficially own, in the aggregate, less than 30% in voting power of our stock entitled to vote generally in the election of directors, any amendment, alteration, rescission or repeal of our bylaws by our stockholders requires the affirmative vote of the holders of at least 66 2⁄3% in voting power of all the then outstanding shares of stock entitled to vote thereon, voting together as a single class.
160
Table of Contents
The DGCL provides generally that the affirmative vote of a majority of the outstanding shares entitled to vote thereon, voting together as a single class, is required to amend a corporation’s certificate of incorporation, unless the certificate of incorporation requires a greater percentage.
Our amended and restated certificate of incorporation provides that at any time when our Sponsor and its affiliates beneficially own, in the aggregate, less than 30% in voting power of our stock entitled to vote generally in the election of directors, the following provisions in our amended and restated certificate of incorporation may be amended, altered, repealed or rescinded only by the affirmative vote of the holders of at least 66 2⁄3% in voting power all the then outstanding shares of our stock entitled to vote thereon, voting together as a single class:
| • | the provision requiring a 66 2⁄3% supermajority vote for stockholders to amend our bylaws; |
| • | the provisions providing for a classified Board of Directors (the election and term of our directors); |
| • | the provisions regarding resignation and removal of directors; |
| • | the provisions regarding competition and corporate opportunities; |
| • | the provisions regarding entering into business combinations with interested stockholders; |
| • | the provisions regarding stockholder action by written consent; |
| • | the provisions regarding calling special meetings of stockholders; |
| • | the provisions regarding filling vacancies on our Board of Directors and newly created directorships; |
| • | the provisions eliminating monetary damages for breaches of fiduciary duty by a director; and |
| • | the amendment provision requiring that the above provisions be amended only with a 66 2⁄3% supermajority vote. |
The combination of the classification of our Board of Directors, the lack of cumulative voting and the supermajority voting requirements will make it more difficult for our existing stockholders to replace our Board of Directors as well as for another party to obtain control of us by replacing our Board of Directors. Because our Board of Directors has the power to retain and discharge our officers, these provisions could also make it more difficult for existing stockholders or another party to effect a change in management.
These provisions may have the effect of deterring hostile takeovers or delaying or preventing changes in control of our management or the Company, such as a merger, reorganization or tender offer. These provisions are intended to enhance the likelihood of continued stability in the composition of our Board of Directors and its policies and to discourage certain types of transactions that may involve an actual or threatened acquisition of the Company. These provisions are designed to reduce our vulnerability to an unsolicited acquisition proposal. The provisions are also intended to discourage certain tactics that may be used in proxy fights. However, such provisions could have the effect of discouraging others from making tender offers for our shares and, as a consequence, they also may inhibit fluctuations in the market price of our shares that could result from actual or rumored takeover attempts. Such provisions may also have the effect of preventing changes in management.
Dissenters’ Rights of Appraisal and Payment
Under the DGCL, with certain exceptions, our stockholders will have appraisal rights in connection with a merger or consolidation of us. Pursuant to the DGCL, stockholders who properly request and perfect appraisal rights in connection with such merger or consolidation will have the right to receive payment of the fair value of their shares as determined by the Delaware Court of Chancery.
Stockholders’ Derivative Actions
Under the DGCL, any of our stockholders may bring an action in our name to procure a judgment in our favor, also known as a derivative action, provided that the stockholder bringing the action is a holder of our shares at the time of the transaction to which the action relates or such stockholder’s stock thereafter devolved by operation of law.
161
Table of Contents
Exclusive Forum
Our amended and restated certificate of incorporation will provide that unless we consent to the selection of an alternative forum, the Court of Chancery of the State of Delaware shall, to the fullest extent permitted by law, be the sole and exclusive forum for any (i) derivative action or proceeding brought on behalf of our Company, (ii) action asserting a claim of breach of a fiduciary duty owed by any director or officer of our Company to the Company or the Company’s stockholders, creditors, or other constituents, (iii) action asserting a claim against the Company or any director or officer of the Company arising pursuant to any provision of the DGCL or our amended and restated certificate of incorporation or our amended and restated bylaws, or (iv) action asserting a claim against the Company or any director or officer of the Company governed by the internal affairs doctrine, in each such case subject to said Court of Chancery having personal jurisdiction over the indispensable parties named as defendants therein. Any person or entity purchasing or otherwise acquiring any interest in shares of capital stock of the Company shall be deemed to have notice of and consented to the forum provisions in our amended and restated certificate of incorporation. However, the enforceability of similar forum provisions in other companies’ certificates of incorporation has been challenged in legal proceedings, and it is possible that a court could find these types of provisions to be unenforceable.
Conflicts of Interest
Delaware law permits corporations to adopt provisions renouncing any interest or expectancy in certain opportunities that are presented to the corporation or its officers, directors or stockholders. Our amended and restated certificate of incorporation will, to the maximum extent permitted from time to time by Delaware law, renounce any interest or expectancy that we have in, or right to be offered an opportunity to participate in, specified business opportunities that are from time to time presented to our officers, directors or stockholders or their respective affiliates, other than those officers, directors, stockholders or affiliates who are our or our subsidiaries’ employees. Our amended and restated certificate of incorporation will provide that, to the fullest extent permitted by law, none of our Sponsor or any of its affiliates or any director who is not employed by us (including any non-employee director who serves as one of our officers in both his director and officer capacities) or his or her affiliates will have any duty to refrain from (i) engaging in a corporate opportunity in the same or similar lines of business in which we or our affiliates now engage or propose to engage or (ii) otherwise competing with us or our affiliates. In addition, to the fullest extent permitted by law, in the event that our Sponsor or any non-employee director acquires knowledge of a potential transaction or other business opportunity which may be a corporate opportunity for itself or himself or its or his affiliates or for us or our affiliates, such person will have no duty to communicate or offer such transaction or business opportunity to us or any of our affiliates and they may take any such opportunity for themselves or offer it to another person or entity. Our amended and restated certificate of incorporation will not renounce our interest in any business opportunity that is expressly offered to a non-employee director solely in his or her capacity as a director or officer of the Company. To the fullest extent permitted by law, no business opportunity will be deemed to be a potential corporate opportunity for us unless we would be permitted to undertake the opportunity under our amended and restated certificate of incorporation, we have sufficient financial resources to undertake the opportunity and the opportunity would be in line with our business.
Limitations on Liability and Indemnification of Officers and Directors
The DGCL authorizes corporations to limit or eliminate the personal liability of directors to corporations and their stockholders for monetary damages for breaches of directors’ fiduciary duties, subject to certain exceptions. Our amended and restated certificate of incorporation includes a provision that eliminates the personal liability of directors for monetary damages for any breach of fiduciary duty as a director, except to the extent such exemption from liability or limitation thereof is not permitted under the DGCL. The effect of these provisions is to eliminate the rights of us and our stockholders, through stockholders’ derivative suits on our behalf, to recover monetary damages from a director for breach of fiduciary duty as a director, including breaches resulting from grossly negligent behavior. However, exculpation does not apply to any director if the
162
Table of Contents
director has acted in bad faith, knowingly or intentionally violated the law, authorized illegal dividends or redemptions or derived an improper benefit from his or her actions as a director.
Our amended and restated bylaws provide that we must indemnify and advance expenses to our directors and officers to the fullest extent authorized by the DGCL. We also are expressly authorized to carry directors’ and officers’ liability insurance providing indemnification for our directors, officers and certain employees for some liabilities. We believe that these indemnification and advancement provisions and insurance are useful to attract and retain qualified directors and executive officers.
The limitation of liability, advancement and indemnification provisions in our amended and restated certificate of incorporation and amended and restated bylaws may discourage stockholders from bringing a lawsuit against directors for breach of their fiduciary duty. These provisions also may have the effect of reducing the likelihood of derivative litigation against directors and officers, even though such an action, if successful, might otherwise benefit us and our stockholders. In addition, your investment may be adversely affected to the extent we pay the costs of settlement and damage awards against directors and officers pursuant to these indemnification provisions.
There is currently no pending material litigation or proceeding involving any of our directors, officers or employees for which indemnification is sought.
Transfer Agent and Registrar
The transfer agent and registrar for our common stock is .
Listing
We intend to apply to have our common stock approved for listing on the NYSE under the symbol
“ ”.
163
Table of Contents
SHARES ELIGIBLE FOR FUTURE SALE
General
Prior to this offering, there has not been a public market for our common stock, and we cannot predict what effect, if any, market sales of shares of common stock or the availability of shares of common stock for sale will have on the market price of our common stock prevailing from time to time. Nevertheless, sales of substantial amounts of common stock, including shares issued upon the exercise of outstanding options, in the public market, or the perception that such sales could occur, could materially and adversely affect the market price of our common stock and could impair our future ability to raise capital through the sale of our equity or equity-related securities at a time and price that we deem appropriate. See “Risk Factors—Risks Related to this Offering and Ownership of Our Common Stock—Future sales, or the perception of future sales, by us or our existing stockholders in the public market following this offering could cause the market price for our common stock to decline.”
Upon the consummation of this offering, we will have shares of common stock outstanding. All shares sold in this offering will be freely tradable without registration under the Securities Act and without restriction by persons other than our “affiliates” (as defined under Rule 144). The shares of common stock held by our Sponsor and certain of our directors and officers after this offering, based on the number of shares outstanding as of December 31, 2014, will be “restricted” securities under the meaning of Rule 144 and may not be sold in the absence of registration under the Securities Act, unless an exemption from registration is available, including the exemptions pursuant to Rule 144 under the Securities Act.
The restricted shares held by our affiliates will be available for sale in the public market at various times after the date of this prospectus pursuant to Rule 144 following the expiration of the applicable lock-up period.
In addition, a total of shares of our common stock has been reserved for issuance under our 2015 Omnibus Incentive Plan (subject to adjustments for stock splits, stock dividends and similar events), which will equal approximately % shares of our common stock outstanding immediately following this offering. The special pricing committee of the Board of Directors may determine the exact number of shares to be reserved for future issuance under the 2015 Omnibus Incentive Plan at its discretion. We intend to file one or more registration statements on Form S-8 under the Securities Act to register common stock issued or reserved for issuance under the 2015 Omnibus Incentive Plan. Any such Form S-8 registration statement will automatically become effective upon filing. Accordingly, shares registered under such registration statement will be available for sale in the open market, unless such shares are subject to vesting restrictions or the lock-up restrictions described below.
Rule 144
In general, under Rule 144, as currently in effect, a person (or persons whose shares are aggregated) who is not deemed to be or have been one of our affiliates for purposes of the Securities Act at any time during 90 days preceding a sale and who has beneficially owned the shares proposed to be sold for at least six months, including the holding period of any prior owner other than an affiliate, is entitled to sell such shares without registration, subject to compliance with the public information requirements of Rule 144. If such a person has beneficially owned the shares proposed to be sold for at least one year, including the holding period of a prior owner other than an affiliate, then such person is entitled to sell such shares without complying with any of the requirements of Rule 144.
In general, under Rule 144, as currently in effect, our affiliates or persons selling shares on behalf of our affiliates, who have met the six month holding period for beneficial ownership of “restricted shares” of our common stock, are entitled to sell within any three month period, a number of shares that does not exceed the greater of:
| • | 1% of the number of shares of our common stock then outstanding, which will equal approximately shares immediately after this offering; or |
164
Table of Contents
| • | the average reported weekly trading volume of our common stock on the during the four calendar weeks preceding the filing of a notice on Form 144 with respect to such sale. |
Sales under Rule 144 by our affiliates or persons selling shares on behalf of our affiliates are also subject to certain manner of sale provisions and notice requirements and to the availability of current public information about us. The sale of these shares, or the perception that sales will be made, could adversely affect the price of our common stock after this offering because a great supply of shares would be, or would be perceived to be, available for sale in the public market.
Lock-Up Agreements
Our executive officers, directors, and holders of substantially all of our stock have agreed, subject to certain exceptions, that they will not offer, sell, contract to sell, pledge, or otherwise dispose of, directly or indirectly, any shares of our common stock or securities convertible into or exchangeable or exercisable for any shares of our common stock, enter into a transaction that would have the same effect, or enter into any swap, hedge, or other arrangement that transfers, in whole or in part, any of the economic consequences of ownership of our common stock, whether any of these transactions are to be settled by delivery of our common stock or such other securities, in cash or otherwise, or publicly disclose the intention to make any offer, sale, pledge, or disposition, or to enter into any such transaction, swap, hedge, or other arrangement, without, in each case, the prior written consent of Citigroup Global Markets Inc. and Merrill Lynch, Pierce, Fenner & Smith Incorporated, on behalf of the underwriters, for a period of 180 days after the date of this prospectus.
Citigroup Global Markets Inc. and Merrill Lynch, Pierce, Fenner & Smith Incorporated, on behalf of the underwriters, in their sole discretion, may release our common stock and other securities subject to the lock-up agreements described above in whole or in part at any time with or without notice.
Registration on Form S-8
Following completion of this offering, we intend to file one or more registration statements on Form S-8 under the Securities Act to register common shares issuable under our stock incentive plans. As a result, common shares issued pursuant to such stock incentive plans will be eligible for resale in the public market without restriction, subject to the Rule 144 limitations applicable to affiliates and the lock-up agreements described above.
Registration Rights
In connection with this offering, we intend to enter into a registration rights agreement that will provide our Sponsor an unlimited number of “demand” registrations and customary “piggyback” registration rights. The registration rights agreement will also provide that we will pay certain expenses relating to such registrations and indemnify the registration rights holders against certain liabilities that may arise under the Securities Act. See “Certain Relationships and Related Party Transactions—Registration Rights Agreement.”
165
Table of Contents
MATERIAL U.S. FEDERAL INCOME AND ESTATE TAX CONSEQUENCES TO NON-U.S. HOLDERS OF OUR COMMON STOCK
The following is a summary of the material U.S. federal income and estate tax consequences to a non-U.S. holder (as defined below) of the purchase, ownership and disposition of our common stock as of the date hereof. Except where noted, this summary deals only with common stock that is held as a capital asset.
A “non-U.S. holder” means a beneficial owner of our common stock that is not for U.S. federal income tax purposes any of the following:
| • | an individual citizen or resident of the United States; |
| • | a corporation (or any other entity treated as a corporation for U.S. federal income tax purposes) created or organized in or under the laws of the United States, any state thereof or the District of Columbia; |
| • | an estate the income of which is subject to U.S. federal income taxation regardless of its source; |
| • | a trust if it (1) is subject to the primary supervision of a court within the United States and one or more United States persons have the authority to control all substantial decisions of the trust or (2) has a valid election in effect under applicable U.S. Treasury regulations to be treated as a United States person; or |
| • | a partnership or entity treated as a partnership for U.S. federal income tax purposes. |
This summary is based upon provisions of the Code, and regulations, rulings and judicial decisions as of the date hereof. Those authorities may be changed, perhaps retroactively, so as to result in U.S. federal income and estate tax consequences different from those summarized below. This summary does not address all aspects of U.S. federal income and estate taxes and does not deal with foreign, state, local or other tax considerations that may be relevant to non-U.S. holders in light of their particular circumstances. In addition, it does not represent a detailed description of the U.S. federal income tax consequences applicable to you if you are subject to special treatment under the U.S. federal income tax laws (including if you are a U.S. expatriate, “controlled foreign corporation,” “passive foreign investment company” or a partnership or other pass-through entity for U.S. federal income tax purposes). We cannot assure you that a change in law will not alter significantly the tax considerations that we describe in this summary.
If a partnership holds our common stock, the tax treatment of a partner will generally depend upon the status of the partner and the activities of the partnership. If you are a partner of a partnership holding our common stock, you should consult your tax advisors.
If you are considering the purchase of our common stock, you should consult your own tax advisors concerning the particular U.S. federal income and estate tax consequences to you of the purchase, ownership or disposition of our common stock, as well as the consequences to you arising under the laws of any other taxing jurisdiction.
Dividends
Dividends paid to a non-U.S. holder of our common stock generally will be subject to withholding of U.S. federal income tax at a 30% rate or such lower rate as may be specified by an applicable income tax treaty. However, dividends that are effectively connected with the conduct of a trade or business by the non-U.S. holder within the United States (and, if required by an applicable income tax treaty, are attributable to a U.S. permanent establishment) are not subject to the withholding tax, provided certain certification and disclosure requirements are satisfied. Instead, such dividends are subject to U.S. federal income tax on a net income basis in the same manner as if the non-U.S. holder were a United States person as defined under the Code. Any such effectively connected dividends received by a foreign corporation may be subject to an additional “branch profits tax” at a 30% rate or such lower rate as may be specified by an applicable income tax treaty.
166
Table of Contents
A non-U.S. holder of our common stock who wishes to claim the benefit of an applicable income tax treaty rate and avoid backup withholding, as discussed below, for dividends will be required (a) to complete the applicable IRS Form W-8 and certify under penalty of perjury that such holder is not a United States person as defined under the Code and is eligible for treaty benefits or (b) if our common stock is held through certain foreign intermediaries, to satisfy the relevant certification requirements of applicable U.S. Treasury regulations.
A non-U.S. holder of our common stock eligible for a reduced rate of U.S. withholding tax pursuant to an income tax treaty may obtain a refund of any excess amounts withheld by timely filing an appropriate claim for refund with the IRS.
Gain on Disposition of Common Stock
Any gain realized on the sale, exchange or other taxable disposition of our common stock generally will not be subject to U.S. federal income tax unless:
| • | the gain is effectively connected with a trade or business of the non-U.S. holder in the United States (and, if required by an applicable income tax treaty, is attributable to a U.S. permanent establishment of the non-U.S. holder); |
| • | the non-U.S. holder is an individual who is present in the United States for 183 days or more in the taxable year of that disposition, and certain other conditions are met; or |
| • | we are or have been a “United States real property holding corporation” for U.S. federal income tax purposes. |
An individual non-U.S. holder described in the first bullet point immediately above will be subject to tax on the net gain derived from the sale under regular graduated United States federal income tax rates applicable to such holder if it were a United States person as defined under the Code. An individual non-U.S. holder described in the second bullet point immediately above will be subject to a flat 30% tax on the gain derived from the sale, which may be offset by United States source capital losses, even though the individual is not considered a resident of the United States. If a non-U.S. holder that is a foreign corporation falls under the first bullet point immediately above, it will be subject to tax on its net gain in the same manner as if it were a United States person as defined under the Code and, in addition, may be subject to the branch profits tax equal to 30% (or such lower rate as may be specified by an applicable income tax treaty) of its effectively connected earnings and profits, subject to adjustments.
We believe we are not and do not anticipate becoming a “United States real property holding corporation” for U.S. federal income tax purposes.
Federal Estate Tax
Common stock held by an individual non-U.S. holder at the time of death will be included in such holder’s gross estate for U.S. federal estate tax purposes, unless an applicable estate tax treaty provides otherwise.
Information Reporting and Backup Withholding
We must report annually to the IRS and to each non-U.S. holder the amount of dividends paid to such holder and the tax withheld with respect to such dividends, regardless of whether withholding was required. Copies of the information returns reporting such dividends and withholding may also be made available to the tax authorities in the country in which the non-U.S. holder resides under the provisions of an applicable income tax treaty.
A non-U.S. holder will be subject to backup withholding for dividends paid to such holder unless such holder certifies under penalty of perjury that it is a non-U.S. holder (and the payor does not have actual knowledge or reason to know that such holder is a United States person as defined under the Code), or such holder otherwise establishes an exemption.
167
Table of Contents
Information reporting and, depending on the circumstances, backup withholding will apply to the proceeds of a sale of our common stock within the United States or conducted through certain U.S.-related financial intermediaries, unless the beneficial owner certifies under penalty of perjury that it is a non-U.S. holder (and the payor does not have actual knowledge or reason to know that the beneficial owner is a United States person as defined under the Code), or such owner otherwise establishes an exemption.
Backup withholding is not an additional tax. Any amounts withheld under the backup withholding rules may be allowed as a refund or a credit against a non-U.S. holder’s U.S. federal income tax liability provided the required information is timely furnished to the IRS.
Additional Withholding Requirements
Under Sections 1471 through 1474 of the Code (such Sections commonly referred to as “FATCA”), a 30% U.S. federal withholding tax may apply to any dividends paid on our common stock, and, for a disposition of our common stock occurring after December 31, 2016, the gross proceeds from such disposition, in each case paid to (i) a “foreign financial institution” (as specifically defined in the Code) which does not provide sufficient documentation, typically on IRS Form W-8BEN-E, evidencing either (x) an exemption from FATCA, or (y) its compliance (or deemed compliance) with FATCA (which may alternatively be in the form of compliance with an intergovernmental agreement with the United States) in a manner that avoids withholding, or (ii) a “non-financial foreign entity” (as specifically defined in the Code) which does not provide sufficient documentation, typically on IRS Form W-8BEN-E, evidencing either (x) an exemption from FATCA, or (y) adequate information regarding certain substantial United States beneficial owners of such entity (if any). If a dividend payment is both subject to withholding under FATCA and subject to the withholding tax discussed above under “—Dividends,” the withholding under FATCA may be credited against, and therefore reduce, such other withholding tax. You should consult your own tax advisor regarding these requirements and whether they may be relevant to your ownership and disposition of our common stock.
168
Table of Contents
Citigroup Global Markets Inc. and Merrill Lynch, Pierce, Fenner & Smith Incorporated are acting as representatives of each of the underwriters named below. Subject to the terms and conditions set forth in an underwriting agreement among us and the underwriters, we have agreed to sell to the underwriters, and each of the underwriters has agreed, severally and not jointly, to purchase from us, the number of shares of common stock set forth opposite its name below.
| Underwriter | Number of Shares | |
| Citigroup Global Markets Inc. |
||
| Merrill Lynch, Pierce, Fenner & Smith Incorporated |
||
| Goldman, Sachs & Co. |
||
| Jefferies LLC |
||
| RBC Capital Markets, LLC |
||
|
| ||
|
Total |
||
|
|
Subject to the terms and conditions set forth in the underwriting agreement, the underwriters have agreed, severally and not jointly, to purchase all of the shares sold under the underwriting agreement if any of these shares are purchased. If an underwriter defaults, the underwriting agreement provides that the purchase commitments of the nondefaulting underwriters may be increased or the underwriting agreement may be terminated.
We have agreed to indemnify the underwriters against certain liabilities, including liabilities under the Securities Act, or to contribute to payments the underwriters may be required to make in respect of those liabilities.
The underwriters are offering the shares, subject to prior sale, when, as and if issued to and accepted by them, subject to approval of legal matters by their counsel, including the validity of the shares, and other conditions contained in the underwriting agreement, such as the receipt by the underwriters of officer’s certificates and legal opinions. The underwriters reserve the right to withdraw, cancel or modify offers to the public and to reject orders in whole or in part.
Commissions and Discounts
The representatives have advised us that the underwriters propose initially to offer the shares to the public at the public offering price set forth on the cover page of this prospectus and to dealers at that price less a concession not in excess of $ per share. After the initial offering, the public offering price, concession or any other term of the offering may be changed.
The following table shows the public offering price, underwriting discounts and commissions and proceeds before expenses to us. The information assumes either no exercise or full exercise by the underwriters of their option to purchase additional shares.
| Per Share | Without Option |
With Option | ||||||||||
| Public offering price |
$ | $ | $ | |||||||||
| Underwriting discounts and commissions |
$ | $ | $ | |||||||||
| Proceeds, before expenses, to us |
$ | $ | $ | |||||||||
The expenses of the offering, not including the underwriting discount, are estimated at $ and are payable by us.
169
Table of Contents
Option to Purchase Additional Shares
We have granted an option to the underwriters, exercisable for 30 days after the date of this prospectus, to purchase up to additional shares at the public offering price, less the underwriting discount. If the underwriters exercise this option, each will be obligated, subject to conditions contained in the underwriting agreement, to purchase a number of additional shares proportionate to that underwriter’s initial amount reflected in the above table.
No Sales of Similar Securities
We, our executive officers and directors and our other existing security holders have agreed not to sell or transfer any common stock or securities convertible into, exchangeable for, exercisable for, or repayable with common stock, for 180 days after the date of this prospectus without first obtaining the written consent of Citigroup Global Markets Inc. and Merrill Lynch, Pierce, Fenner & Smith Incorporated on behalf of the underwriters. Specifically, we and these other persons have agreed, with certain limited exceptions, not to directly or indirectly:
| • | offer, pledge, sell or contract to sell any common stock, |
| • | sell any option or contract to purchase any common stock, |
| • | purchase any option or contract to sell any common stock, |
| • | grant any option, right or warrant for the sale of any common stock, |
| • | lend or otherwise dispose of or transfer any common stock, |
| • | request or demand that we file a registration statement related to the common stock, or |
| • | enter into any swap or other agreement that transfers, in whole or in part, the economic consequence of ownership of any common stock whether any such swap or transaction is to be settled by delivery of shares or other securities, in cash or otherwise. |
This lock-up provision applies to common stock and to securities convertible into or exchangeable or exercisable for or repayable with common stock. It also applies to common stock owned now or acquired later by the person executing the agreement or for which the person executing the agreement later acquires the power of disposition. In the event that either (x) during the last 17 days of the lock-up period referred to above, we issue an earnings release or material news or a material event relating to us occurs or (y) prior to the expiration of the lock-up period, we announce that we will release earnings results or become aware that material news or a material event will occur during the 16-day period beginning on the last day of the lock-up period, the restrictions described above shall continue to apply until the expiration of the 18-day period beginning on the issuance of the earnings release or the occurrence of the material news or material event.
Listing
We intend to apply to have our common stock approved for listing on the NYSE under the symbol “ .” In order to meet the requirements for listing on that exchange, the underwriters have undertaken to sell a minimum number of shares to a minimum number of beneficial owners as required by that exchange.
Before this offering, there has been no public market for our common stock. The initial public offering price will be determined through negotiations among us and the representatives. In addition to prevailing market conditions, the factors to be considered in determining the initial public offering price are
| • | the valuation multiples of publicly traded companies that the representatives believe to be comparable to us, |
| • | our financial information, |
| • | the history of, and the prospects for, our company and the industry in which we compete, |
170
Table of Contents
| • | an assessment of our management, its past and present operations, and the prospects for, and timing of, our future revenues, |
| • | the present state of our development, and |
| • | the above factors in relation to market values and various valuation measures of other companies engaged in activities similar to ours. |
An active trading market for the shares may not develop. It is also possible that after the offering the shares will not trade in the public market at or above the initial public offering price.
The underwriters do not expect to sell more than 5% of the shares in the aggregate to accounts over which they exercise discretionary authority.
Price Stabilization, Short Positions and Penalty Bids
Until the distribution of the shares is completed, SEC rules may limit underwriters and selling group members from bidding for and purchasing our common stock. However, the representatives may engage in transactions that stabilize the price of the common stock, such as bids or purchases to peg, fix or maintain that price.
In connection with the offering, the underwriters may purchase and sell our common stock in the open market. These transactions may include short sales, purchases on the open market to cover positions created by short sales and stabilizing transactions. Short sales involve the sale by the underwriters of a greater number of shares than they are required to purchase in the offering. “Covered” short sales are sales made in an amount not greater than the underwriters’ option to purchase additional shares described above. The underwriters may close out any covered short position by either exercising their option to purchase additional shares or purchasing shares in the open market. In determining the source of shares to close out the covered short position, the underwriters will consider, among other things, the price of shares available for purchase in the open market as compared to the price at which they may purchase shares through the option granted to them. “Naked” short sales are sales in excess of such option. The underwriters must close out any naked short position by purchasing shares in the open market. A naked short position is more likely to be created if the underwriters are concerned that there may be downward pressure on the price of our common stock in the open market after pricing that could adversely affect investors who purchase in the offering. Stabilizing transactions consist of various bids for or purchases of shares of common stock made by the underwriters in the open market prior to the completion of the offering.
The underwriters may also impose a penalty bid. This occurs when a particular underwriter repays to the underwriters a portion of the underwriting discount received by it because the representatives have repurchased shares sold by or for the account of such underwriter in stabilizing or short covering transactions.
Similar to other purchase transactions, the underwriters’ purchases to cover the syndicate short sales may have the effect of raising or maintaining the market price of our common stock or preventing or retarding a decline in the market price of our common stock. As a result, the price of our common stock may be higher than the price that might otherwise exist in the open market. The underwriters may conduct these transactions on the , in the over-the-counter market or otherwise.
Neither we nor any of the underwriters make any representation or prediction as to the direction or magnitude of any effect that the transactions described above may have on the price of our common stock. In addition, neither we nor any of the underwriters make any representation that the representatives will engage in these transactions or that these transactions, once commenced, will not be discontinued without notice.
Electronic Distribution
In connection with the offering, certain of the underwriters or securities dealers may distribute prospectuses by electronic means, such as e-mail.
171
Table of Contents
Other Relationships
The underwriters and their respective affiliates are full service financial institutions engaged in various activities, which may include securities trading, commercial and investment banking, financial advisory, investment management, investment research, principal investment, hedging, financing, market making and brokerage activities. Some of the underwriters and their affiliates have engaged in, and may in the future engage in, investment banking and other commercial dealings in the ordinary course of business with us or our affiliates. They have received, or may in the future receive, customary fees and commissions for these transactions.
In addition, in the ordinary course of their business activities, the underwriters and their affiliates may make or hold a broad array of investments and actively trade debt and equity securities (or related derivative securities) and financial instruments (including bank loans) for their own account and for the accounts of their customers. Such investments and securities activities may involve securities and/or instruments of ours or our affiliates. Certain of the underwriters in this offering and/or their respective affiliates are also lenders and, in some cases, agents or managers for the lenders, under our and our affiliates’ various credit facilities. The underwriters and their affiliates may also make investment recommendations and/or publish or express independent research views in respect of such securities or financial instruments and may hold, or recommend to clients that they acquire, long and/or short positions in such securities and instruments.
Notice to Prospective Investors in the European Economic Area
In relation to each Member State of the European Economic Area which has implemented the Prospectus Directive (each, a “Relevant Member State”) an offer to the public of any shares of our common stock may not be made in that Relevant Member State, except that an offer to the public in that Relevant Member State of any of our common stock may be made at any time under the following exemptions under the Prospectus Directive, if they have been implemented in that Relevant Member State:
| (a) | to any legal entity which is a qualified investor as defined in the Prospectus Directive; |
| (b) | to fewer than 100 or, if the Relevant Member State has implemented the relevant provision of the 2010 PD Amending Directive, 150, natural or legal persons (other than qualified investors as defined in the Prospectus Directive), as permitted under the Prospectus Directive, subject to obtaining the prior consent of the representatives for any such offer; or |
| (c) | in any other circumstances falling within Article 3(2) of the Prospectus Directive, provided that no such offer of our common stock shall result in a requirement for the publication by us or any underwriter of a prospectus pursuant to Article 3 of the Prospectus Directive. |
For the purposes of this provision, the expression an “offer to the public” in relation to any of our common stock in any Relevant Member State means the communication in any form and by any means of sufficient information on the terms of the offer and any of our common stock to be offered so as to enable an investor to decide to purchase any of our common stock, as the same may be varied in that Member State by any measure implementing the Prospectus Directive in that Member State, the expression “Prospectus Directive” means Directive 2003/71/EC (and amendments thereto, including the 2010 PD Amending Directive, to the extent implemented in the Relevant Member State), and includes any relevant implementing measure in the Relevant Member State, and the expression “2010 PD Amending Directive” means Directive 2010/73/EU.
Notice to Prospective Investors in the United Kingdom
Each underwriter has represented and agreed that:
| • | it has only communicated or caused to be communicated and will only communicate or cause to be communicated an invitation or inducement to engage in investment activity (within the meaning of Section 21 of the Financial Services and Markets Act 2000 (“FSMA”) received by it in connection with the issue or sale of the shares of our common stock in circumstances in which Section 21(1) of the FSMA does not apply to us; and |
172
Table of Contents
| • | it has complied and will comply with all applicable provisions of the FSMA with respect to anything done by it in relation to the shares of our common stock in, from or otherwise involving the United Kingdom. |
Notice to Prospective Investors in Switzerland
The shares may not be publicly offered in Switzerland and will not be listed on the SIX Swiss Exchange (“SIX”) or on any other stock exchange or regulated trading facility in Switzerland. This document has been prepared without regard to the disclosure standards for issuance prospectuses under art. 652a or art. 1156 of the Swiss Code of Obligations or the disclosure standards for listing prospectuses under art. 27 ff. of the SIX Listing Rules or the listing rules of any other stock exchange or regulated trading facility in Switzerland. Neither this document nor any other offering or marketing material relating to the shares or the offering may be publicly distributed or otherwise made publicly available in Switzerland.
Neither this document nor any other offering or marketing material relating to the offering, the Company, the shares have been or will be filed with or approved by any Swiss regulatory authority. In particular, this document will not be filed with, and the offer of shares will not be supervised by, the Swiss Financial Market Supervisory Authority FINMA (FINMA), and the offer of shares has not been and will not be authorized under the Swiss Federal Act on Collective Investment Schemes (“CISA”). The investor protection afforded to acquirers of interests in collective investment schemes under the CISA does not extend to acquirers of shares.
Notice to Prospective Investors in the Dubai International Financial Centre
This prospectus relates to an Exempt Offer in accordance with the Offered Securities Rules of the Dubai Financial Services Authority (“DFSA”). This prospectus is intended for distribution only to persons of a type specified in the Offered Securities Rules of the DFSA. It must not be delivered to, or relied on by, any other person. The DFSA has no responsibility for reviewing or verifying any documents in connection with Exempt Offers. The DFSA has not approved this prospectus nor taken steps to verify the information set forth herein and has no responsibility for the prospectus. The shares to which this prospectus relates may be illiquid and/or subject to restrictions on their resale. Prospective purchasers of the shares offered should conduct their own due diligence on the shares. If you do not understand the contents of this prospectus you should consult an authorized financial advisor.
Notice to Prospective Investors in Australia
No placement document, prospectus, product disclosure statement or other disclosure document has been lodged with the Australian Securities and Investments Commission (“ASIC”), in relation to the offering. This prospectus does not constitute a prospectus, product disclosure statement or other disclosure document under the Corporations Act 2001 (the “Corporations Act”), and does not purport to include the information required for a prospectus, product disclosure statement or other disclosure document under the Corporations Act.
Any offer in Australia of the shares may only be made to persons (the “Exempt Investors”) who are “sophisticated investors” (within the meaning of section 708(8) of the Corporations Act), “professional investors” (within the meaning of section 708(11) of the Corporations Act) or otherwise pursuant to one or more exemptions contained in section 708 of the Corporations Act so that it is lawful to offer the shares without disclosure to investors under Chapter 6D of the Corporations Act.
The shares applied for by Exempt Investors in Australia must not be offered for sale in Australia in the period of 12 months after the date of allotment under the offering, except in circumstances where disclosure to investors under Chapter 6D of the Corporations Act would not be required pursuant to an exemption under section 708 of the Corporations Act or otherwise or where the offer is pursuant to a disclosure document which complies with Chapter 6D of the Corporations Act. Any person acquiring shares must observe such Australian on-sale restrictions.
173
Table of Contents
This prospectus contains general information only and does not take account of the investment objectives, financial situation or particular needs of any particular person. It does not contain any securities recommendations or financial product advice. Before making an investment decision, investors need to consider whether the information in this prospectus is appropriate to their needs, objectives and circumstances, and, if necessary, seek expert advice on those matters.
Notice to Prospective Investors in Hong Kong
The shares have not been offered or sold and will not be offered or sold in Hong Kong, by means of any document, other than (a) to “professional investors” as defined in the Securities and Futures Ordinance (Cap. 571) of Hong Kong and any rules made under that Ordinance; or (b) in other circumstances which do not result in the document being a “prospectus” as defined in the Companies Ordinance (Cap. 32) of Hong Kong or which do not constitute an offer to the public within the meaning of that Ordinance. No advertisement, invitation or document relating to the shares has been or may be issued or has been or may be in the possession of any person for the purposes of issue, whether in Hong Kong or elsewhere, which is directed at, or the contents of which are likely to be accessed or read by, the public of Hong Kong (except if permitted to do so under the securities laws of Hong Kong) other than with respect to shares which are or are intended to be disposed of only to persons outside Hong Kong or only to “professional investors” as defined in the Securities and Futures Ordinance and any rules made under that Ordinance.
Notice to Prospective Investors in Japan
The shares have not been and will not be registered under the Financial Instruments and Exchange Law of Japan (Law No. 25 of 1948, as amended) and, accordingly, will not be offered or sold, directly or indirectly, in Japan, or for the benefit of any Japanese Person or to others for re-offering or resale, directly or indirectly, in Japan or to any Japanese Person, except in compliance with all applicable laws, regulations and ministerial guidelines promulgated by relevant Japanese governmental or regulatory authorities in effect at the relevant time. For the purposes of this paragraph, “Japanese Person” shall mean any person resident in Japan, including any corporation or other entity organized under the laws of Japan.
Notice to Prospective Investors in Singapore
This prospectus has not been registered as a prospectus with the Monetary Authority of Singapore. Accordingly, this prospectus and any other document or material in connection with the offer or sale, or invitation for subscription or purchase, of the shares may not be circulated or distributed, nor may the shares be offered or sold, or be made the subject of an invitation for subscription or purchase, whether directly or indirectly, to persons in Singapore other than: (i) to an institutional investor under Section 274 of the Securities and Futures Act, Chapter 289 of Singapore (the “SFA”), (ii) to a relevant person, or any person pursuant to Section 275(1A), and in accordance with the conditions, specified in Section 275 of the SFA or (iii) otherwise pursuant to, and in accordance with the conditions of, any other applicable provision of the SFA.
Where the shares are subscribed or purchased under Section 275 by a relevant person which is: (i) a corporation (which is not an accredited investor) the sole business of which is to hold investments and the entire share capital of which is owned by one or more individuals, each of whom is an accredited investor or (ii) a trust (where the trustee is not an accredited investor) whose sole purpose is to hold investments and each beneficiary is an accredited investor, shares, debentures and units of shares and debentures of that corporation or the beneficiaries’ rights and interest in that trust shall not be transferable for 6 months after that corporation or that trust has acquired the shares under Section 275 except: (a) to an institutional investor under Section 274 of the SFA or to a relevant person, or any person pursuant to Section 275(1A), and in accordance with the conditions, specified in Section 275 of the SFA, (b) where no consideration is given for the transfer or (c) by operation of law.
174
Table of Contents
The validity of the shares of common stock offered by this prospectus will be passed upon for us by Simpson Thacher & Bartlett LLP, New York, New York. Certain legal matters in connection with the offering will be passed upon for the underwriters by Davis Polk & Wardwell LLP, New York, New York. An investment vehicle comprised of selected partners of Simpson Thacher & Bartlett LLP, members of their families, related persons and others owns an interest representing less than 1% of the capital commitments of funds affiliated with The Blackstone Group L.P.
The consolidated financial statements and schedule of PGI Specialty Materials, Inc. at December 31, 2014 and December 28, 2013, and for each of the three years in the period ended December 31, 2014, appearing in this prospectus and registration statement, have been audited by Ernst & Young LLP, independent registered public accounting firm, as set forth in their report thereon appearing elsewhere herein, and are included in reliance upon such report given on the authority of such firm as experts in accounting and auditing.
The financial statements of Fiberweb Limited (formerly Fiberweb plc) as of and for the years ended December 31, 2012, 2011 and 2010, included in this prospectus have been audited by Deloitte LLP, independent auditors, as stated in their report appearing herein, and are included in reliance upon the report of such firm given upon their authority as experts in accounting and auditing.
The consolidated financial statements of Providência as of and for the years ended December 31, 2013 and 2012, included in this prospectus have been audited by Deloitte Touche Tohmatsu Auditores Independentes, independent auditors, as stated in their report appearing herein, and are included in reliance upon the report of such firm given upon their authority as experts in accounting and auditing.
WHERE YOU CAN FIND MORE INFORMATION
We have filed with the SEC a registration statement on Form S-1 under the Securities Act with respect to the common stock offered by this prospectus. This prospectus is a part of the registration statement and does not contain all of the information set forth in the registration statement and its exhibits and schedules, portions of which have been omitted as permitted by the rules and regulations of the SEC. For further information about us and our common stock, you should refer to the registration statement and its exhibits and schedules.
We will file annual, quarterly and special reports and other information with the SEC. Our filings with the SEC will be available to the public on the SEC’s website at http://www.sec.gov. Those filings will also be available to the public on, or accessible through, our website under the heading “Investor Relations” at www.polymergroupinc.com. The information we file with the SEC or contained on or accessible through our corporate website or any other website that we may maintain is not part of this prospectus or the registration statement of which this prospectus is a part. You may also read and copy, at SEC prescribed rates, any document we file with the SEC, including the registration statement (and its exhibits) of which this prospectus is a part, at the SEC’s Public Reference Room located at 100 F Street, N.E., Washington D.C. 20549. You can call the SEC at 1-800-SEC-0330 to obtain information on the operation of the Public Reference Room.
We intend to make available to our common stockholders annual reports containing consolidated financial statements audited by an independent registered public accounting firm.
175
Table of Contents
PGI Specialty Materials, Inc. Audited Consolidated Financial Statements
F-1
Table of Contents
| Fiberweb Limited Audited Consolidated Financial Statements |
||||
| F-154 | ||||
| F-155 | ||||
| F-156 | ||||
| Consolidated Balance Sheets as of December 31, 2012, December 31, 2011 and December 31, 2010 |
F-157 | |||
| F-158 | ||||
| F-159 | ||||
| F-160 | ||||
| Fiberweb Limited Unaudited Condensed Consolidated Financial Statements |
||||
| F-216 | ||||
| F-217 | ||||
| Condensed Consolidated Balance Sheets as of September 30, 2013 and September 30, 2012 |
F-218 | |||
| F-219 | ||||
| Condensed Consolidated Statements of Changes in Equity for the nine months ended September 30, 2013 |
F-220 | |||
| F-221 | ||||
F-2
Table of Contents
Report of Independent Registered Public Accounting Firm
The Board of Directors and Shareholders
PGI Specialty Materials, Inc.
We have audited the accompanying consolidated balance sheets of PGI Specialty Materials, Inc. as of December 31, 2014 and December 28, 2013, and the related consolidated statements of operations, comprehensive income (loss), changes in equity, and cash flows for each of the three years in the period ended December 31, 2014. Our audits also included the financial statement schedule listed in Item 16(b) of the Registration Statement. These financial statements and schedule are the responsibility of the Company’s management. Our responsibility is to express an opinion on these financial statements and schedule based on our audits.
We conducted our audits in accordance with the standards of the Public Company Accounting Oversight Board (United States). Those standards require that we plan and perform the audit to obtain reasonable assurance about whether the financial statements are free of material misstatement. We were not engaged to perform an audit of the Company’s internal control over financial reporting. Our audits included consideration of internal control over financial reporting as a basis for designing audit procedures that are appropriate in the circumstances, but not for the purpose of expressing an opinion on the effectiveness of the Company’s internal control over financial reporting. Accordingly, we express no such opinion. An audit also includes examining, on a test basis, evidence supporting the amounts and disclosures in the financial statements, assessing the accounting principles used and significant estimates made by management, and evaluating the overall financial statement presentation. We believe that our audits provide a reasonable basis for our opinion.
In our opinion, the financial statements referred to above present fairly, in all material respects, the consolidated financial position of PGI Specialty Materials, Inc. at December 31, 2014 and December 28, 2013, and the consolidated results of its operations and its cash flows for each of the three years in the period ended December 31, 2014, in conformity with U.S. generally accepted accounting principles. Also, in our opinion, the related financial statement schedule, when considered in relation to the basic financial statements taken as a whole, presents fairly in all material respects the information set forth therein.
/s/ Ernst & Young LLP
Charlotte, North Carolina
April 27, 2015
F-3
Table of Contents
CONSOLIDATED BALANCE SHEETS
| In thousands, except share data |
December 31, 2014 |
December 28, 2013 |
||||||
| ASSETS |
||||||||
| Current assets: |
||||||||
| Cash and cash equivalents |
$ | 178,491 | $ | 86,064 | ||||
| Accounts receivable, net |
247,727 | 194,827 | ||||||
| Inventories, net |
173,701 | 156,074 | ||||||
| Deferred income taxes |
16,776 | 2,318 | ||||||
| Other current assets |
89,121 | 59,096 | ||||||
|
|
|
|
|
|||||
| Total current assets |
705,816 | 498,379 | ||||||
|
|
|
|
|
|||||
| Property, plant and equipment, net |
870,230 | 652,780 | ||||||
| Goodwill |
220,554 | 115,328 | ||||||
| Intangible assets, net |
178,911 | 169,399 | ||||||
| Deferred income taxes |
18,231 | 2,582 | ||||||
| Other noncurrent assets |
41,431 | 26,052 | ||||||
|
|
|
|
|
|||||
| Total assets |
$ | 2,035,173 | $ | 1,464,520 | ||||
|
|
|
|
|
|||||
| LIABILITIES AND EQUITY |
||||||||
| Current liabilities: |
||||||||
| Short-term borrowings |
$ | 17,665 | $ | 2,472 | ||||
| Accounts payable and accrued liabilities |
321,313 | 307,731 | ||||||
| Income taxes payable |
9,636 | 3,613 | ||||||
| Deferred income taxes |
10,217 | 1,342 | ||||||
| Current portion of long-term debt |
31,892 | 13,797 | ||||||
|
|
|
|
|
|||||
| Total current liabilities |
390,723 | 328,955 | ||||||
|
|
|
|
|
|||||
| Long-term debt |
1,433,283 | 880,399 | ||||||
| Deferred purchase price |
42,440 | — | ||||||
| Deferred income taxes |
36,223 | 33,236 | ||||||
| Other noncurrent liabilities |
67,124 | 62,191 | ||||||
|
|
|
|
|
|||||
| Total liabilities |
1,969,793 | 1,304,781 | ||||||
|
|
|
|
|
|||||
| Commitments and contingencies (Note 22) |
||||||||
| Redeemable noncontrolling interest |
89,181 | — | ||||||
| Equity: |
||||||||
| Common stock—par value $0.01; 1,000,000 authorized shares; 292,491 issued and outstanding December 31, 2014; and 291,991 issued and outstanding December 28, 2013 |
3 | 3 | ||||||
| Additional paid-in capital |
277,245 | 294,141 | ||||||
| Accumulated deficit |
(242,439 | ) | (127,142 | ) | ||||
| Accumulated other comprehensive income (loss) |
(59,164 | ) | (8,106 | ) | ||||
|
|
|
|
|
|||||
| Total PGI Special Materials, Inc. shareholders’ equity (deficit) |
(24,355 | ) | 158,896 | |||||
| Noncontrolling interest |
554 | 843 | ||||||
|
|
|
|
|
|||||
| Total equity (deficit) |
(23,801 | ) | 159,739 | |||||
|
|
|
|
|
|||||
| Total liabilities and equity |
$ | 2,035,173 | $ | 1,464,520 | ||||
|
|
|
|
|
|||||
See accompanying Notes to Consolidated Financial Statements.
F-4
Table of Contents
CONSOLIDATED STATEMENTS OF OPERATIONS
| In thousands, except for per share data |
Fiscal Year Ended December 31, 2014 |
Fiscal Year Ended December 28, 2013 |
Fiscal Year Ended December 29, 2012 |
|||||||||
| Net sales |
$ | 1,859,914 | $ | 1,214,862 | $ | 1,155,163 | ||||||
| Cost of goods sold |
(1,526,406 | ) | (1,018,806 | ) | (957,917 | ) | ||||||
|
|
|
|
|
|
|
|||||||
| Gross profit |
333,508 | 196,056 | 197,246 | |||||||||
| Selling, general and administrative expenses |
(254,280 | ) | (153,188 | ) | (140,776 | ) | ||||||
| Special charges, net |
(59,185 | ) | (33,188 | ) | (19,592 | ) | ||||||
| Other operating, net |
(1,845 | ) | (2,512 | ) | 287 | |||||||
|
|
|
|
|
|
|
|||||||
| Operating income (loss) |
18,198 | 7,168 | 37,165 | |||||||||
| Other income (expense): |
||||||||||||
| Interest expense |
(96,153 | ) | (55,974 | ) | (50,414 | ) | ||||||
| Debt modifications and extinguishment costs |
(15,725 | ) | (3,334 | ) | — | |||||||
| Foreign currency and other, net |
(27,083 | ) | (8,851 | ) | (5,134 | ) | ||||||
|
|
|
|
|
|
|
|||||||
| Income (loss) before income taxes |
(120,763 | ) | (60,991 | ) | (18,383 | ) | ||||||
| Income tax (provision) benefit |
1,523 | 36,024 | (7,655 | ) | ||||||||
|
|
|
|
|
|
|
|||||||
| Net income (loss) |
(119,240 | ) | (24,967 | ) | (26,038 | ) | ||||||
| Less: Earnings attributable to noncontrolling interest and redeemable noncontrolling interest |
(3,943 | ) | (34 | ) | — | |||||||
|
|
|
|
|
|
|
|||||||
| Net income (loss) attributable to PGI Specialty Materials, Inc. |
$ | (115,297 | ) | $ | (24,933 | ) | $ | (26,038 | ) | |||
|
|
|
|
|
|
|
|||||||
| Weighted average common shares outstanding, basic and diluted |
292,178 | 264,998 | 260,403 | |||||||||
| Basic and diluted loss per share (Note 17) |
$ | (467.89 | ) | $ | (94.09 | ) | $ | (99.99 | ) | |||
|
|
|
|
|
|
|
|||||||
See accompanying Notes to Consolidated Financial Statements.
F-5
Table of Contents
CONSOLIDATED STATEMENTS OF COMPREHENSIVE INCOME (LOSS)
| In thousands |
Fiscal Year Ended December 31, 2014 |
Fiscal Year Ended December 28, 2013 |
Fiscal Year Ended December 29, 2012 |
|||||||||
| Net income (loss) |
$ | (119,240 | ) | $ | (24,967 | ) | $ | (26,038 | ) | |||
| Other comprehensive income (loss) |
||||||||||||
| Currency translation |
(45,277 | ) | 12,731 | 2,287 | ||||||||
| Employee postretirement benefits |
(15,279 | ) | (738 | ) | (19,912 | ) | ||||||
| Cash flow hedge adjustments |
— | — | — | |||||||||
|
|
|
|
|
|
|
|||||||
| Total other comprehensive income (loss) |
(60,556 | ) | 11,993 | (17,625 | ) | |||||||
| Income tax (provision) benefit |
132 | (5,302 | ) | (15 | ) | |||||||
|
|
|
|
|
|
|
|||||||
| Total other comprehensive income (loss), net of tax |
(60,424 | ) | 6,691 | (17,640 | ) | |||||||
|
|
|
|
|
|
|
|||||||
| Comprehensive income (loss) |
(179,664 | ) | (18,276 | ) | (43,678 | ) | ||||||
| Less: Comprehensive income (loss) attributable to noncontrolling interest and redeemable noncontrolling interest |
(13,309 | ) | (6 | ) | — | |||||||
|
|
|
|
|
|
|
|||||||
| Comprehensive income (loss) attributable to PGI Specialty Materials, Inc. |
$ | (166,355 | ) | $ | (18,270 | ) | $ | (43,678 | ) | |||
|
|
|
|
|
|
|
|||||||
See accompanying Notes to Consolidated Financial Statements.
F-6
Table of Contents
CONSOLIDATED STATEMENTS OF CHANGES IN EQUITY
| In thousands |
PGI Specialty Materials, Inc. Shareholders | |||||||||||||||||||||||||||||||
| Common Stock | Additional Paid- in Capital |
Retained Earnings (Deficit) |
Accumulated Other Comprehensive Income (Loss) |
Total PGI Specialty Materials, Inc. Shareholders’ Equity (Deficit) |
Noncontrolling Interest |
Total Equity |
||||||||||||||||||||||||||
| Shares | Amount | |||||||||||||||||||||||||||||||
| Balance—December 31, 2011 |
260 | 3 | 260,594 | (76,171 | ) | 2,871 | 187,297 | — | 187,297 | |||||||||||||||||||||||
| Amounts due to shareholders |
— | — | (189 | ) | — | — | (189 | ) | — | (189 | ) | |||||||||||||||||||||
| Issuance of Common Stock |
1 | — | 1,276 | — | — | 1,276 | — | 1,276 | ||||||||||||||||||||||||
| Common stock call option reclass |
— | — | (5,144 | ) | — | — | (5,144 | ) | — | (5,144 | ) | |||||||||||||||||||||
| Net income (loss) |
— | — | — | (26,038 | ) | — | (26,038 | ) | — | (26,038 | ) | |||||||||||||||||||||
| Intercompany equipment sale elimination |
— | — | (1,202 | ) | — | — | (1,202 | ) | — | (1,202 | ) | |||||||||||||||||||||
| Share-based compensation |
— | — | 842 | — | — | 842 | — | 842 | ||||||||||||||||||||||||
| Employee benefit plans, net of tax |
— | — | — | — | (19,927 | ) | (19,927 | ) | — | (19,927 | ) | |||||||||||||||||||||
| Currency translation |
— | — | — | — | 2,287 | 2,287 | — | 2,287 | ||||||||||||||||||||||||
|
|
|
|
|
|
|
|
|
|
|
|
|
|
|
|
|
|||||||||||||||||
| Balance—December 29, 2012 |
261 | 3 | 256,177 | (102,209 | ) | (14,769 | ) | 139,202 | — | 139,202 | ||||||||||||||||||||||
| Amounts due to shareholders |
— | — | (222 | ) | — | — | (222 | ) | — | (222 | ) | |||||||||||||||||||||
| Issuance of stock |
31 | — | 30,726 | — | — | 30,726 | — | 30,726 | ||||||||||||||||||||||||
| Common stock call option reclass |
— | — | 3,340 | — | — | 3,340 | — | 3,340 | ||||||||||||||||||||||||
| Net income (loss) |
— | — | — | (24,933 | ) | — | (24,933 | ) | (34 | ) | (24,967 | ) | ||||||||||||||||||||
| Fair value of noncontrolling interest on Fiberweb Acquisition Date |
— | — | — | — | — | — | 849 | 849 | ||||||||||||||||||||||||
| Intercompany equipment sale elimination |
— | — | 130 | — | — | 130 | — | 130 | ||||||||||||||||||||||||
| Share-based compensation |
— | — | 3,990 | — | — | 3,990 | — | 3,990 | ||||||||||||||||||||||||
| Employee benefit plans, net of tax |
— | — | — | — | (2,046 | ) | (2,046 | ) | — | (2,046 | ) | |||||||||||||||||||||
| Currency translation, net of tax |
— | — | — | — | 8,709 | 8,709 | 28 | 8,737 | ||||||||||||||||||||||||
|
|
|
|
|
|
|
|
|
|
|
|
|
|
|
|
|
|||||||||||||||||
| Balance—December 28, 2013 |
292 | $ | 3 | $ | 294,141 | $ | (127,142 | ) | $ | (8,106 | ) | $ | 158,896 | $ | 843 | $ | 159,739 | |||||||||||||||
| Issuance of stock |
— | — | 750 | — | — | 750 | — | 750 | ||||||||||||||||||||||||
| Common stock call option reclass |
— | — | 1,702 | — | — | 1,702 | — | 1,702 | ||||||||||||||||||||||||
| Net income (loss) |
— | — | — | (115,297 | ) | — | (115,297 | ) | (281 | ) | (115,578 | ) | ||||||||||||||||||||
| Periodic adjustment to redemption value |
— | — | (21,409 | ) | — | — | (21,409 | ) | — | (21,409 | ) | |||||||||||||||||||||
| Intercompany equipment sale elimination |
— | — | 130 | — | — | 130 | — | 130 | ||||||||||||||||||||||||
| Share-based compensation |
— | — | 1,931 | — | — | 1,931 | — | 1,931 | ||||||||||||||||||||||||
| Employee benefit plans, net of tax |
— | — | — | — | (15,147 | ) | (15,147 | ) | — | (15,147 | ) | |||||||||||||||||||||
| Currency translation, net of tax |
— | — | — | — | (35,911 | ) | (35,911 | ) | (8 | ) | (35,919 | ) | ||||||||||||||||||||
|
|
|
|
|
|
|
|
|
|
|
|
|
|
|
|
|
|||||||||||||||||
| Balance—December 31, 2014 |
292 | $ | 3 | $ | 277,245 | $ | (242,439 | ) | $ | (59,164 | ) | $ | (24,355 | ) | $ | 554 | $ | (23,801 | ) | |||||||||||||
|
|
|
|
|
|
|
|
|
|
|
|
|
|
|
|
|
|||||||||||||||||
See accompanying Notes to Consolidated Financial Statements.
F-7
Table of Contents
CONSOLIDATED STATEMENTS OF CASH FLOWS
| In thousands |
Fiscal Year Ended December 31, 2014 |
Fiscal Year Ended December 28, 2013 |
Fiscal Year Ended December 29, 2012 |
|||||||||
| Operating activities: |
||||||||||||
| Net income (loss) |
$ | (119,240 | ) | $ | (24,967 | ) | $ | (26,038 | ) | |||
| Adjustments for non-cash transactions: |
||||||||||||
| Debt modification charges |
11,670 | — | — | |||||||||
| Deferred income taxes |
(14,153 | ) | (44,524 | ) | (1,123 | ) | ||||||
| Depreciation and amortization expense |
118,255 | 76,293 | 66,706 | |||||||||
| Non-cash impairment charge |
6,851 | 2,213 | — | |||||||||
| Inventory step-up |
6,905 | 7,288 | — | |||||||||
| Accretion of deferred purchase price |
3,077 | — | — | |||||||||
| (Gain) loss on extinguishment of debt |
— | 3,334 | — | |||||||||
| (Gain) loss on financial instruments |
(4,749 | ) | (799 | ) | (147 | ) | ||||||
| (Gain) loss on sale of assets, net |
1,800 | 185 | 3 | |||||||||
| Non-cash compensation |
1,931 | 3,990 | 842 | |||||||||
| Changes in operating assets and liabilities: |
||||||||||||
| Accounts receivable |
(18,100 | ) | (12,380 | ) | 9,427 | |||||||
| Inventories |
(4,049 | ) | 4,412 | 9,295 | ||||||||
| Other current assets |
(2,335 | ) | 5,346 | 1,221 | ||||||||
| Accounts payable and accrued liabilities |
8,761 | 22,509 | 13,214 | |||||||||
| Other, net |
52,524 | (26,050 | ) | 2,071 | ||||||||
|
|
|
|
|
|
|
|||||||
| Net cash provided by (used in) operating activities |
49,148 | 16,850 | 75,471 | |||||||||
|
|
|
|
|
|
|
|||||||
| Investing activities: |
||||||||||||
| Purchases of property, plant and equipment |
(82,457 | ) | (54,642 | ) | (51,625 | ) | ||||||
| Proceeds from sale of assets |
2,306 | 435 | 1,660 | |||||||||
| Acquisition of intangibles and other |
(250 | ) | (4,582 | ) | (268 | ) | ||||||
| Acquisitions, net of cash acquired |
(356,281 | ) | (278,970 | ) | — | |||||||
|
|
|
|
|
|
|
|||||||
| Net cash provided by (used in) investing activities |
(436,682 | ) | (337,759 | ) | (50,233 | ) | ||||||
|
|
|
|
|
|
|
|||||||
| Financing activities: |
||||||||||||
| Proceeds from long-term borrowings |
628,135 | 629,999 | 10,977 | |||||||||
| Proceeds from short-term borrowings |
32,091 | 4,087 | 5,725 | |||||||||
| Repayment of long-term borrowings |
(131,453 | ) | (337,679 | ) | (7,678 | ) | ||||||
| Repayment of short-term borrowings |
(16,809 | ) | (2,619 | ) | (9,933 | ) | ||||||
| Loan acquisition costs |
(21,283 | ) | (16,102 | ) | (220 | ) | ||||||
| Debt modification costs |
(4,055 | ) | — | — | ||||||||
| Issuance of common stock |
750 | 30,504 | 1,087 | |||||||||
|
|
|
|
|
|
|
|||||||
| Net cash provided by (used in) financing activities |
487,376 | 308,190 | (42 | ) | ||||||||
|
|
|
|
|
|
|
|||||||
| Effect of exchange rate changes on cash |
(7,415 | ) | 904 | (59 | ) | |||||||
|
|
|
|
|
|
|
|||||||
| Net change in cash and cash equivalents |
92,427 | (11,815 | ) | 25,137 | ||||||||
| Cash and cash equivalents at beginning of period |
86,064 | 97,879 | 72,742 | |||||||||
|
|
|
|
|
|
|
|||||||
| Cash and cash equivalents at end of period |
$ | 178,491 | $ | 86,064 | $ | 97,879 | ||||||
|
|
|
|
|
|
|
|||||||
| Supplemental disclosures of cash flow information: |
||||||||||||
| Cash payments for interest |
$ | 86,581 | $ | 49,671 | $ | 47,711 | ||||||
| Cash payments (receipts) for taxes, net |
$ | 9,126 | $ | 17,158 | $ | 8,381 | ||||||
|
|
|
|
|
|
|
|||||||
See accompanying Notes to Consolidated Financial Statements.
F-8
Table of Contents
NOTES TO CONSOLIDATED FINANCIAL STATEMENTS
Note 1. Description of Business
PGI Specialty Materials, Inc. (“PGI”), a Delaware corporation, and its consolidated subsidiaries (the “Company” or “Parent”) is a leading global innovator and manufacturer of specialty materials for use in a broad range of products that make the world safer, cleaner and healthier. The Company has one of the largest global platforms in the industry, with a total of 22 manufacturing and converting facilities located in 14 countries throughout the world. The Company operates through four reportable segments: North America, South America, Europe and Asia, with the main sources of revenue being the sales of primary and intermediate products to consumer and industrial markets.
Note 2. Basis of Presentation
The accompanying consolidated financial statements reflect the consolidated operations of the Company and have been prepared in accordance with U.S. Generally Accepted Accounting Principles (“GAAP”) as defined by the Financial Accounting Standards Board (“FASB”) within the FASB Accounting Standards Codification (“ASC”). In the opinion of management, the accompanying consolidated financial statements contain all adjustments, which include normal recurring adjustments, necessary to present fairly the consolidated results for the periods presented. Certain reclassifications of amounts reported in prior periods have been made to conform with the current year presentation.
On January 28, 2011, pursuant to an Agreement and Plan of Merger, dated as of November 22, 2010, affiliates of the Blackstone Capital Partners V. L.P (“Blackstone”), along with certain members of the Company’s management acquired the Company (the “Merger”) for an aggregate purchase price valued at $403.5 million, excluding repayment of pre-acquisition indebtedness. The Merger was recorded using the acquisition method of accounting in accordance with the accounting guidance for business combinations and non-controlling interest. Effective October 10, 2014, the Company’s corporate name was changed from “Scorpio Holdings Corporation” to its current name of “PGI Specialty Materials, Inc.”
In light of the recent acquisition of Companhia Providência Indústria e Comércio, a Brazilian corporation (“Providência”) in fiscal year 2014, the Company realigned its reportable segments during the third quarter of fiscal year 2014 to more closely reflect the corporate and business strategies and to promote additional productivity and growth. Prior year information has been updated to conform to the current year presentation.
Prior to 2014, the Company’s fiscal year was based on a 52 week period ending on the Saturday closest to each December 31. As a result, the fiscal years ended December 28, 2013 and December 29, 2012 each contain operating results for 52 weeks, respectively. On December 11, 2014, the Board of Directors of the Company approved a change in the Company’s fiscal year end to a calendar year ending on December 31, effective beginning with the fiscal year 2014. The change has been made on a prospective basis and prior periods have not been adjusted. Since the change in the Company’s year-end commenced within seven days of the month end last reported, and the new fiscal year commenced with the end of the old fiscal year, the change is not deemed a change in fiscal year for purposes of reporting subject to Rule 13a-10 or 15d-10.
Note 3. Summary of Significant Accounting Policies
A summary of significant accounting policies used in the preparation of the accompanying financial statements is as follows:
Use of Estimates
The preparation of financial statements in conformity with GAAP requires management to make estimates and assumptions that affect the reported amounts of assets and liabilities and the disclosures of contingent assets
F-9
Table of Contents
and liabilities at the date of the financial statements as well as the reported amounts of revenues and expenses during the reporting period. Actual results could differ from those estimates. Estimates are based on several factors including the facts and circumstances available at the time the estimates are made, historical experience, risk of loss, general economic conditions and trends, and the assessment of the probable future outcome. Estimates and assumptions are reviewed periodically, and the effects of changes, if any, are reflected in the statement of operations in the period that they are determined.
Currency Translation
Assets and liabilities of non-U.S. subsidiaries, where the functional currency is not the U.S. dollar, have been translated at year-end exchange rates, and income and expense accounts have been translated using average exchange rates throughout the year. Adjustments resulting from the process of translating an entity’s financial statements into the U.S. dollar have been recorded in the Shareholders’ Equity section of the Consolidated Balance Sheet within Accumulated other comprehensive income (loss). Transactions that are denominated in a currency other than an entity’s functional currency are subject to changes in exchange rates with the resulting gains and losses recorded within current earnings.
Cash and Cash Equivalents
Cash and cash equivalents include cash on hand and short-term investments with original maturities at the time of purchase of three months or less. The Company maintains amounts on deposit at various financial institutions, which may at times exceed federally insured limits. However, management periodically evaluates the credit-worthiness of those institutions and has not experienced any losses on such deposits.
Allowance for Doubtful Accounts
The allowance for doubtful accounts represents the best estimate of probable loss inherent within the Company’s accounts receivable balance. Estimates are based upon both the creditworthiness of specific customers and the overall probability of losses based upon an analysis of the overall aging of receivables as well as past collection trends and general economic conditions. As of December 31, 2014 and December 28, 2013, the allowance for doubtful accounts was $2.9 million and $0.8 million, respectively.
Inventories
Inventories are stated at the lower of cost, determined on the first-in, first-out (FIFO) method, or fair market value. The Company performs periodic assessments to determine the existence of obsolete, slow-moving and non-saleable inventories and records necessary provisions to reduce such inventories to net realizable value. Costs include direct materials, direct labor and applicable manufacturing overhead.
Property, Plant and Equipment
Property and equipment are stated at cost, less accumulated depreciation. For financial reporting purposes, assets placed in service are recorded at cost and depreciated using the straight-line method over the estimated useful life of the asset. Leasehold improvements are amortized over the shorter of their economic useful life or the related lease term. The range of useful lives used to depreciate property and equipment is as follows:
| Range of Useful Lives | ||
| Building and improvements |
10 to 31 years | |
| Machinery and equipment |
3 to 15 years | |
| Other |
3 to 7 years |
F-10
Table of Contents
Major expenditures for replacements and significant improvements that increase asset values and extend useful lives are also capitalized. Capitalized costs are amortized over their estimated useful lives using the straight-line method. Repairs and maintenance expenditures that do not extend the useful life of the asset are charged to expense as incurred. The carrying amounts of assets that are sold or retired and the related accumulated depreciation are removed from the accounts in the year of disposal, and any resulting gain or loss is reflected in within current earnings.
The Company capitalizes costs, including interest, incurred to develop or acquire internal-use software. These costs are capitalized subsequent to the preliminary project stage once specific criteria are met. Costs incurred in the preliminary project planning stage are expensed. Other costs, such as maintenance and training, are also expensed as incurred. Capitalized costs are amortized over their estimated useful lives using the straight-line method.
Pursuant to ASC 360, “Property, Plant and Equipment” (“ASC 360”), the Company assesses the recoverability of the carrying value of its property and equipment whenever events or changes in circumstances indicate that the carrying amount of the asset may not be recoverable. Recoverability is measured by a comparison of the carrying amount of an asset to the future net undiscounted cash flows expected to be generated by the asset. If the undiscounted cash flows are less than the carrying amount of the asset, an impairment loss is recognized for the amount by which the carrying value of the asset exceeds the fair value of the assets.
Goodwill and Intangible Assets
Pursuant to ASC 350, “Intangibles—Goodwill and Other” (“ASC 350”), goodwill and intangible assets with indefinite useful lives are no longer amortized, but are tested and reviewed annually for impairment during the fourth quarter or whenever there is a significant change in events or circumstances that indicate that the fair value of the asset may be less than the carrying amount of the asset.
Recoverability of goodwill is measured at the reporting unit level and begins with a qualitative assessment to determine, as a basis for whether it is necessary to perform the two-step impairment test under ASC 350, if it is more likely than not that the fair value of each reporting unit is less than its carrying amount. For the reporting units where it is required, the first step compares the carrying amount of the reporting unit to its estimated fair value. If the estimated fair value of a reporting unit exceeds its carrying amount, goodwill of the reporting unit is not impaired and the second step of the impairment test is not necessary. To the extent that the carrying value of the reporting unit exceeds its estimated fair value, a second step is performed, wherein the reporting unit’s carrying value of goodwill is compared to the implied fair value of goodwill. To the extent that the carrying value exceeds the implied fair value, impairment exists and must be recognized.
Recoverability of other intangible assets with indefinite useful lives begins with a qualitative assessment to determine, as a basis for whether it is necessary to calculate the fair value of the indefinite-lived intangible assets, if it is more likely than not that the asset is impaired. When required, recoverability is measured by a comparison of the carrying amount of the intangible assets to the estimated fair value of the respective intangible assets. Any excess of the carrying value over the estimated fair value is recognized as an impairment loss equal to that excess.
Intangible assets such as customer-related intangible assets and non-compete agreements with finite useful lives are amortized on a straight-line basis over their estimated economic lives. The weighted-average useful lives approximate the following:
| Weighted- Average Useful Lives | ||
| Technology |
13 years | |
| Customer relationships |
16 years | |
| Patents |
6 years |
F-11
Table of Contents
The Company assesses the recoverability of the carrying value of its intangible assets with finite useful lives whenever events or changes in circumstances indicate that the carrying amount of the asset may not be recoverable. Recoverability is measured by a comparison of the carrying amount of an asset to the future net undiscounted cash flows expected to be generated by the asset. If the undiscounted cash flows are less than the carrying amount of the asset, an impairment loss is recognized for the amount by which the carrying value of the asset exceeds the fair value of the assets.
Loan Acquisition Costs
Loan acquisition costs are expenditures associated with obtaining financings that are capitalized in the Consolidated Balance Sheets and amortized over the term of the loans to which such costs relate. Amounts capitalized are recorded within Intangible assets, net in the Consolidated Balance Sheets and amortized to Interest expense in the Consolidated Statements of Operations.
Derivative Instruments
For derivative instruments, the Company applies ASC 815, “Derivatives and Hedging” (“ASC 815”) which establishes accounting and reporting standards requiring that every derivative instrument (including certain derivative instruments embedded in other contracts) be recorded in the balance sheet as either an asset or liability measured at its fair value. This statement requires that changes in the derivative’s fair value be recognized in current earnings unless specific hedge accounting criteria are met. In addition, a company must also formally document, designate and assess the effectiveness of transactions that receive hedge accounting treatment.
Revenue Recognition
Revenue is recognized and earned when all of the following criteria are satisfied: (a) persuasive evidence of a sales arrangement exists; (b) price is fixed or determinable; (c) collectability is reasonably assured; and (d) delivery has occurred or service has been rendered. The Company recognizes revenue when the title and the risks and rewards of ownership have substantially transferred to the customer. The Company permits customers from time to time to return certain products and continuously monitors and tracks such returns and records an estimate of such future returns, which is based on historical experience and recent trends.
In the normal course of business, the Company extends credit, on open accounts, to its customers after performing a credit analysis based on a number of financial and other criteria. The Company performs ongoing credit evaluations of its customers’ financial condition and does not normally require collateral; however, letters of credit and other security are occasionally required for certain new and existing customers.
Shipping and Handling Fees and Costs
Pursuant to ASC 605, “Revenue Recognition” (“ASC 605”), the Company determined that shipping fees shall be reported on a gross basis. As a result, all amounts billed to a customer in a sale transaction related to shipping and handling fees represent revenues earned for the goods provided and therefore recorded within Net sales in the Consolidated Statement of Operations. Shipping and handling costs include expenses incurred to store, move, and prepare products for shipment. The Company classifies these costs as Selling, general and administrative expenses within the Consolidated Statement of Operations, and includes a portion of internal costs such as salaries and overhead related to these activities. For the fiscal years ended December 31, 2014, December 28, 2013 and December 29, 2012, the Company incurred $66.6 million, $38.5 million and $33.8 million related to these costs, respectively.
Research and Development Costs
The Company conducts research and development activities for the purpose of developing and improving new products and services. These costs are expensed when incurred and included in Selling, general and
F-12
Table of Contents
administrative expenses in the Consolidated Statement of Operations. For the fiscal years ended December 31, 2014, December 28, 2013 and December 29, 2012, these expenditures amounted to $18.1 million and $11.8 million and $12.5 million, respectively.
Employee Benefit Plans
The Company provides a range of benefits, including pensions and postretirement benefits to eligible current and former employees. Determining the cost associated with such benefits is dependent on various actuarial assumptions, including discount rates, expected return on plan assets, compensation increases, employee mortality, turnover rates, and healthcare cost trend rates. Actuaries perform the required calculations to determine expense in accordance with GAAP. Actual results may differ from the actuarial assumptions and are generally accumulated into Accumulated other comprehensive income (loss) and amortized into earnings over future periods. The Company reviews its actuarial assumptions at each measurement date and makes modifications to the assumptions based on current rates and trends, if appropriate.
Income Taxes
The Company records a tax provision for the anticipated tax consequences of the reported results of operations. The provision is computed using the asset and liability method of accounting, under which deferred tax assets and liabilities are recognized for the expected future tax consequences of temporary differences between the carrying amounts of assets and liabilities for financial reporting purposes and the amounts used for income tax purposes. In addition, the Company recognizes future tax benefits, such as net operating losses and tax credits, to the extent that realizing these benefits is considered in its judgment to be more likely than not. Deferred tax assets and liabilities are measured using currently enacted tax rates that apply to taxable income in effect for the years in which those tax items are expected to be realized or settled. The Company regularly reviews the recoverability of its deferred tax assets considering historic profitability, projected future taxable income, and timing of the reversals of existing temporary differences as well as the feasibility of our tax planning strategies. Where appropriate, a valuation allowance is recorded if available evidence suggests that it is more likely than not that some portion or all of a deferred tax asset will not be realized. Changes to valuation allowances are recognized in earnings in the period such determination is made.
The Company accounts for uncertain tax positions by recognizing the financial statement effects of a tax position only when, based upon the technical merits, it is more-likely-than-not that the position will be sustained upon examination. The tax impacts recognized in the financial statements from such positions are then measured based on the largest impact that has a greater than 50% likelihood of being realized upon settlement. The Company recognizes potential accrued interest and penalties associated with unrecognized tax positions as a component of the provision for income taxes.
Net (Loss) Income Per Share
Basic net loss per share (“EPS”) is computed by dividing net income (loss) by the weighted average number of common shares outstanding during the period. Diluted EPS is calculated by adjusting weighted average shares outstanding for the dilutive effect of common stock outstanding for the period, using the treasury stock method. Diluted EPS excludes all dilutive potential common shares if their effect is anti-dilutive. For the fiscal years ended December 31, 2014, December 28, 2013, and December 29, 2012, 22,721, 23,395, and 20,460 share options, respectively, and 3,000 restricted stock units for the fiscal years ended December 31, 2014, and December 28, 2013 have been excluded as their effect is anti-dilutive.
Recent Accounting Standards
Changes to GAAP are established by the FASB in the form of Accounting Standards Updates (“ASUs”) to the FASB’s ASC. The Company considers the applicability and impact of all ASUs. ASUs not listed below were
F-13
Table of Contents
assessed and determined not to be applicable or are expected to have minimal impact on the Company’s Condensed Financial Statements.
In April 2015, the FASB issued ASU No. 2015-03, “Imputation of Interest (Subtopic 835-30): Simplifying the Presentation of Debt Issuance Costs” (“ASU 2015-03”) which requires an entity to present debt issuance costs related to a recognized debt liability in the balance sheet as a direct deduction from the carrying amount of the debt liability, consistent with debt discounts. The recognition and measurement guidance for debt issuance costs are not affected by the amendments in this update. ASU 2015-03 is effective on a retrospective basis for financial statements issued for fiscal years beginning after December 15, 2015, and interim periods within those fiscal years beginning after December 15, 2016. The adoption of this guidance concerns presentation only and will not have any impact on the Company’s financial results.
In January 2015, the FASB issued ASU No. 2015-01, “Income Statement—Extraordinary and Unusual Items” (“ASU 2015-01”) which eliminates from GAAP the concept of extraordinary items. Under the new guidance, an event or transaction that meets the criteria for extraordinary classification is segregated from the results of ordinary operations and shown as a separate item in the income statement, net of tax. In addition, certain other related disclosures are required. ASU 2015-01 is effective for annual periods, and interim periods within those annual periods, beginning after December 15, 2015. Early adoption is permitted provided that the guidance is applied from the beginning of the fiscal year of adoption. The Company does not expect that the adoption of this guidance will have a material effect on its financial results.
In August 2014, the FASB issued ASU No. 2014-15, “Presentation of Financial Statements—Going Concern” (“ASU 2014-15”). The new guidance addresses management’s responsibility to evaluate whether there is substantial doubt about an entity’s ability to continue as a going concern and to provide related footnote disclosures. Substantial doubt is defined as an indication that it is probable that an entity will be unable to meet its obligations as they become due within one year after the date that financial statements are issued. Management’s evaluation should be based on relevant conditions or events, considered in the aggregate, that are known and reasonably knowable at the date that the financial statements are issued. ASU 2014-15 is effective prospectively for reporting periods beginning after December 15, 2016, with early adoption permitted. The Company does not expect that the adoption of this guidance will have a material effect on its financial results.
In May 2014, the FASB issued ASU No. 2014-09, “Revenue from Contracts with Customers” (“ASU 2014-09”), which creates a comprehensive, five-step model for revenue recognition that requires a company to recognize revenue to depict the transfer of promised goods or services to a customer at an amount that reflects the consideration it expects to receive in exchange for those goods or services. Under the new guidance, a company will be required to use more judgment and make more estimates when considering contract terms as well as relevant facts and circumstances when identifying performance obligations, estimating the amount of variable consideration in the transaction price and allocating the transaction price to each separate performance obligation. In addition, ASU 2014-09 enhances disclosures about revenue, provides guidance for transactions that were not previously addressed comprehensively and improves guidance for multiple-element arrangements. ASU 2014-09 is effective for annual reporting periods beginning after December 15, 2016 and allows for either full retrospective or modified retrospective adoption. Early application is not permitted. The Company is currently evaluating the impact of adopting ASU 2014-09 on its financial results.
In April 2014, the FASB issued ASU No. 2014-08, “Reporting Discontinued Operations and Disclosures of Disposals of Components of an Entity” (“ASU 2014-08”), which changes the criteria for determining which disposals can be presented as discontinued operations and modifies related disclosure requirements. Under the new guidance, a discontinued operation is defined as a disposal of a component or a group of components that is disposed of or is classified as held for sale and represents a strategic shift that has (or will have) a major effect on an entity’s operations and financial results. In addition, ASU 2014-08 enhances disclosures for reporting discontinued operations. ASU 2014-08 is effective prospectively for reporting periods beginning after December 15, 2014, with early adoption permitted. The Company adopted this accounting pronouncement effective January 1, 2015. The adoption of this guidance did not have a significant impact on the Company’s financial results.
F-14
Table of Contents
In July 2013, the FASB issued ASU No. 2013-11, “Presentation of an Unrecognized Tax Benefit When a Net Operating Loss Carryforward, a Similar Tax Loss, or a Tax Credit Carryforward Exists” (“ASU 2013-11”), which requires an unrecognized tax benefit, or a portion of an unrecognized tax benefit, be presented in the financial statements as a reduction of a deferred tax asset for a net operating loss carryforward, a similar tax loss, or a tax credit carryforward if such settlement is required or expected in the event the uncertain tax position is disallowed. In situations where a net operating loss carryforward, a similar tax loss, or a tax credit carryforward is not available at the reporting date under the tax law of the applicable jurisdiction or the tax law of the jurisdiction does not require, and the entity does not intend to use, the deferred tax asset for such purpose, the unrecognized tax benefit should be presented in the financial statements as a liability and should not be combined with deferred tax assets. ASU 2013-11 is effective prospectively for reporting periods beginning after December 15, 2013, with retroactive application permitted. The Company adopted this accounting pronouncement effective December 29, 2013. The adoption of this guidance did not have a significant impact on the Company’s financial results.
In February 2013, the FASB issued ASU No. 2013-02, “Reporting of Amounts Reclassified Out of Accumulated Other Comprehensive Income” (“ASU 2013-02”), which requires an entity to provide information about the amounts reclassified out of accumulated other comprehensive income by component. In addition, ASU 2013-02 requires an entity to present, either on the face of the income statement or in the notes to the financial statements, significant amounts reclassified out of accumulated other comprehensive income by the respective line items of net income but only if the amount reclassified is required under GAAP to be reclassified to net income in its entirety in the same reporting period. For other amounts, an entity is required to cross-reference to other disclosures required under GAAP that provide additional detail about those amounts. The amendments in ASU 2013-02 do not change the current requirements for reporting net income or other comprehensive income in the financial statements. ASU 2013-02 is effective prospectively for reporting periods beginning after December 15, 2012. The adoption of this guidance concerns disclosure only and did not have an impact on our financial results.
In July 2012, the FASB issued ASU No. 2012-02, “Testing Indefinite-Lived Intangible Assets for Impairment” which amended the guidance on the annual impairment testing of indefinite-lived intangible assets other than goodwill. The amended guidance will allow a company the option to first assess qualitative factors to determine whether it is more-likely-than-not that the fair value of an indefinite-lived intangible asset is less than its carrying amount. If, based on the qualitative assessment, it is more-likely-than-not that the fair value of an indefinite-lived intangible asset is less than its carrying amount, quantitative impairment testing is required. However, if a company concludes otherwise, quantitative impairment testing is not required. This new guidance was adopted in the fourth quarter of 2012 and its adoption did not significantly impact the Company’s consolidated financial statements.
Note 4. Acquisitions
Providência Acquisition
On January 27, 2014, the Company announced that PGI Polímeros do Brazil, a Brazilian corporation and wholly-owned subsidiary of the Company (“PGI Acquisition Company”), entered into a Stock Purchase Agreement with Providência and certain shareholders named therein. Pursuant to the terms and subject to the conditions of the Stock Purchase Agreement, PGI Acquisition Company agreed to acquire a 71.25% controlling interest in Providência (the “Providência Acquisition”). Providência is a leading manufacturer of spunmelt nonwoven products primarily used in hygiene applications as well as industrial and healthcare applications. Based in Brazil, Providência has three locations, including one in the United States.
The Providência Acquisition was completed on June 11, 2014 (the “Providência Acquisition Date”) for an aggregate purchase price of $424.8 million and funded with the proceeds from borrowings under an incremental term loan amendment to the Company’s existing Senior Secured Credit Agreement as well as the proceeds from the issuance of $210.0 million of 6.875% Senior Unsecured Notes due in 2019.
F-15
Table of Contents
The components of the purchase price are as follows:
| In thousands |
Consideration | |||
| Cash consideration paid to selling stockholders |
$ | 188,117 | ||
| Cash consideration deposited into escrow |
8,252 | |||
| Deferred purchase price |
47,931 | |||
| Debt repaid |
180,532 | |||
|
|
|
|||
| Total consideration |
$ | 424,832 | ||
|
|
|
|||
Total consideration paid included $47.9 million of deferred purchase price (the “Deferred Purchase Price”). The Deferred Purchase Price is held by the Company and relates to certain unaccrued tax claims of Providência (the “Providência Tax Claims”). Refer to Note 16, “Income Taxes” for further information on the Providência Tax Claims. The Deferred Purchase Price is denominated in Brazilian reals and accretes at a rate of 9.5% per annum compounded daily. Based on the Company’s best estimate, the resolution of the Providência Tax Claims is expected to take longer than a year. As a result, the Deferred Purchase Price is classified as a noncurrent liability.
As required by Brazilian law, PGI Acquisition Company filed a mandatory tender offer registration request with the Securities Commission of Brazil (Comissão de Valores Mobiliários or the “CVM”) in order to launch as required by Brazilian law, after the CVM’s approval, a tender offer to acquire the remaining 28.75% of the outstanding capital stock of Providência that is currently held by the minority shareholders (the “Mandatory Tender Offer”). The price per share to be paid to the minority shareholders in connection with the Mandatory Tender Offer will be substantially the same as paid to the selling shareholders up acquisition of control, including the portion allocated to deferred purchase price and escrow. In addition, the Company voluntarily opted to amend the Mandatory Tender Offer to provide the minority shareholders with an alternative price structure with no escrow or deferred purchase price. Based on the alternative offer, the minority shareholders would receive an all-cash purchase price at closing. The Mandatory Tender Offer registration request is currently under review with the CVM. Once the Mandatory Tender Offer is approved and launched, the minority shareholders have the right, but not the obligation, to sell their remaining outstanding capital stock of Providência. Given such right of the minority shareholders, the Company determined that ASC 480, “Distinguishing Liabilities from Equity” (“ASC 480”) requires the noncontrolling interest to be presented as mezzanine equity on the Consolidated Balance Sheets and adjusted to its estimated maximum redemption amount at each balance sheet date. Refer to Note 17, “Redeemable Noncontrolling Interest” for further information on the accounting of the redeemable noncontrolling interest.
The Providência Acquisition was recorded using the acquisition method of accounting in accordance with the accounting guidance for business combinations. As a result, the total purchase price has been allocated to assets acquired and liabilities assumed based on the preliminary estimate of fair market value of such assets and liabilities at the Providência Acquisition Date. Any excess of the purchase price is recognized as goodwill.
The Company obtained new information related to the assets acquired and liabilities assumed of Providência. The facts and circumstances existed at the date of acquisition and, if known, would have affected the measurement of the amounts recognized at that date. The Company updated its fair market value estimates for inventory, property, plant and equipment, intangible assets and redeemable noncontrolling interest. In addition, impacts related to deferred tax and goodwill were recorded. In accordance with ASC 805, “Business Combinations” (“ASC 805”), measurement period adjustments are not included in current earnings, but recognized as of the date of acquisition with a corresponding adjustment to goodwill resulting from the change in preliminary amounts. As a result, the Company adjusted the preliminary allocation of the purchase price initially recorded at the Providência Acquisition Date to reflect these measurement period adjustments. The estimated fair values of Providência assets acquired, liabilities assumed and resulting goodwill are subject to adjustment as the Company finalizes its fair value analysis. The Company has not completed the detailed valuation work necessary to arrive at the required estimates of the fair value of Providência net assets and the related allocation of purchase price. The Company is still waiting for additional information to finalize the valuation of its acquired intangible
F-16
Table of Contents
assets and property, plant and equipment as well as the accounting for certain tax matters. The Company will complete its final purchase price allocation during the second quarter of 2015.
The preliminary allocation of the purchase price and related measurement period adjustments are as follows:
| In thousands |
Preliminary June 11, 2014 |
Measurement Period Adjustments |
Adjusted June 11, 2014 |
|||||||||
| Cash |
$ | 20,621 | $ | — | $ | 20,621 | ||||||
| Accounts receivable |
52,929 | — | 52,929 | |||||||||
| Inventory |
34,451 | (374 | ) | 34,077 | ||||||||
| Other current assets |
31,848 | — | 31,848 | |||||||||
|
|
|
|
|
|
|
|||||||
| Total current assets |
139,849 | (374 | ) | 139,475 | ||||||||
|
|
|
|
|
|
|
|||||||
| Property, plant and equipment |
400,000 | (94,694 | ) | 305,306 | ||||||||
| Goodwill |
107,497 | 26,150 | 133,647 | |||||||||
| Intangible assets |
4,500 | 14,500 | 19,000 | |||||||||
| Other noncurrent assets |
12,288 | — | 12,288 | |||||||||
|
|
|
|
|
|
|
|||||||
| Total assets acquired |
$ | 664,134 | $ | (54,418 | ) | $ | 609,716 | |||||
|
|
|
|
|
|
|
|||||||
| Current liabilities |
$ | 31,605 | $ | — | $ | 31,605 | ||||||
| Total debt |
74,930 | — | 74,930 | |||||||||
| Deferred income taxes |
38,027 | (42,462 | ) | (4,435 | ) | |||||||
| Other noncurrent liabilities |
1,992 | — | 1,992 | |||||||||
|
|
|
|
|
|
|
|||||||
| Total liabilities assumed |
146,554 | (42,462 | ) | 104,092 | ||||||||
|
|
|
|
|
|
|
|||||||
| Redeemable noncontrolling interest |
92,990 | (12,198 | ) | 80,792 | ||||||||
|
|
|
|
|
|
|
|||||||
| Net assets acquired |
$ | 424,590 | $ | 242 | $ | 424,832 | ||||||
|
|
|
|
|
|
|
|||||||
Cash, accounts receivable and current liabilities were stated at their historical carrying values, which approximate fair value, given the short-term nature of these assets and liabilities. The preliminary estimate of fair value for inventories was based on computations which considered many factors including the estimated selling price of the inventory, the cost to dispose of the inventory as well as the replacement cost of the inventory, where applicable. As a result, the Company increased the carrying value of inventory by $4.5 million. The preliminary estimate of fair value for property, plant and equipment was based on management’s assessment of the acquired assets condition, as well as an evaluation of the current market value for such assets. In addition, the Company also considered the length of time over which the economic benefit of these assets is expected to be realized and adjusted the useful life of such assets accordingly as of the valuation date. As a result, the Company decreased the carrying value of property, plant and equipment by $16.9 million. The preliminary estimate of fair value of the redeemable noncontrolling interest was based upon management’s assessment of the then current market value of the outstanding shares of stock.
The Company recorded an intangible asset, which consisted of a finite-lived customer relationships intangible asset with an estimated fair value of $19.0 million. The valuation was determined using an income approach methodology using the multi-period excess earnings method. The average estimated useful life of the intangible assets is considered to be 15 years, determined based upon various accounting studies, historical acquisition experience, economic factors and future cash flows.
The excess of the purchase price over the preliminary amounts allocated to specific assets and liabilities is included in goodwill which has been allocated on a preliminary basis to the North America and South America segments. The goodwill associated with the Providência Acquisition is not expected to be deductible for tax purposes. The premium in the purchase price paid by the Company for the acquisition of Providência broadens our scale and further solidifies the Company’s position as the largest manufacturer of nonwovens in the world. The Company anticipates that the broad base of clients associated with the acquisition of Providência will
F-17
Table of Contents
enhance the Company’s position in hygiene products and markets as well as strengthen our position in the Americas. In the short-term, the Company anticipates realizing operational and cost synergies at Providência that include purchasing optimization due to larger volumes, reduced manufacturing costs and lower general and administrative costs.
Acquisition related costs are as follows:
| In thousands |
Amount | |||
| Loan acquisition costs |
$ | 21,297 | ||
| Transaction expenses |
18,552 | |||
|
|
|
|||
| Total |
$ | 39,849 | ||
|
|
|
|||
Capitalized loan acquisition costs related to the Providência Acquisition of $10.6 million were recorded within Intangible assets, net in the Consolidated Balance Sheets and are amortized over the term of the loan to which such costs relate. The remainder, $10.7 million, was expensed as incurred during the second quarter and included within Debt modification and extinguishment costs in the Consolidated Statements of Operations. These costs related to common lenders included in the incremental term loan amendment to the Company’s existing Senior Secured Credit Agreement. In accordance with ASC 805, transaction expenses related to the Providência Acquisition were expensed as incurred within Special charges, net in the Consolidated Statements of Operations.
Fiberweb Acquisition
On September 17, 2013, PGI Acquisition Limited, a wholly-owned subsidiary of the Company, entered into an agreement with Fiberweb Limited (formerly Fiberweb plc) (“Fiberweb”) containing the terms of a cash offer to purchase 100% of the issued and to be issued ordinary share capital of Fiberweb at a cash price of £1.02 per share (the “Fiberweb Acquisition”). Under the terms of the agreement, Fiberweb would become a wholly-owned subsidiary of the Company. The offer was affected by a court sanctioned scheme of arrangement of Fiberweb under Part 26 of the UK Companies Act 2006 and consummated on November 15, 2013 (the “Fiberweb Acquisition Date”). The aggregate purchase price was valued at $287.8 million and funded on November 27, 2013 with the proceeds of borrowings under a $268.0 million Senior Secured Bridge Credit Agreement and a $50.0 million Senior Unsecured Bridge Credit Agreement (together, the “Bridge Facilities”). The Bridge Facilities were subsequently refinanced, along with transaction expenses, with the proceeds from a $295.0 million Senior Secured Credit Agreement and a $30.7 million equity investment from Blackstone. Fiberweb is one of the largest global manufacturers of specialized technical fabrics with eight production sites in six countries.
F-18
Table of Contents
The Fiberweb Acquisition was recorded using the acquisition method of accounting in accordance with the accounting guidance for business combinations and non-controlling interest. As a result, the total purchase price has been allocated to assets acquired and liabilities assumed based on the estimated fair market value of such assets and liabilities at the date of Acquisition. Any excess of the purchase price is recognized as goodwill. The allocation of the purchase price was as follows:
| In thousands |
November 15, 2013 |
|||
| Cash |
$ | 8,792 | ||
| Accounts receivable |
49,967 | |||
| Inventory |
71,081 | |||
| Other current assets |
29,889 | |||
|
|
|
|||
| Total current assets |
159,729 | |||
|
|
|
|||
| Property, plant and equipment |
187,529 | |||
| Goodwill |
33,699 | |||
| Intangible assets |
85,996 | |||
| Other noncurrent assets |
1,403 | |||
|
|
|
|||
| Total assets acquired |
$ | 468,356 | ||
|
|
|
|||
| Current liabilities |
84,255 | |||
| Financing obligation |
20,300 | |||
| Total debt |
19,391 | |||
| Deferred income taxes |
45,974 | |||
| Other noncurrent liabilities |
9,825 | |||
| Noncontrolling interest |
849 | |||
|
|
|
|||
| Total liabilities assumed |
$ | 180,594 | ||
|
|
|
|||
| Net assets acquired |
$ | 287,762 | ||
|
|
|
|||
Cash, accounts receivable and current liabilities were stated at their historical carrying values, which approximate their fair value, given the short-term nature of these assets and liabilities. Inventories were recorded at estimated fair value, based on computations which considered many factors including the estimated selling price of the inventory, where applicable. As a result, the Company increased the carrying value of inventory by $9.7 million in order to adjust to estimated fair value. The estimate of fair value for property, plant and equipment was based on management’s assessment of the acquired assets condition, as well as an evaluation of the current market value for such assets. In addition, the Company also considered the length of time over which the economic benefit of these assets is expected to be realized and adjusted the useful life of such assets accordingly as of the valuation date. As a result, the Company increased the carrying value of property, plant and equipment by $24.5 million in order to adjust to estimated fair value.
The Company recorded intangible assets based on their estimated fair value, and consisted of the following:
| In thousands |
Useful Life | Amount | ||||
| Technology |
15 years | $ | 31,827 | |||
| Trade names |
Indefinite | 11,412 | ||||
| Customer relationships |
20 years | 42,757 | ||||
|
|
|
|||||
| Total |
$ | 85,996 | ||||
|
|
|
|||||
The Company allocated $11.4 million to trade names, primarily related to Typar and Reemay. Management considered many factors in the determination that it will account for the asset as an indefinite-lived, including the current market leadership position of the name as well as the recognition in the industry. Therefore, in
F-19
Table of Contents
accordance with current accounting guidance, the indefinite-lived intangible asset will not be amortized, but instead tested for impairment at least annually (more frequently if certain indicators are present).
The excess of the purchase price over the amounts allocated to specific assets and liabilities is included in goodwill and has been allocated to the North America segment. The goodwill is not deductible for tax purposes. The premium in the purchase price paid by the Company for the acquisition of Fiberweb reflects the establishment of the largest manufacturers of nonwovens in the world. The Company anticipates that the improved diversity associated with the acquisition of Fiberweb will provide a foundation for enhanced access to clients in highly specialized, niche end markets as well as provide complementary solutions and new technologies to address our customer’s desire for innovation and customized solutions. In the short-term, the Company anticipates realizing significant operational and cost synergies that include purchasing optimization due to larger volumes, improvement in manufacturing costs and lower general and administrative costs.
Acquisition related costs were as follows:
| In thousands |
Amount | |||
| Loan acquisition costs |
$ | 16,102 | ||
| Transaction expenses |
15,783 | |||
|
|
|
|||
| Total |
$ | 31,885 | ||
|
|
|
|||
Loan acquisition costs related to the Fiberweb Acquisition were capitalized and recorded within Intangible assets, net in the Consolidated Balance Sheets and amortized over the term of the loan to which such costs relate. In accordance with ASC 805 transaction expenses related to the Acquisition are expensed as incurred within Special charges, net in the Consolidated Statement of Operations.
Pro Forma Information
The following unaudited pro forma information for the fiscal year ended December 31, 2014 and December 28, 2013 assumes the acquisition of Fiberweb and Providência occurred as of the beginning of 2013.
| In thousands |
December 31, 2014 |
December 28, 2013 |
||||||
| Net sales |
$ | 1,983,751 | $ | 1,966,103 | ||||
| Net income (loss) |
(226,853 | ) | (78,847 | ) | ||||
The unaudited pro forma information does not purport to be indicative of the results that actually would have been achieved had the operations been combined during the periods presented, nor is it intended to be a projection of future results or trends. During 2014, net sales and operating income (loss) attributable to Providência since the Providência Acquisition Date was $194.3 million and a loss of $3.4 million, respectively.
Note 5. Accounts Receivable Factoring Agreements
In the ordinary course of business, the Company may utilize accounts receivable factoring agreements with third-party financial institutions in order to accelerate its cash collections from product sales. In addition, these agreements provide the Company with the ability to limit credit exposure to potential bad debts, to better manage costs related to collections as well as to enable customers to extend their credit terms. These agreements involve the ownership transfer of eligible trade accounts receivable, without recourse or discount, to a third-party financial institution in exchange for cash.
The Company accounts for these transactions in accordance with ASC 860, “Transfers and Servicing” (“ASC 860”). ASC 860 allows for the ownership transfer of accounts receivable to qualify for sale treatment
F-20
Table of Contents
when the appropriate criteria is met, which permits the Company to present the balances sold under the program to be excluded from Accounts receivable, net on the Consolidated Balance Sheet. Receivables are considered sold when (i) they are transferred beyond the reach of the Company and its creditors, (ii) the purchaser has the right to pledge or exchange the receivables, and (iii) the Company has surrendered control over the transferred receivables. In addition, the Company provides no other forms of continued financial support to the purchaser of the receivables once the receivables are sold. Amounts due from financial institutions are recorded with Other current assets in the Consolidated Balance Sheet.
The Company has a U.S. based program where certain U.S. based receivables are sold to an unrelated third-party financial institution. Under the current terms of the U.S. agreement, the maximum amount of outstanding advances at any one time is $20.0 million, which limitation is subject to change based on the level of eligible receivables, restrictions on concentrations of receivables and the historical performance of the receivables sold. In addition, the Company’s subsidiaries in Brazil, Colombia, France, Italy, Mexico, Netherlands and Spain have entered into factoring agreements to sell certain receivables to an unrelated third-party financial institutions. Under the terms of the non-U.S. agreements, the maximum amount of outstanding advances at any one time is $84.4 million (measured at December 31, 2014 foreign exchange rates), which limitation is subject to change based on the level of eligible receivables, restrictions on concentrations of receivables and the historical performance of the receivables sold.
The following is a summary of receivables sold to the third-party financial institutions that existed at the following balance sheet dates:
| In thousands |
December 31, 2014 |
December 28, 2013 |
||||||
| Trade receivables sold to financial institutions |
$ | 92,528 | $ | 71,542 | ||||
| Net amounts advanced from financial institutions |
78,900 | 63,667 | ||||||
|
|
|
|
|
|||||
| Amounts due from financial institutions |
$ | 13,628 | $ | 7,875 | ||||
|
|
|
|
|
|||||
The Company sold $657.8 million and $414.0 million of receivables under the terms of the factoring agreements during the fiscal years ended December 31, 2014 and December 28, 2013, respectively. The year-over-year increase in receivables sold is primarily attributable to accounts receivable factoring agreements acquired with both the Fiberweb Acquisition and the Providência Acquisition. In addition, a new agreement that was established in France contributed to the increase. The Company pays a factoring fee associated with the sale of receivables based on the dollar of the receivables sold. Amounts incurred for the Company were $1.6 million, $1.2 million and $1.1 million for the fiscal years ended December 31, 2014, December 28, 2013 and December 29, 2012, respectively. These amounts are recorded within Foreign currency and other, net in the Consolidated Statements of Operations.
Note 6. Inventories, Net
At December 31, 2014 and December 28, 2013, the major classes of inventory were as follows:
| In thousands |
December 31, 2014 |
December 28, 2013 |
||||||
| Raw materials and supplies |
$ | 58,951 | $ | 55,544 | ||||
| Work in process |
19,151 | 19,102 | ||||||
| Finished goods |
95,599 | 81,428 | ||||||
|
|
|
|
|
|||||
| Total |
$ | 173,701 | $ | 156,074 | ||||
|
|
|
|
|
|||||
Inventories are stated at the lower of cost, determined on the first-in, first-out (“FIFO”) method, or fair market value. The Company performs periodic assessments to determine the existence of obsolete, slow-moving
F-21
Table of Contents
and non-saleable inventories and records necessary provisions to reduce such inventories to net realizable value. Reserve balances, primarily related to obsolete and slow-moving inventories, were $7.8 million and $3.3 million at December 31, 2014 and December 28, 2013, respectively.
As a result of the acquisition of Providência, the Company increased the carrying value of inventory by $4.5 million as of the Providência Acquisition Date in order to adjust to estimated fair value in accordance with the accounting guidance for business combinations. The preliminary change in the fair value of the assets were based on computations which considered many factors including the estimated selling price of the inventory, the cost to dispose of the inventory as well as the replacement cost of the inventory, where applicable. The step-up in inventory value was amortized to Cost of Goods Sold over the period of Providência’s normal inventory turns, which approximated one month.
As a result of the acquisition of Fiberweb, the Company increased the carrying value of inventory by $9.7 million as of the Fiberweb Acquisition Date in order to adjust to estimated fair value in accordance with the accounting guidance for business combinations. The change in the fair value of the assets were based on computations which considered many factors including the estimated selling price of the inventory, the cost to dispose of the inventory as well as the replacement cost of the inventory, where applicable. The step-up in inventory value was amortized to Cost of Goods Sold over the period of the Company’s normal inventory turns, which approximated two months.
Note 7. Property, Plant and Equipment, Net
The major classes of property, plant and equipment consist of the following:
| In thousands |
December 31, 2014 |
December 28, 2013 |
||||||
| Land |
$ | 54,919 | $ | 50,780 | ||||
| Buildings and land improvements |
240,515 | 179,821 | ||||||
| Machinery, equipment and other |
755,590 | 569,157 | ||||||
| Construction in progress |
49,887 | 28,181 | ||||||
|
|
|
|
|
|||||
| Subtotal |
1,100,911 | 827,939 | ||||||
| Less: Accumulated depreciation |
(230,681 | ) | (175,159 | ) | ||||
|
|
|
|
|
|||||
| Total |
$ | 870,230 | $ | 652,780 | ||||
|
|
|
|
|
|||||
Depreciation expense was $101.8 million, $64.4 million and $58.1 million for the fiscal years ended December 31, 2014, December 28, 2013 and December 29, 2012, respectively.
Note 8. Goodwill
The Company records as goodwill the excess of the purchase price over the fair value of the net assets acquired. Once the final valuation has been performed for each acquisition, adjustments may be recorded. Goodwill is tested and reviewed annually for impairment during the fourth quarter or whenever there is a significant change in events or circumstances that indicate that the fair value of the asset may be less than the carrying amount of the asset.
F-22
Table of Contents
The changes in the carrying amount of goodwill are as follows:
| In thousands |
North America |
South America |
Europe | Asia | Total | |||||||||||||||
| December 29, 2012 |
$ | 39,129 | $ | 6,851 | $ | — | $ | 34,628 | $ | 80,608 | ||||||||||
|
|
|
|
|
|
|
|
|
|
|
|||||||||||
| Acquisitions |
33,699 | — | — | — | 33,699 | |||||||||||||||
| Impairment |
— | — | — | — | — | |||||||||||||||
| Translation |
781 | — | — | 240 | 1,021 | |||||||||||||||
|
|
|
|
|
|
|
|
|
|
|
|||||||||||
| December 28, 2013 |
$ | 73,609 | $ | 6,851 | $ | — | $ | 34,868 | $ | 115,328 | ||||||||||
|
|
|
|
|
|
|
|
|
|
|
|||||||||||
| Acquisitions |
5,688 | 127,959 | — | — | 133,647 | |||||||||||||||
| Impairment |
— | (6,851 | ) | — | — | (6,851 | ) | |||||||||||||
| Translation |
(781 | ) | (20,597 | ) | — | (192 | ) | (21,570 | ) | |||||||||||
|
|
|
|
|
|
|
|
|
|
|
|||||||||||
| December 31, 2014 |
$ | 78,516 | $ | 107,362 | $ | — | $ | 34,676 | $ | 220,554 | ||||||||||
|
|
|
|
|
|
|
|
|
|
|
|||||||||||
As of December 29, 2012, the Company had recorded goodwill of $80.6 million. The balance primarily related to the Merger in which $86.4 million was recorded as goodwill, net of a $7.6 million impairment charge to goodwill in the fourth quarter of 2011 as a result of its annual goodwill impairment test. Other than the amount recorded during 2011, the Company does not have any accumulated impairment losses through December 28, 2013.
On September 15, 2013, PGI Acquisition Limited, a wholly-owned subsidiary of the Company, entered into an agreement with Fiberweb containing the terms of a cash offer to purchase 100% of the issued and to be issued ordinary share capital of Fiberweb. The Acquisition was consummated on November 15, 2013 and funded on November 27, 2013 with the proceeds of the Bridge Facilities. The purchase price has been allocated to assets acquired and liability assumed based on the fair value estimates of such assets and liabilities at the date of acquisition. As a result, the Company recorded $33.7 million as goodwill.
On January 27, 2014, PGI Acquisition Company, a wholly-owned subsidiary of the Company, entered into an agreement with Providência to acquire a 71.25% controlling interest in Providência. The acquisition was consummated on June 11, 2014 and funded with the proceeds from borrowings under an incremental term loan amendment to the Company’s existing Senior Secured Credit Agreement as well as the proceeds from the issuance of $210.0 million of 6.875% Senior Unsecured Notes due in 2019. The purchase price has been allocated to assets acquired and liabilities assumed based on the fair value estimates of such assets and liabilities at the date of acquisition. As a result, the Company recorded $133.6 million as goodwill.
In connection with the Providência Acquisition, the Company realigned its internal reporting structure to reflect its new organizational structure and business focus. Per ASC 350, “Goodwill and Other” (“ASC 350”), goodwill is required to be tested for impairment both before and after a reorganization. As a result, the Company performed a qualitative assessment during the third quarter and determined that goodwill was not impaired at any of the reporting units prior to the reorganization. Subsequent to the reorganization, the Company performed an interim goodwill impairment test and determined that the fair value of goodwill at the Argentina/Colombia reporting unit was zero and that all of its goodwill would be impaired. As a result, the Company recorded a non-cash impairment charge of $6.9 million. Refer to Note 13, “Fair Value of Financial Instruments” for further information on the interim goodwill impairment test.
Note 9. Intangible Assets
Indefinite-lived intangible assets are tested and reviewed annually for impairment during the fourth quarter or whenever there is a significant change in events or circumstances that indicate that the fair value of the asset may be less than the carrying amount of the asset. All other intangible assets with finite useful lives are being amortized on a straight-line basis over their estimated useful lives.
F-23
Table of Contents
The following table sets forth the gross amount and accumulated amortization of the Company’s intangible assets at December 31, 2014 and December 28, 2013:
| December 31, 2014 | December 28, 2013 | |||||||||||||||||||||||
| In thousands |
Gross Carrying Amount |
Accumulated Amortization |
Net | Gross Carrying Amount |
Accumulated Amortization |
Net | ||||||||||||||||||
| Technology |
$ | 63,726 | $ | (14,902 | ) | $ | 48,824 | $ | 63,705 | $ | (9,359 | ) | $ | 54,346 | ||||||||||
| Customer relationships |
76,242 | (12,735 | ) | 63,507 | 60,078 | (8,404 | ) | 51,674 | ||||||||||||||||
| Loan acquisition costs |
40,612 | (14,447 | ) | 26,165 | 30,067 | (7,817 | ) | 22,250 | ||||||||||||||||
| Other |
7,104 | (1,601 | ) | 5,503 | 6,928 | (711 | ) | 6,217 | ||||||||||||||||
| Tradenames (indefinite-lived) |
34,912 | — | 34,912 | 34,912 | — | 34,912 | ||||||||||||||||||
|
|
|
|
|
|
|
|
|
|
|
|
|
|||||||||||||
| Total |
$ | 222,596 | $ | (43,685 | ) | $ | 178,911 | $ | 195,690 | $ | (26,291 | ) | $ | 169,399 | ||||||||||
|
|
|
|
|
|
|
|
|
|
|
|
|
|||||||||||||
As of December 31, 2014, the Company had recorded intangible assets of $178.9 million. Included in this amount are loan acquisition costs incurred in association with acquisitions. These expenditures represent the cost of obtaining financings that are capitalized in the Consolidated Balance Sheets and amortized over the term of the loans to which such costs relate.
The following table presents amortization of the Company’s intangible assets for the following periods:
| In thousands |
Fiscal Year Ended December 31, 2014 |
Fiscal Year Ended December 28, 2013 |
Fiscal Year Ended December 29, 2012 |
|||||||||
| Intangible assets |
$ | 10,801 | $ | 7,095 | $ | 5,906 | ||||||
| Loan acquisition costs |
5,698 | 4,796 | 2,665 | |||||||||
|
|
|
|
|
|
|
|||||||
| Total |
$ | 16,499 | $ | 11,891 | $ | 8,571 | ||||||
|
|
|
|
|
|
|
|||||||
Estimated amortization expense on existing intangible assets for each of the next five years is expected to approximate $15 million in 2015, $16 million in 2016, $16 million in 2017, $16 million in 2018 and $16 million in 2019.
Note 10. Accounts Payable and Accrued Liabilities
Accounts payable and accrued liabilities consist of the following:
| In thousands |
December 31, 2014 |
December 28, 2013 |
||||||
| Accounts payable to vendors |
$ | 209,527 | $ | 209,031 | ||||
| Accrued salaries, wages, incentive compensation and other fringe benefits |
42,485 | 33,889 | ||||||
| Accrued interest |
19,748 | 19,063 | ||||||
| Other accrued expenses |
49,553 | 45,748 | ||||||
|
|
|
|
|
|||||
| Total |
$ | 321,313 | $ | 307,731 | ||||
|
|
|
|
|
|||||
F-24
Table of Contents
Note 11. Debt
The following table presents the Company’s outstanding debt at December 31, 2014 and December 28, 2013:
| In thousands |
December 31, 2014 |
December 28, 2013 |
||||||
| Term Loans |
$ | 703,029 | $ | 293,545 | ||||
| Senior Secured Notes |
504,000 | 560,000 | ||||||
| Senior Unsecured Notes |
210,000 | — | ||||||
| ABL Facility |
— | — | ||||||
| Argentina credit facilities: |
||||||||
| Nacion Facility |
5,010 | 8,341 | ||||||
| Galicia Facility |
2,047 | 3,082 | ||||||
| China Credit Facility |
18,920 | 24,920 | ||||||
| Brazil export credit facilities: |
||||||||
| Itaú Facility ($) |
— | — | ||||||
| Itaú Facility (R$) |
18,871 | — | ||||||
| Recovery Zone Facility Bonds |
— | — | ||||||
| India Loans |
2,437 | 3,216 | ||||||
| Capital lease obligations |
861 | 1,092 | ||||||
|
|
|
|
|
|||||
| Total long-term debt including current maturities |
1,465,175 | 894,196 | ||||||
| Short-term borrowings |
17,665 | 2,472 | ||||||
|
|
|
|
|
|||||
| Total debt |
$ | 1,482,840 | $ | 896,668 | ||||
|
|
|
|
|
|||||
The fair value of the Company’s long-term debt was $1,463.9 million at December 31, 2014 and $933.8 million at December 28, 2013. The fair value of long-term debt is based upon quoted market prices in inactive markets or on available rates for debt with similar terms and maturities (Level 2).
At December 31, 2014, long-term debt maturities are as follows:
| In thousands |
Amount | |||
| 2015 |
$ | 32,011 | ||
| 2016 |
29,801 | |||
| 2017 |
7,704 | |||
| 2018 |
682,994 | |||
| 2019 |
714,005 | |||
| 2020 and thereafter |
— | |||
|
|
|
|||
| Total |
$ | 1,466,515 | ||
|
|
|
|||
Term Loans
On December 19, 2013, Polymer Group, Inc., an indirect wholly-owned subsidiary of PGI, exclusive of its subsidiaries (“PGI Group”), entered into a Senior Secured Credit Agreement (the loans thereunder, the “Term Loans”) with a maturity date upon the earlier of (i) December 19, 2019 and (ii) the 91st day prior to the scheduled maturity of our 7.75% Senior Secured Notes; provided that on such 91st day, our 7.75% Senior Secured Notes have an outstanding aggregate principal amount in excess of $150.0 million. The Term Loans provide for a commitment by the lenders to make secured term loans in an aggregate amount not to exceed $295.0 million, the proceeds of which were used to partially repay amounts outstanding under the Bridge Facilities. In connection with the refinancing of the Bridge Facilities with the Term Loans, the Company recognized a loss on the extinguishment of debt of $3.3 million during the fourth quarter of 2013. This amount,
F-25
Table of Contents
included within Debt modification and extinguishment costs, represented debt issuance costs that were previously capitalized and required to be written off upon the refinancing.
Borrowings bear interest at a fluctuating rate per annum equal to, at PGI Group’s option, (i) a base rate equal to the highest of (a) the federal funds rate plus 1/2 of 1%, (b) the rate of interest in effect for such day as publicly announced from time to time by Citicorp North America, Inc. as its “prime rate” and (c) the LIBOR rate for a one-month interest period plus 1.0% (provided that in no event shall such base rate with respect to the Term Loans be less than 2.0% per annum), in each case plus an applicable margin of 3.25% or (ii) a LIBOR rate for the applicable interest period (provided that in no event shall such LIBOR rate with respect to the Term Loans be less than 1.0% per annum) plus an applicable margin of 4.25%. The applicable margin for the Term Loans is subject to a 25 basis point step-down upon the achievement of a certain senior secured net leverage ratio. The Company is required to repay installments on the Term Loans in quarterly installments in aggregate amounts equal to 1.0% per annum of their funded total principal amount, with the remaining amount payable on the maturity date.
On June 10, 2014, PGI Group entered into an incremental term loan amendment (the “Incremental Amendment”) to the existing Term Loans in which the Company obtained $415.0 million of commitments for incremental term loans from the existing lenders, the terms of which are substantially identical to the terms of the Term Loans. Pursuant to the Incremental Amendment, the Company borrowed $310.0 million, the proceeds of which were used to fund a portion of the consideration paid for the Providência Acquisition. The remaining commitments were used during the third quarter of 2014 to repay existing indebtedness.
The Term Loans are secured (i) together with the Tranche 2 (as defined below) loans, on a first-priority lien basis by substantially all of the Company’s assets and the assets of any existing and future subsidiary guarantors (other than collateral securing the ABL Facility on a first-priority basis), including all of the capital stock of PGI Group and the capital stock of each restricted subsidiary (which, in the case of foreign subsidiaries, will be limited to 65% of the capital stock of each first-tier foreign subsidiary) and (ii) on a second-priority basis by the collateral securing the ABL Facility, in each case, subject to certain exceptions and permitted liens. The Company may voluntarily repay outstanding loans at any time without premium or penalty, other than voluntary prepayment of Term Loans in connection with a repricing transaction on or prior to the date that is six months after the closing date of the Incremental Amendment and customary “breakage” costs with respect to LIBOR loans.
The agreement governing the Term Loans, among other restrictions, limit PGI Group’s ability and the ability of its restricted subsidiaries to: (i) incur or guarantee additional debt or issue disqualified stock or preferred stock; (ii) pay dividends and make other distributions on, or redeem or repurchase, capital stock; (iii) make certain investments; (iv) repurchase stock; (v) incur certain liens; (vi) enter into transactions with affiliates; (vii) merge or consolidate; (viii) enter into agreements that restrict the ability of subsidiaries to make dividends or other payments to PGI Group; (ix) designate restricted subsidiaries as unrestricted subsidiaries; and (x) transfer or sell assets. In addition, the Term Loans contain certain customary representations and warranties, affirmative covenants and events of default.
Under the credit agreement governing the Term Loans, PGI Group’s ability to engage in activities such as incurring additional indebtedness, making investments, refinancing certain indebtedness, paying dividends and entering into certain merger transactions is governed, in part, by our ability to satisfy tests based on Adjusted EBITDA (defined as Consolidated EBITDA in the credit agreement governing the Terms Loans).
Senior Secured Notes
In connection with the Merger, PGI Group issued $560.0 million of 7.75% Senior Secured Notes due 2019 on January 28, 2011. The Senior Secured Notes are fully and unconditionally guaranteed, jointly and severally on
F-26
Table of Contents
a senior secured basis, by each of PGI Group’s wholly-owned domestic subsidiaries. Interest on the Senior Secured Notes is paid semi-annually on February 1 and August 1 of each year. On July 23, 2014, the Company redeemed $56.0 million aggregate principal amount of the Senior Secured Notes at a redemption price of 103.0% of the aggregate principal amount plus any accrued and unpaid interest, to, but excluding, July 23, 2014. The redemption amount was funded by proceeds from the Incremental Amendment. Pursuant to ASC 470, “Modifications and Extinguishments” (“ASC 470”), the Company recognized a loss on debt extinguishment of $2.6 million, which included $0.9 million related to unamortized debt issuance costs. As the nature of this transaction related to a non-operating event, the loss on extinguishment is included in Debt modifications and extinguishment costs in the current period.
The indenture governing the Senior Secured Notes limits, subject to certain exceptions, the ability of PGI Group and its restricted subsidiaries to: (i) incur or guarantee additional debt or issue disqualified stock or preferred stock; (ii) pay dividends and make other distributions on, or redeem or repurchase, capital stock; (iii) make certain investments; (iv) incur certain liens; (v) enter into transactions with affiliates; (vi) merge or consolidate; (vii) enter into agreements that restrict the ability of subsidiaries to make dividends or other payments to PGI Group.; (viii) designate restricted subsidiaries as unrestricted subsidiaries; and (ix) transfer or sell assets. It does not limit the activities of the Parent or the amount of additional indebtedness that Parent or its parent entities may incur. In addition, it also provides for specified events of default, which, if any of them occurs, would permit or require the principal of and accrued interest on the Senior Secured Notes to become or to be declared due and payable.
Under the indenture governing the Senior Secured Notes, PGI Group’s ability to engage in certain activities such as incurring additional indebtedness, making investments, refinancing certain indebtedness, paying dividends and entering into certain merger transactions is governed, in part, by the Company’s ability to satisfy tests based on Adjusted EBITDA (defined as EBITDA in the indenture governing the Senior Secured Notes).
Senior Unsecured Notes
In connection with the Providência Acquisition, the Company’s subsidiary issued $210.0 million of 6.875% Senior Unsecured Notes due 2019 on June 11, 2014. The Senior Unsecured Notes are fully and unconditionally guaranteed, jointly and severally, on a senior unsecured basis, by each of the PGI Group’s wholly-owned domestic subsidiaries. Interest on the Senior Unsecured Notes is paid semi-annually on June 1 and December 1 of each year.
The indenture governing the Senior Unsecured Notes limits, subject to certain exceptions, the ability of PGI Group and its restricted subsidiaries to: (i) incur or guarantee additional debt or issue disqualified stock or preferred stock; (ii) pay dividends and make other distributions on, or redeem or repurchase, capital stock; (iii) make certain investments; (iv) incur certain liens; (v) enter into transactions with affiliates; (vi) merge or consolidate; (vii) enter into agreements that restrict the ability of subsidiaries to make dividends or other payments to PGI Group.; (viii) designate restricted subsidiaries as unrestricted subsidiaries; and (iv) transfer or sell assets. It does not limit the activities of Parent or the amount of additional indebtedness that Parent or its parent entities may incur. In addition, it also provides for specified events of default which, if any occurs, would permit or require the principal of and accrued interest on the Senior Unsecured Notes to become or to be declared due and payable.
Under the indenture governing the Senior Unsecured Notes, PGI Group’s ability to engage in certain activities such as incurring additional indebtedness, making investments, refinancing certain indebtedness, paying dividends and entering into certain merger transactions is governed, in part, by the Company’s ability to satisfy tests based on Adjusted EBITDA (defined as EBITDA in the indenture governing the Senior Unsecured Notes).
F-27
Table of Contents
ABL Facility
On January 28, 2011PGI Group entered into a senior secured asset-based revolving credit facility which was amended and restated on October 5, 2012 (the “ABL Facility”) to provide for borrowings not to exceed $50.0 million, subject to borrowing base availability. The ABL Facility provides borrowing capacity available for letters of credit and borrowings on a same-day basis and is comprised of (i) a revolving tranche of up to $42.5 million (“Tranche 1”) and (ii) a first-in, last out revolving tranche of up to $7.5 million (“Tranche 2”). Provided that no default or event of default was then existing or would arise therefrom, the Company had the option to request that the ABL Facility be increased by an amount not to exceed $20.0 million. The facility matures on October 5, 2017.
On November 26, 2013, PGI Group entered into an amendment to the ABL Facility which increased the Tranche 1 revolving credit commitments by $30.0 million (for a total aggregate revolving credit commitment of $80.0 million) as well as made certain other changes to the agreement. In addition, the Company increased the amount by which the Company can request that the ABL Facility be increased at the Company’s option to an amount not to exceed $75.0 million. The effectiveness of the amendment was subject to the satisfaction of certain specified closing conditions by no later than January 31, 2014, all of which were satisfied prior to such date.
Based on current average excess availability, the borrowings under the ABL Facility will bear interest at a rate per annum equal to, at PGI Group’s option, either (A) British Bankers Association LIBOR Rate (“LIBOR”) (adjusted for statutory reserve requirements) plus a margin of (i) 2.00% in the case of Tranche 1 or (ii) 4.00% in the case of Tranche 2; or (B) the higher of (a) the rate of interest in effect for such day as publicly announced from time to time by Citibank, N.A. as its “prime rate” and (b) the federal funds effective rate plus 0.5% of 1.0% (“ABR”) plus a margin of (x) 1.00% in the case of Tranche 1 or (y) 3.00% in the case of the Tranche 2. As of December 31, 2014, the Company had no outstanding borrowings under the ABL Facility. The borrowing base availability was $62.9 million based on initial advanced rate formulas prior to the completion of the field exam. Outstanding letters of credit in the aggregate amount of $19.3 million left $43.6 million available for additional borrowings. The aforementioned letters of credit were primarily provided to certain administrative service providers and financial institutions. None of these letters of credit had been drawn on as of December 31, 2014.
The ABL Facility contains certain restrictions which limit PGI Group’s ability and the ability of its restricted subsidiaries to: (i) incur or guarantee additional debt; (ii) pay dividends and make other distributions on, or redeem or repurchase, capital stock; (iii) make certain investments; (iv) repurchase stock; (v) incur certain liens; (vi) enter into transactions with affiliates; (vii) merge or consolidate or other fundamental changes; (viii) enter into agreements that restrict the ability of subsidiaries to make dividends or other payments; (ix) designate restricted subsidiaries as unrestricted subsidiaries; (x) transfer or sell assets and (xi) prepay junior financing or other restricted debt. In addition, it contains certain customary representations and warranties, affirmative covenants and events of default. If such an event of default occurs, the lenders under the ABL Facility would be entitled to take various actions, including the acceleration of amounts due under the ABL Facility and all actions permitted to be taken by a secured creditor.
Under the credit agreement governing the ABL Facility, PGI Group’s ability to engage in activities such as incurring additional indebtedness, making investments, refinancing certain indebtedness, paying dividends and entering into certain merger transactions is governed, in part by, the Company’s ability to satisfy tests based on Adjusted EBITDA (defined as Consolidated EBITDA in the credit agreement governing the ABL Facility).
Nacion Facility
In January 2007, the Company’s subsidiary in Argentina entered into an arrangement with banking institutions in Argentina in order to finance the installation of a new spunmelt line at its facility located near Buenos Aires, Argentina. The maximum borrowings available under the facility, excluding any interest added to principal, were 33.5 million Argentine pesos with respect to an Argentine peso-denominated loan and $26.5 million with respect to a U.S. dollar-denominated loan. The loans are secured by pledges covering (i) the
F-28
Table of Contents
subsidiary’s existing equipment lines; (ii) the outstanding stock of the subsidiary; and (iii) the new machinery and equipment being purchased, as well as a trust assignment agreement related to a portion of receivables due from certain major customers of the subsidiary.
The interest rate applicable to borrowings under these term loans is based on LIBOR plus 290 basis points for the U.S. dollar-denominated loan and Buenos Aires Interbanking Offered Rate plus 475 basis points for the Argentine peso-denominated loan. Principal and interest payments began in July 2008 with the loans maturing as follows: annual amounts of $3.5 million beginning in 2011 and continuing through 2015, and the remaining $1.7 million in 2016.
In connection with the Merger, the Company repaid and terminated the Argentine peso-denominated loan. In addition, the U.S. dollar-denominated loan was adjusted to reflect its fair value as of the date of the Merger. As a result, the Company recorded a contra-liability in Long-term debt and will amortize the balance over the remaining life of the facility. At December 31, 2014, the face amount of the outstanding indebtedness under the U.S. dollar-denominated loan was $5.2 million, with a carrying amount of $5.0 million and a weighted average interest rate of 3.13%.
Galicia Facility
On September 27, 2013, the Company’s subsidiary in Argentina entered into an arrangement with a banking institution in Argentina in order to partially finance the upgrade of a manufacturing line at its facility located near Buenos Aires, Argentina. The maximum borrowings available under the facility, excluding any interest added to principal, is 20.0 million Argentine pesos (approximately $3.5 million). The three-year term of the agreement began with the date of the first draw down on the facility, which occurred in the third quarter of 2013, with payments required in twenty-five equal monthly installments beginning after one year. Borrowings will bear interest at 15.25%. As of December 31, 2014, the outstanding balance under the facility was $2.0 million. The remainder of the upgrade is expected to be financed by existing cash balances and cash generated from operations.
China Credit Facility
In the third quarter of 2012, the Company’s subsidiary in China entered into a three-year U.S. dollar-denominated construction loan agreement (the “Hygiene Facility”) with a banking institution in China to finance a portion of the installation of a new spunmelt line at its manufacturing facility in Suzhou, China. The interest rate applicable to borrowings under the Hygiene Facility is based on three-month LIBOR plus an amount to be determined at the time of funding based on the lender’s internal head office lending rate (520 basis points at the time the credit agreement was executed).
The maximum borrowings available under the facility, excluding any interest added to principal, were $25.0 million. At December 28, 2013, the outstanding balance under the Hygiene Facility was $24.9 million with a weighted-average interest rate of 5.46%. The Company repaid $6.0 million of the principal balance during 2014 using a combination of existing cash balances and cash generated from operations. As a result, the outstanding balance under the Hygiene Facility was $18.9 million at December 31, 2014 with a weighted-average interest rate of 5.43%.
Brazil Export Credit Facilities
As a result of the Providência Acquisition, the Company assumed a U.S. dollar-denominated export credit facility with Itaú Unibanco S.A., pursuant to which Providência borrowed $52.4 million in the third quarter of 2011 for the purpose of financing certain export transactions from Brazil. Borrowings bear interest at 4.85% per annum, payable semi-annually. Principal payments are due in 11 equal installments, beginning in September 2013 and ending at final maturity in September 2018. The facility is secured by interests in the receivables related to the exports financed by the facility.
F-29
Table of Contents
On September 22, 2014, the Company entered into an assignment agreement with Itaú Unibanco S.A in order to transfer its rights and obligations under the agreement to the Company. The purchase price for the assigned interest totaled $45.2 million, which the Company funded with a portion of the proceeds from the Incremental Amendment. Pursuant to ASC 470, the Company recognized a loss on debt extinguishment of $2.4 million. As the nature of this transaction related to a non-operating event, the loss on extinguishment is included in Debt modifications and extinguishment costs in the current period.
As a result of the acquisition of Providência, the Company assumed a Brazilian real-denominated export credit facility with Itaú Unibanco S.A., pursuant to which Providência borrowed R$50.0 million in the first quarter of 2013 for the purpose of financing certain export transactions from Brazil. Borrowings bear interest at 8.0% per annum, payable quarterly. The facility matures in February 2016 and is unsecured. At December 31, 2014, outstanding borrowings under the facility totaled $18.9 million.
Recovery Zone Facility Bonds
As a result of the acquisition of Providência, the Company assumed a loan agreement in connection with the issuance of a like amount of recovery zone facility bonds by the Iredell County Industrial Facilities and Pollution Control Financing Authority. The proceeds of $9.1 million were used to finance, in part, the construction of a manufacturing facility in Statesville, North Carolina. The borrowings bear interest at a floating rate, which is reset weekly, and are supported by a letter of credit. On July 21, 2014, the Company repaid the aggregate principal amount of indebtedness with a portion of the proceeds from the Incremental Amendment.
India Indebtedness
As a result of the Fiberweb Acquisition, the Company assumed control of Terram Geosynthetics Private Limited, a joint venture located in Mundra, India in which the Company maintains a 65% controlling interest. As part of the net assets acquired, the Company assumed $3.8 million of debt (including short-term borrowings) that was entered into with a banking institution in India. Amounts outstanding primarily relate to a 14.70% term loan, due in 2017, used to purchase fixed assets. Other amounts relate to short-term credit facilities used to finance working capital requirements (included in Short-term borrowings in the Consolidated Balance Sheets). Combined, the outstanding balances totaled $3.1 million at December 31, 2014.
Other Indebtedness
The Company periodically enters into short-term credit facilities in order to finance various liquidity requirements, including insurance premium payments and short-term working capital needs. At December 31, 2014 and December 28, 2013, outstanding amounts related to such facilities were $17.0 million and $0.4 million, respectively. Borrowings under these facilities are included in Short-term borrowings in the Consolidated Balance Sheets.
The Company also has documentary letters of credit not associated with the ABL Facility or the Hygiene Facility. These letters of credit were primarily provided to certain raw material vendors and amounted to $7.8 million and $8.5 million at December 31, 2014 and December 28, 2013, respectively. None of these letters of credit have been drawn upon.
Note 12. Derivative Instruments
In the normal course of business, the Company is exposed to certain risks arising from business operations and economic factors. These fluctuations can increase the cost of financing, investing and operating the business. The Company may use derivative financial instruments to help manage market risk and reduce the exposure to fluctuations in interest rates and foreign currencies. These financial instruments are not used for trading or other speculative purposes.
F-30
Table of Contents
All derivatives are recognized on the Consolidated Balance Sheet at their fair value as either assets or liabilities. On the date the derivative contract is entered into, the Company designates the derivative as (1) a hedge of the fair value of a recognized asset or liability (fair value hedge), (2) a hedge of a forecasted transaction or the variability of cash flow to be paid (cash flow hedge), or (3) an undesignated instrument. Changes in the fair value of a derivative that is designated as a fair value hedge and determined to be highly effective are recorded in current earnings, along with the gain or loss on the recognized hedged asset or liability that is attributable to the hedged risk. Changes in the fair value of a derivative that is designated as a cash flow hedge and considered highly effective are recorded in Accumulated other comprehensive income (loss) until they are reclassified to earnings in the same period or periods during which the hedged transaction affects earnings. Changes in the fair value of undesignated derivative instruments and the ineffective portion of designated derivative instruments are reported in current earnings.
The Company formally documents all relationships between hedging instruments and hedged items, as well as the risk-management objective and strategy for undertaking various hedge transactions. This process includes linking all derivatives that are designated as fair value hedges to specific assets and liabilities on the Consolidated Balance Sheet and linking cash flow hedges to specific forecasted transactions or variability of cash flow to be paid.
The Company also formally assesses, both at the hedge’s inception and on an ongoing basis, whether the designated derivatives that are used in hedging transactions are highly effective in offsetting changes in fair values or cash flow of hedged items. When a derivative is determined not to be highly effective as a hedge or the underlying hedged transaction is no longer probable, hedge accounting is discontinued prospectively, in accordance with current accounting standards.
The following table presents the fair values of the Company’s derivative instruments for the following periods:
| As of December 31, 2014 | As of December 28, 2013 | |||||||||||||||
| In thousands |
Notional | Fair Value | Notional | Fair Value | ||||||||||||
| Designated hedges: |
||||||||||||||||
| Hygiene Euro Contracts |
$ | — | $ | — | $ | — | $ | — | ||||||||
| Undesignated hedges: |
||||||||||||||||
| Providência Contracts |
140,623 | 3,962 | — | — | ||||||||||||
| Providência Instruments |
20,179 | (560 | ) | — | — | |||||||||||
| Hygiene Euro Contracts |
— | — | — | — | ||||||||||||
| Healthcare Euro Contracts |
— | — | — | — | ||||||||||||
|
|
|
|
|
|
|
|
|
|||||||||
| Total |
$ | 160,802 | $ | 3,402 | $ | — | $ | — | ||||||||
|
|
|
|
|
|
|
|
|
|||||||||
Asset derivatives are recorded within Other current assets and liability derivatives are recorded within Accounts payable and accrued expenses on the Consolidated Balance Sheets.
Providência Contracts
On January 27, 2014, the Company entered into a series of financial instruments with a third-party financial institution used to minimize foreign exchange risk on the future consideration to be paid for the Providência Acquisition and the Mandatory Tender Offer (the “Providência Contracts”). Each contract allows the Company to purchase fixed amounts of Brazilian reals (R$) in the future at specified U.S. dollar exchange rates, coinciding with either the Providência Acquisition or the Mandatory Tender Offer. The Providência Contracts do not qualify for hedge accounting treatment, and therefore, are considered undesignated hedges. As the nature of this transaction is related to a non-operating notional amount, changes in fair value were recorded in Foreign currency and other, net in the current period.
F-31
Table of Contents
The primary financial instrument was related to the Providência Acquisition and consisted of a foreign exchange forward contract with an aggregate notional amount equal to the estimated purchase price. Prior to the Providência Acquisition Date, the Company amended the primary financial instrument to reduce the notional amount to align with the consideration to be paid to the selling stockholders, which resulted in a realized gain for the Company. Upon consummation of the Providência Acquisition, the Company purchased the required Brazilian real at the rate specified per the terms of the contract. In addition, the primary financial instrument was settled in the Company’s favor due to a strengthening U.S. Dollar. As a result, the Company fulfilled its obligations under the terms of the contract that specifically relate to the primary financial instrument and adjusted the fair value to zero with a realized gain of $18.9 million recognized within Foreign currency and other, net. The remaining financial instruments relate to a series of options that expire between 1 year and 5 years associated with the Mandatory Tender Offer and the deferred portion of the consideration paid for the Providência Acquisition.
Providência Instruments
As a result of the acquisition of Providência, the Company assumed a variety of derivative instruments used to reduce the exposure to fluctuations in interest rates and foreign currencies. These financial instruments include an interest rate swap, forward foreign exchange contracts and call option contracts (the “Providência Instruments”). The counterparty to each financial instrument is a third-party financial institution. The Providência Instruments do not qualify for hedge accounting treatment, and therefore, are considered undesignated derivatives. As the nature of the foreign exchange contracts and call option contracts relate to operating notional amounts, changes in the fair value are recorded in Other operating, net in the current period. Changes in the fair value of the interest rate swap is recorded in Interest expense in the current period as the nature of the transaction relates to interest on our outstanding third-party debt.
Bridge Loan Contract
On September 17, 2013, the Company entered into a foreign exchange forward contract with a third-party financial institution used to minimize foreign exchange risk on the Secured Bridge Facility and Unsecured Bridge Facility, the proceeds of which were used to fund the Fiberweb Acquisition (the“Bridge Loan Contract”). The contract allowed the Company to purchase a fixed amount of pounds sterling in the future at a specified U.S. dollar rate. The Bridge Loan Contract did not qualify for hedge accounting treatment, therefore, it was considered an undesignated hedge. As the nature of this transaction is related to a non-operating notional amount, changes in fair value were recorded in Foreign currency and other, net in the current period.
The Fiberweb Acquisition was funded on November 27, 2013, at which time the Company purchased the underlying pounds sterling amount at the U.S. Dollar rate specified in the contract. Upon settlement, the Company benefited from a strengthening U.S. Dollar, whereby less U.S. Dollars were required to purchase the fixed notional amount. As a result, the Company fulfilled its obligations under the terms of the contract, adjusted the fair value of the Bridge Loan Contract to zero with no gain or loss recognized and terminated the agreement.
Hygiene Euro Contracts
On June 30, 2011, the Company entered into a series of foreign exchange forward contracts with a third-party financial institution used to minimize foreign exchange risk on certain future cash commitments related to the new hygiene line under construction in China (the “Hygiene Euro Contracts”). The contracts allow the Company to purchase fixed amount of Euros on specified future dates, coinciding with the payment amounts and dates of equipment purchase contracts. The Hygiene Euro Contracts qualify for hedge accounting treatment and are considered a fair value hedge; therefore, changes in the fair value of each contract is recorded in Other operating, net along with the gain or loss on the recognized hedged asset or liability that is attributable to the hedged risk. Since inception, the Company amended the equipment purchase contract on the hygiene line to which the Hygiene Euro Contracts are linked. However, the Company modified the notional amounts of the
F-32
Table of Contents
Hygiene Euro Contracts to synchronize with the underlying updated contract payments. As a result, the Hygiene Euro Contracts remained highly effective and continued to qualify for hedge accounting treatment.
In May 2013, the Company completed commercial acceptance of the new hygiene line under construction in China and recorded a liability for the remaining balance due. As a result, the Company removed the hedge designation of the Hygiene Euro Contracts and continued to recognize changes in the fair value of the contracts in current earnings as an undesignated hedge until the final payment date. However, changes in the fair value of the hedged asset that is attributable to the hedged risk has been capitalized in the cost base of the hygiene line and no longer recognized in current earnings. During the fourth quarter of 2013, the Company remitted the final payment on the hygiene line and simultaneously fulfilled its obligations under the Hygiene Euro Contracts.
Healthcare Euro Contracts
In January 2011, the Company entered into a series of foreign exchange forward contracts with a third-party financial institution used to minimize foreign exchange risk on certain future cash commitments related to the new healthcare line under construction in China (the “Healthcare Euro Contracts”). The contracts allowed the Company to purchase fixed amount of Euros on specified future dates, coinciding with the payment amounts and dates of equipment purchase contracts. The Healthcare Euro Contracts qualified for hedge accounting treatment and were considered a fair value hedge; therefore, changes in the fair value of each contract was recorded in Other operating, net along with the gain or loss on the recognized hedged asset or liability that was attributable to the hedged risk.
In July 2011, the Company completed commercial acceptance of the new healthcare line under construction in China and recorded a liability for the remaining balance due. As a result, the Company removed the hedge designation of the Healthcare Euro Contracts and will continue to recognize changes in the fair value of the contracts in current earnings as an undesignated hedge. However, changes in the fair value of the hedged asset that is attributable to the hedged risk has been capitalized in the cost base of the healthcare line and no longer recognized in current earnings. During the first quarter of 2012, the Company remitted the final payment on the healthcare line and simultaneously fulfilled its obligations under the Healthcare Euro Contracts.
The following table represents the amount of (gain) or loss associated with derivative instruments in the Consolidated Statement of Operations:
| In thousands |
Fiscal Year Ended December 31, 2014 |
Fiscal Year Ended December 28, 2013 |
Fiscal Year Ended December 29, 2012 |
|||||||||
| Designated hedges: |
||||||||||||
| Hygiene Euro Contracts |
$ | — | $ | (449 | ) | $ | (2,559 | ) | ||||
| Undesignated hedges: |
||||||||||||
| Providência Contracts |
(13,554 | ) | — | — | ||||||||
| Providência Instruments |
(786 | ) | — | — | ||||||||
| Healthcare Euro Contracts |
— | — | (147 | ) | ||||||||
| Hygiene Euro Contracts |
— | (799 | ) | — | ||||||||
|
|
|
|
|
|
|
|||||||
| Total |
$ | (14,340 | ) | $ | (1,248 | ) | $ | (2,706 | ) | |||
|
|
|
|
|
|
|
|||||||
Gains and losses associated with the Company’s designated fair value hedges are offset by the changes in the fair value of the underlying transactions. However, once the hedge is undesignated, the fair value of the hedge is no longer offset by the fair value of the underlying transaction.
F-33
Table of Contents
Note 13. Fair Value of Financial Instruments
The accounting standard for fair value measurements establishes a framework for measuring fair value that is based on the inputs market participants use to determine the fair value of an asset or liability and establishes a fair value hierarchy to prioritize those inputs. The fair value hierarchy is comprised of three levels that are described below:
| Level 1 |
— | Inputs based on quoted prices in active markets for identical assets or liabilities. | ||||
| Level 2 |
— | Inputs other than Level 1 quoted prices, such as quoted prices for similar assets or liabilities; quoted prices in markets that are not active; or other inputs that are observable or can be corroborated by observable market data for substantially the full term of the asset or liability. | ||||
| Level 3 |
— | Unobservable inputs based on little or no market activity and that are significant to the fair value of the assets and liabilities, therefore requiring an entity to develop its own assumptions. | ||||
The fair value hierarchy requires an entity to maximize the use of observable inputs and minimize the use of unobservable inputs when measuring fair value. Observable inputs are obtained from independent sources and can be validated by a third party, whereas unobservable inputs reflect assumptions regarding what a third party would use in pricing an asset or liability based on the best information available under the circumstances. A financial instrument’s categorization within the fair value hierarchy is based upon the lowest level of input that is significant to the fair value measurement.
Recurring Basis
The following tables present the fair value and hierarchy levels for the Company’s assets and liabilities, which are measured at fair value on a recurring basis as of the following period:
| In thousands |
Level 1 | Level 2 | Level 3 | December 31, 2014(1) |
||||||||||||
| Assets |
||||||||||||||||
| Providência Contracts |
$ | — | $ | 3,962 | $ | — | $ | 3,962 | ||||||||
| Liabilities |
||||||||||||||||
| Providência Instruments |
— | (560 | ) | — | (560 | ) | ||||||||||
| (1) | At December 28, 2013, the Company did not have any financial assets or liabilities required to be measured at fair value. |
ASC 820 “Fair Value Measurements and Disclosures” (ASC 820) defines fair value as the exchange price that would be received to sell an asset or paid to transfer a liability (an exit price) in the principal or most advantageous market for the asset or liability in an orderly transaction between market participants on the measurement date.
The Company determines fair value of its financial assets and liabilities using the following methodologies:
| • | Firm Commitment—Assets recognized associated with an unrecognized firm commitment to purchase equipment. The fair value of the assets is based upon indicative price information obtained from a third-party financial institution that is the counterparty to the transaction. |
| • | Derivative instruments—These instruments consist of foreign exchange forward contracts. The fair value is based upon indicative price information obtained from a third-party financial institution that is the counterparty to the transaction. |
The fair values of cash and cash equivalents, accounts receivable, inventories, short-term borrowings and accounts payable and accrued liabilities approximate their carrying values due to the short-term nature of these
F-34
Table of Contents
instruments. The methodologies used by the Company to determine the fair value of its financial assets and liabilities at December 31, 2014 are the same as those used at December 28, 2013. As a result, there have been no transfers between Level 1 and Level 2 categories.
In order to value the Providência Contracts, quantitative models that utilize multiple market inputs (including interest rates, prices and indices to generate continuous yield or pricing curves and volatility factors) are utilized. Prior to the consummation of the Providência Acquisition, management considered the probability of the Providência Acquisition being finalized as a component of the valuation. As a result, the Company considered the fair value of the Providência Contracts a Level 3 fair value determination. Subsequent to the Providência Acquisition and after the settlement of the primary financial instrument included in the Providência Contracts, management no longer is required to consider the probability of the Providência Acquisition being finalized as a component of the valuation. Therefore, the fair value of the remaining Providência Contracts are considered a Level 2 fair value determination.
Non-Recurring Basis
In light of the recent acquisition of Providência, the Company realigned its internal reporting structure during the third quarter of 2014, whereby the former Americas Nonwovens segment was divided into North America and South America segments. As a result of the realignment of the Company’s segments, some of the reporting units changed. When reporting units are changed, ASC 350 requires that goodwill be tested for impairment both before and after the reorganization. Therefore, the Company performed an interim goodwill impairment test and determined that goodwill was not impaired at any of the reporting units prior to the reorganization. Subsequent to the reorganization and reallocation of goodwill, the Company performed an interim goodwill impairment test on the North America and Argentina/Colombia reporting units, using a two-step impairment test to determine if the allocated goodwill is recoverable. The first step compares the carrying amount of the reporting unit to its estimated fair value. If the estimated fair value of the reporting unit exceeds its carrying amount, goodwill of the reporting unit is not impaired and the second step of the impairment test is not necessary. To the extent that the carrying value of the reporting unit exceeds its estimated fair value, a second step is performed, wherein the reporting unit’s carrying value of goodwill is compared to the implied fair value of goodwill. To the extent that the carrying value exceeds the implied fair value, impairment exists and must be recognized.
The estimated fair values of the reporting units were determined using a discounted cash flow (income approach) valuation methodology. Key assumptions regarding estimated cash flows include profit margins, long-term forecasts, discount rates, terminal growth rates and the estimated fair value of certain assets and liabilities. The Company made various assumptions when completing step one and step two of the analysis, which were consistent with our previous annual impairment test. Based on this analysis, the Company determined that subsequent to the reorganization the North American reporting unit passed step one. However, the Argentina/Colombia reporting unit failed the step one impairment calculation and it was necessary to proceed to step two. In step two, the fair value calculated in step one is used to apply the fair value to the assets and liabilities of the reporting unit based on a hypothetical purchase price allocation. The implied fair value of goodwill is determined in the allocation process and compared to the book value of goodwill. Based on this analysis, the Company determined the fair value of goodwill allocated to the Argentina/Colombia reporting unit to be zero and that all of its allocated goodwill would be impaired. As a result, the Company recorded a non-cash impairment charge of $6.9 million. The amount is considered a non-recurring Level 3 fair value determination.
The Company reviews long-lived assets for impairment whenever changes in events or circumstances indicate that the carrying value of an asset may not be recoverable. As a result of the realignment, the Company performed an interim impairment test in accordance with ASC 360, “Property, Plant and Equipment” (“ASC 360”), which requires a long-lived asset (asset group) to be tested for recoverability by comparing the net carrying value of the asset or asset group to the undiscounted net cash flows to be generated from the use and eventual disposition of that asset (asset group). Based on this analysis, the Company determined that the undiscounted net cash flows were greater than the net carrying value of the asset group and therefore no impairment existed.
F-35
Table of Contents
At December 28, 2013, the Company did not have any financial assets or liabilities required to be measured at fair value on a recurring basis. However, the Company reviews long-lived assets for impairment whenever events or changes in circumstances indicate that the carrying value of an asset may not be recoverable. In the fourth quarter of 2013, the Company performed an impairment test on long-lived assets in Argentina. The Company determined the fair value of the long-lived assets to be $14.4 million. As a result, the Company recorded an impairment charge of $2.2 million. Personal property was valued using the cost and market approaches, and the cost approach for construction in progress. Land was valued using a combination of the cost, income and sales comparison approaches. Key assumptions included market rent rates ($5 per square foot), management fees (5%) and an overall capitalization rate (12%). The amount is considered a non-recurring Level 3 fair value determination.
Note 14. Pension and Postretirement Benefit Plans
The Company and its subsidiaries sponsor multiple defined benefit plans that cover certain employees. Postretirement benefit plans, other than pensions, provide healthcare benefits for certain eligible employees. Benefits are primarily based on years of service and the employee’s compensation.
Pension Plans
The Company has both funded and unfunded pension benefit plans. It is the Company’s policy to fund such plans in accordance with applicable laws and regulations in order to ensure adequate funds are available in the plans to make benefit payments to plan participants and beneficiaries when required.
The following table details information regarding the Company’s pension plans:
| U.S. Pension Plans | Non-U.S. Pension Plans | |||||||||||||||
| In thousands |
Fiscal Year Ended December 31, 2014 |
Fiscal Year Ended December 28, 2013 |
Fiscal Year Ended December 31, 2014 |
Fiscal Year Ended December 28, 2013 |
||||||||||||
| Pension Plans |
||||||||||||||||
| Change in Projected Benefit Obligation: |
||||||||||||||||
| Benefit obligation at beginning of year |
$ | (98,320 | ) | $ | (16,309 | ) | $ | (138,304 | ) | $ | (131,580 | ) | ||||
| Service costs |
(322 | ) | (4 | ) | (2,995 | ) | (3,398 | ) | ||||||||
| Interest costs |
(4,416 | ) | (1,067 | ) | (5,356 | ) | (4,980 | ) | ||||||||
| Participant contributions |
— | — | (171 | ) | (170 | ) | ||||||||||
| Acquisition / transfers |
— | (84,932 | ) | (2,594 | ) | (1,602 | ) | |||||||||
| Plan amendments |
— | — | — | 622 | ||||||||||||
| Actuarial gain / (loss) |
(18,229 | ) | 2,670 | (39,661 | ) | 2,273 | ||||||||||
| Settlements / curtailments |
— | — | 204 | — | ||||||||||||
| Benefit payments |
6,261 | 1,322 | 4,959 | 4,917 | ||||||||||||
| Currency translation |
— | — | 20,768 | (4,386 | ) | |||||||||||
|
|
|
|
|
|
|
|
|
|||||||||
| Benefit obligation at end of year |
$ | (115,026 | ) | $ | (98,320 | ) | $ | (163,150 | ) | $ | (138,304 | ) | ||||
|
|
|
|
|
|
|
|
|
|||||||||
| Change in Plan Assets: |
||||||||||||||||
| Fair value at beginning of year |
$ | 98,822 | $ | 12,172 | $ | 144,331 | $ | 139,064 | ||||||||
| Actual return on plan assets |
10,776 | 2,270 | 41,160 | (877 | ) | |||||||||||
| Employer and participant contributions |
721 | 721 | 4,938 | 4,788 | ||||||||||||
| Acquisition / transfers |
— | 84,981 | — | 1,203 | ||||||||||||
| Settlements / curtailments |
— | — | (204 | ) | (263 | ) | ||||||||||
| Benefit payments |
(6,261 | ) | (1,322 | ) | (4,959 | ) | (4,618 | ) | ||||||||
| Currency translation |
— | — | (21,103 | ) | 5,034 | |||||||||||
|
|
|
|
|
|
|
|
|
|||||||||
| Fair value at end of year |
$ | 104,058 | $ | 98,822 | $ | 164,163 | $ | 144,331 | ||||||||
|
|
|
|
|
|
|
|
|
|||||||||
| Funded (unfunded) status |
$ | (10,968 | ) | $ | 502 | $ | 1,013 | $ | 6,027 | |||||||
|
|
|
|
|
|
|
|
|
|||||||||
F-36
Table of Contents
| U.S. Pension Plans | Non-U.S. Pension Plans | |||||||||||||||
| In thousands |
Fiscal Year Ended December 31, 2014 |
Fiscal Year Ended December 28, 2013 |
Fiscal Year Ended December 31, 2014 |
Fiscal Year Ended December 28, 2013 |
||||||||||||
| Amounts included in the balance sheet: |
||||||||||||||||
| Current assets |
$ | — | $ | — | $ | — | $ | — | ||||||||
| Other noncurrent assets |
— | — | 10,018 | 12,133 | ||||||||||||
| Accounts payable and accrued liabilities |
— | — | (1,217 | ) | (346 | ) | ||||||||||
| Other noncurrent liabilities |
(10,968 | ) | 502 | (7,788 | ) | (5,760 | ) | |||||||||
|
|
|
|
|
|
|
|
|
|||||||||
| Net amount recognized |
$ | (10,968 | ) | $ | 502 | $ | 1,013 | $ | 6,027 | |||||||
|
|
|
|
|
|
|
|
|
|||||||||
| Weighted average assumptions used: |
||||||||||||||||
| Return on plan assets |
5.9 - 7.0 | % | 5.9 - 7.0 | % | 3.0 - 5.5 | % | 3.0 - 5.5 | % | ||||||||
| Discount rate |
3.7 - 4.0 | % | 4.6 | % | 1.7 - 8.0 | % | 3.4 - 8.0 | % | ||||||||
| Salary and wage escalation rate |
N/A | N/A | 2.0 - 4.5 | % | 2.8 - 4.5 | % | ||||||||||
The Company has plans whose fair value of plan assets exceeds the benefit obligation. In addition, the Company also has plans whose benefit obligation exceeds the fair value of plan assets. The total amount of prepaid benefit cost included in the net prepaid (accrued) benefit cost recognized for all pension plans approximates $(10.0) million and $6.5 million at December 31, 2014 and December 28, 2013, respectively. The accumulated benefit obligation was $275.0 million and $232.2 million at December 31, 2014 and December 28, 2013, respectively.
The following table summarizes the pretax amounts recorded in Accumulated other comprehensive income (loss) for the Company’s pension plans as of December 31, 2014 and December 28, 2013:
| U.S. Pension Plans | Non-U.S. Pension Plans | |||||||||||||||
| In thousands |
December 31, 2014 |
December 28, 2013 |
December 31, 2014 |
December 28, 2013 |
||||||||||||
| Transition net asset |
$ | — | $ | — | $ | — | $ | — | ||||||||
| Net actuarial (gain) loss |
14,454 | 1,174 | 15,932 | 12,583 | ||||||||||||
| Prior service cost |
— | — | (525 | ) | — | |||||||||||
|
|
|
|
|
|
|
|
|
|||||||||
| Net amounts recognized |
$ | 14,454 | $ | 1,174 | $ | 15,407 | $ | 12,583 | ||||||||
|
|
|
|
|
|
|
|
|
|||||||||
F-37
Table of Contents
The components of the Company’s pension related costs for the following periods are as follows:
| U.S. Pension Plans | Non-U.S. Pension Plans | |||||||||||||||||||||||
| In thousands, except percentage data |
Fiscal Year Ended December 31, 2014 |
Fiscal Year Ended December 28, 2013 |
Fiscal Year Ended December 29, 2012 |
Fiscal Year Ended December 31, 2014 |
Fiscal Year Ended December 28, 2013 |
Fiscal Year Ended December 29, 2012 |
||||||||||||||||||
| Pension Benefit Plans |
||||||||||||||||||||||||
| Components of net periodic benefit cost: |
||||||||||||||||||||||||
| Service cost |
$ | 322 | $ | 4 | $ | — | $ | 2,995 | $ | 3,398 | $ | 2,002 | ||||||||||||
| Interest cost |
4,416 | 1,067 | 620 | 5,356 | 4,980 | 5,032 | ||||||||||||||||||
| Return on plan assets |
(5,829 | ) | (1,679 | ) | (899 | ) | (6,487 | ) | (6,574 | ) | (5,462 | ) | ||||||||||||
| Curtailment / settlement (gain) loss |
— | — | — | 61 | — | 792 | ||||||||||||||||||
| Net amortization of: |
||||||||||||||||||||||||
| Transition costs and other |
3 | 253 | 181 | 1 | 95 | (238 | ) | |||||||||||||||||
|
|
|
|
|
|
|
|
|
|
|
|
|
|||||||||||||
| Net periodic benefit cost |
$ | (1,088 | ) | $ | (355 | ) | $ | (98 | ) | $ | 1,926 | $ | 1,899 | $ | 2,126 | |||||||||
|
|
|
|
|
|
|
|
|
|
|
|
|
|||||||||||||
| Weighted average assumptions used: |
||||||||||||||||||||||||
| Return on plan assets |
5.9 - 7.0 | % | 5.9 - 7.0 | % | 8.0 | % | 3.0 - 5.5 | % | 3.0 - 5.5 | % | 1.5 - 6.0 | % | ||||||||||||
| Discount rate |
4.6 | % | 4.6 | % | 3.8 | % | 3.2 - 8.0 | % | 3.4 - 8.0 | % | 3.7 - 7.0 | % | ||||||||||||
| Salary and wage escalation rate |
N/A | N/A | N/A | 1.0 - 4.5 | % | 2.8 - 4.5 | % | 2.0 - 4.5 | % | |||||||||||||||
During the fourth quarter of 2012, the Company completed the liquidation of two pension plans related to its former Dominion Textile, Inc. business in Canada. All pension benefits legally owed to plan participants were fully paid from plan assets by the end 2012. Excess plan assets left in the trust after all participants were paid was $0.3 million and is reported within Other current assets in the Company’s Consolidated Balance Sheet at December 29, 2012. The surplus was received by the Company in the first quarter of 2013. As a result of the liquidation of these plans, the Company recognized a settlement loss of $0.8 million within Special charges, net in the Company’s Consolidated Statement of Operations during the fiscal year ended December 29, 2012.
The expected long-term rate of return on plan assets reflects the average rate of returns expected on the funds invested or to be invested in order to provide for the benefits included in the projected benefit obligation. The expected long-term rate of return on plan assets is based on what is achievable given the plan’s investment policy, the types of assets held and target asset allocations. The expected long-term rate of return is determined as of the measurement date. The Company reviews each plan and its historical returns and target asset allocations to determine the appropriate long-term rate of return on plan assets to be used. Discount rates are primarily based on the market yields of global bond indices for AA-rated corporate bonds, applied to a portfolio for which the term and currency correspond with the estimated term and currency of the obligation.
The Company’s practice is to fund amounts for its qualified pension plans at least sufficient to meet the minimum requirements set forth in applicable employee benefit laws and local tax laws. In addition, the Company manages these plans to ensure that all present and future benefit obligations are met as they come due. During 2015, employer contributions are expected to approximate $3.7 million. As well, the Company expects to recognize amortization of actuarial gains/losses as components of net periodic benefit cost of $0.4 million.
Investment decisions
The Company’s overall investment strategy for pension plan assets is to achieve a blend of approximately 80 percent of investments for long-term growth and 20 percent for near-term benefit payments with a wide diversification of asset types, fund strategies and fund managers. In the U.S., the target allocations for plan assets
F-38
Table of Contents
are 40-55 percent in equity securities, 40-55 percent in corporate bonds and U.S. Treasury securities and the remainder in cash, cash equivalents or other types of investments. Equity securities primarily include investments in large-cap, mid-cap and small-cap companies principally located in the U.S. Fixed income securities include corporate bonds of companies of diversified industries and U.S. Treasuries.
The plans’ weighted-average asset allocations by asset category are as follows:
| December 31, 2014 |
December 28, 2013 |
|||||||
| Cash |
6 | % | 12 | % | ||||
| Equity Securities |
27 | % | 30 | % | ||||
| Fixed Income Securities |
67 | % | 58 | % | ||||
|
|
|
|
|
|||||
| Total |
100 | % | 100 | % | ||||
|
|
|
|
|
|||||
The trust funds are sufficiently diversified to maintain a reasonable level of risk without imprudently sacrificing return. The investment managers select investment fund managers with demonstrated experience and expertise, and funds with demonstrated historical performance, for the implementation of the plans’ investment strategy. The investment managers will consider both actively and passively managed investment strategies and will allocate funds across the asset classes to develop an efficient investment structure. It is the responsibility of the trustee to administer the investments of the trust within reasonable costs. These costs include, but are not limited to, management and custodial fees, consulting fees, transaction costs and other administrative costs chargeable to the Trust.
The fair value of the Company’s pension plan assets at December 31, 2014 by asset category is as follows:
| In thousands |
Total | Level 1 | Level 2 | Level 3 | ||||||||||||
| Cash |
$ | 3,904 | $ | 1,979 | $ | 1,925 | $ | — | ||||||||
| Equity securities: |
||||||||||||||||
| U.S. equities(a) |
17,191 | 11,269 | 5,922 | — | ||||||||||||
| Foreign equities(b) |
12,190 | 5,413 | 6,777 | — | ||||||||||||
| Global equity funds(c) |
42,829 | 13,017 | 29,812 | — | ||||||||||||
| Emerging markets(d) |
749 | 749 | — | — | ||||||||||||
|
|
|
|
|
|
|
|
|
|||||||||
| Total equity securities |
72,959 | 30,448 | 42,511 | — | ||||||||||||
|
|
|
|
|
|
|
|
|
|||||||||
| Fixed income securities: |
||||||||||||||||
| U.S. fixed income funds(e) |
68,036 | 1,939 | 66,097 | — | ||||||||||||
| Foreign fixed income funds(f) |
120,299 | — | 120,299 | — | ||||||||||||
|
|
|
|
|
|
|
|
|
|||||||||
| Total fixed income securities |
188,335 | 1,939 | 186,396 | — | ||||||||||||
|
|
|
|
|
|
|
|
|
|||||||||
| Insurance funds |
3,023 | — | — | 3,023 | ||||||||||||
|
|
|
|
|
|
|
|
|
|||||||||
| Total |
$ | 268,221 | $ | 34,366 | $ | 230,832 | $ | 3,023 | ||||||||
|
|
|
|
|
|
|
|
|
|||||||||
| (a) | This category consists of commingled and registered mutual funds that focus on equity securities of U.S companies. It includes both indexed and actively managed funds. |
| (b) | This category consists of commingled and registered mutual funds that focus on equity securities of companies outside of the U.S. It includes both indexed and actively managed funds. |
| (c) | This category consists of commingled and registered mutual funds that invest in equity securities of both U.S. and foreign companies. It includes actively managed funds |
| (d) | This category consists of commingled and registered mutual funds that invest in equity securities of companies in emerging market economies. It includes actively managed funds. |
| (e) | This category consists of actively managed funds that invest in investment-grade bonds of U.S. issuers from diverse industries and U.S. government bonds and treasury notes. |
F-39
Table of Contents
| (f) | This category consists of funds that invest in investment-grade bonds of foreign companies and Euro region government bonds. |
The fair value of the Company’s pension plan assets at December 28, 2013 by asset category is as follows:
| In thousands |
Total | Level 1 | Level 2 | Level 3 | ||||||||||||
| Cash |
$ | 28,671 | $ | 27,803 | $ | 868 | $ | — | ||||||||
| Equity securities: |
||||||||||||||||
| U.S. equities(a) |
16,566 | 11,023 | 5,543 | — | ||||||||||||
| Foreign equities(b) |
16,233 | 4,993 | 11,240 | — | ||||||||||||
| Global equity funds(c) |
37,697 | 13,489 | 24,208 | — | ||||||||||||
| Emerging markets(d) |
2,423 | 1,083 | 1,340 | — | ||||||||||||
|
|
|
|
|
|
|
|
|
|||||||||
| Total equity securities |
72,919 | 30,588 | 42,331 | — | ||||||||||||
|
|
|
|
|
|
|
|
|
|||||||||
| Fixed income securities: |
||||||||||||||||
| U.S. fixed income funds(e) |
43,069 | 11,030 | 27,332 | 4,707 | ||||||||||||
| Foreign fixed income funds(f) |
97,264 | — | 97,264 | — | ||||||||||||
|
|
|
|
|
|
|
|
|
|||||||||
| Total fixed income securities |
140,333 | 11,030 | 124,596 | 4,707 | ||||||||||||
|
|
|
|
|
|
|
|
|
|||||||||
| Insurance funds |
1,230 | $ | — | $ | — | $ | 1,230 | |||||||||
|
|
|
|
|
|
|
|
|
|||||||||
| Total |
$ | 243,153 | $ | 69,421 | $ | 167,795 | $ | 5,937 | ||||||||
|
|
|
|
|
|
|
|
|
|||||||||
| (a) | This category consists of commingled and registered mutual funds that focus on equity securities of U.S companies. It includes both indexed and actively managed funds. |
| (b) | This category consists of commingled and registered mutual funds that focus on equity securities of companies outside of the U.S. It includes both indexed and actively managed funds. |
| (c) | This category consists of commingled and registered mutual funds that invest in equity securities of both U.S. and foreign companies. It includes actively managed funds. |
| (d) | This category consists of commingled and registered mutual funds that invest in equity securities of companies in emerging market economies. It includes actively managed funds. |
| (e) | This category consists of actively managed funds that invest in investment-grade bonds of U.S. issuers from diverse industries and U.S. government bonds and treasury notes. |
| (f) | This category consists of funds that invest in investment-grade bonds of foreign companies and Euro region government bonds. |
Postretirement Plans
The Company sponsors several Non-U.S. postretirement plans that provide healthcare benefits to cover certain eligible employees. These plans have no plan assets, but instead are funded by the Company on a pay-as-you-go basis in the form of direct benefit payments.
F-40
Table of Contents
The following table details information regarding the Company’s postretirement plans:
| In thousands |
U.S. Postretirement Plans | Non-U.S. Postretirement Plans | ||||||||||||||
| Fiscal Year Ended December 31, 2014 |
Fiscal Year Ended December 28, 2013 |
Fiscal Year Ended December 31, 2014 |
Fiscal Year Ended December 28, 2013 |
|||||||||||||
| Postretirement Benefit Plans |
||||||||||||||||
| Change in Projected Benefit Obligation: |
||||||||||||||||
| Benefit obligation at beginning of year |
$ | (2,034 | ) | $ | — | $ | (5,511 | ) | $ | (4,864 | ) | |||||
| Additional benefit obligations |
— | — | — | — | ||||||||||||
| Service costs |
— | — | (7 | ) | (59 | ) | ||||||||||
| Interest costs |
(89 | ) | (11 | ) | (146 | ) | (187 | ) | ||||||||
| Acquisition / transfers |
— | (2,030 | ) | 1,834 | (1,419 | ) | ||||||||||
| Actuarial gain / (loss) |
17 | 7 | (237 | ) | 305 | |||||||||||
| Settlements / curtailments |
— | — | — | 182 | ||||||||||||
| Benefit payments |
25 | — | 314 | 381 | ||||||||||||
| Currency translation |
— | — | 321 | 150 | ||||||||||||
|
|
|
|
|
|
|
|
|
|||||||||
| Benefit obligation at end of year |
$ | (2,081 | ) | $ | (2,034 | ) | $ | (3,432 | ) | $ | (5,511 | ) | ||||
|
|
|
|
|
|
|
|
|
|||||||||
| Change in Plan Assets: |
||||||||||||||||
| Fair value at beginning of year |
$ | — | $ | — | $ | — | $ | — | ||||||||
| Actual return on plan assets |
— | — | — | — | ||||||||||||
| Employer and participant contributions |
25 | — | 314 | 381 | ||||||||||||
| Benefit payments |
(25 | ) | — | (314 | ) | (381 | ) | |||||||||
| Currency translation |
— | — | — | — | ||||||||||||
|
|
|
|
|
|
|
|
|
|||||||||
| Fair value at end of year |
$ | — | $ | — | $ | — | $ | — | ||||||||
|
|
|
|
|
|
|
|
|
|||||||||
| Funded status |
$ | (2,081 | ) | $ | (2,034 | ) | $ | (3,432 | ) | $ | (5,511 | ) | ||||
|
|
|
|
|
|
|
|
|
|||||||||
| Amounts included in the balance sheet: |
||||||||||||||||
| Other noncurrent assets |
$ | — | $ | — | $ | — | $ | — | ||||||||
| Accounts payable and accrued liabilities |
(97 | ) | (119 | ) | (297 | ) | (492 | ) | ||||||||
| Other noncurrent liabilities |
(1,984 | ) | (1,915 | ) | (3,135 | ) | (5,019 | ) | ||||||||
|
|
|
|
|
|
|
|
|
|||||||||
| Net amount recognized |
$ | (2,081 | ) | $ | (2,034 | ) | $ | (3,432 | ) | $ | (5,511 | ) | ||||
|
|
|
|
|
|
|
|
|
|||||||||
| Weighted average assumptions used: |
||||||||||||||||
| Return on plan assets |
N/A | N/A | N/A | N/A | ||||||||||||
| Discount rate |
3.7 | % | 4.6 | % | 3.2 - 3.7 | % | 4.1 - 4.8 | % | ||||||||
| Salary and wage escalation rate |
N/A | N/A | 2.5 | % | 3.0 | % | ||||||||||
The following table summarizes the pretax amounts recorded in Accumulated other comprehensive income (loss) for the Company’s postretirement benefit plans as of December 31, 2014 and December 28, 2013:
| In thousands |
U.S. Postretirement Plans | Non-U.S. Postretirement Plans | ||||||||||||||
| December 31, 2014 |
December 28, 2013 |
December 31, 2014 |
December 28, 2013 |
|||||||||||||
| Transition net asset |
$ | — | $ | — | $ | — | $ | — | ||||||||
| Net actuarial (gain) loss |
(23 | ) | (7 | ) | 122 | (12 | ) | |||||||||
| Prior service cost |
— | — | — | — | ||||||||||||
|
|
|
|
|
|
|
|
|
|||||||||
| Net amounts recognized |
$ | (23 | ) | $ | (7 | ) | $ | 122 | $ | (12 | ) | |||||
|
|
|
|
|
|
|
|
|
|||||||||
F-41
Table of Contents
The components of the Company’s postretirement related costs for the following periods are as follows:
| U.S. Postretirement Plans | Non-U.S. Postretirement Plans | |||||||||||||||||||||||
| In thousands, except percentage data |
Fiscal Year Ended December 31, 2014 |
Fiscal Year Ended December 28, 2013 |
Fiscal Year Ended December 29, 2012 |
Fiscal Year Ended December 31, 2014 |
Fiscal Year Ended December 28, 2013 |
Fiscal Year Ended December 29, 2012 |
||||||||||||||||||
| Postretirement Benefit Plans |
||||||||||||||||||||||||
| Components of net periodic benefit cost: |
||||||||||||||||||||||||
| Service cost |
$ | — | $ | — | $ | — | $ | 7 | $ | 59 | $ | 69 | ||||||||||||
| Interest cost |
89 | 11 | — | 146 | 187 | 218 | ||||||||||||||||||
| Curtailment / settlement (gain) loss |
— | — | — | — | 114 | 186 | ||||||||||||||||||
| Net amortization of: |
||||||||||||||||||||||||
| Transition costs and other |
— | — | — | — | 35 | 26 | ||||||||||||||||||
|
|
|
|
|
|
|
|
|
|
|
|
|
|||||||||||||
| Net periodic benefit cost |
$ | 89 | $ | 11 | $ | — | $ | 153 | $ | 395 | $ | 499 | ||||||||||||
|
|
|
|
|
|
|
|
|
|
|
|
|
|||||||||||||
| Weighted average assumptions used: |
||||||||||||||||||||||||
| Discount rate |
4.6 | % | 4.6 | % | N/A | 4.1 - 4.8 | % | 4.1 - 4.8 | % | 3.5 - 7.0 | % | |||||||||||||
| Salary and wage escalation rate |
N/A | N/A | N/A | 3.0 | % | 3.0 | % | 3.0 - 4.5 | % | |||||||||||||||
Assumed health care cost trend rates
The health care cost trend rate assumptions for the Company provided health care benefits for retirees in Canada are reflected in the following table. The Company does not provide post-employment health care benefits for retirees in other countries.
| December 31, 2014 |
December 28, 2013 |
|||||||
| Weighted average health care cost trend rate assumed for next year |
6.22 | % | 6.44 | % | ||||
| Rate to which the cost trend is expected to decline (the ultimate trend rate) |
4.50 | % | 4.50 | % | ||||
| Year that the rate reached the ultimate trend rate |
2028 | 2028 | ||||||
A one-percentage point increase in the assumed health care cost trend rate would have increased aggregate service and interest cost in 2014 by less than $0.1 million and the accumulated postretirement benefit obligation as of December 31, 2014 by $0.1 million. A one-percentage point decrease in the assumed health care cost trend rate would have decreased aggregate service and interest cost in 2014 by less than $0.1 million and the accumulated postretirement benefit obligation as of December 31, 2014 by $0.1 million.
Expected Benefit Payments
The following table reflects the total benefits projected to be paid from the pension plans or from the Company’s general assets, under the current actuarial assumptions used for the calculation of the projected benefit obligations. Therefore, actual payments may differ from projected benefit payments. The expected level of payments to, or on the behalf of, participants is as follows:
| In thousands |
Pension | Postretirement | ||||||
| 2015 |
$ | 10,833 | $ | 393 | ||||
| 2016 |
10,526 | 385 | ||||||
| 2017 |
10,898 | 377 | ||||||
| 2018 |
11,316 | 370 | ||||||
| 2019 |
11,619 | 363 | ||||||
| 2020 to 2024 |
65,189 | 1,715 | ||||||
F-42
Table of Contents
Defined Contribution Plans
The Company sponsors several defined contribution plans through its domestic subsidiaries covering employees who meet certain service requirements. The Company makes contributions to the plans based upon a percentage of the employees’ contribution in the case of its 401(k) plans or upon a percentage of the employees’ salary or hourly wages in the case of its noncontributory money purchase plans. The cost of the plans was $4.2 million, $2.7 million and $2.5 million for fiscal 2014, 2013 and 2012, respectively.
Note 15. Equity Compensation Plans
The Company accounts for stock-based compensation plans in accordance with ASC 718, “Compensation—Stock Compensation” (“ASC 718”), which requires a fair-value based method for measuring the value of stock-based compensation. Fair value is measured once at the date of grant and is not adjusted for subsequent changes. The Company’s stock-based compensation plans have included a program for stock options and restricted stock units.
In January 2011, the Company adopted an Incentive Stock Plan (the “2011 Plan”), pursuant to which the Company will grant equity-based awards to selected employees and directors of the Company. The 2011 Plan, which included time-vesting, performance-vesting and exit-vesting options as well as restricted stock units, was amended to increase the number of shares of common stock of the Company available for grant from 22,289 to 32,622. At December 31, 2014, the indirect parent has 6,901 shares available for future incentive awards.
During 2013, the Company’s board of directors reviewed the historical and projected financial performance of the Company in regard to the satisfaction of the performance-vesting options and exit-vesting options. Under the then-current vesting conditions, a performance-vesting option vested if certain free cash flow targets were achieved in either a given fiscal year or based on cumulative targets over multiple fiscal years. No compensation expense had ever been recorded for these options. As none of these targets had been achieved since the date of grant, nor were expected to be satisfied in the next several years, the Company decided to commence an offer to all eligible option holders to modify the terms of all performance-vesting and exit-vesting options. All of the eligible option holders elected to participate. As a result, on August 30, 2013, the vesting terms for all performance-vesting options were modified to vest on terms similar to the existing exit-vesting options. In addition, the required annual rate of return for both the existing modified performance-vesting options and the exit-vesting options was reduced from 20% to 15%. Per ASC 718, the Company accounted for the modifications to the terms of the performance-vesting and exit-vesting options as Type IV modifications (i.e. improbable-to-improbable) with no modification charge recorded. If, at a future date, the Company determines it is probable the employees will vest in the modified awards, we will recognize compensation cost equal to the fair value of the award at the modification date.
On June 17, 2013, Veronica Hagen and the Company entered into a Retirement Agreement (the “Retirement Agreement”) whereby she retired from the position of President and Chief Executive Officer effective June 19, 2013 and retired from the Company on August 31, 2013. Per the terms of the Retirement Agreement, the Company modified her equity-based awards in that certain time-vesting and exit-vesting awards became fully vested, with all remaining awards forfeited. Per ASC 718, the change in vesting conditions of the time-vesting options was treated as a Type III modification (i.e. improbable-to-probable) whereby the original equity awards are considered forfeited and new, fully vested awards are granted. The true-up to compensation expense was recorded for these options at the date of the modification as no future service was required. The change in vesting conditions of the exit-based options was treated as a Type IV modification (improbable-to-improbable) with no modification charge recorded. On June 18, 2013, the Company announced the appointment of J. Joel Hackney Jr. as President and Chief Executive Officer, effective June 19, 2013. Per the terms of his employment agreement, Mr. Hackney received 9,000 equity-based awards, which included 3,000 restricted stock units.
Since the inception of the 2011 Plan, certain select employees that have been granted equity-based awards are no longer employed by the Company. In certain cases, the Board of Directors have agreed to modify the terms of option awards to provide that all unexercised time-vesting options that were vested upon their departure date will
F-43
Table of Contents
remain exercisable until the earlier of (1) the expiration date of the options or (2) such earlier date that the individual breaches any restrictive covenant. All other time-vesting and exit-vesting options that were not vested were immediately forfeited. Per ASC 718, the change in vesting conditions of the time-vesting options were treated as a Type III modification (i.e. improbable-to-probable) whereby the original equity awards are considered forfeited and new, fully vested awards are granted. At the respective modification date a true-up to compensation expense was recorded for the vested options. The change in vesting conditions of the exit-vesting options was treated as a Type IV modification (improbable-to-improbable) with no modification charge recorded.
Stock Options
Options granted under the 2011 Plan expire on the tenth anniversary date of the date of grant and vest based on the type of option granted. Time-vesting options vest based upon the passage of time in equal installments at the respective anniversaries of the date of grant. Modified performance-vesting options and exit-vesting options contain performance and market conditions and will vest on the date, if ever, when Blackstone receives cash proceeds from its investment in the Company aggregating in excess of 2.0 times Blackstone’s cumulative invested capital in the Company’s securities, and such cash proceeds result in an annual internal rate of return of at least 15% on its cumulative invested capital in the Company’s securities. All options are subject to continued employment with the Company.
Changes in options outstanding under the 2011 Plan are as follows:
| Number of Shares | Weighted Average Exercise Price |
Intrinsic Value | Weighted Average Remaining Contractual Life |
|||||||||||||
| Outstanding—December 31, 2011 |
16,857 | $ | — | |||||||||||||
| Granted |
4,582 | 1,000 | ||||||||||||||
| Canceled / Forfeited |
(979 | ) | 1,000 | |||||||||||||
| Exercised |
— | — | ||||||||||||||
|
|
|
|
|
|||||||||||||
| Outstanding—December 29, 2012 |
20,460 | 1,000 | ||||||||||||||
| Granted |
6,817 | 1,000 | ||||||||||||||
| Canceled / Forfeited |
(3,882 | ) | 1,000 | |||||||||||||
| Exercised |
— | — | ||||||||||||||
|
|
|
|
|
|||||||||||||
| Outstanding—December 28, 2013 |
23,395 | 1,000 | ||||||||||||||
| Granted |
3,761 | 1,000 | ||||||||||||||
| Canceled / Forfeited |
(4,435 | ) | 1,000 | |||||||||||||
| Exercised |
— | — | ||||||||||||||
|
|
|
|
|
|||||||||||||
| Outstanding—December 31, 2014 |
22,721 | $ | 1,000 | $ | — | 7.57 | ||||||||||
|
|
|
|
|
|
|
|
|
|||||||||
| Exercisable—December 31, 2014 |
4,416 | $ | 1,000 | $ | — | 6.75 | ||||||||||
|
|
|
|
|
|
|
|
|
|||||||||
The fair value of each time-vesting award is expensed on a straight-line basis over the requisite service period, which is generally the three or five year vesting period of the options. However, we do not consider vesting of the modified performance vesting and exit-vesting options to be probable, therefore no compensation expense has yet been recorded. Compensation expense would be recognized if, at a future date, we deem achievement of the performance target to be probable. As of December 31, 2014, unrecognized compensation expense related to non-vested time-vesting stock options granted under the 2011 Plan totaled $1.5 million.
F-44
Table of Contents
The weighted-average fair value of time-vesting stock options granted during fiscal 2014 and 2013 was $509.280 and $568.420, respectively, using the Black-Scholes option pricing model. The following weighted-average assumptions are as follows:
| Fiscal 2014 | Fiscal 2013 | |||||||
| Risk-free interest rate |
1.74 | % | 1.55 | % | ||||
| Dividend yield |
— | % | — | % | ||||
| Expected life |
5.8 years | 6.4 years | ||||||
| Volatility |
54.10 | % | 59.00 | % | ||||
As the Company does not have sufficient historical volatility data for its common stock, the stock price volatility utilized in the fair value calculation is based on the Company’s peer group in the industry in which it does business. The risk-free interest rate is based on the yield-curve of a zero-coupon U.S. Treasury bond on the date the award is granted with a maturity equal to the expected term of the award. Prior to 2013, the expected life was based on the vesting schedule of the options and their contractual life, taking into consideration the expected time in which the share price of the option would exceed the exercise price of the option. However, subsequent equity grants utilize the Simplified Method as allowed under SAB Topic 14 to derive the expected life assumption.
Restricted Stock Units
Restricted stock units represent a promise to deliver shares to the individual at a future date if certain vesting conditions are met. Under the 2011 Plan, restricted stock unit’s will become vested on the third anniversary of the date of grant and will be settled in shares of the Company. Dividend equivalent shares will accrue if dividends are paid on the Company’s common stock and will vest proportionately with the restricted stock unit’s to which they relate.
Changes in restricted stock units outstanding under the 2011 Plan are as follows:
| Number of Shares |
Grant Date Fair Value |
|||||||
| Outstanding—December 29, 2012 |
— | $ | — | |||||
| Granted |
3,000 | 1,000 | ||||||
| Canceled / Forfeited |
— | — | ||||||
| Exercised |
— | — | ||||||
|
|
|
|
|
|||||
| Outstanding—December 28, 2013 |
3,000 | $ | 1,000 | |||||
|
|
|
|
|
|||||
| Granted |
— | — | ||||||
| Canceled / Forfeited |
— | — | ||||||
| Exercised |
— | — | ||||||
|
|
|
|
|
|||||
| Outstanding—December 31, 2014 |
3,000 | $ | 1,000 | |||||
|
|
|
|
|
|||||
The fair value of each restricted stock unit is measured as the grant-date price of the common stock which is expensed on a straight-line basis over the three year vesting period. As of December 31, 2014, unrecognized compensation expense related to non-vested restricted stock units granted under the 2011 Plan totaled $1.5 million.
Call Option on Common Stock
Under the 2011 Plan, the Company set forth a management equity subscription agreement whereby certain selected employees of the Company were able to invest in shares of the Company’s common stock. The agreement contains an employer call option clause that states that the Company can repurchase the common stock from the
F-45
Table of Contents
employee prior to the third anniversary of the purchase date. This feature creates an in-substance service period because the employer can repurchase the shares at the original purchase price (or less) if the employee terminates within the specified time period. The employee does not partake in any of the risks or rewards of stock ownership until the end of the three year implied service period. As a result, the cash acquired by the Company for the common stock shares have been recorded as a liability, as they are subject to repayment upon employee termination and compensation cost will be recognized over the implied three-year requisite service period equal to the fair value of the call option. Upon the third anniversary of the purchase date of the common stock, the three-year requisite service period expired and all remaining amounts recorded as a liability were reclassified to equity.
Other Compensation Agreements
In contemplation of the Merger, the former Chief Executive Officer entered into an employment agreement which became effective as of the time of the Merger. The agreement provided that as long as Ms. Hagen was an employee in good standing on April 23, 2013, that she would be entitled to a one-time grant of shares in the Company having a value equal to $694,000 (the “Equity Award”). In accordance with the terms of her employment agreement, Ms. Hagen received the equity award of 694 shares of the Company’s common stock (less applicable withholding taxes) on the appropriate date. The Company recognized compensation expense on a straight-line basis over the requisite service period and has no further obligations under the agreement.
Compensation Expense
Stock-based compensation expense is included in Selling, general and administrative expenses in the Consolidated Statement of Operations. The amount of compensation expense recognized during the period is based on the portion of granted awards that are expected to vest. Ultimately, the total expense recognized of the vesting period will equal the fair value of the awards as of the grant date that actually vest. The following table summarizes the compensation expense recognized:
| In thousands |
Fiscal Year Ended December 31, 2014 |
Fiscal Year Ended December 28, 2013 |
Fiscal Year Ended December 29, 2012 |
|||||||||
| Stock options |
$ | 901 | $ | 950 | $ | 532 | ||||||
| Restricted stock units |
1,000 | 500 | — | |||||||||
| Employee call option |
30 | 2,443 | — | |||||||||
| Equity award |
— | 97 | 310 | |||||||||
|
|
|
|
|
|
|
|||||||
| Total |
$ | 1,931 | $ | 3,990 | $ | 842 | ||||||
|
|
|
|
|
|
|
|||||||
The Company recognizes stock-based compensation expense related to the 2011 Plan over the period of time in which an employee must provide service in exchange for an award (the requisite service period). For time-vesting options, the requisite service period is the vesting period of the particular options granted in which the full fair value of the award in recognized. For amended performance-vesting and exit-vesting options (which contain both a performance and market condition that affects the vesting date), the requisite service period is the date, if any, when Blackstone receives cash proceeds with respect to its investment in the Company’s equity securities that meets a specified financial yield. In accordance with ASC 718, the Company does not recognize any stock-based compensation expense related to the amended performance-vesting and exit-vesting options as it cannot conclude it is probable that a liquidity event will occur as such an event is outside the control of the Company. Accordingly, once the liquidity event becomes probable under ASC 718, the Company will recognize as expense the fair value of the exit awards (as determined on the grant date), and the fair value of the modified performance awards (as determined on the modification date – under a Type IV modification, the original vesting terms are no longer relevant).
F-46
Table of Contents
Note 16. Income Taxes
The provision for income taxes is computed based on the following components of income (loss) before income tax expense and discontinued operations:
| In thousands |
Fiscal Year Ended December 31, 2014 |
Fiscal Year Ended December 28, 2013 |
Fiscal Year Ended December 29, 2012 |
|||||||||
| Domestic |
$ | (109,702 | ) | $ | (64,320 | ) | $ | (44,664 | ) | |||
| Foreign |
(11,061 | ) | 3,329 | 26,281 | ||||||||
|
|
|
|
|
|
|
|||||||
| Total |
$ | (120,763 | ) | $ | (60,991 | ) | $ | (18,383 | ) | |||
|
|
|
|
|
|
|
|||||||
The components of income tax (provision) benefit for the respective periods are as follows:
| In thousands |
Fiscal Year Ended December 31, 2014 |
Fiscal Year Ended December 28, 2013 |
Fiscal Year Ended December 29, 2012 |
|||||||||
| Current: |
||||||||||||
| Federal and state |
$ | (1,603 | ) | $ | 3,947 | $ | 397 | |||||
| Foreign |
(11,028 | ) | (12,474 | ) | (9,175 | ) | ||||||
| Deferred: |
||||||||||||
| Federal and state |
(1,077 | ) | 36,689 | 90 | ||||||||
| Foreign |
15,231 | 7,862 | 1,033 | |||||||||
|
|
|
|
|
|
|
|||||||
| Income tax (provision) benefit |
$ | 1,523 | $ | 36,024 | $ | (7,655 | ) | |||||
|
|
|
|
|
|
|
|||||||
The income tax (provision) benefit differs from the amount of income taxes determined by applying the applicable U.S. federal statutory rate of 35% to pretax income as a result of the following differences:
| In thousands |
Fiscal Year Ended December 31, 2014 |
Fiscal Year Ended December 28, 2013 |
Fiscal Year Ended December 29, 2012 |
|||||||||
| Computed income tax (provision) benefit at statutory rate |
$ | 42,267 | $ | 21,347 | $ | 6,435 | ||||||
| State income taxes, net of U.S. federal tax benefit |
(2,250 | ) | (540 | ) | (5 | ) | ||||||
| Change in valuation allowance |
(36,760 | ) | 6,263 | (17,035 | ) | |||||||
| Local country withholding tax |
(3,527 | ) | (5,307 | ) | (800 | ) | ||||||
| Intra-period allocation rule exception |
— | 5,201 | — | |||||||||
| Foreign rate difference |
1,933 | 11,729 | 5,560 | |||||||||
| Uncertain tax positions |
2,552 | (3,989 | ) | (755 | ) | |||||||
| Foreign exchange |
(1,680 | ) | 1,226 | (953 | ) | |||||||
| Other |
(1,012 | ) | 94 | (102 | ) | |||||||
|
|
|
|
|
|
|
|||||||
| Income tax (provision) benefit |
$ | 1,523 | $ | 36,024 | $ | (7,655 | ) | |||||
|
|
|
|
|
|
|
|||||||
The Intra-period allocation rule exception line-item for fiscal 2013 relates to the realization of the tax benefit of the current-year ordinary loss in continuing operations when the tax benefit would not otherwise be recognized. As such, the Company recorded a tax benefit in continuing operations of $5.2 million during 2013 in accordance with the guidance in ASC 740-20-45-7 which provides an exception to the incremental approach to intra-period tax allocation and allows for all items (for example, extraordinary items, discontinued operations) to be considered in determining the amount of tax benefit that results from a loss from continuing operations and that shall be allocated to continuing operations. Accordingly, income from all components of the financial
F-47
Table of Contents
statements represent sources of income that enable realization of the tax benefit of the current-year ordinary loss in continuing operations when the tax benefit would not otherwise be benefited, such as when a valuation allowance exists.
In fiscal year 2013, the Company experienced losses from continuing operations in the United States and France where there was a full valuation allowance recorded against its net deferred tax assets. The Company considered income from categories other than continuing operations, such as Other comprehensive income (loss), when determining the amount of the $5.2 million tax benefit to allocate to continuing operations.
In the fourth quarter of 2013, Mexico passed and implemented tax reform. Among the many changes, the IETU tax regime was repealed. The PGI Mexico subsidiary was paying tax under the IETU tax regime and all deferred taxes were on the balance sheet using the attributes of the IETU tax regime. With the repeal, the PGI Mexico subsidiary had to remove all deferred tax items related to the IETU and replace them with the attributes consistent with the ISR, or income tax regime. The income statement impact on the tax expense related to this change was benefit of $4.1 million.
Deferred income taxes reflect the net tax effects of temporary differences between the carrying amounts of assets and liabilities for financial reporting purposes and the amounts used for income tax purposes, as well as net operating losses and other tax credit carryforwards.
Deferred income tax assets and liabilities consist of the following:
| In thousands |
December 31, 2014 |
December 28, 2013 |
||||||
| Deferred tax assets: |
||||||||
| Provision for bad debts |
$ | 2,247 | $ | 1,169 | ||||
| Inventory capitalization and allowances |
3,617 | 1,997 | ||||||
| Net operating loss and capital loss carryforwards |
284,050 | 220,890 | ||||||
| Tax credits |
9,834 | 5,748 | ||||||
| Employee compensation and benefits |
9,478 | 10,322 | ||||||
| Other, net |
49,035 | 14,456 | ||||||
|
|
|
|
|
|||||
| Total deferred tax assets |
358,261 | 254,582 | ||||||
| Valuation allowance |
(227,475 | ) | (193,442 | ) | ||||
|
|
|
|
|
|||||
| Net deferred tax assets |
$ | 130,786 | $ | 61,140 | ||||
|
|
|
|
|
|||||
| Deferred tax liabilities: |
||||||||
| Property, plant and equipment, net |
$ | (66,337 | ) | $ | (33,050 | ) | ||
| Intangibles |
(35,890 | ) | (38,761 | ) | ||||
| Undistributed earnings |
(17,504 | ) | (12,477 | ) | ||||
| Other, net |
(22,488 | ) | (6,530 | ) | ||||
|
|
|
|
|
|||||
| Total deferred tax liabilities |
(142,219 | ) | (90,818 | ) | ||||
|
|
|
|
|
|||||
| Net deferred tax liabilities |
$ | (11,433 | ) | $ | (29,678 | ) | ||
|
|
|
|
|
|||||
The Company records a deferred tax liability associated with the excess of book basis over tax basis in the shares of subsidiaries not considered indefinitely invested. At December 31, 2014, the Company has not provided deferred income taxes on approximately $7.4 million of unremitted earnings of its foreign subsidiaries where the earnings are considered indefinitely invested. If management decided to repatriate these earnings, they would become taxable and would incur approximately $0.7 million of tax. In the event of additional tax, unrecognized tax attributes may be available to reduce some portion of any U.S. income tax liability.
After Internal Revenue Code Section 382 (“Section 382”) limitations, the Company has $380.7 million of U.S. federal operating loss carryforwards that expire between 2024 and 2033. In addition, the Company has
F-48
Table of Contents
$657.6 million of aggregated state operating loss carryforwards that expire over various time periods, and has $426.5 million of foreign operating loss carryforwards, of which $252.1 million have an unlimited carryforward life and $142.9 million expire between 2015 and 2023. The remaining $31.5 million of foreign operating loss carryforwards expire between 2015 and 2034. The Company has potential tax benefits of $2.0 million of tax credit carryforwards on foreign jurisdictions, all of which expire between 2015 and 2023. The Company has $1.5 million of AMT credit with an unlimited carryforward life.
A valuation allowance is recorded when, based on the weight of the evidence, it is more likely than not that some portion, or all, of the deferred tax asset will not be realized. In assessing the likelihood that a deferred tax asset will be realized, management considers, among other factors, the trend of historical and projected future taxable income, the scheduled reversal of deferred tax liabilities, the carryforward period for net operating losses and credits as well as tax planning strategies available to the Company. After consideration of all available evidence both positive and negative, the Company has determined that valuation allowances of $227.5 million and $193.4 million are appropriate as of December 31, 2014 and December 28, 2013, respectively.
A reconciliation of the beginning and ending amount of unrecognized tax benefits, included in Other noncurrent liabilities in the accompanying Consolidated Balance Sheet, excluding potential interest and penalties associated with uncertain tax positions, is as follows:
| In thousands |
Fiscal Year Ended December 31, 2014 |
Fiscal Year Ended December 28, 2013 |
Fiscal Year Ended December 29, 2012 |
|||||||||
| Unrecognized tax benefits at beginning of period |
$ | 16,392 | $ | 12,794 | $ | 12,892 | ||||||
| Gross increases for tax positions of prior years |
— | — | — | |||||||||
| Gross decreases for tax positions of prior years |
(2,658 | ) | (260 | ) | (127 | ) | ||||||
| Increases in tax positions for the current year |
1,585 | 1,753 | 2,085 | |||||||||
| Lapse of statute of limitations |
(1,461 | ) | (1,873 | ) | (1,810 | ) | ||||||
| Purchase accounting adjustment |
— | 4,705 | — | |||||||||
| Currency translation |
(888 | ) | (727 | ) | (246 | ) | ||||||
|
|
|
|
|
|
|
|||||||
| Unrecognized tax benefits at end of period |
$ | 12,970 | $ | 16,392 | $ | 12,794 | ||||||
|
|
|
|
|
|
|
|||||||
The total amount of unrecognized tax benefits (the “UTBs”) as of December 31, 2014 and December 28, 2013 were $20.3 million and $24.0 million, respectively. These amounts include accrued interest and penalties of $9.1 million and $9.3 million at December 31, 2014 and December 28, 2013, respectively. Included in the UTBs as of December 31, 2014 is $1.8 million of operating loss carryforwards for which a UTB has been established. Further, the UTBs of $20.3 million represent the amount that, if recognized, would affect the effective tax rate of the Company in future periods. Included in the balance as of December 31, 2014 was $1.1 million related to tax positions for which it is reasonably possible that the total amounts could significantly change during the next twelve months. This amount represents a decrease in UTBs comprised of items related to lapse of statute of limitations or settlement of issues. The Company continues to recognize interest and/or penalties related to income taxes as a component of income tax expense.
During 2013, Mexico initiated a tax amnesty program that provided for the reduction or elimination of all related penalties and interest if a Company participated in the tax amnesty program. The pardon granted under the amnesty program applied to tax assessments determined by the tax authorities, as well as to tax deficiencies determined by taxpayers themselves, either before or after they came to the tax authorities’ attention. In May 2013, the Company exercised its right under the amnesty program since there was a tax issue pending resolution which was being reviewed by the tax courts related to the country’s Asset Tax. The company won a ruling in a lower tax court related to the Asset Tax and believed it was more-likely-than-not that the Company would prevail if contested further by the Mexican government. As such, the Company did not record a reserve under the ASC 740-10-25 rules as the Company believed there was no tax liability. However, given the complexity of the issue
F-49
Table of Contents
and to mitigate any possibility of a tax assessment made by a future court ruling, the Company paid $2.9 million in settlement of the contested Asset Tax position which was then recorded a discrete tax expense during the second quarter of 2013.
During 2012, the Company completed a sale of leased equipment between its’ Netherlands and Colombia subsidiaries. At December 29, 2012, the capitalized assets have a book value of $20.7 million, which will be depreciated over the remaining useful life of the equipment. The Company recognized no gain or loss on this intercompany transaction. However, due to different tax rates in each jurisdiction, the transaction resulted in a deferred tax expense of $0.1 million at December 28, 2013 and a deferred tax benefit of $1.2 million at December 29, 2012 which the Company recorded within Additional paid-in-capital during 2012. The equity adjustment will be recognized in earnings over the remaining useful life of the equipment.
Management judgment is required in determining tax provisions and evaluating tax positions. Although management believes its tax positions and related provisions reflected in the consolidated financial statements are fully supportable, it recognizes that these tax positions and related provisions may be challenged by various tax authorities. These tax positions and related provisions are reviewed on an ongoing basis and are adjusted as additional facts and information become available, including progress on tax audits, changes in interpretations of tax laws, developments in case law and closing of statute of limitations. The Company’s tax provision includes the impact of recording reserves and any changes thereto. As of December 31, 2014, the Company has a number of open tax years with various taxing jurisdictions that range from 2003 to 2014. The results of current tax audits and reviews related to open tax years have not been finalized, and management believes that the ultimate outcomes of these audits and reviews will not have a material adverse effect on the Company’s financial position, results of operations or cash flows.
The major jurisdictions where the Company files income tax returns include the United States, Canada, China, India, the Netherlands, France, Germany, Spain, United Kingdom, Italy, Mexico, Colombia, and Argentina. The U.S. federal tax returns have been examined through fiscal 2004 and the various taxing jurisdictions generally remain open and subject to examination by the relevant tax authorities for the tax years 2003 through 2014.
As a result of the acquisition of Fiberweb, the Company now has additional operations in the U.S. and France, and new operations in the United Kingdom, Germany, Italy and India. Based on the weight of the evidence, it is management’s opinion, it is more likely than not that some portion, or all, of the deferred tax assets associated with some of these entities will not be realized. Therefore, the net deferred tax asset associated with the United Kingdom, Germany and Italy were fully valued as of the opening balance sheet date.
At the Fiberweb acquisition date, Fiberweb entities in the U.S. carried a deferred tax liability of $36.7 million that could be used as a source of income against the Company’s U.S. deferred tax assets. Legacy PGI entities in the U.S. had net operating loss carryforwards in excess of $300.0 million for which they carried a full valuation allowance. Shortly after the completion of the Fiberweb Acquisition, the Company elected to disregard the U.S. Fiberweb parent entities in the United Kingdom. The Fiberweb entities in the U.S. were then treated as directly owned by the Company for tax purposes and included in the Company’s U.S. consolidated federal tax return. Making this election provided a source of income for realization of the Company’s deferred tax asset resulting in a $36.7 million reduction of our valuation allowance. While this adjustment to the Company U.S. valuation allowance was a result of the Fiberweb Acquisition, ASC 805 indicates this benefit should not be included as a component of acquisition accounting. Accordingly, the Company recorded the release of the valuation allowance as a tax benefit in 2013.
As a result of the acquisition of Providência, the Company now has additional operations in the U.S. and new operations in Brazil. Based on the weight of the evidence, it is management’s opinion, it is more likely than not that some portion, or all, of the deferred tax assets associated with some of these entities will be realized. The Providência U.S. operations are owned directly by Providência. As a result of this ownership structure, the Providência U.S. operations are not included as part of the PGI U.S. Consolidated filing group.
F-50
Table of Contents
In connection with the acquisition of Providência, the Company is party to the Providência Tax Claims. The Providência Tax Claims relate to two tax deficiency notices received in August and November 2013 relating to Providência’s 2007 and 2008 tax filings. At the Providência Acquisition Date and at each subsequent reporting period, the Company evaluated whether the Providência Tax Claims qualified for recognition and the Company determined it was more likely than not that Providência’s position would be sustained upon challenge by the Brazilian courts. This determination was based on advice received from the Company’s Brazilian legal counsel. Therefore, the Company did not record an uncertain tax position liability for this matter.
As discussed in Note 4, “Acquisitions”, the Deferred Purchase Price is held by the Company. Upon resolution of the Providência Tax Claims by the Brazilian court, either tax payments for the Providência Tax Claims will be made to the Brazilian tax authorities or the Deferred Purchase Price will be paid to the selling shareholders. The Company will be responsible for any actual tax payment to settle the Providência Tax Claims in excess of the Deferred Purchase Price. Based on the Company’s best estimate, the resolution of the Providência Tax Claims is expected to take longer than a year.
Note 17. Redeemable Noncontrolling Interest
In connection with the Providência Acquisition, as required by Brazilian law, PGI Acquisition Company filed the Mandatory Tender Offer registration request with the CVM in order to launch, after its approval, a tender offer to acquire all of the remaining outstanding capital stock of Providência from the minority shareholders. As of December 31, 2014, the Mandatory Tender Offer was still under review by the CVM. Hence, the conditions for the launch of the Mandatory Tender Offer have not been met as of December 31, 2014. However, once the Mandatory Tender Offer is approved and launched, the minority shareholders will have the right, but not the obligation, to sell their remaining outstanding capital stock of Providência. Given such right of the minority shareholders, the Company determined that ASC 480 requires the noncontrolling interest to be presented as mezzanine equity on the Consolidated Balance Sheets and adjusted to its estimated maximum redemption amount at each balance sheet date.
Financial results of Providência are attributed to the minority shareholders based on their ownership percentage and accordingly disclosed in the Consolidated Statements of Operations. Subsequent to the allocation of earnings, the carrying value is then adjusted to its redemption value as of each balance sheet date with a corresponding adjustment to additional paid-in capital.
A reconciliation of the redeemable noncontrolling interest since the Providência Acquisition Date is as follows:
| In thousands |
2014 | |||
| Beginning Balance |
$ | 80,792 | ||
| Comprehensive income (loss) attributable to redeemable noncontrolling interest |
(13,020 | ) | ||
| Periodic adjustment to redemption value, net of currency adjustment |
21,409 | |||
|
|
|
|||
| Ending Balance |
$ | 89,181 | ||
|
|
|
|||
The estimated redemption value of the redeemable noncontrolling interest is determined based on the terms and conditions of the Mandatory Tender Offer, which state that the purchase price payable for the tendered shares is not impacted by the earnings attributable to the redeemable noncontrolling interest. As a result, earnings attributable to the redeemable noncontrolling interest are offset by a deemed dividend, as a periodic adjustment to the recorded redemption value, to the minority shareholders recognized in additional paid-in capital. In addition, the recorded redemption value accretes at a variable interest rate which is also recognized as a periodic adjustment to the redemption value. Lastly, the Mandatory Tender Offer is denominated in Brazilian reals. Therefore, the redemption value is recorded at the U.S. Dollar equivalent on the Consolidated Balance Sheets,
F-51
Table of Contents
initially using the exchange rate in effect on the date of issuance and translated using the current exchange rate at each subsequent balance sheet date. The respective currency exchange rate movement is recognized as a periodic adjustment to the recorded redemption value in additional paid-in capital.
Periodic adjustment to the redemption value is adjusted to net income (loss) attributable to PGI Specialty Materials, Inc. in calculating the Company’s basic and diluted earnings per share.
A reconciliation of basic and diluted loss per share attributable to PGI Specialty Materials, Inc. is as follows:
| in thousands, except for per share data |
December 31, 2014 |
December 28, 2013 |
||||||
| Net Income (loss) attributable to PGI Specialty Materials, Inc. |
$ | (115,297 | ) | $ | (24,933 | ) | ||
| Periodic adjustment to redemption value, net of currency adjustment |
(21,409 | ) | — | |||||
|
|
|
|
|
|||||
| Net income (loss) attributable to PGI Specialty Materials, Inc. after periodic adjustment to redemption value, net of currency adjustment |
$ | (136,706 | ) | $ | (24,933 | ) | ||
|
|
|
|
|
|||||
| Weighted average common shares outstanding, basic and diluted |
292,178 | 264,998 | ||||||
| Basic and diluted loss per share |
$ | (467.89 | ) | $ | (94.09 | ) | ||
|
|
|
|
|
|||||
Note 18. Equity
On January 28, 2011 in connection with the closing of the Merger, Blackstone, contributed $255 million and certain members of management at PGI contributed $4.9 million, for an aggregate contribution of $259.9 million (“The Initial Capital”). As consideration for the Initial Capital, the Company issued a total of 259,865 shares of common stock, with a par value of $0.01 per share.
Common Stock
The authorized share capital of the Company is $10,000 consisting of 1,000,000 shares, par value $0.01 per share. The Company did not pay any dividends during fiscal years 2014 or 2013 and intends to retain future earnings, if any, to finance the further expansion and continued growth of the business. In addition, the Company’s indebtedness obligations limit certain restricted payments, which include dividends payable in cash, unless certain conditions are met.
Additional Paid-in-Capital
The Initial Capital in connection with the closing of the merger is recorded in Additional paid-in capital. Amounts related to certain members of the Company’s management, have been reclassified to Other noncurrent liabilities as they contained a three-year call option feature which specifies that the employer can repurchase the shares at the original purchase price (or less) if the employee terminates within the specified time period. Upon the expiration of the three-year call option, associated amounts were no longer considered a liability and recorded in Additional paid-in capital. Subsequent to January 28, 2011, certain members of the Company’s management and certain board members purchased common stock of the Company. In addition, the Company has repurchased common stock from former employees. At December 31, 2014, the net amount purchased was $2.1 million and accordingly, the Company recorded the basis in these shares as additional paid-in capital or as a noncurrent liability, as necessary.
On December 18, 2013, the Company received an additional equity investment of $30.7 million from Blackstone (the “Equity Investment”). The Equity Investment, along with the proceeds received from the Term Loans, were used to repay all outstanding borrowings under the Senior Secured Bridge Credit Agreement and the Senior Unsecured Bridge Credit Agreement.
In connection with Providência Acquisition, the Company determined that the related noncontrolling interest is required to be presented as mezzanine equity on the Consolidated Balance Sheets and adjusted to its
F-52
Table of Contents
estimated maximum redemption amount at each balance sheet date. As a result, adjustments to the redeemable noncontrolling interest are offset by a deemed dividend to the minority shareholders recognized in Additional paid-in capital. Refer to Note 17, “Redeemable Noncontrolling Interest” for further information on the accounting of the redeemable noncontrolling interest.
Accumulated Other Comprehensive Income (Loss)
The changes in Accumulated other comprehensive income (loss) by component are as follows:
| In thousands |
Pension and Postretirement Benefit Plans |
Cumulative Translation Adjustments |
Total | |||||||||
| Balance—December 29, 2012 |
$ | (13,766 | ) | $ | (1,003 | ) | $ | (14,769 | ) | |||
| Other comprehensive income (loss) before reclassifications |
(2,519 | ) | 8,709 | 6,190 | ||||||||
| Amounts reclassified out of accumulated comprehensive income (loss) |
473 | — | 473 | |||||||||
|
|
|
|
|
|
|
|||||||
| Net current period other comprehensive income (loss) |
(2,046 | ) | 8,709 | 6,663 | ||||||||
|
|
|
|
|
|
|
|||||||
| Balance—December 28, 2013 |
(15,812 | ) | 7,706 | (8,106 | ) | |||||||
| Other comprehensive income (loss) before reclassifications |
(15,201 | ) | (35,911 | ) | (51,112 | ) | ||||||
| Amounts reclassified out of accumulated comprehensive income (loss) |
54 | — | 54 | |||||||||
|
|
|
|
|
|
|
|||||||
| Net current period other comprehensive income (loss) |
(15,147 | ) | (35,911 | ) | (51,058 | ) | ||||||
|
|
|
|
|
|
|
|||||||
| Balance—December 31, 2014 |
$ | (30,959 | ) | $ | (28,205 | ) | $ | (59,164 | ) | |||
|
|
|
|
|
|
|
|||||||
Amounts presented in Other comprehensive income (loss) before reclassifications are net of tax. For the fiscal year ended December 31, 2014, the Company recorded $0.1 million and $0.0 million of tax expense for pension and postretirement benefit plans and cumulative translation adjustments, respectively. For the fiscal year ended December 28, 2013, the Company recorded $1.3 million and $4.0 million of tax expense for pension and postretirement benefit plans and cumulative translation adjustments, respectively.
Amounts reclassified out of Accumulated other comprehensive income (loss) are as follows:
| In thousands |
Fiscal Year Ended December 31, 2014 |
Fiscal Year Ended December 28, 2013 |
||||||
| Pension and other postretirement benefit plans: |
||||||||
| Net amortization of actuarial gains (losses) |
$ | (4 | ) | $ | (383 | ) | ||
| Curtailment / settlement gain (loss) |
(61 | ) | (114 | ) | ||||
|
|
|
|
|
|||||
| Total reclassifications, before tax |
(65 | ) | (497 | ) | ||||
| Income tax (provision) benefit |
11 | 24 | ||||||
|
|
|
|
|
|||||
| Total reclassifications, net of tax |
$ | (54 | ) | $ | (473 | ) | ||
|
|
|
|
|
|||||
Amounts associated with pension and postretirement benefit plans reclassified from Accumulated other comprehensive income (loss) are recorded within Selling, general and administrative expenses on the Consolidated Statement of Operations. The components are included in the computation of net periodic benefit cost.
Note 19. Special Charges, Net
As part of the business strategy, the Company incurs amounts related to corporate-level decisions or actions by the Board of Directors. These actions are primarily associated with initiatives attributable to acquisition integration, restructuring and realignment of manufacturing operations and management structures as well as the
F-53
Table of Contents
pursuit of certain transaction opportunities when applicable. In addition, the Company evaluates its long-lived assets for impairment whenever events or changes in circumstances including the aforementioned, indicate that the carrying amounts may not be recoverable. These amounts are included in Special charges, net in the Consolidated Statement of Operations.
A summary of special charges for each respective period is as follows:
| In thousands |
Fiscal Year Ended December 31, 2014 |
Fiscal Year Ended December 28, 2013 |
Fiscal Year Ended December 29, 2012 |
|||||||||
| Restructuring and plant realignment costs |
$ | 9,713 | $ | 8,633 | $ | 15,074 | ||||||
| Acquisition—Blackstone |
— | 37 | 452 | |||||||||
| Acquisition and integration—Providência |
24,435 | — | — | |||||||||
| Acquisition and integration—Fiberweb |
14,643 | 18,306 | — | |||||||||
| Colombia flood |
— | — | 57 | |||||||||
| Goodwill impairment |
6,851 | — | — | |||||||||
| Asset impairment |
— | 2,259 | — | |||||||||
| Other charges |
3,543 | 3,953 | 4,009 | |||||||||
|
|
|
|
|
|
|
|||||||
| Total |
$ | 59,185 | $ | 33,188 | $ | 19,592 | ||||||
|
|
|
|
|
|
|
|||||||
Restructuring and Plant Realignment Costs
The Company incurs costs associated with restructuring initiatives intended to result in improved operating performance, profitability and working capital levels. Costs associated with these initiatives include reducing headcount, improving manufacturing productivity, realignment of management structures, reducing corporate costs and rationalizing certain assets, businesses and employee benefit programs. Costs incurred for the current period primarily relate to costs incurred to realize cost improvement initiatives associated with the acquisition and integration of Fiberweb. Amounts in the prior period primarily consist of plant realignment initiatives in the North America and Europe regions. In addition, the Company incurs costs associated with less significant ongoing restructuring initiatives resulting from the continuous evaluation of opportunities to optimize manufacturing facilities and manufacturing processes. Costs associated with these initiatives primarily relate to professional consulting fees.
During 2012, the Company initiated the internal redesign and restructuring of its global operations for the purposes of realigning and repositioning the Company to consolidate the benefits of its global footprint, align resources and capabilities with future growth opportunities and provide for a more efficient structure to serve existing markets. In addition, the Company launched an initiative to utilize a third-party service provider for its Information Systems support tactical functions, including: service desk; desktop/end-user computing; server administration; network services; data center operations; database and applications development; and maintenance. Cost incurred for the respective periods presented primarily consisted of employee separation and severance expenses.
Acquisition—Blackstone
As a result of the Merger on January 28, 2011, the Company incurred direct acquisition costs associated with the transaction including investment banking, legal, accounting and other fees for professional services. Other expenses included direct financing costs associated with the issuance of the Senior Secured Notes as well as the fee to enter into the ABL Facility, both of which have been capitalized as intangible assets on the Consolidated Balance Sheet as of the date of the Merger.
Acquisition and Integration—Providência
In association with the Providência Acquisition, the Company incurred direct acquisition costs associated with the transaction including investment banking, legal, accounting and other fees for professional services.
F-54
Table of Contents
Other expenses included direct financing costs associated with both the Senior Unsecured Notes and the Incremental Amendment to the Term Loans. These costs have been capitalized as intangible assets on the Consolidated Balance Sheet as of the date of the Providência Acquisition. However, a portion of these costs related to the Incremental Term loan were expensed as incurred.
Acquisition and Integration—Fiberweb
In association with the Fiberweb Acquisition, the Company incurred direct acquisition costs associated with the transaction including investment banking, legal, accounting and other fees for professional services. Other expenses included direct financing costs associated with both the Secured Bridge Facility and the Unsecured Bridge Facility, as well as with the Term Loans. These costs have been capitalized as intangible assets on the Consolidated Balance Sheet as of the date of the Fiberweb Acquisition. In addition, the Company has launched several initiatives during 2014 focused on the integration of Fiberweb into the existing operations and underlying processes of the Company. These initiatives include cost reduction initiatives and costs associated with integrating the back office activities of the combined business. As a result, the Company incurred costs directly associated with these activities which include legal, accounting and other fees for professional services.
Colombia Flood
In December 2010, a severe rainy season impacted many parts of Colombia and caused the Company to temporarily cease manufacturing at its Cali, Colombia facility due to a breach of a levy and flooding at the industrial park where its manufacturing facility is located. The Company established temporary offices away from the flooded area and worked with customers to meet their critical needs through the use of our global manufacturing base. The facility re-established manufacturing operations on April 4, 2011 and operations reached full run rates in third quarter of 2011. The costs related to restoration of the facility were net of insurance proceeds.
Goodwill Impairment
Goodwill is tested and reviewed annually for impairment during the fourth quarter or whenever there is a significant change in events or circumstances that indicate that the fair value of the asset may be less than the carrying amount of the asset. In light of the recent acquisition of Providência, the Company realigned its reportable segments during the third quarter of 2014 to reflect its new organizational structure and business focus. The Company reviewed the recoverability of goodwill at reporting units impacted by the reorganization and determined that amounts allocated to the Argentina/Colombia reporting unit were impaired. As a result, the Company recorded a non-cash impairment charge of $6.9 million.
Asset Impairment
The Company reviews long-lived assets for impairment whenever events or changes in circumstances indicate that the carrying value of an asset may not be recoverable. In the fourth quarter of 2013, the Company performed an impairment test on long-lived assets in Argentina. The Company determined the fair value of the long-lived assets to be $14.4 million. As a result, the Company recorded an non-cash impairment charge of $2.2 million to adjust the carrying value to its fair value.
Other Charges
Other charges consist primarily of expenses related to the Company’s pursuit of other business opportunities. The Company reviews its business operations on an ongoing basis in light of current and anticipated market conditions and other factors and, from time to time, may undertake certain actions in order to optimize overall business, performance or competitive position. To the extent any such decisions are made, the Company would likely incur costs associated with such actions, which could be material. Other charges also includes various corporate-level initiatives and the relocation of our Nanhai, China manufacturing facility.
F-55
Table of Contents
Restructuring Reserve
Amounts accrued for Restructuring and Plant Realignment costs are included in Accounts payable and accrued liabilities in the Consolidated Balance Sheets. Changes in the Company’s reserves for the respective periods presented are as follows:
| In thousands |
North America |
South America |
Europe | Asia | Corporate | Total | ||||||||||||||||||
| December 29, 2012 |
$ | 920 | $ | 848 | $ | 1,431 | $ | 639 | $ | 2,440 | $ | 6,278 | ||||||||||||
|
|
|
|
|
|
|
|
|
|
|
|
|
|||||||||||||
| Additions |
1,700 | 922 | 4,238 | 1 | 1,772 | 8,633 | ||||||||||||||||||
| Acquisitions |
92 | — | 1,789 | 129 | — | 2,010 | ||||||||||||||||||
| Cash payments |
(1,647 | ) | (868 | ) | (2,980 | ) | (505 | ) | (2,343 | ) | (8,343 | ) | ||||||||||||
| Translation and other |
— | (127 | ) | 9 | — | — | (118 | ) | ||||||||||||||||
|
|
|
|
|
|
|
|
|
|
|
|
|
|||||||||||||
| December 28, 2013 |
1,065 | 775 | 4,487 | 264 | 1,869 | 8,460 | ||||||||||||||||||
|
|
|
|
|
|
|
|
|
|
|
|
|
|||||||||||||
| Additions |
1,324 | 842 | 7,472 | (64 | ) | 139 | 9,713 | |||||||||||||||||
| Acquisitions |
— | — | — | — | — | — | ||||||||||||||||||
| Cash payments |
(2,304 | ) | (164 | ) | (8,807 | ) | (99 | ) | (1,828 | ) | (13,202 | ) | ||||||||||||
| Translation and other |
513 | (308 | ) | (1,434 | ) | (62 | ) | — | (1,291 | ) | ||||||||||||||
|
|
|
|
|
|
|
|
|
|
|
|
|
|||||||||||||
| December 31, 2014 |
$ | 598 | $ | 1,145 | $ | 1,718 | $ | 39 | $ | 180 | $ | 3,680 | ||||||||||||
|
|
|
|
|
|
|
|
|
|
|
|
|
|||||||||||||
The Company accounts for its restructuring programs in accordance with ASC 712, “Compensation—Non-retirement Postemployment Benefits” (“ASC 712”) and ASC 420, “Exit of Disposal Cost Obligations” (“ASC 420”). Costs incurred for the respective periods presented primarily consisted of employee separation and severance expenses. Programs in existence prior to the acquisition of Fiberweb are substantially complete as of the end of 2014. As a result of the acquisition of Fiberweb, the Company has initiated a restructuring program to integrate and optimize the combined footprint. Total Projected costs for these programs are expected to range between $16.0 million and $23.0 million with payments continuing into 2015. Cost incurred since the Fiberweb Acquisition Date totaled $12.8 million.
F-56
Table of Contents
A summary of special charges by reportable segment is as follows:
| In thousands |
Restructuring and Plant Realignment Costs |
Acquisition and Integration Costs |
Other Special Charges |
Total Special Charges, Net |
||||||||||||
| For the year ended December 31, 2014 |
||||||||||||||||
| North America |
$ | 1,324 | $ | 4,906 | $ | 881 | $ | 7,111 | ||||||||
| South America |
842 | 4,627 | 6,851 | 12,320 | ||||||||||||
| Europe |
7,472 | 3,999 | — | 11,471 | ||||||||||||
| Asia |
(64 | ) | — | 2,215 | 2,151 | |||||||||||
| Corporate |
139 | 25,546 | 447 | 26,132 | ||||||||||||
|
|
|
|
|
|
|
|
|
|||||||||
| Total |
$ | 9,713 | $ | 39,078 | $ | 10,394 | $ | 59,185 | ||||||||
|
|
|
|
|
|
|
|
|
|||||||||
| For the year ended December 28, 2013 |
||||||||||||||||
| North America |
$ | 1,700 | $ | 244 | $ | 139 | $ | 2,083 | ||||||||
| South America |
922 | 4 | 2,213 | 3,139 | ||||||||||||
| Europe |
4,238 | 1,275 | — | 5,513 | ||||||||||||
| Asia |
1 | — | 202 | 203 | ||||||||||||
| Corporate |
1,772 | 16,820 | 3,658 | 22,250 | ||||||||||||
|
|
|
|
|
|
|
|
|
|||||||||
| Total |
$ | 8,633 | $ | 18,343 | $ | 6,212 | $ | 33,188 | ||||||||
|
|
|
|
|
|
|
|
|
|||||||||
| For the year ended December 29, 2012 |
||||||||||||||||
| North America |
$ | 4,212 | $ | — | $ | — | $ | 4,212 | ||||||||
| South America |
1,721 | — | 65 | 1,786 | ||||||||||||
| Europe |
3,180 | — | — | 3,180 | ||||||||||||
| Asia |
829 | — | — | 829 | ||||||||||||
| Corporate |
5,132 | 452 | 4,001 | 9,585 | ||||||||||||
|
|
|
|
|
|
|
|
|
|||||||||
| Total |
$ | 15,074 | $ | 452 | $ | 4,066 | $ | 19,592 | ||||||||
|
|
|
|
|
|
|
|
|
|||||||||
Note 20. Other Operating, Net
Transactions that are denominated in a currency other than an entity’s functional currency are subject to changes in exchange rates with the resulting gains and losses recorded within current earnings. The Company includes these gains and losses related to receivables and payables as well as the impacts of other operating transactions as a component of Operating income (loss).
Amounts associated with these components for the respective periods are as follows:
| In thousands |
Fiscal Year Ended December 31, 2014 |
Fiscal Year Ended December 28, 2013 |
Fiscal Year Ended December 29, 2012 |
|||||||||
| Foreign currency gains (losses) |
$ | (5,448 | ) | $ | (2,838 | ) | $ | 151 | ||||
| Other operating income (expense) |
3,603 | 326 | 136 | |||||||||
|
|
|
|
|
|
|
|||||||
| Total |
$ | (1,845 | ) | $ | (2,512 | ) | $ | 287 | ||||
|
|
|
|
|
|
|
|||||||
F-57
Table of Contents
Note 21. Foreign Currency and Other, Net
Transactions that are denominated in a currency other than an entity’s functional currency are subject to changes in exchange rates with the resulting gains and losses recorded within current earnings. The Company includes these gains and losses related to intercompany loans and debt as well as other non-operating activities as a component of Other income (expense).
Amounts associated with these components for the respective periods are as follows:
| In thousands |
Fiscal Year Ended December 31, 2014 |
Fiscal Year Ended December 28, 2013 |
Fiscal Year Ended December 29, 2012 |
|||||||||
| Foreign currency gains (losses) |
$ | (35,558 | ) | $ | (6,689 | ) | $ | (3,433 | ) | |||
| Other non-operating income (expense) |
8,475 | (2,162 | ) | (1,701 | ) | |||||||
|
|
|
|
|
|
|
|||||||
| Total |
$ | (27,083 | ) | $ | (8,851 | ) | $ | (5,134 | ) | |||
|
|
|
|
|
|
|
|||||||
Amounts included within other non-operating income (expense) are primarily related to fees associated with our accounts receivable factoring agreements. Other items include gains or losses on the sale of assets and other non-operating transactions.
On January 27, 2014, the Company entered into a series of foreign exchange forward contracts with a third-party financial institution used to minimize foreign exchange risk on the future consideration to be paid for the Providência Acquisition and the Mandatory Tender Offer. The primary financial instrument was related to the Providência Acquisition and consisted of a foreign exchange forward contract with an aggregate notional amount equal to the estimated purchase price. On June 11, 2014, the Company settled the primary financial instrument which provided $18.9 million of income realized at the date of acquisition. As the nature of this transaction is related to a non-operating notional amount, changes in fair value are included in other non-operating income (expense).
The remaining financial instruments relate to a series of options that expire between 1 year and 5 years associated with the Mandatory Tender Offer and the deferred portion of the consideration to be paid for the Providência Acquisition. Since inception, the Company recognized a loss of $5.3 million associated with the changes in fair value of the options. As the nature of these transactions are related to a non-operating notional amount, changes in fair value are included in other non-operating income (expense).
Note 22. Commitments and Contingencies
The Company is involved from time to time in various litigations, claims and administrative proceedings arising out of the ordinary conduct of its business. Amounts recorded for identified contingent liabilities are estimates, which are reviewed periodically and adjusted to reflect additional information when it becomes available. Subject to the uncertainties inherent in estimating future costs for contingent liabilities, management believes that any liability which may result from these legal matters would not have a material adverse effect on the Company’s business or financial condition.
F-58
Table of Contents
Non-affiliate Leases
The Company leases certain manufacturing, warehousing and other facilities and equipment under operating leases. The leases on most of the properties contain renewal provisions. Future minimum rental payments required under non-affiliate operating leases that have initial or remaining non-cancelable lease terms in excess of one year at December 31, 2014 are presented in the following table:
| In thousands |
Gross Minimum Rental Payments |
|||
| 2015 |
$ | 15,352 | ||
| 2016 |
14,093 | |||
| 2017 |
13,345 | |||
| 2018 |
11,495 | |||
| 2019 |
3,912 | |||
| Thereafter |
20,267 | |||
|
|
|
|||
| Total |
$ | 78,464 | ||
|
|
|
|||
Rent expense (net of sub-lease income), including incidental leases, was $20.1 million, $15.4 million and $14.5 million for the Company during the fiscal years ended December 31, 2014, December 28, 2013 and December 29, 2012, respectively. These expenses are generally recognized on a straight-line basis over the life of the lease.
In the third quarter of 2011, the Company’s state-of-the-art spunmelt line in Waynesboro, Virginia commenced commercial production. The plant expansion increased capacity to meet demand for nonwoven materials in the hygiene and healthcare applications in the U.S. The line was principally funded by a seven year equipment lease with a capitalized cost of $53.6 million. From the commencement of the lease to its fourth anniversary date, the Company will make annual lease payments of $8.3 million. From the fourth anniversary date to the end of the lease term, the Company’s annual lease payments may change, as defined in the lease agreement. The aggregate monthly lease payments under the agreement, subject to adjustment, are expected to approximate $58 million. The lease includes covenants, events of default and other provisions that requires the Company to maintain certain financial ratios and other requirements.
Financing Obligation
As a result of the Fiberweb Acquisition, the Company acquired a manufacturing facility in Old Hickory, Tennessee, the assets of which included a utility plant used to generate steam for use in its manufacturing process. Upon completion of its construction in 2011, the utility plant was sold to an unrelated third-party and subsequently leased back by Fiberweb for a period of 10 years. The Company has accounted for this transaction as a direct financing lease, recognizing the assets as part of property, plant and equipment and a related financing obligation as a long-term liability. Cash payments to the lessor are allocated between interest expense and amortization of the financing obligation. At the end of the lease term, the Company will recognize the sale of the utility plant, however, no gain or loss will be recognized as the financing obligation will equal the expected carrying value of the assets. At December 31, 2014, the outstanding balance of the financing obligation was $18.4 million, which is included in Other noncurrent liabilities in the Consolidated Balance Sheets.
Purchase Commitments
At December 31, 2014, the Company had purchase commitments of $92.1 million, of which $77.1 million related to the purchase of raw materials in the normal course of business. The remaining $15.0 million related to capital projects, primarily associated with the plan to relocate the Company’s Nanhai, China manufacturing facilities and the warehouse expansion project at the Company’s Old Hickory, Tennessee manufacturing facilities.
Providência Tax Claims
In connection with the acquisition of Providência, the Company is party to the Providência Tax Claims as discussed in Notes 4, “Acquisitions” and 16, “Income Taxes”. The Providência Tax Claims relate to two tax
F-59
Table of Contents
deficiency notices received in August and November 2013 relating to Providência’s 2007 and 2008 tax filings. At the Providência Acquisition Date and at each subsequent reporting period, the Company evaluated whether the Providência Tax Claims qualified for recognition and the Company determined it was more likely than not that Providência’s position would be sustained upon challenge by the Brazilian courts. This determination was based on advice received from the Company’s Brazilian legal counsel. Therefore, the Company did not record an uncertain tax position liability for this matter.
At the Providência Acquisition Date, the Deferred Purchase Price amounted $47.9 million. The Deferred Purchase Price is denominated in Brazilian reals and accretes at a rate of 9.5% per annum compounded daily. At December 31, 2014, the remeasured and accreted balance of the Deferred Purchase Price was $42.4 million. Based on the Company’s best estimate, the resolution of the Providência Tax Claims is expected to take longer than a year.
Redeemable Noncontrolling Interest
In connection with the Providência Acquisition, as required by Brazilian law, PGI Acquisition Company filed the Mandatory Tender Offer registration request with the CVM in order to launch, after its approval, a tender offer to acquire all of the remaining outstanding capital stock of Providência from the minority shareholders. As of December 31, 2014, the Mandatory Tender Offer was still under review by the CVM. Hence, the conditions for the launch of the Mandatory Tender Offer have not been met as of December 31, 2014. However, once the Mandatory Tender Offer is approved and launched, the minority shareholders will have the right, but not the obligation, to sell their remaining outstanding capital stock of Providência. Given such right of the minority shareholders, the Company determined that ASC 480 requires the noncontrolling interest to be presented as mezzanine equity on the Consolidated Balance Sheets and adjusted to its estimated maximum redemption amount at each balance sheet date. At December 31, 2014, the redemption value of the redeemable noncontrolling interest was $89.2 million. Refer to Note 17, “Redeemable Noncontrolling Interest” for further information on the accounting of the redeemable noncontrolling interest.
Environmental
The Company is subject to a broad range of federal, foreign, state and local laws and regulations relating to pollution and protection of the environment. The Company believes that it is currently in substantial compliance with applicable environmental requirements and does not currently anticipate any material adverse effect on its operations, financial or competitive position as a result of its efforts to comply with environmental requirements. Some risk of environmental liability is inherent, however, in the nature of the Company’s business and, accordingly, there can be no assurance that material environmental liabilities will not arise.
Note 23. Segment Information
The Company is a leading global innovator and manufacturer of specialty materials, primarily focused on the production of nonwoven products. The Company operates through four operating segments, which represent its four reportable segments: North America, South America, Europe and Asia, with the main source of revenue being the sales of primary and intermediate products to consumer and industrial markets. The Company has one major customer, Procter & Gamble, that accounts for approximately 12% of its business, the loss of which would have a material adverse impact on reported financial results. Sales to this customer are reported within each of the reportable segments.
Segment information is based on the “management” approach which designates the internal reporting used by management for making decisions and assessing performance. The Company manages its business on a geographic basis, as each region provides similar products and services. The reportable segments are consistent with the manner in which financial information is desegregated for internal review and decision making. The accounting policies of the reportable segments are the same as those described in Note 3, “Summary of Significant Accounting Policies”. Intercompany sales between the reportable segments are eliminated.
F-60
Table of Contents
In light of the acquisition of Providência, the Company realigned its reportable segments during the third quarter of 2014. Reportable segments are as follows: North America, South America, Europe and Asia.
Financial data by reportable segment is as follows:
| In thousands |
Fiscal Year Ended December 31, 2014 |
Fiscal Year Ended December 28, 2013 |
Fiscal Year Ended December 29, 2012 |
|||||||||
| Net sales |
||||||||||||
| North America |
$ | 828,633 | $ | 572,095 | $ | 542,788 | ||||||
| South America |
306,164 | 153,770 | 161,509 | |||||||||
| Europe |
530,440 | 316,400 | 294,120 | |||||||||
| Asia |
194,677 | 172,597 | 156,746 | |||||||||
|
|
|
|
|
|
|
|||||||
| Total |
$ | 1,859,914 | $ | 1,214,862 | $ | 1,155,163 | ||||||
|
|
|
|
|
|
|
|||||||
| Operating income (loss) |
||||||||||||
| North America |
$ | 87,159 | $ | 51,485 | $ | 49,988 | ||||||
| South America |
6,791 | 7,681 | 18,047 | |||||||||
| Europe |
21,484 | 8,571 | 11,102 | |||||||||
| Asia |
17,352 | 17,809 | 18,130 | |||||||||
| Unallocated Corporate |
(54,954 | ) | (45,059 | ) | (40,586 | ) | ||||||
| Eliminations |
(449 | ) | (131 | ) | 76 | |||||||
|
|
|
|
|
|
|
|||||||
| Subtotal |
77,383 | 40,356 | 56,757 | |||||||||
| Special charges, net |
(59,185 | ) | (33,188 | ) | (19,592 | ) | ||||||
|
|
|
|
|
|
|
|||||||
| Total |
$ | 18,198 | $ | 7,168 | $ | 37,165 | ||||||
|
|
|
|
|
|
|
|||||||
| Depreciation and amortization expense |
||||||||||||
| North America |
$ | 48,173 | $ | 27,614 | $ | 28,072 | ||||||
| South America |
18,652 | 8,458 | 9,204 | |||||||||
| Europe |
22,061 | 13,695 | 11,267 | |||||||||
| Asia |
22,009 | 19,954 | 13,780 | |||||||||
| Unallocated Corporate |
1,662 | 1,776 | 1,718 | |||||||||
|
|
|
|
|
|
|
|||||||
| Subtotal |
112,557 | 71,497 | 64,041 | |||||||||
| Amortization of loan acquisition costs |
5,698 | 4,796 | 2,665 | |||||||||
|
|
|
|
|
|
|
|||||||
| Total |
$ | 118,255 | $ | 76,293 | $ | 66,706 | ||||||
|
|
|
|
|
|
|
|||||||
| Capital spending |
||||||||||||
| North America |
$ | 35,351 | $ | 11,754 | $ | 4,909 | ||||||
| South America |
10,819 | 3,991 | 611 | |||||||||
| Europe |
15,812 | 6,419 | 8,802 | |||||||||
| Asia |
16,511 | 31,122 | 36,626 | |||||||||
| Corporate |
3,964 | 1,356 | 677 | |||||||||
|
|
|
|
|
|
|
|||||||
| Total |
$ | 82,457 | $ | 54,642 | $ | 51,625 | ||||||
|
|
|
|
|
|
|
|||||||
| In thousands |
December 31, 2014 |
December 28, 2013 |
||||||
| Division assets |
||||||||
| North America |
$ | 819,133 | $ | 644,913 | ||||
| South America |
536,140 | 135,373 | ||||||
| Europe |
304,879 | 351,591 | ||||||
| Asia |
261,172 | 265,729 | ||||||
| Corporate |
113,849 | 66,914 | ||||||
|
|
|
|
|
|||||
| Total |
$ | 2,035,173 | $ | 1,464,520 | ||||
|
|
|
|
|
|||||
F-61
Table of Contents
Geographic Data:
Export sales from the Company’s United States operations to unaffiliated customers were $19.1 million, $20.1 million and $32.1 million for the fiscal years ended December 31, 2014, December 28, 2013 and December 29, 2012, respectively.
Geographic data for the Company’s operations, based on the geographic region that the sale is made from, are presented as follows:
| In thousands |
Fiscal Year Ended December 31, 2014 |
Fiscal Year Ended December 28, 2013 |
Fiscal Year Ended December 29, 2012 |
|||||||||
| Net sales |
||||||||||||
| United States |
$ | 619,162 | $ | 380,836 | $ | 357,193 | ||||||
| Mexico |
138,041 | 130,451 | 128,284 | |||||||||
| Canada |
71,430 | 60,808 | 57,312 | |||||||||
| Europe |
530,440 | 316,400 | 294,120 | |||||||||
| Asia |
194,676 | 172,597 | 156,746 | |||||||||
| South America |
306,165 | 153,770 | 161,508 | |||||||||
|
|
|
|
|
|
|
|||||||
| Total |
$ | 1,859,914 | $ | 1,214,862 | $ | 1,155,163 | ||||||
|
|
|
|
|
|
|
|||||||
| In thousands |
December 31, 2014 |
December 28, 2013 |
||||||
| Property, plant and equipment, net |
||||||||
| United States |
$ | 286,204 | $ | 209,861 | ||||
| Mexico |
51,295 | 56,229 | ||||||
| Canada |
4,088 | 5,026 | ||||||
| Europe |
136,993 | 155,383 | ||||||
| Asia |
146,240 | 158,006 | ||||||
| South America |
245,410 | 68,275 | ||||||
|
|
|
|
|
|||||
| Total |
$ | 870,230 | $ | 652,780 | ||||
|
|
|
|
|
|||||
Net sales:
The Company’s products serve its customers in the following three key applications, each of which are presented below:
| • | Personal Care—Personal Care represents specialty materials used for hygiene, dryer sheets and personal wipes products. |
| • | Infection Prevention—Infection Prevention includes specialty materials used for healthcare, filtration and disinfectant wipes products. |
| • | High Performance Solutions—High performance solutions represents specialty materials used for Building & Construction/Geosynthetics & Agriculture, industrial wipes, filtration, and various other applications. |
F-62
Table of Contents
Net sales by key applications are as follows:
| In thousands |
Fiscal Year Ended December 31, 2014 |
Fiscal Year Ended December 28, 2013 |
Fiscal Year Ended December 29, 2012 |
|||||||||
| Net sales |
||||||||||||
| Personal Care |
$ | 894,980 | $ | 598,879 | $ | 583,131 | ||||||
| Infection Prevention |
340,727 | 296,483 | 294,297 | |||||||||
| High Performance Solutions |
624,208 | 319,500 | 277,736 | |||||||||
|
|
|
|
|
|
|
|||||||
| Total |
$ | 1,859,914 | $ | 1,214,862 | $ | 1,155,163 | ||||||
|
|
|
|
|
|
|
|||||||
Note 24. Selected Quarterly Financial Data
The unaudited quarterly financial data for the fiscal years ended December 31, 2014 and December 28, 2013 are presented below. All quarters included below were comprised of 13 weeks except for the fourth quarter ended December 31, 2014 which contained 14 weeks. The additional week was a result of a change in the Company’s fiscal year-end to a calendar year ending on December 31 from a 52 week period ending on the Saturday closest to each December 31. Refer to Note 2, “Basis of Presentation” for further information on the change in the Company’s fiscal year-end.
Quarterly data for fiscal 2014:
| In thousands |
Fourth Quarter Ended December 31, 2014 |
Third Quarter Ended September 27, 2014 |
Second Quarter Ended June 28, 2014 |
First Quarter Ended March 29, 2014 |
||||||||||||
| Operating Data: |
||||||||||||||||
| Net sales |
$ | 499,419 | $ | 498,013 | $ | 439,898 | $ | 422,584 | ||||||||
| Gross profit |
91,965 | 80,492 | 86,586 | 74,465 | ||||||||||||
| Net income (loss) |
(30,652 | ) | (57,151 | ) | (21,941 | ) | (9,496 | ) | ||||||||
| Net income (loss) attributable to PGI Specialty Materials, Inc. |
(30,925 | ) | (55,228 | ) | (19,664 | ) | (9,480 | ) | ||||||||
Quarterly data for fiscal 2013:
| In thousands |
Fourth Quarter Ended December 28, 2013 |
Third Quarter Ended September 28, 2013 |
Second Quarter Ended June 29, 2013 |
First Quarter Ended March 30, 2013 |
||||||||||||
| Operating Data: |
||||||||||||||||
| Net sales |
$ | 347,263 | $ | 288,979 | $ | 291,538 | $ | 287,082 | ||||||||
| Gross profit |
51,600 | 48,200 | 50,390 | 45,866 | ||||||||||||
| Net income (loss) |
(2,567 | ) | (8,267 | ) | (7,906 | ) | (6,227 | ) | ||||||||
| Net income (loss) attributable to PGI Specialty Materials, Inc. |
(2,533 | ) | (8,267 | ) | (7,906 | ) | (6,227 | ) | ||||||||
Note 25. Certain Relationships and Related Party Transactions
In connection with the Merger, the Company entered into a shareholders agreement (the “Shareholders Agreement”) with Blackstone and certain members of the Company’s management. The Shareholders Agreement governs certain matters relating to ownership of the Company, including with respect to the election of directors of our parent companies, restrictions on the issuance or transfer of shares, including tag-along rights and drag-along rights, other special corporate governance provisions and registration rights (including customary indemnification provisions). Each party to the Shareholders Agreement also agrees to vote all of its voting securities, whether at a shareholders meeting, or by written consent, in the manner which Blackstone directs, except that an employee shareholder shall not be required to vote in favor of any change to the organizational
F-63
Table of Contents
documents of the Company that would have a disproportionate adverse effect on the terms of such employee shareholder’s shares of Common Stock relative to other shareholders. Each employee shareholder also grants to the Chief Executive Officer of the Company a proxy to vote all of the securities owned by such employee shareholder in the manner described in the preceding sentence. As of December 31, 2014, the Board of Directors of the Company includes one Blackstone member, five outside members and the Company’s Chief Executive Officer as an employee director. Furthermore, Blackstone has the power to designate all of the members of the Board of Directors of the Company and the right to remove any or all directors that it appoints, with or without cause.
Advisory Agreement
Upon the completion of the Merger, PGI Group became subject to a transaction and fee advisory agreement (“Advisory Services Agreement”) with Blackstone Management Partners V L.L.C. (“BMP”), an affiliate of Blackstone. Under the Advisory Services Agreement, BMP (including through its affiliates) has agreed to provide certain monitoring, advisory and consulting services for an annual non-refundable advisory fee, to be paid at the beginning of each fiscal year, equal to the greater of (i) $3.0 million or (ii) 2.0% of PGI Group’s consolidated EBITDA (as defined under the credit agreement governing our ABL Facility) for the immediately preceding fiscal year. The amount of such fee shall be initially paid based on PGI Group’s then most current estimate of PGI Group’s projected EBITDA amount for the fiscal year immediately preceding the date upon which the advisory fee is paid. After completion of the fiscal year to which the fee relates and following the availability of audited financial statements for such period, the parties will recalculate the amount of such fee based on the actual consolidated EBITDA for such period and PGI Group or BMP, as applicable, shall adjust such payment as necessary based on the recalculated amount. Since the Merger until fiscal 2014, the Company’s advisory fee has been $3.0 million, which is paid at the beginning of each year. However, as a result of actual Consolidated EBITDA for the fiscal year ended December 31, 2014, the Company’s advisory fee was adjusted to $5.2 million. The amounts are included in Selling, general and administrative expenses in the Consolidated Statements of Operations.
In addition, in the absence of an express agreement to provide investment banking or other financial advisory services to PGI Group, and without regard to whether such services were provided, BMP will be entitled to receive a fee equal to 1.0% of the aggregate transaction value upon the consummation of any acquisition, divestiture, disposition, merger, consolidation, restructuring, refinancing, recapitalization, issuance of private or public debt or equity securities (including an initial public offering of equity securities), financing or similar transaction by PGI Group. The fee associated with the Fiberweb transaction totaled $2.5 million and was paid in December 2013. The fee associated with the Providência transaction totaled $5.3 million and was paid in October 2014. These amounts are included in Special charges, net in the Consolidated Statement of Operations.
At any time in connection with or in anticipation of a change of control of PGI Group, a sale of all or substantially all of PGI Group’s assets or an initial public offering of common equity of PGI Group or parent entity of PGI Group or their successors, BMP may elect to receive, in consideration of BMP’s role in facilitating such transaction and in settlement of the termination of the services, a single lump sum cash payment equal to the then-present value of all then-current and future annual advisory fees payable under the Advisory Services Agreement, assuming a hypothetical termination date of the Advisory Service Agreement to be the twelfth anniversary of such election. The Advisory Service Agreement will continue until the earlier of the twelfth anniversary of the date of the agreement or such date as PGI Group and BMP may mutually determine. PGI Group will agree to indemnify BMP and its affiliates, directors, officers, employees, agents and representatives from and against all liabilities relating to the services contemplated by the transaction and advisory fee agreement and the engagement of BMP pursuant to, and the performance of BMP and its affiliates of the services contemplated by, the Advisory Services Agreement.
Other Relationships and Transactions
An affiliate of Blackstone, the Blackstone Group International Partners, LLP (“BGIP”), provided certain financial advisory services to PGI Group in connection with the acquisition of Fiberweb for which BGIP
F-64
Table of Contents
received an aggregate fee of $3.0 million. PGI Group also reimbursed BGIP for its reasonable documented expenses, and agreed to indemnify BGIP and related persons against certain liabilities arising out of its engagement. As a result, the Company recognized $3.2 million during the year ended December 28, 2013, which is included within Special charges, net in the Consolidated Statements of Operations.
Blackstone and its affiliates have ownership interests in a broad range of companies. The Company has entered into commercial transactions in the ordinary course of its business with some of these companies, including the sale of goods and services and the purchase of goods and services. In addition, Blackstone Holdings Finance Co., LLC, an affiliate of Blackstone, participated in the Fiberweb financing group and received $0.6 million associated with their pro rata participation.
Under our Restated Articles of Incorporation, the Company’s directors do not have a duty to refrain from engaging in similar business activities as the Company or doing business with any client, customer or vendor of the Company engaging in any other corporate opportunity that the Company has any expectancy or interest in engaging in. The Company has also waived, to the fullest extent permitted by law, any expectation or interest or right to be informed of any corporate opportunity, and any director acquiring knowledge of a corporate opportunity shall have no duty to inform the Company of such corporate opportunity.
Note 26. Condensed Financial Information of the Parent Company
The Company has no material assets or standalone operations other than its indirect ownership of the shares of Polymer Group, Inc. The Senior Secured Notes and the indenture governing the Notes restrict the Company’s ability to obtain funds from its subsidiaries through dividends, loans or advances. Accordingly, this condensed financial information has been presented on a “Parent-only” basis. Under a Parent-only presentation, the Company’s investments in its consolidated subsidiaries are presented under the equity method of accounting.
The following tables present the financial position of the Company as of December 31, 2014 and December 28, 2013, the Statements of Operations as of December 31, 2014, December 28, 2013 and December 29, 2012 and the Statements of Cash Flows as of December 31, 2014, December 28, 2013 and December 29, 2012.
PGI Specialty Materials, Inc.
Condensed Balance Sheets
| In thousands, except share data | December 31, 2014 |
December 28, 2013 |
||||||
| ASSETS |
||||||||
| Cash |
$ | — | $ | — | ||||
| Net investments in subsidiary |
(24,355 | ) | 158,896 | |||||
|
|
|
|
|
|||||
| Total assets |
$ | (24,355 | ) | $ | 158,896 | |||
|
|
|
|
|
|||||
| EQUITY |
||||||||
| Common stock—par value $0.01; 1,000,000 authorized shares; 292,491 issued and outstanding December 31, 2014; and 291,991 shares issued and outstanding December 28, 2013 |
$ | 3 | $ | 3 | ||||
| Additional paid-in capital |
277,245 | 294,141 | ||||||
| Accumulated earnings (deficit) |
(242,439 | ) | (127,142 | ) | ||||
| Accumulated other comprehensive income (loss) |
(59,164 | ) | (8,106 | ) | ||||
|
|
|
|
|
|||||
| Total equity (deficit) |
$ | (24,355 | ) | $ | 158,896 | |||
|
|
|
|
|
|||||
F-65
Table of Contents
PGI Specialty Materials, Inc.
Condensed Statements of Comprehensive Income (Loss)
| In thousands, except for per share data | Fiscal Year Ended December 31, 2014 |
Fiscal Year Ended December 28, 2013 |
Fiscal Year Ended December 29, 2012 |
|||||||||
| Selling, general, and administrative |
$ | (1,931 | ) | $ | (3,990 | ) | $ | (842 | ) | |||
| Equity in net loss of subsidiary |
(113,366 | ) | (20,943 | ) | (25,196 | ) | ||||||
|
|
|
|
|
|
|
|||||||
| Net income (loss) |
$ | (115,297 | ) | $ | (24,933 | ) | $ | (26,038 | ) | |||
|
|
|
|
|
|
|
|||||||
| Weighted average common shares outstanding, basic and diluted |
292,178 | 264,998 | 260,403 | |||||||||
| Basic and diluted earnings (loss) per share (Note 17) |
$ | (467.89 | ) | $ | (94.09 | ) | $ | (99.99 | ) | |||
|
|
|
|
|
|
|
|||||||
| Other comprehensive income (loss), net of tax |
||||||||||||
| Currency translation |
(35,911 | ) | 8,709 | 2,287 | ||||||||
| Employee postretirement benefits |
(15,147 | ) | (2,046 | ) | (19,927 | ) | ||||||
|
|
|
|
|
|
|
|||||||
| Other comprehensive income (loss), net of tax |
(51,058 | ) | 6,663 | (17,640 | ) | |||||||
|
|
|
|
|
|
|
|||||||
| Comprehensive income (loss) |
$ | (166,355 | ) | $ | (18,270 | ) | $ | (43,678 | ) | |||
|
|
|
|
|
|
|
|||||||
PGI Specialty Materials, Inc.
Condensed Statements of Cash Flows
| In thousands | Fiscal Year Ended December 31, 2014 |
Fiscal Year Ended December 28, 2013 |
Fiscal Year Ended December 29, 2012 |
|||||||||
| Investing activities: |
||||||||||||
| Net investment in subsidiary |
(750 | ) | (30,504 | ) | (1,087 | ) | ||||||
|
|
|
|
|
|
|
|||||||
| Net cash used in investing activities |
(750 | ) | (30,504 | ) | (1,087 | ) | ||||||
|
|
|
|
|
|
|
|||||||
| Financing activities: |
||||||||||||
| Issuance of stock |
750 | 30,504 | 1,087 | |||||||||
|
|
|
|
|
|
|
|||||||
| Net cash used in financing activities |
750 | 30,504 | 1,087 | |||||||||
|
|
|
|
|
|
|
|||||||
| Net change in cash and cash equivalents |
— | — | — | |||||||||
| Cash and cash equivalents |
||||||||||||
| Beginning of year |
$ | — | $ | — | $ | — | ||||||
| End of year |
$ | — | $ | — | $ | — | ||||||
As the Company has a consolidated shareholders’ deficit as of December 31, 2014, its net asset base for purposes of calculating the proportionate share of the restricted net assets of its indirect ownership of the shares of Polymer Group, Inc. is deemed to be zero. Therefore, the restrictions placed on the Company’s net investment result in the 25 percent threshold being exceeded. During the fiscal years ended December 31, 2014, December 28, 2013 and December 29, 2012, the Company’s consolidated subsidiaries did not pay any cash dividends to the Company.
Note 27. Subsequent Event
On March 25, 2015, the Company announced that PGI France Holdings SAS, a wholly-owned subsidiary of the Company, entered into an agreement to acquire Dounor SAS (“Dounor”), a French manufacturer of materials used in hygiene, healthcare and industrial applications. The acquisition of Dounor was completed on April 17, 2015 for a purchase price of €55 million using the proceeds from borrowings under an incremental amendment (“the Second Incremental Amendment”) to the Company’s existing Term Loan Facility. The Company is
F-66
Table of Contents
currently in the process of evaluating the purchase accounting implications of the acquisition of Dounor.
On April 17, 2015, PGI Group entered into the Second Incremental Amendment. Pursuant to the Second Incremental Amendment, PGI Group obtained $283.0 million of commitments for incremental term loans (the “2015 Additional Term Loans”). A portion of the proceeds of the 2015 Additional Term Loans were used to fund the consideration due in respect of the previously announced acquisition of Dounor. The remaining proceeds are expected to be used to redeem $200.0 million outstanding principal amount of the PGI Group’s outstanding Senior Secured Notes, to pay related fees and expenses (including the redemption premium) and for general corporate purposes.
On April 8, 2015, PGI Group issued a conditional notice of its election to redeem $200.0 million of the outstanding principal amount of its Senior Secured Notes. The Senior Secured Notes are expected to be redeemed on May 8, 2015 (the “Redemption Date”) at a redemption price of 103.875% of the principal amount thereof, plus accrued and unpaid interest on the Senior Secured Notes to, but excluding, the Redemption Date.
F-67
Table of Contents
To
The Shareholders and Board of Directors of
Companhia Providência Indústria e Comércio
São José dos Pinhais – PR
We have audited the accompanying consolidated financial statements of Companhia Providência Indústria e Comércio and its subsidiaries (the “Company”), which comprise the consolidated balance sheets as of December 31, 2013 and 2012, and the related consolidated income statements and statements of comprehensive income, changes in equity and cash flows for the years then ended, and the related notes to the consolidated financial statements.
Management’s Responsibility for the Consolidated Financial Statements
Management is responsible for the preparation and fair presentation of these consolidated financial statements in accordance with International Financial Reporting Standards (IFRS), issued by the International Accounting Standards Board - IASB; this includes the design, implementation, and maintenance of internal control relevant to the preparation and fair presentation of consolidated financial statements that are free from material misstatement, whether due to fraud or error.
Auditor’s Responsibility
Our responsibility is to express an opinion on these consolidated financial statements based on our audits. We conducted our audits in accordance with auditing standards generally accepted in the United States of America. Those standards require that we plan and perform the audit to obtain reasonable assurance about whether the consolidated financial statements are free from material misstatement.
An audit involves performing procedures to obtain audit evidence about the amounts and disclosures in the consolidated financial statements. The procedures selected depend on the auditor’s judgment, including the assessment of the risks of material misstatement of the consolidated financial statements, whether due to fraud or error. In making those risk assessments, the auditor considers internal control relevant to the Company’s preparation and fair presentation of the consolidated financial statements in order to design audit procedures that are appropriate in the circumstances, but not for the purposes of expressing an opinion on the effectiveness of the Company’s internal control. Accordingly, we express no such opinion. An audit also includes evaluating the appropriateness of accounting policies used and the reasonableness of significant accounting estimates made by Management, as well as evaluating the overall presentation of the consolidated financial statements.
We believe that the audit evidence we have obtained is sufficient and appropriate to provide a basis for our audit opinion.
Opinion
In our opinion, the consolidated financial statements referred to above present fairly, in all material respects, the financial position of Companhia Providência Indústria e Comércio and its subsidiaries as of December 31, 2013 and 2012, and the results of their operations and their cash flows for the years then ended in accordance with International Financial Reporting Standards (IFRS) issued by the International Accounting Standards Board - IASB.
/s/ DELOITTE TOUCHE TOHMATSU
DELOITTE TOUCHE TOHMATSU
Auditores Independentes
Curitiba, BR
May 13, 2014
F-68
Table of Contents
COMPANHIA PROVIDÊNCIA INDÚSTRIA E COMÉRCIO
CONSOLIDATED BALANCE SHEETS AS OF DECEMBER 31, 2013 AND 2012
All amounts in thousands of Brazilian reais (R$)
The accompanying notes are an integral part of these financial statements
F-69
Table of Contents
COMPANHIA PROVIDÊNCIA INDÚSTRIA E COMÉRCIO
CONSOLIDATED INCOME STATEMENTS FOR THE YEARS ENDED DECEMBER 31, 2013 AND 2012
All amounts in thousands of Brazilian reais (R$), unless otherwise stated
| 2013 | 2012 | |||||||
| Revenue (Note 21) |
782,002 | 608,634 | ||||||
| Cost of revenues (Note 22) |
(578,579 | ) | (423,055 | ) | ||||
|
|
|
|
|
|||||
| Gross profit |
203,423 | 185,579 | ||||||
| Selling expenses (Note 22) |
(41,309 | ) | (34,596 | ) | ||||
| Administrative expenses (Note 22) |
(77,909 | ) | (62,034 | ) | ||||
| Other income (Note 22) |
(3,308 | ) | 79 | |||||
|
|
|
|
|
|||||
| (122,526 | ) | (96,551 | ) | |||||
| Operating income |
80,897 | 89,028 | ||||||
| Finance income (Note 23) |
6,028 | 15,375 | ||||||
| Finance expenses (Note 23) |
(45,393 | ) | (35,808 | ) | ||||
|
|
|
|
|
|||||
| Finance expenses, net |
(39,365 | ) | (20,433 | ) | ||||
| Income before income tax and social contribution |
41,532 | 68,595 | ||||||
| Income tax and social contribution (Note 24) |
(14,612 | ) | (23,524 | ) | ||||
|
|
|
|
|
|||||
| Income from continuing operations |
26,920 | 45,071 | ||||||
|
|
|
|
|
|||||
| Net profit |
26,920 | 45,071 | ||||||
|
|
|
|
|
|||||
| Earnings per share (basic and diluted) |
||||||||
| From continuing operations (Note 20 (g)) |
0.34 | 0.56 | ||||||
|
|
|
|
|
|||||
The accompanying notes are an integral part of these financial statements.
F-70
Table of Contents
COMPANHIA PROVIDÊNCIA INDÚSTRIA E COMÉRCIO
CONSOLIDATED STATEMENTS OF COMPREHENSIVE INCOME FOR THE YEARS ENDED DECEMBER 31, 2013 AND 2012
All amounts in thousands of Brazilian reais (R$)
| 2013 | 2012 | |||||||
| Net profit for the year |
26,920 | 45,071 | ||||||
|
|
|
|
|
|||||
| Other comprehensive income |
||||||||
| Foreign currency translation adjustments |
(1,078 | ) | (490 | ) | ||||
|
|
|
|
|
|||||
| Total comprehensive income |
25,842 | 44,581 | ||||||
|
|
|
|
|
|||||
The accompanying notes are an integral part of these financial statements.
F-71
Table of Contents
COMPANHIA PROVIDÊNCIA INDÚSTRIA E COMÉRCIO
CONSOLIDATED STATEMENT OF CHANGES IN EQUITY FOR THE YEARS ENDED DECEMBER 31, 2013 AND 2012
All amounts in thousands of Brazilian reais (R$)
| Capital reserves | Profit reserves | Valuation adjustments to equity | ||||||||||||||||||||||||||||||||||||||||||||||||||||||||||
| Capital | Issuance costs |
Share premium reserve |
Stock options |
Total | Legal reserve |
Profit retention |
Investment reserve |
Total | Treasury shares |
Retained earnings |
Deemed cost adjustment |
Accumulated other comprehensive income |
Total | Total equity |
||||||||||||||||||||||||||||||||||||||||||||||
| As of December 31, 2011 |
422,269 | (13,266 | ) | 10,703 | 361 | 11,064 | 7,486 | 25,430 | 68,518 | 101,434 | (813 | ) | 168,688 | (91 | ) | 168,597 | 689,285 | |||||||||||||||||||||||||||||||||||||||||||
|
|
|
|
|
|
|
|
|
|
|
|
|
|
|
|
|
|
|
|
|
|
|
|
|
|
|
|
|
|
|
|||||||||||||||||||||||||||||||
| Profit for the period |
45,071 | 45,071 | ||||||||||||||||||||||||||||||||||||||||||||||||||||||||||
| Exchange rate changes on foreign investees (Note 12) |
(490 | ) | (490 | ) | (490 | ) | ||||||||||||||||||||||||||||||||||||||||||||||||||||||
|
|
|
|
|
|
|
|
|
|
|
|
|
|
|
|
|
|
|
|
|
|
|
|
|
|
|
|
|
|
|
|||||||||||||||||||||||||||||||
| Total comprehensive income for the period |
45,071 | (490 | ) | (490 | ) | 44,581 | ||||||||||||||||||||||||||||||||||||||||||||||||||||||
| Realization of deemed cost (Note 14) |
15,523 | (15,523 | ) | (15,523 | ) | |||||||||||||||||||||||||||||||||||||||||||||||||||||||
| (-) Taxes on realization of deemed cost (Note 20) |
(5,278 | ) | 5,278 | 5,278 | ||||||||||||||||||||||||||||||||||||||||||||||||||||||||
| Other convergence adjustments |
||||||||||||||||||||||||||||||||||||||||||||||||||||||||||||
|
|
|
|
|
|
|
|
|
|
|
|
|
|
|
|
|
|
|
|
|
|
|
|
|
|
|
|
|
|
|
|||||||||||||||||||||||||||||||
| Total realization of deemed cost |
10,245 | (10,245 | ) | (10,245 | ) | |||||||||||||||||||||||||||||||||||||||||||||||||||||||
|
|
|
|
|
|
|
|
|
|
|
|
|
|
|
|
|
|
|
|
|
|
|
|
|
|
|
|
|
|
|
|||||||||||||||||||||||||||||||
| Contributions/distributions to shareholders: |
||||||||||||||||||||||||||||||||||||||||||||||||||||||||||||
| Share-based payment (Note 20) |
814 | 814 | 814 | |||||||||||||||||||||||||||||||||||||||||||||||||||||||||
| Allocation of profit for the year: |
||||||||||||||||||||||||||||||||||||||||||||||||||||||||||||
| Interim dividends paid (Note 20) |
(19,273 | ) | (19,273 | ) | ||||||||||||||||||||||||||||||||||||||||||||||||||||||||
| Dividends paid (Note 20) |
(25,430 | ) | (25,430 | ) | (25,430 | ) | ||||||||||||||||||||||||||||||||||||||||||||||||||||||
| Legal reserve |
2,254 | 2,254 | (2,254 | ) | ||||||||||||||||||||||||||||||||||||||||||||||||||||||||
| Accrued additional proposed dividends |
33,789 | 33,789 | (33,789 | ) | ||||||||||||||||||||||||||||||||||||||||||||||||||||||||
|
|
|
|
|
|
|
|
|
|
|
|
|
|
|
|
|
|
|
|
|
|
|
|
|
|
|
|
|
|
|
|||||||||||||||||||||||||||||||
| Total contributions/distributions to shareholders |
814 | 814 | 2,254 | 8,359 | 10,613 | (55,316 | ) | (43,889 | ) | |||||||||||||||||||||||||||||||||||||||||||||||||||
|
|
|
|
|
|
|
|
|
|
|
|
|
|
|
|
|
|
|
|
|
|
|
|
|
|
|
|
|
|
|
|||||||||||||||||||||||||||||||
| As of December 31, 2012 |
422,269 | (13,266 | ) | 10,703 | 1,175 | 11,878 | 9,740 | 33,789 | 68,518 | 112,047 | (813 | ) | 158,443 | (581 | ) | 157,862 | 689,977 | |||||||||||||||||||||||||||||||||||||||||||
|
|
|
|
|
|
|
|
|
|
|
|
|
|
|
|
|
|
|
|
|
|
|
|
|
|
|
|
|
|
|
|||||||||||||||||||||||||||||||
| Profit for the period |
26,920 | 26,920 | ||||||||||||||||||||||||||||||||||||||||||||||||||||||||||
| Exchange rate changes on foreign investees (Note 12) |
(1,078 | ) | (1,078 | ) | (1,078 | ) | ||||||||||||||||||||||||||||||||||||||||||||||||||||||
|
|
|
|
|
|
|
|
|
|
|
|
|
|
|
|
|
|
|
|
|
|
|
|
|
|
|
|
|
|
|
|||||||||||||||||||||||||||||||
| Total comprehensive income for the period |
26,920 | (1,078 | ) | (1,078 | ) | 25,842 | ||||||||||||||||||||||||||||||||||||||||||||||||||||||
F-72
Table of Contents
| Capital reserves | Profit reserves | Valuation adjustments to equity | ||||||||||||||||||||||||||||||||||||||||||||||||||||||||||
| Capital | Issuance costs |
Share premium reserve |
Stock options |
Total | Legal reserve |
Profit retention |
Investment reserve |
Total | Treasury shares |
Retained earnings |
Deemed cost adjustment |
Accumulated other comprehensive income |
Total | Total equity |
||||||||||||||||||||||||||||||||||||||||||||||
| Realization of deemed cost (Note 14) |
15,523 | (15,523 | ) | (15,523 | ) | |||||||||||||||||||||||||||||||||||||||||||||||||||||||
| (-) Taxes on realization of deemed cost (Note 20) |
(5,278 | ) | 5,278 | 5,278 | ||||||||||||||||||||||||||||||||||||||||||||||||||||||||
| Other convergence adjustments |
||||||||||||||||||||||||||||||||||||||||||||||||||||||||||||
|
|
|
|
|
|
|
|
|
|
|
|
|
|
|
|
|
|
|
|
|
|
|
|
|
|
|
|
|
|
|
|||||||||||||||||||||||||||||||
| Total realization of deemed cost |
10,245 | (10,245 | ) | (10,245 | ) | |||||||||||||||||||||||||||||||||||||||||||||||||||||||
|
|
|
|
|
|
|
|
|
|
|
|
|
|
|
|
|
|
|
|
|
|
|
|
|
|
|
|
|
|
|
|||||||||||||||||||||||||||||||
| Contributions/distributions to shareholders: |
||||||||||||||||||||||||||||||||||||||||||||||||||||||||||||
| Treasury shares |
713 | 713 | ||||||||||||||||||||||||||||||||||||||||||||||||||||||||||
| Share-based payment (Note 20) |
162 | 385 | 547 | 206 | 753 | |||||||||||||||||||||||||||||||||||||||||||||||||||||||
| Allocation of profit for the period: |
||||||||||||||||||||||||||||||||||||||||||||||||||||||||||||
| Interim dividends paid (Note 20) |
(17,946 | ) | (17,946 | ) | ||||||||||||||||||||||||||||||||||||||||||||||||||||||||
| Dividends paid (Note 20) |
(33,789 | ) | (33,789 | ) | (33,789 | ) | ||||||||||||||||||||||||||||||||||||||||||||||||||||||
| Legal reserve |
1,346 | 1,346 | (1,346 | ) | ||||||||||||||||||||||||||||||||||||||||||||||||||||||||
| Transfer between reserves |
18,079 | 18,079 | (18,079 | ) | ||||||||||||||||||||||||||||||||||||||||||||||||||||||||
|
|
|
|
|
|
|
|
|
|
|
|
|
|
|
|
|
|
|
|
|
|
|
|
|
|
|
|
|
|
|
|||||||||||||||||||||||||||||||
| Total contributions/distributions to shareholders |
162 | 385 | 547 | 1,346 | (33,789 | ) | 18,079 | (14,364 | ) | 713 | (37,165 | ) | (50,269 | ) | ||||||||||||||||||||||||||||||||||||||||||||||
|
|
|
|
|
|
|
|
|
|
|
|
|
|
|
|
|
|
|
|
|
|
|
|
|
|
|
|
|
|
|
|||||||||||||||||||||||||||||||
| As of December 31, 2013 |
422,269 | (13,266 | ) | 10,865 | 1,560 | 12,425 | 11,086 | 86,597 | 97,683 | (100 | ) | 148,198 | (1,659 | ) | 146,539 | 665,550 | ||||||||||||||||||||||||||||||||||||||||||||
|
|
|
|
|
|
|
|
|
|
|
|
|
|
|
|
|
|
|
|
|
|
|
|
|
|
|
|
|
|
|
|||||||||||||||||||||||||||||||
The accompanying notes are an integral part of these financial statements.
F-73
Table of Contents
COMPANHIA PROVIDÊNCIA INDÚSTRIA E COMÉRCIO
CONSOLIDATED STATEMENTS OF CASH FLOWS FOR THE YEARS ENDED DECEMBER 31, 2013 AND 2012
All amounts in thousands of Brazilian reais (R$)
| 2013 | 2012 | |||||||
| CASH FLOWS FROM OPERATING ACTIVITIES |
||||||||
| Net profit for the period |
26,920 | 45,071 | ||||||
| Adjustments: |
||||||||
| Depreciation of property, plant and equipment |
40,816 | 31,912 | ||||||
| Amortization of intangible assets |
4,267 | 3,906 | ||||||
| Interests |
31,601 | 21,667 | ||||||
| Share-based payment |
547 | 814 | ||||||
| Deferred income tax and social contribution |
12,423 | 21,125 | ||||||
| Provision for doubtful accounts |
117 | 958 | ||||||
|
|
|
|
|
|||||
| 116,691 | 125,453 | |||||||
| Changes in assets and liabilities: |
||||||||
| (Increase) decrease in trade receivables |
(23,646 | ) | 18,138 | |||||
| Increase in inventories |
(11,790 | ) | (2,178 | ) | ||||
| Decrease in recoverable taxes |
11,234 | 5,792 | ||||||
| Decrease in other receivables |
487 | 5,869 | ||||||
| Increase in trade payables |
16,585 | 8,135 | ||||||
| Increase (decrease) in payroll, social security and related taxes |
(2,084 | ) | 196 | |||||
| Increase in taxes, fees and contributions |
1,993 | 3,977 | ||||||
| Decrease in other payables |
(1,408 | ) | (2,703 | ) | ||||
|
|
|
|
|
|||||
| (8,629 | ) | 37,226 | ||||||
|
|
|
|
|
|||||
| Other cash flows from operating activities: |
||||||||
| Payment of income tax and social contribution |
(1,755 | ) | (1,510 | ) | ||||
|
|
|
|
|
|||||
| Net cash provided by operating activities |
106,307 | 161,169 | ||||||
| Cash flows from investing activities |
||||||||
| Purchase of property, plant and equipment |
(26,190 | ) | (71,374 | ) | ||||
| Acquisition of intangible assets |
(2,403 | ) | (1,825 | ) | ||||
| Related parties |
||||||||
| Proceeds from the sale of fixed assets |
301 | 109 | ||||||
|
|
|
|
|
|||||
| Net cash used in investing activities |
(28,292 | ) | (73,090 | ) | ||||
| Cash flows from financing activities |
||||||||
| Proceeds from borrowings and financing |
106,127 | 51,184 | ||||||
| Payment of borrowings and financing – principal |
(129,299 | ) | (73,021 | ) | ||||
| Payment of borrowings, financing – interest |
(21,476 | ) | (18,148 | ) | ||||
| Sale of shares |
875 | |||||||
| Dividends paid |
(51,720 | ) | (44,700 | ) | ||||
|
|
|
|
|
|||||
| Net cash used in financing activities |
(95,493 | ) | (84,685 | ) | ||||
| Effect of exchange rate changes on cash and cash equivalents |
(2,417 | ) | (425 | ) | ||||
| Decrease or increase in cash and cash equivalents, net |
(19,895 | ) | 2,969 | |||||
|
|
|
|
|
|||||
| Cash and cash equivalents at the beginning of period (Note 6) |
84,145 | 81,176 | ||||||
| Cash and cash equivalents at the end of period (Note 6) |
64,250 | 84,145 | ||||||
The accompanying notes are an integral part of these financial statements.
F-74
Table of Contents
COMPANHIA PROVIDÊNCIA INDÚSTRIA E COMÉRCIO
NOTES TO THE CONSOLIDATED FINANCIAL STATEMENTS FOR THE YEARS ENDED DECEMBER 31, 2013 AND 2012
In thousands of Brazilian reais, except when otherwise indicated
| 1 | GENERAL INFORMATION |
Companhia Providência Indústria e Comércio, headquartered in São José dos Pinhais, State of Paraná, Brazil, and its subsidiaries (the “Company” or the “Group”) are engaged in the manufacture and sale of plastic products, including nonwoven fabrics under the KAMI brand, resulting from the transformation of polypropylene.
The Company has two subsidiaries, one in the City of Pouso Alegre, State of Minas Gerais, Brazil, and another in Statesville, North Carolina, in the United States of America. In order to expand its production capacity in 2012, the Group installed two new machines. The first was installed in the second quarter in Pouso Alegre and the second in Statesville, which started to operate in the last quarter of 2012.
The issuance of these consolidated financial statements of the Group was authorized by the Board of Directors on May 13, 2014.
| 2 | SUMMARY OF SIGNIFICANT ACCOUNTING POLICIES |
The significant accounting policies applied in the preparation of these consolidated financial statements are set out below. These policies have been consistently applied to all reporting periods, unless otherwise stated.
| 2.1 | Statement of compliance |
The accompanying consolidated financial statements have been prepared in accordance with International Financial Reporting Standards as issued by the International Accounting Standards Board (IFRS).
| 2.2 | Basis of preparation |
The accompanying consolidated financial statements has been prepared based on the historical cost and adjusted in order to reflect financial assets and financial liabilities (including derivatives) stated at fair value through profit or loss, as well as the “deemed cost” of land, buildings, machinery and equipment on the date of transition to IFRS.
The preparation of financial statements requires Management to use certain critical accounting estimates and the exercise of judgment by the Company’s management when applying the accounting policies of the Company. The areas involving a higher degree of judgment and complexity, as well as those where assumptions and estimates are significant to the consolidated financial statements, are disclosed in Note 3.
| (a) | Changes in accounting policies and disclosures |
There are no new IFRS pronouncements or interpretations effective beginning 2013 that had a material impact on the Company’s consolidated financial statements.
| 2.3 | Consolidation |
| (a) | Consolidated financial statements |
The following accounting policies are applied in the preparation of the consolidated financial statements.
Subsidiaries
Subsidiaries are all entities over which the Company has the power to govern the financial and operating policies, whose interest held correspond to more than half of the voting rights (voting
F-75
Table of Contents
capital). The existence and effect of potential voting rights that are currently exercisable or convertible are considered when assessing whether the Company controls another entity.
Subsidiaries are fully consolidated from the date control is transferred to the Company and, when applicable, such consolidation is discontinued from the date control ceases.
Intercompany transactions, balances and unrealized gains and losses are eliminated in consolidation. The accounting policies of subsidiaries are changed, where necessary, to ensure consistency with the policies adopted by the Company and its subsidiaries.
| 2.4 | Segment reporting |
Operating segments are reported consistently with the internal report provided to the chief operating decision-maker. The chief operating decision-maker, who is responsible for allocating resources and assessing the performance of the operating segments, is the Board of Directors, which is also responsible for making the strategic decisions of the Company.
Considering that all decisions are made based on consolidated reports, the only product sold by the Company is the nonwoven fabric, and all decisions related to strategic and financial planning, purchases, sales, investments and allocation of funds are made on a consolidated basis, the Company concluded that they have only one reportable segment.
| 2.5 | Foreign currency translation |
| (a) | Functional and reporting currency |
Items included in the financial statements of each of the consolidated companies are measured using the currency of the primary economic environment where the companies operates (“functional currency”). The consolidated financial statements are presented in Brazilian reais (R$), which is the Company’s functional currency, and also the reporting currency of the consolidated financial statements.
| (b) | Transactions and balances |
Foreign currency-denominated transactions are translated into the Company’s functional currency using the exchange rates prevailing at the transactions or the valuation dates, when items are remeasured. Foreign exchange gains and losses resulting from the settlement of such transactions and from the translation using yearend exchange rates of monetary assets and liabilities denominated in foreign currencies are recognized in the income statement as “Finance income” or “Finance costs”.
| (c) | Consolidated companies using a different functional currency |
The results of operations and financial position of the subsidiary located in the United States, which has a functional currency different from the reporting currency, are translated into the reporting currency as follows:
| (i) | The balances of assets and liabilities reported in each balance sheet are translated using the closing rate on the balance sheet date; |
| (ii) | Income and expenses reported in the income statement are translated using average exchange rates, which are a reasonable approximation of the cumulative effect of the rates prevailing on the transaction dates; and |
| (iii) | All resulting exchange differences are recognized as a separate component of equity. |
| 2.6 | Cash and cash equivalents |
Cash and cash equivalents include cash, bank deposits and other highly liquid short-term investments, which are readily convertible into a known cash amount and subject to an insignificant risk of change in value.
F-76
Table of Contents
| 2.7 | Financial assets |
2.7.1 Classification
The Company classifies their financial assets in the following categories: at fair value through profit or loss and receivables. The Company does not have held-to-maturity and available-for-sale financial assets. The classification depends on the purpose for which the financial assets were acquired. Management determines the classification of financial assets on initial recognition.
| (a) | Financial assets at fair value through profit or loss |
Financial assets and financial liabilities measured at fair value through profit or loss are derivatives contracted to be held to maturity, designated as hedging instruments. All financial assets and financial liabilities in this category are classified as current assets and current liabilities.
| (b) | Receivables |
Receivables are non-derivative financial assets with fixed or determinable payments that are not quoted in an active market, and comprise “trade and other receivables”. They are included in current assets, except for those with maturities 12 months after the end of the reporting period, which are classified as noncurrent assets.
2.7.2 Recognition and measurement
Financial assets are recognized on the trade date – the date in which the Company undertakes to purchase or sell the asset. Loans and receivables are subsequently carried at amortized cost using the effective interest method.
Gains or losses arising from changes in the fair value of financial assets at fair value through profit or loss are presented in the income statement in “Finance income (costs)” when earned or incurred.
2.7.3 Impairment of financial assets
Assets stated at amortized cost
The Company assess on the balance sheet date whether there is objective evidence that a financial asset or group of financial assets is impaired. A financial asset or group of financial assets is impaired and impairment losses are incurred only if there is objective evidence of impairment as a result of one or more events that occurred after the initial recognition of the asset (a “loss event”) and such loss event (or events) affects the estimated future cash flows of the financial asset or group of financial assets that can be reliably estimated.
The criteria that the Company uses to determine whether there is objective evidence of an impairment loss include:
| (i) | significant financial difficulty of the issuer or debtor; |
| (ii) | a breach of contract, such as a default or delinquency in the payment of interest or principal; |
| (iii) | the Company, for economic or legal reasons arising from the borrower’s financial difficulty, grant to the borrower a concession that a lender would not otherwise consider; |
| (iv) | it becomes probable that the borrower will file for bankruptcy or other financial reorganization; |
| (v) | the disappearance of an active market for that financial asset because of financial difficulties; or |
F-77
Table of Contents
| (vi) | observable data indicating that there is a measurable decrease in the estimated future cash flows from a portfolio of financial assets since the initial recognition of those assets, although the decrease cannot yet be identified against the individual financial assets in the portfolio, including: |
| • | adverse changes in the payment status of borrowers in the portfolio; and |
| • | national or local economic conditions that correlate with defaults on the assets in the portfolio. |
The amount of any impairment loss is measured as the difference between the asset’s carrying amount and the present value of estimated future cash flows (excluding future credit losses that have not been incurred) discounted at the financial asset’s original effective interest rate. The carrying amount of the asset is reduced and the amount of the loss is recognized in the income statement. If a loan or held-to-maturity investment is subject to a variable interest rate, the discount rate for measuring an impairment loss is the current effective interest rate set out in the contract. As a practical measure, the Company may measure impairment on the basis of an instrument’s fair value using an observable market price.
If, in a subsequent period, the amount of the impairment loss decreases and the decrease can be related objectively to an event occurring after the impairment was recognized (such as an improvement in the debtor’s credit rating), the reversal of the previously recognized loss is recognized in the income statement.
| 2.8 | Derivative financial instruments and hedging activities |
Derivatives are initially recognized at fair value on the date a derivative contract is entered into and are subsequently remeasured at their fair value, with the changes in fair value charged against profit or loss.
Although the Company uses derivatives for hedging purposes, it does not apply the hedge accounting.
The fair values of derivative instruments are disclosed in Note 7.
| 2.9 | Trade receivables |
Trade receivables are amounts due from customers for sales in the ordinary course of business of the Company. If collection is expected in one year or less, they are classified as current assets. Otherwise, they are presented as noncurrent assets.
Trade receivables are initially stated at present value, less the allowance for doubtful accounts, which is recognized when there is objective evidence that the Company will not be able to recover all the amounts due on their original terms. The allowance for doubtful accounts corresponds to the difference between the carrying amount and the recoverable value. The present value is calculated based on the market rates (Interbank Deposit Certificate (CDI which as of December 31, 2013 was equivalent to 9,77% p.a. (6.90% p.a. as of December 31, 2012).
| 2.10 | Inventories |
Inventories are stated at the lower of cost and net realizable value. Cost is determined using the moving weighted average method. The cost of finished products and work in process comprise raw materials, direct labor, other direct costs and related overhead expenses (based on normal operating capacity), except for borrowing costs. Net realizable value is the estimated selling price in the ordinary course of business, less estimated implementation costs and selling expenses. Imports in transit are stated at the accumulated cost of each import.
F-78
Table of Contents
| 2.11 | Intangible assets |
| (a) | Goodwill |
Goodwill is measured at cost, represented by its carrying amount at the date of transition to IFRS, less accumulated impairment losses, if any.
The carrying amount of goodwill at the date of transition to IFRS was established on the acquisition or subscription of capital in another entity, represented by the cost of acquisition of the investment which exceeds the book value of the investment, calculated by applying the appropriate acquisition or capital subscription percentage on the investee’s equity amount.
In connection with the first time adoption of IFRS, beginning January 1, 2009, the Company no longer amortizes goodwill arising from investments acquired. Considering that goodwill continues to be amortized for tax purposes, the corresponding deferred tax effects are recorded on the portion of amortization deducted for tax purposes.
Goodwill is tested annually for impairment.
| (b) | Software |
Costs on the maintenance or development of software are recognized as an expense when incurred. Expenditures directly associated with identifiable and exclusive software, controlled by the Company and its subsidiaries, and which will probably generate economic benefits greater than the costs for over one year, are recognized as assets. Direct expenses include the compensation payable to the software development team and the appropriate portion of related general expenses.
Software development costs recognized as assets are amortized under the straight-line method over their useful lives, at the rates disclosed in Note 13.
| 2.12 | Property, plant and equipment |
Land, buildings and construction, machinery and equipment, industrial facilities and furniture and fixtures refer mainly to plants and offices and are stated at historical acquisition cost, adjusted for inflation through December 31, 1995, plus the deemed cost, in January 1, 2009.
Property, plant and equipment items are stated at their historical cost, less accumulated depreciation. The historical cost includes expenditures directly attributable to the acquisition of items and may also include financial charges on borrowings used to finance the construction of property, plant and equipment, which are capitalized over the period necessary to build and prepare the asset for the intended use.
Subsequent costs are included in the asset’s carrying amount or recognized as a separate asset, where appropriate, only when it is probable that future economic benefits associated with the item will flow to the Company and the item cost can be measured reliably. The carrying amount of replaced items or parts is derecognized. All other repairs and maintenance are charged to profit or loss, when incurred.
Land is not depreciated. Depreciation of other assets is calculated under the straight-line method to allocate their costs to their residual values over the estimated useful lives. The useful lives are listed in Note 14.
The residual values and useful lives of assets are reviewed and adjusted, if applicable, at the end of each reporting period.
The carrying amount of an asset is written down immediately to its recoverable amount its carrying amount is greater than its estimated recoverable amount (Note 2.13).
Gains and losses from sales are determined by comparing sales proceeds with the carrying amounts and recorded in line item “Other income (expenses), net” in the income statement.
F-79
Table of Contents
| 2.13 | Impairment of non-financial assets |
Assets with indefinite useful life, e.g. goodwill, are not amortized and are tested annually for impairment. Property, plant and equipment and other non-financial assets are tested annually for impairment, and also whenever events or changes in circumstances indicate that the carrying amount may not be recoverable. In this case, the recoverable value is calculated to determine if assets are impaired. An impairment loss is recognized at the amount by which the carrying amount of an asset exceeds its recoverable amount, which is the higher of net selling price or the value in use of an asset. For measurement purposes, assets are grouped at the lowest level for which there are separately identifiable cash flows.
| 2.14 | Trade payables |
Trade payables refer to amounts payable for goods or services acquired from suppliers in the ordinary course of business, classified as current liabilities if payment is due within one year or less (or in the regular course of business, even if longer). Otherwise, they are recorded as noncurrent liabilities.
Trade payables are initially recognized at fair value and subsequently measured at amortized cost using the effective interest method. In practice, they are usually recognized at the related invoice amount.
| 2.15 | Borrowings |
Borrowings are initially recognized at fair value, less transaction costs incurred and subsequently carried at amortized cost. Any difference between the amounts raised (less transaction costs) and the settlement amount is recognized in the income statement over the period borrowings are outstanding, using the effective interest method.
Borrowings are classified as current liabilities unless the Company has an unconditional right to defer settlement of the liability for at least 12 months after the reporting period.
| 2.16 | Provisions for tax, labor and civil risks |
Provisions are recognized when the Company has a present legal or constructive obligation as a result of past events, it is probable that an outflow of resources will be required to settle the obligation, based on the opinion of their legal counsel, and the amount can be reliably estimated.
| 2.17 | Current and deferred income tax and social contribution |
Income tax and social contribution expenses comprise current and deferred taxes, and are calculated based on the effective income tax and social contribution rates adjusted as prescribed in the prevailing tax laws. The offset of tax loss carry forwards is limited to 30% of taxable income in Brazil. Income taxes are recognized in the income statement, except to the extent that they relate to items recognized directly in comprehensive income or equity.
Deferred income tax and social contribution are recognized on tax loss carry forwards and the related temporary differences arising from differences between the tax bases of assets and liabilities and their carrying amounts in the financial statements. Deferred income tax and social contribution are calculated at the rates of 15% (plus a 10% surtax, where applicable) and 9%, respectively Brazil.
Deferred income tax and social contribution assets are recognized only to the extent that it is probable that future taxable income will be available against which temporary differences may be offset. Therefore, in order to support recognition, Management prepares annually a study about the utilization of these income-based taxes, based on internal assumptions and future economic scenarios.
For the subsidiary Providência USA Inc., current and deferred taxes are calculated at the rates of 32% for federal tax and 7% for state tax.
F-80
Table of Contents
| 2.18 | Employee benefits |
| (a) | Pension obligations |
The Company offers their employees a defined contribution private pension plan (Note 25), whose purpose is to accumulate funds that can become monthly income to supplement the Government Social Security benefit. The plan provides for the employee’s voluntary contributions, deducted from the employee payroll, and contributions made by the Company and its subsidiaries, which are recorded as personnel expenses, with a corresponding entry to current liabilities.
| (b) | Share-based payments |
The Company offers to executives and certain employees, a share-based compensation plan (“Stock Options”), which is duly approved by the Board of Directors ((Note 20.b), according to which the Company receives services in exchange for the stock options granted. The fair value of share options granted, calculated on the grant date, is recognized as an expense with a corresponding increase in equity, during the vesting period, to the extent services are provided.
| (c) | Profit sharing |
The Company recognizes a profit sharing liability and expense on accrual basis, in accordance with the compensation policy.
| 2.19 | Capital |
Ordinary shares are classified in equity. Incremental costs directly attributable to the issue of new shares or options are recorded in equity as a deduction from proceeds, net of taxes.
| 2.20 | Revenue recognition |
Revenue comprises the fair value of the consideration received or receivable for the sale of goods in the ordinary course of business of the Company. Revenue is stated net of taxes, returns, as well as after the elimination of intercompany sales. Revenue is recognized when:
| • | The significant risks and rewards of ownership of the products are transferred to the buyer; |
| • | The entity retains neither continuing managerial involvement to the degree usually associated with ownership nor effective control over the goods sold; |
| • | The amount of revenue can be measured reliably; |
| • | it is probable that the economic benefits associated with the transaction will flow to the entity; and |
| • | the costs incurred or to be incurred in respect of the transaction can be measured reliably |
Therefore, the Company recognizes revenues on the date the product is delivered to the buyer.
| 2.21 | Distribution of dividends |
Dividends declared to the Company’s stockholders are recognized as a liability in the financial statements, based on the Company’s bylaws. Any amount declared above the mandatory minimum dividend is only accrued on the date it is approved by shareholders at the General Meeting.
| 2.22 | New and revised IFRS issued but not yet effective |
The following standards issued were not yet effective on the issuance date of the financial statements. This list of standards and interpretations issued includes those which the Company reasonably expects to impact disclosures, financial condition or performance upon their application in the future. The Company intends to adopt such standards when they become effective.
IFRS 9 Financial Instruments – Classification and Measurement – IFRS 9 completes the first part of the project to supersede “IAS 39 Financial Instruments: Recognition and Measurement”. IFRS 9 uses a simple approach to determine whether a financial asset is stated at amortized cost or fair value, based
F-81
Table of Contents
on how an entity manages its financial instruments (its business model) and contractual cash flows underlying the financial assets. The standard also requires the adoption of only one method to determine asset impairment. This standard is effective for years beginning January 1, 2015, and the Company does not expect any significant effect as a result of its adoption.
IASB issued clarifications on the standards and amendments to IFRS. Below are the main amendments:
IAS 32 – Financial Instruments – Presentation: provides clarifications on the offset between financial assets and financial liabilities, whose amendment is effective for years beginning on or after January 1, 2014, and the Company does not expect any significant effect as a result of its adoption.
There are no other standards and interpretations issued and not yet adopted that can significantly impact the profit or loss or equity reported by the Company, based on Management’s opinion.
| 3 | CRITICAL ACCOUNTING ESTIMATES AND JUDGMENTS |
Accounting estimates and judgments are continually assessed and are based on historical experience and other factors, including expected future events that are believed to be reasonable under the circumstances.
| 3.1 | Critical accounting estimates and assumptions |
Based on assumptions, the Company makes forward-looking estimates. By definition, the resulting accounting estimates will are rarely equal to actual results.
The estimates and assumptions that present a significant risk of causing a material adjustment to the carrying amounts of assets and liabilities in the next year are discussed below.
| (a) | Estimated impairment of goodwill |
The Company tests annually whether goodwill is impaired, in accordance with the accounting policy stated in Note 2.11. The recoverable amounts of cash-generating units (CGUs) were determined based on the value-in-use, which is calculated based on estimates (Note 13).
Management believes that probable additional changes in the main assumptions on which the recoverable amounts are based would not cause its carrying amount to exceed the recoverable amount.
| (b) | Income tax, social contribution and other taxes |
The Company recognizes deferred tax assets and liabilities based on the differences between the carrying amount presented in the financial statements and the tax basis of assets and liabilities using effective tax rates. The Company also recognizes provisions as a result of circumstances where it is probable that additional taxes will be due. When the final tax outcome of these issues is different from the amounts that were initially estimated and recorded, such differences will impact current and deferred income tax assets and liabilities in the period in which such determination is made.
The Company reviews on a regular basis the possibility of recovery of their deferred tax assets, taking into account the historical profit generated and the projected future taxable income, based on a recoverability study.
| (c) | Fair value of derivatives and other financial instruments |
The Company assesses the fair value of financial instruments using available information and valuation methodologies set by Management. However, both the interpretation of market data and the selection of valuation methodologies require considerable judgment and reasonable estimates to produce the most appropriate realizable value. Consequently, the estimates presented in Note 7 are not necessarily indicative of the amounts that can be realized in the current market. The use of different market assumptions and/or estimation methodologies may have a material effect on the estimated realizable values.
F-82
Table of Contents
| (d) | Provisions for tax, labor and civil risks |
The Company is party to several administrative proceedings and lawsuits, as described in Note 18. Consequently, it recognizes provisions for all risks on lawsuits and administrative proceedings with respect to which the likelihood of loss is assessed as probable and which the amount of the loss can be reliably estimated. The assessment of the likelihood of loss includes the analysis of available evidence, the hierarchy of laws, the applicable case law, most recent decisions issued by the courts and their relevance within the legal system, as well as the opinion of the outside legal counsel. The Company believes that the provisions for tax, civil and labor risks are properly presented in the financial statements.
| (e) | ICMS tax incentives |
The Company has State VAT (ICMS) tax incentives granted by the government of the State of Paraná and by the government of the State of Minas Gerais. The Federal Supreme Court (STF) handed down decisions in Direct Actions, declaring the unconstitutionality of several state laws that granted ICMS tax incentives without previous agreement between the States.
Despite the fact that the Company does not have ICMS tax incentives covered by the decision handed down by the STF, it consulted its legal counsel, who issued an opinion on the matter, based on which the Company believes that it does not meet the criteria under IAS 37 for the recognition of a liability.
| 4 | FINANCIAL RISK MANAGEMENT |
| 4.1 | Financial risk factors |
The Company has a Risk Management Committee, designated by the Board of Directors, to assist it and is responsible for defining the policy and managing the risks and the financial instruments using control systems that set currency limits and interest exposures and identify financial institutions where Company’s cash and short-term investment funds will be invested in. The carrying amount of all financial instruments, including derivatives, as well as the results obtained compared to the proposed goals, are presented to and analyzed monthly by the Risk Management Committee and submitted to the approval of the Company’s Board of Directors.
Among the procedures defined by the current policy, the Company adopts monthly routines that enable it to project and assess currency exposure since it has transactions and debts in the foreign market and is exposed to these risks.
| (a) | Market risk |
| (i) | Currency and interest rate risk |
The Company is exposed to market risks related to adverse changes in interest and foreign exchange rates, 9% of the indebtedness is pegged to local currency and subject to variable and fixed interest rates, and the remaining 91% is indexed to the LIBOR (London Interbank Offered Rate) and SIFMA (Securities Industry and Financial Markets Association). A significant portion of revenues (30%) derives from sales in foreign markets and is equally exposed to fluctuations in exchange rates.
A portion of the indebtedness is indexed to the Interbank Deposit Certificate (CDI) and is, therefore, subject to variable interest rates. The financial result is partially affected by changes in the benchmark interest rate (Special System for Settlement and Custody (SELIC).
Financial instruments are stated at amortized cost, which approximate their fair values.
F-83
Table of Contents
The table below shows the Company’s foreign currency exposure.
| Consolidated | ||||||||||||||||
| December 31, 2013 | December 31, 2012 | |||||||||||||||
| R$ mil | USD mil | R$ mil | USD mil | |||||||||||||
| Assets: |
||||||||||||||||
| Trade receivables |
85,958 | 36,693 | 74,514 | 36,464 | ||||||||||||
| Liabilities: |
||||||||||||||||
| Trade payables |
(2,989 | ) | (1,276 | ) | (5,594 | ) | (2,737 | ) | ||||||||
| Borrowings and financing |
(540,393 | ) | (230,681 | ) | (485,153 | ) | (237,413 | ) | ||||||||
|
|
|
|
|
|
|
|
|
|||||||||
| Liability exposure |
(543,382 | ) | (231,957 | ) | (490,747 | ) | (240,150 | ) | ||||||||
|
|
|
|
|
|
|
|
|
|||||||||
| Net exposure |
(457,424 | ) | (195,264 | ) | (416,233 | ) | (203,686 | ) | ||||||||
|
|
|
|
|
|
|
|
|
|||||||||
The Company invests in foreign operations, whose net assets are exposed to the currency risk. Currency exposure arising from the investment in foreign operations is hedged mainly through borrowings denominated in the same currency as these investments.
Sensitivity to the foreign exchange rate – The impacts arising from a fluctuation by 25% and 50% in the reasonable possible scenario of the U.S. dollar exchange rate for each financial instrument exposed are as follows:
| Risk |
(-) 50 % | (-) 25 % | Reasonable possible scenario |
(+) 25 % | (+) 50 % | |||||||||||||||||
| Foreign exchange rate |
Dollar | 1.2250 | 1.8375 | 2.4500 | 3.0625 | 3.6750 | ||||||||||||||||
| Trade receivables |
Dollar | (41,009 | ) | (18,535 | ) | 3,940 | 26,414 | 48,889 | ||||||||||||||
| Borrowings |
Dollar | 257,809 | 116,517 | (24,775 | ) | (166,068 | ) | (307,360 | ) | |||||||||||||
| Trade payables |
Dollar | 1,426 | 644 | (137 | ) | (919 | ) | (1,700 | ) | |||||||||||||
|
|
|
|
|
|
|
|
|
|
|
|||||||||||||
| Gains or Losses |
218,226 | 98,626 | (20,972 | ) | (140,573 | ) | (260,171 | ) | ||||||||||||||
|
|
|
|
|
|
|
|
|
|
|
|||||||||||||
In addition to the sensitivity analysis presented above, the Company measures its financial instruments considering the reasonable possible effects in profit or loss and equity against the risks assessed by the Company’s management at the end of the reporting period. Based on the financial position as of December 31, 2013, it is estimated that these effects would approximate the amounts disclosed in the reasonable possible scenario column of the table above, as the assumptions used by the Company approximate those described above.
Sensitivity to the interest rate – The impacts of a 25% and 50% fluctuation of interest rates on profit or loss in the reasonable possible scenario of indexes (CDI/LIBOR6) in the 12-month period are described below:
| Risk | (-) 50 % | (-) 25 % | Reasonable possible scenario |
(+) 25 % | (+) 50 % | |||||||||||||||||||
| Rates |
CDI/Selic | 5.25 | 7.88 | 10.5 | 13.13 | 15.75 | ||||||||||||||||||
| Rates |
LIBOR6 | 0.17 | 0.26 | 0.35 | 0.44 | 0.52 | ||||||||||||||||||
| Short-term investments |
CDI/Selic | 2,857 | 4,338 | 5,855 | 7,408 | 8,999 | ||||||||||||||||||
| Borrowings and financing |
LIBOR6 | (9,355 | ) | (9,680 | ) | (9,991 | ) | (10,293 | ) | (10,600 | ) | |||||||||||||
|
|
|
|
|
|
|
|
|
|
|
|||||||||||||||
| Loss |
(6,498 | ) | (5,342 | ) | (4,136 | ) | (2,885 | ) | (1,601 | ) | ||||||||||||||
|
|
|
|
|
|
|
|
|
|
|
|||||||||||||||
In addition to the sensitivity analysis presented above, the Company measures its financial instruments considering the reasonable possible effects on profit or loss and equity against the risks assessed by the Company’s management at the end of the reporting period. Based on the financial position of outstanding short-term investments and borrowings and financing
F-84
Table of Contents
as of December 31, 2013, it is estimated that these effects would be close to the amounts disclosed in the reasonable possible scenario column of the table above, as the assumptions used by the Company are close to those described above.
| (ii) | Derivative transactions |
The Company carries out transactions in the foreign market and are exposed to market risks arising from fluctuations in foreign currencies and interest rates. The exposure to the risk arising from future payments in local currency of liabilities linked to the foreign exchange market is hedged mainly by the portfolio of trade receivables from export sales or realized by the Company.
The Company also carries out transactions with derivatives pegged to foreign currencies, mainly the U.S. dollar, for hedging purposes (hedge against possible interest and exchange rate fluctuations), based on the guidelines set in the Market Risk Management Policy approved by the Board of Directors and implemented by the Risk Management Committee.
The objective of the Market Risk Management Policy is basically to hedge at least 75% of the Company’s short-term cash flow for defined periods ranging from 9 to 12 months, primarily through traditional market transactions, such as, for example, Non-Deliverable Forward (NDF) contracts, options and the dollar futures on the Brazilian Commodities & Futures Exchange (BM&F), defining limits by type of transaction and counterparty.
In order to measure the effects of the fluctuations in the indices and rates linked to derivative transactions, the Company prepared the sensitivity analysis table below, including a scenario considered as reasonable possible by the Company’s management, a situation considered possible of at least 25% reduction in the variables used, and a situation considered remote of at least 50% reduction in the risk variables:
Sensitivity analysis table
| Transaction |
Risk |
(-) 50 % | (-) 25 % | Reasonable possible scenario |
(+) 25 % | (+) 50 % | ||||||||||||||||
| Swap US$ x CDI |
CDI fluctuation | (19,243 | ) | (5,981 | ) | 7,590 | 21,453 | 35,591 | ||||||||||||||
| Currency forward (NDF) |
US$ fluctuation | (12,318 | ) | (5,232 | ) | 1,847 | 8,940 | 16,026 | ||||||||||||||
|
|
|
|
|
|
|
|
|
|
|
|||||||||||||
| Gain (loss) |
(31,561 | ) | (11,213 | ) | 9,437 | 30,393 | 51,617 | |||||||||||||||
|
|
|
|
|
|
|
|
|
|
|
|||||||||||||
The amounts in the sensitivity analysis table were determined considering the U.S. dollar curve and the future U.S. dollar quotations published by the BM&F. Based on these rates, the Company applied the reduction percentages in accordance with each scenario, projected the cash flows up through to the maturity of transactions and discounted them through the balance sheet date.
This analysis was only considered for purposes of compliance with the prevailing legislation in Brazil for public companies (CVM 475/08), since the Company carries out derivative transactions only for hedging purposes and elimination of the effects of currency and interest rate fluctuations, which are not used for speculative purposes.
In addition to the sensitivity analysis, the Company measures its financial instruments considering the reasonable possible effects on profit or loss and equity against the risks assessed by the Company’s management at the end of the reporting period. Based on the financial position and notional amount of outstanding derivatives as of December 31, 2013, it is estimated that these effects would approximate the amounts disclosed in the reasonable possible scenario column of the table above, as the assumptions used by the Company approximate those described above.
The Company has no exotic derivative agreements outstanding as of December 31, 2013 and 2012.
F-85
Table of Contents
| (b) | Credit risk |
The Company’s sales policy is closely related to the Credit Policy established by the Company and to the level of credit risk which it is willing to accept in the course of its business. To minimize possible default, the Company diversifies its receivables portfolio, selects customers, and monitors sales terms and individual credit limits, and requires collaterals.
The credit quality of financial assets that are neither past due nor impaired can be assessed by reference to external credit ratings or to historical information about default rates for counterparties.
Trade receivables: the credit risk of customers is subject to the procedures, controls and policies established by the Company for this purpose. Credit limits are set for all customers based on internal classification criteria. The amounts classified in Group 1 refer to customers with no default in the past. The amounts in Group 2 refer to defaulting customers in the past, i.e., those which on any time were included in the criteria for recognition of allowance for doubtful accounts.
| December 31, 2013 |
December 31, 2012 |
|||||||
| Trade receivables |
||||||||
| Group 1 |
175,662 | 144,308 | ||||||
| Group 2 |
5,147 | 3,947 | ||||||
|
|
|
|
|
|||||
| 180,809 | 148,255 | |||||||
Cash and cash equivalents: the credit risk of balances with banks and other financial institutions is managed by the treasury area according to the policy established.
| Bank account, deposits and short-term investments |
December 31, 2013 |
December 31, 2012 |
||||||
| brAAA |
43,742 | 56,536 | ||||||
| brAA |
7,380 | |||||||
| brA+f |
6,436 | 8,022 | ||||||
| brA |
7,579 | 7,036 | ||||||
| AA- |
6,493 | 5,171 | ||||||
|
|
|
|
|
|||||
| 64,250 | 84,145 | |||||||
|
|
|
|
|
|||||
Source: Standard & Poor’s and Fitch Ratings
| (c) | Liquidity risk |
Cash flow is projected in the operating entities consolidated by the Company’s Finance Department. The liquidity risk management of the Company, which is Management’s responsibility, monitors rolling forecasts of the liquidity requirements of the Company to ensure they have sufficient cash to meet operating needs.
Surplus cash held by the operating entities, in addition to the balance required for working capital management, is invested in short-term instruments, in order to offer maximum liquidity and cover disbursements.
F-86
Table of Contents
The table below analyzes the consolidated non-derivative financial assets and liabilities and derivative financial assets and liabilities to be settled by the Company, according to relevant maturity dates, corresponding to the remaining period in the balance sheet through the contractual maturity date. Derivative financial liabilities are included in the analysis if their contractual maturities are essential for an understanding of the timing of the cash flows. The amounts disclosed in the table are the contractual undiscounted cash flows.
| Up to 1 month |
1 to 3 months |
3 months to 1 year |
1 to 5 years |
Over 5 years |
Total | |||||||||||||||||||
| At December 31, 2013 |
||||||||||||||||||||||||
| Assets |
||||||||||||||||||||||||
| Cash and cash equivalents |
64,250 | 64,250 | ||||||||||||||||||||||
| Derivative financial instruments |
24,674 | 24,674 | ||||||||||||||||||||||
| Trade receivables |
70,023 | 88,430 | 19,369 | 2,987 | 180,809 | |||||||||||||||||||
| Escrow deposits |
372 | 372 | ||||||||||||||||||||||
|
|
|
|
|
|
|
|
|
|
|
|
|
|||||||||||||
| 158,947 | 88,430 | 19,369 | 3,359 | 270,105 | ||||||||||||||||||||
| Liabilities: |
||||||||||||||||||||||||
| Trade payables |
(50,886 | ) | (9,089 | ) | (59,975 | ) | ||||||||||||||||||
| Borrowings and financing |
||||||||||||||||||||||||
| – Floating rates |
(1,192 | ) | (14,783 | ) | (37,369 | ) | (294,403 | ) | (104,082 | ) | (451,829 | ) | ||||||||||||
| – Fixed rates |
(5 | ) | (14,861 | ) | (16,632 | ) | (154,264 | ) | (21,844 | ) | (207,606 | ) | ||||||||||||
|
|
|
|
|
|
|
|
|
|
|
|
|
|||||||||||||
| (52,083 | ) | (38,733 | ) | (54,001 | ) | (448,667 | ) | (125,926 | ) | (719,410 | ) | |||||||||||||
| 106,864 | 49,697 | (34,632 | ) | (445,308 | ) | (125,926 | ) | (449,305 | ) | |||||||||||||||
|
|
|
|
|
|
|
|
|
|
|
|
|
|||||||||||||
Derivatives are managed based on net fair value. These derivatives include interest rate swaps, non-deliverable forward and e U.S. dollar option contracts used by the Company to manage the consolidated interest rate profile.
| 4.2 | Capital management |
The objectives of the Company in managing capital are to safeguard their ability to continue as going concerns in order to offer returns to shareholders and security to other stakeholders and to maintain an efficient capital structure.
Capital management is monitored using the debt/capitalization ratio, whose objective is to maintain a ratio equal to or lower than 0.65. As of December 31, 2013, this ratio was 0.47 (0.44 as of December 31, 2012), which demonstrates that the Company’s capital structure is maintained within the preset limits. The table below shows the calculation:
| December 31, 2013 |
December 31, 2012 |
|||||||
| Total borrowings balance (note 16) |
590,930 | 535,707 | ||||||
| Equity balance |
665,550 | 689,977 | ||||||
|
|
|
|
|
|||||
| Capitalization |
1,256,480 | 1,225,684 | ||||||
| Total debt / capitalization |
||||||||
| Total debt |
0.47 | 0.44 | ||||||
| 4.3 | Fair value estimation |
The carrying amounts of trade receivables (net of allowance for doubtful accounts) and payables approximate their fair values. The fair values of financial liabilities for disclosure purposes are estimated by discounting the future contractual cash flows at the current market interest rate available to the Company for similar financial instruments, as disclosed in Note 16.
F-87
Table of Contents
The Company categorize its financial instruments measured at fair value through profit or loss, according to the following hierarchy levels:
Level 1 – prices quoted (unadjusted) in active markets for identical assets or liabilities. This level does not apply to the Company as of December 31, 2013;
Level 2 – inputs other than prices quoted in active markets included in Level 1 that are observable for an asset or liability, either directly or indirectly; and
Level 3 – techniques using input with significant effects on the fair value recorded that are not based on observable market inputs. This level does not apply to the Company as of December 31, 2013.
| December 31, 2013 |
December 31, 2012 |
|||||||
| Level 2 | Level 2 | |||||||
| Current assets |
||||||||
| Cash and cash equivalents |
||||||||
| Fair value through profit or loss |
64,250 | 84,145 | ||||||
|
|
|
|
|
|||||
| 64,250 | 84,145 | |||||||
|
|
|
|
|
|||||
| Derivative financial assets |
||||||||
| Derivative financial instruments |
24,674 | 10,708 | ||||||
|
|
|
|
|
|||||
| 24,674 | 10,708 | |||||||
|
|
|
|
|
|||||
| Total current assets |
88,924 | 94,853 | ||||||
|
|
|
|
|
|||||
The Company did not transfer assets or liabilities between the hierarchy levels of fair value for the years ended December 31, 2013 and December 31, 2012.
| 5 | FINANCIAL INSTRUMENTS BY CATEGORY |
| December 31, 2013 |
December 31, 2012 |
|||||||
| Cash and cash equivalents |
||||||||
| Banks and short-term investments |
64,250 | 84,145 | ||||||
|
|
|
|
|
|||||
| 64,250 | 84,145 | |||||||
|
|
|
|
|
|||||
| Financial assets |
||||||||
| Loans and receivables: |
||||||||
| Trade receivables |
180,809 | 148,255 | ||||||
| Related parties |
||||||||
| Escrow deposits |
372 | 56 | ||||||
|
|
|
|
|
|||||
| 181,181 | 148,311 | |||||||
|
|
|
|
|
|||||
| Fair value through profit or loss: |
||||||||
| Derivative financial instruments |
24,674 | 10,708 | ||||||
|
|
|
|
|
|||||
| 24,674 | 10,708 | |||||||
|
|
|
|
|
|||||
| Total assets |
270,105 | 243,164 | ||||||
|
|
|
|
|
|||||
| Financial liabilities |
||||||||
| Stated at amortized cost: |
||||||||
| Trade payables |
59,975 | 43,390 | ||||||
| Borrowings and financing |
590,930 | 535,707 | ||||||
|
|
|
|
|
|||||
| Total liabilities |
650,905 | 579,097 | ||||||
|
|
|
|
|
|||||
F-88
Table of Contents
| 6 | CASH AND CASH EQUIVALENTS |
The balance of line item ‘Cash and cash equivalents’ includes cash held by the Company. At the end of the reporting period, this balance, as recorded in the statement of cash flows, may be reconciled with the related balance sheet items, as shown below:
| December 31, 2013 |
December 31, 2012 |
|||||||
| Banks and cash on hand |
11,124 | 11,475 | ||||||
| Short-term investment funds |
53,126 | 72,670 | ||||||
|
|
|
|
|
|||||
| Cash and cash equivalents in the balance sheet |
64,250 | 84,145 | ||||||
|
|
|
|
|
|||||
Short-term investment funds comprise mainly of investment funds, whose investment portfolios are comprised basically of highly liquid investments in federal government bonds, repurchase transactions and Bank Certificates of Deposit (CDB), yielding average interest of 102% (102% as of December 31, 2012) of the Interbank Deposit Certificate (CDI) fluctuation. The Company does not invest in exclusive investment funds.
| 7 | DERIVATIVE FINANCIAL INSTRUMENTS |
| Assets | ||||||||
| December 31, 2013 |
December 31, 2012 |
|||||||
| Interest rate swaps (a) |
21,571 | 9,696 | ||||||
| Foreign exchange forwards contracts (b) |
1,487 | 311 | ||||||
| U.S. dollar option contracts (c) |
1,616 | 701 | ||||||
|
|
|
|
|
|||||
| Current portion |
24,674 | 10,708 | ||||||
|
|
|
|
|
|||||
The fair values of derivatives were calculated by the Company and represent the exit price on the balance sheet date. Consequently, the fair values calculated are only valid on the dates of the consolidated information and may be subject to subsequent changes due to changes in market variables in the future, in particular with respect to fluctuations in exchange rates.
The financial derivatives entered into by the consolidated companies do not require margin call, and amounts are only increased or reduced on the established dates.
| (a) | Interest rate swaps – CDI x US$ and LIBOR6 floating x fixed |
The notional amounts of the interest rate swap contracts outstanding as of December 31, 2013 total R$167,294 (R$129,133 as of December 31, 2012).
In order to hedge its liability exposures (CDI and LIBOR interest rates) from borrowings and financing, the Company entered into swap contracts, traded in Bolsa de Mercadorias e Futuros – BM&F and registered with CETIP, whose balances and conditions are as follows:
| • | Banco Itaú: US$52,4 million – Company receives in US$ + 4.85% p.a. and pays in CDI + 1.7% p.a., maturing on a semiannual basis through September 2018; and, |
| • | Banco Itaú: R$50 million – Company receives in R$ + 8% p.a., and pays in 98.70% of CDI p.a., maturing on a quarterly basis through February 2016. |
| (b) | Forward foreign exchange contracts: |
The notional amounts of the outstanding forward foreign exchange contracts outstanding as of December 31, 2013 total R$28,147 (R$25,330 as of December 31, 2012).
F-89
Table of Contents
In order to hedge against the volatility of liability exposures in U.S. dollars, arising from the total exposure (cash flows) through December 31, 2013, the Company entered into Non-Deliverable Forward contracts in U.S. dollars, in the following amounts and conditions:
| • | Banco HSBC: US$1,7 million – long position in U.S. dollars, strike rate of R$2.0810, maturing on January 15, 2014; |
| • | Banco Santander: US$1,0 million – long position in U.S. dollars, strike rate of R$2.2794, maturing on March 17, 2014; |
| • | Banco Itaú BBA: US$2,8 million – long position in U.S. dollars, strike rate of R$2.4748, maturing on September 15, 2013; |
| • | Banco Bradesco: US$4 million – long position in U.S. dollars, strike rate of R$2.4126, maturing on June 16, 2014; July 15, 2014; August 15, 2014 and |
| • | Banco BTG: US$2,5 million – long position in U.S. dollars, strike rate of R$2.1240, maturing on February 17, 2014. |
| (c) | U.S. dollar call option contracts: |
The notional values of the U.S. dollar call option contracts outstanding as of December 31, 2013 total R$27,713 (R$30,905 as of December 31, 2012). Total premium paid was R$163.
In order to hedge against the volatility of the liability exposures in U.S. dollar, arising from the total exposure (cash flows) through December 31, 2013, the Company entered into call option contracts in U.S. dollars in the following amounts and conditions:
| • | Banco Votorantim: US$3,1 million – call option at the rate of R$2.3617, maturing on April 15, 2014 and July 15, 2014; premium paid: R$317 thousand; |
| • | Banco Itaú: US$5 million – call option at the rate of R$2.4447, maturing on May 15, 2014; June 16, 2014 and August 15, 2014; premium paid: R$554 thousand; |
| • | Banco Bradesco: US$1,8 million – call option at the rate of R$2.1240, maturing on February 17, 2014; premium paid: R$132 thousand; and |
| • | Banco Citibank: US$1,9 million – call option at the rate of R$2.1929, maturing on January 15, 2014 and March 17, 2014; premium paid: R$161 thousand. |
| 8 | TRADE RECEIVABLES |
| December 31, 2013 |
December 31, 2012 |
|||||||
| Trade receivables – domestic customers |
99,840 | 78,307 | ||||||
| Trade receivables – foreign customers |
86,187 | 75,050 | ||||||
| Allowance for doubtful accounts – domestic customers |
(4,989 | ) | (4,566 | ) | ||||
| Allowance for doubtful accounts – foreign customers |
(229 | ) | (536 | ) | ||||
|
|
|
|
|
|||||
| Trade receivables, net |
180,809 | 148,255 | ||||||
|
|
|
|
|
|||||
| Current portion |
177,822 | 144,059 | ||||||
| Noncurrent portion |
2,987 | 4,196 | ||||||
As of December 31, 2013, the average days sales outstanding is 73 days (81 days as of December 31, 2012). The Company recognized an allowance for doubtful accounts for all domestic trade receivables past-due over 90 days. For foreign trade receivables, the allowance for doubtful accounts relies on the analysis of the current financial condition and the economic and political environment in the country where each borrower is located.
F-90
Table of Contents
The aging list of trade receivables is as follows:
| December 31, 2013 |
December 31, 2012 |
|||||||
| Current |
174,109 | 139,239 | ||||||
| Up to 60 days past-due |
4,996 | 6,960 | ||||||
| 61 to 90 days past-due |
630 | 181 | ||||||
| Over 90 days past-due |
6,292 | 6,977 | ||||||
|
|
|
|
|
|||||
| Total |
186,027 | 153,357 | ||||||
|
|
|
|
|
|||||
| Allowance for doubtful accounts |
(5,218 | ) | (5,102 | ) | ||||
|
|
|
|
|
|||||
| Total |
180,809 | 148,255 | ||||||
|
|
|
|
|
|||||
The changes in the allowance for doubtful accounts were as follows:
| December 31, 2013 |
December 31, 2012 |
|||||||
| Opening balance |
(5,102 | ) | (4,144 | ) | ||||
| Provision for doubtful accounts |
(946 | ) | (1,506 | ) | ||||
| Recoveries, net of writte-offs |
830 | 548 | ||||||
|
|
|
|
|
|||||
| Closing balance |
(5,218 | ) | (5,102 | ) | ||||
The recognition and derecognition of the allowance for doubtful accounts were recorded in “Selling expenses” in the income statement. Amounts charged to the allowance for doubtful account are generally written off when there is no expectation of recovering the accounts.
The maximum exposure to credit risk on the reporting period is the carrying amount of each type of receivables mentioned above.
| 9 | INVENTORIES |
| December 31, 2013 |
December 31, 2012 |
|||||||
| Raw materials |
15,760 | 8,616 | ||||||
| Auxiliary raw materials |
10,470 | 10,209 | ||||||
| Work in process |
1,116 | 1,958 | ||||||
| Finished products |
20,903 | 20,534 | ||||||
| Storeroom supplies |
15,870 | 10,900 | ||||||
| Goods in transit |
112 | |||||||
|
|
|
|
|
|||||
| Total |
64,119 | 52,329 | ||||||
|
|
|
|
|
|||||
Management expects inventories to be consumed within a period of less than 12 months.
| 10 | RECOVERABLE TAXES |
| December 31, 2013 | December 31, 2012 | |||||||||||||||
| Current assets |
Noncurrent assets |
Current assets |
Noncurrent assets |
|||||||||||||
| State VAT (ICMS) |
10,936 | 592 | 12,388 | 3,122 | ||||||||||||
| Federal VAT (IPI) |
6,241 | 3,355 | ||||||||||||||
| Tax on revenue (COFINS) |
19,672 | 4,817 | 12,202 | 14,975 | ||||||||||||
| Tax on revenue (PIS) |
4,345 | 1,049 | 2,724 | 1,415 | ||||||||||||
| Prepayments of income tax and social contribution |
1,456 | 86 | 6,303 | 82 | ||||||||||||
| Withholding income tax (IRRF) |
2,338 | 1,043 | 6,209 | 1,034 | ||||||||||||
|
|
|
|
|
|
|
|
|
|||||||||
| Total |
44,988 | 7,587 | 43,181 | 20,628 | ||||||||||||
|
|
|
|
|
|
|
|
|
|||||||||
F-91
Table of Contents
Current ICMS credits arise from purchase of raw materials consumed on production sold to foreign countries. The Company files qualification/accreditation processes with the State Government of Paraná, to subsequently trade (sale) and/or use them as part of the payment of the electric energy bill.
Noncurrent ICMS credits arise from the purchase of property, plant and equipment items which are realizable within 48 months, pursuant to prevailing regulations.
PIS/COFINS credits refer to taxes paid when importing a new machine, whose credits can be offset against with future PIS/COFINS payables.
As of December 31, 2013, the period covered originally under the Special Regime for Recovery of Exporting Company Tax Amounts (REINTEGRA), introduced by Decree 7633/2011 and extended by MP 601/2012, ended. In 2013 the Company recorded R$6,410 (R$5,679 in 2012) relating to credits obtained through this tax grant, of which part will be received in cash in 2014 through a reimbursement request and the outstanding balance will be offset against other federal taxes.
| 11 | DEFERRED INCOME TAX AND SOCIAL CONTRIBUTION ASSETS |
The Company adopted the Transitional Tax Regime (RTT) introduced by Law 11941/09, according to which corporate income tax (IRPJ), social contribution (CSLL), taxes on revenues (PIS and COFINS) for fiscal years 2008 and 2009 continue to be calculated based on the accounting methods and criteria prescribed by Law 6404, of December 15, 1976, effective as of December 31, 2007. Accordingly, deferred income tax and social contribution calculated on the adjustments arising from the adoption of the new accounting practices introduced by Law 11638/07 and Law 11941/09 (laws that regulated in Brazil the transition to IFRS) were recorded in the Company’s financial statements, when applicable, in conformity with IAS 12. The Company elected such option in the Corporate Income Tax Return (DIPJ) on June 30, 2011.
F-92
Table of Contents
The balances of deferred income tax and social contribution credits on tax loss carry forwards and temporary differences are as follows:
| December 31, 2013 |
December 31, 2012 |
|||||||
| Income tax and social contribution assets – Companhia Providência Indústria e Comércio |
||||||||
| Income tax and social contribution |
||||||||
| Accumulated tax losses |
233,715 | 200,661 | ||||||
| Income tax and social contribution rate |
34 | % | 34 | % | ||||
| Deferred income tax and social contribution credits on tax losses |
79,463 | 68,224 | ||||||
| Deferred income tax and social contribution credits on goodwill arising from downstream merger |
56,750 | 75,666 | ||||||
|
|
|
|
|
|||||
| Total deferred income tax and social contribution assets – Companhia Providência Indústria e Comércio |
136,213 | 143,890 | ||||||
|
|
|
|
|
|||||
| Income tax – Providência USA Inc |
||||||||
| Accumulated tax losses |
6,948 | 9,590 | ||||||
| Federal tax (32% rate) |
2,223 | 3,069 | ||||||
| State tax – North Carolina (rate of 7%) |
486 | 671 | ||||||
| Exchange gain on foreign currency translation |
984 | 487 | ||||||
|
|
|
|
|
|||||
| Total deferred income tax asset – Providência USA Inc. |
3,693 | 4,227 | ||||||
|
|
|
|
|
|||||
| Total deferred income and social contribution tax assets |
139,906 | 148,117 | ||||||
|
|
|
|
|
|||||
| Income tax and social contribution liabilities |
||||||||
| Income tax |
||||||||
| Deemed cost of property, plant and equipment |
(221,843 | ) | (237,212 | ) | ||||
| Temporary differences* |
(80,374 | ) | (56,073 | ) | ||||
|
|
|
|
|
|||||
| (302,217 | ) | (293,285 | ) | |||||
| Income tax rate |
25 | % | 25 | % | ||||
| Deferred income tax debts on deemed cost and temporary differences |
(75,554 | ) | (73,320 | ) | ||||
| Social contribution |
||||||||
| Deemed cost of property, plant and equipment |
(221,843 | ) | (237,212 | ) | ||||
| Temporary differences* |
(78,951 | ) | (54,650 | ) | ||||
| (300,794 | ) | (291,862 | ) | |||||
| Social contribution rate |
9 | % | 9 | % | ||||
| Deferred social contribution debts on deemed cost and temporary differences |
(27,071 | ) | (26,268 | ) | ||||
| Total deferred income tax and social contribution – liabilities |
(102,627 | ) | (99,588 | ) | ||||
| Total deferred income tax and social contribution, net |
37,279 | 48,529 | ||||||
| * | The balance of temporary differences is basically comprised of: difference on depreciation recognized for tax purposes and depreciation recognized in the accounting records according to the useful lives of property, plant and equipment items (Law 11638, art.1, § 7), allowance for doubtful accounts, accrued profit sharing and foreign currency changes recognized on the accrual basis. |
F-93
Table of Contents
The realization of deferred income tax and social contribution are broken down by year as follows:
| December 31, 2013 |
December 31, 2012 |
|||||||
| Through December 2014 |
22,770 | 19,306 | ||||||
| From January 2015 to December 2015 |
21,215 | 22,858 | ||||||
| From January 2016 to December 2016 |
23,169 | 24,221 | ||||||
| From January 2017 to December 2017 |
9,421 | 25,834 | ||||||
| From January 2018 to December 2020 |
63,331 | 55,898 | ||||||
|
|
|
|
|
|||||
| 139,906 | 148,117 | |||||||
|
|
|
|
|
|||||
Deferred income tax and social contribution assets, arising from tax loss carry forwards and temporary differences, are recognized to the extent that is probable that future taxable profit will be available, supported by projections using internal assumptions and future economic scenarios, which may, therefore, change, as approved by the Board of Directors.
Deferred income tax and social contribution assets on goodwill arising from downstream merger refers to tax effects of the reversed merger into the Company in February 2007 of Alnilan S.A., an investment vehicle used in the acquisition of Companhia Providência Indústria e Comércio, which recognized goodwill from such acquisition. As an investment vehicle Alnilan S.A. was not considered the accounting acquirer. As such, following the regulation prescribed by CVM Instruction 319/99 and CVM Instruction 349/2001, when going public in July 2007, the Company wrote off the goodwill merged by means of a full provision, and recognized the related deferred income tax and social contribution credit. For accounting and tax purposes, the goodwill and the related provision were amortized on a straight-line basis at the rate of 10% per annum through December 31, 2008.
Beginning January 1, 2009, as a result of the changes introduced by Law 11638/07 and Law 11941/09 and the adoption of IFRS, the goodwill arising from the merger and the related provision were no longer amortized for accounting purposes. Therefore, the amounts corresponding to the deferred income tax and social contribution benefits on future tax amortization of the goodwill are recognized as deferred income tax and social contribution credit.
| 12 | INVESTMENTS |
The adjustments resulting from the translation of the financial statements of Providência USA Inc., which were originally prepared in U.S. dollar and translated into Brazilian reais, were recorded as cumulative translation adjustments under accumulated other comprehensive income in equity. In the year ended December 31, 2013, the Company recognized as other comprehensive income foreign currency translation adjustment gain derived from exchange rate changes on foreign investments of R$1,078 (loss of R$490 in 2012).
| 13 | INTANGIBLE ASSETS |
| (a) | Breakdown |
| Software | Goodwill | Total | ||||||||||
| As of December 31, 2012 |
9,550 | 33,133 | 42,683 | |||||||||
|
|
|
|
|
|
|
|||||||
| Adjusted cost |
23,510 | 39,759 | 63,269 | |||||||||
| Accumulated amortization |
(15,513 | ) | (6,626 | ) | (22,139 | ) | ||||||
|
|
|
|
|
|
|
|||||||
| As of December 31, 2013 |
7,997 | 33,133 | 41,130 | |||||||||
|
|
|
|
|
|
|
|||||||
F-94
Table of Contents
| (b) | Changes in intangible assets |
| Internally-generated software development costs |
Goodwill | Total | ||||||||||
| As of December 31, 2011 |
11,499 | 33,133 | 44,632 | |||||||||
|
|
|
|
|
|
|
|||||||
| Additions |
1,825 | 1,825 | ||||||||||
| Amortization |
(3,906 | ) | (3,906 | ) | ||||||||
| Exchange rate changes |
132 | 132 | ||||||||||
|
|
|
|
|
|||||||||
| As of December 31, 2012 |
9,550 | 33,133 | 42,683 | |||||||||
|
|
|
|
|
|
|
|||||||
| Additions |
2,403 | 2,403 | ||||||||||
| Amortization |
(4,267 | ) | (4,267 | ) | ||||||||
| Exchange rate changes |
150 | 150 | ||||||||||
| Transfer |
161 | 161 | ||||||||||
|
|
|
|
|
|||||||||
| As of December 31, 2013 |
7,997 | 33,133 | 41,130 | |||||||||
|
|
|
|
|
|
|
|||||||
In January 2008, the direct parent company Providência Participações Ltda. was merged (downstream merger) into its subsidiary Isofilme Indústria e Comércio de Plásticos Ltda. (Isofilme). The goodwill recognized by Providência Participações Ltda. in its accounting records, arising from the acquisition of Isofilme, was being amortized on a straight-line basis at the rate of 20% p.a. based on the expected future earnings, supported by an economic appraisal report prepared by a specialized company that used a real discount rate of 9.60% p.a. Beginning January 1, 2009, goodwill is no longer being amortized in the accounting records in a systematic manner, and is only subject to impairment tests, in accordance with IAS 36 – Impairment of assets.
Since the Company opted for the Transitional Tax Regime introduced by Law 11638/07 and Law 11941/09, the goodwill described above continued to be amortized for purposes of calculation of the provision for income tax and social contribution for the year ended December 31, 2009, and the related effects of deferred income tax and social contribution are recognized in profit or loss. Such goodwill was being amortized for tax purposes, and was fully amortized in February 2013.
Goodwill, in the amount of R$33,133, is based on expected future profitability and annually tested for impairment. As of December 31, 2013, impairment test did not identify the need of adjustments to the goodwill amount. The assumptions adopted in the calculation of the recoverable amount through the projection of cash flows were based on the analysis of their performance over the past years, analysis and expectations of growth of the operating market, besides Management’s expectations and strategies. Projected amounts were presented in real terms, i.e., they did not consider future inflation effects, and cash flows from operating activities were projected from January 1, 2014 to December 31, 2023. As of December 31, 2013, no impairment indicators were identified for the aforementioned goodwill.
In order to calculate the recoverable amounts, the Company considered the present value of perpetuity of the cash flows for the last year of projection. The discount rate used to calculate the present value of projected cash flows was 9.77% p.a., corresponding to the CDI rate in December 2013 – Source: Focus Bulletin issued by the Central Bank of Brazil.
F-95
Table of Contents
| 14 | PROPERTY, PLANT AND EQUIPMENT |
| Land | Buildings and construction |
Machinery and equipment |
Plants | Construction in progress |
Other tangible assets |
Total | ||||||||||||||||||||||
| Cost of property, plant and equipment, gross |
||||||||||||||||||||||||||||
| As of December 31, 2011 |
15,108 | 112,812 | 818,189 | 9,379 | 73,404 | 9,409 | 1,038,301 | |||||||||||||||||||||
|
|
|
|
|
|
|
|
|
|
|
|
|
|
|
|||||||||||||||
| Additions |
245 | 13,409 | 274 | 158,678 | 355 | 172,961 | ||||||||||||||||||||||
| Currency gain (loss) on foreign currency translation |
226 | 1,533 | 10,658 | 2 | 2,885 | 99 | 15,403 | |||||||||||||||||||||
| Write-offs |
(1 | ) | (97 | ) | (19 | ) | (117 | ) | ||||||||||||||||||||
| Transfers |
5,046 | 24,440 | 99,225 | 652 | (129,752 | ) | 389 | |||||||||||||||||||||
|
|
|
|
|
|
|
|
|
|
|
|
|
|
|
|||||||||||||||
| As of December 31, 2012 |
20,380 | 139,029 | 941,384 | 10,307 | 105,215 | 10,233 | 1,226,548 | |||||||||||||||||||||
|
|
|
|
|
|
|
|
|
|
|
|
|
|
|
|||||||||||||||
| Additions |
1,653 | 17,588 | 1,377 | 12,136 | 1,143 | 33,897 | ||||||||||||||||||||||
| Currency gain (loss) on foreign currency translation |
403 | 4,696 | 23,145 | 35 | 9,720 | 25 | 38,024 | |||||||||||||||||||||
| Write-offs |
(316 | ) | (256 | ) | (14 | ) | (586 | ) | ||||||||||||||||||||
| Transfers |
8,970 | 112,109 | (121,885 | ) | 806 | |||||||||||||||||||||||
|
|
|
|
|
|
|
|
|
|
|
|
|
|
|
|||||||||||||||
| As of December 31, 2013 |
20,783 | 154,348 | 1,093,910 | 11,463 | 5,186 | 12,193 | 1,297,883 | |||||||||||||||||||||
|
|
|
|
|
|
|
|
|
|
|
|
|
|
|
|||||||||||||||
| Accumulated depreciation: |
||||||||||||||||||||||||||||
| As of December 31, 2011 |
(18,691 | ) | (328,874 | ) | (4,403 | ) | (5,628 | ) | (357,596 | ) | ||||||||||||||||||
|
|
|
|
|
|
|
|
|
|
|
|
|
|
|
|||||||||||||||
| Depreciation |
(3,677 | ) | (26,685 | ) | (650 | ) | (900 | ) | (31,912 | ) | ||||||||||||||||||
| Write-offs |
8 | 8 | ||||||||||||||||||||||||||
|
|
|
|
|
|
|
|
|
|
|
|
|
|
|
|||||||||||||||
| As of December 31, 2012 |
(22,368 | ) | (355,559 | ) | (5,053 | ) | (6,520 | ) | (389,500 | ) | ||||||||||||||||||
|
|
|
|
|
|
|
|
|
|
|
|
|
|
|
|||||||||||||||
| Depreciation |
(4,622 | ) | (34,415 | ) | (745 | ) | (1,034 | ) | (40,816 | ) | ||||||||||||||||||
| Write-offs |
— | 187 | 93 | 5 | 285 | |||||||||||||||||||||||
|
|
|
|
|
|
|
|
|
|
|
|
|
|
|
|||||||||||||||
| As of December 31, 2013 |
(26,990 | ) | (389,787 | ) | (5,705 | ) | (7,549 | ) | (430,031 | ) | ||||||||||||||||||
|
|
|
|
|
|
|
|
|
|
|
|
|
|
|
|||||||||||||||
| Property plant and equipment, net: |
||||||||||||||||||||||||||||
| As of December 31, 2011 |
15,108 | 94,121 | 489,315 | 4,976 | 73,404 | 3,781 | 680,705 | |||||||||||||||||||||
| As of December 31, 2012 |
20,380 | 116,661 | 585,825 | 5,254 | 105,215 | 3,713 | 837,048 | |||||||||||||||||||||
| As of December 31, 2013 |
20,783 | 127,358 | 704,123 | 5,758 | 5,186 | 4,644 | 867,852 | |||||||||||||||||||||
As allowed by IFRS 1, the Company adopted the deemed cost to determine the fair value of property, plant and equipment, whose carrying amount was substantially lower than its fair value.
The appraisal was carried out by an independent engineering company specialized in appraising assets, in accordance with the standards and requirements of the Brazilian Association of Technical Standards (ABNT).
The adjustment in the consolidated balance sheet as of January 1, 2009, which was made based on the appraisal report and reviewed by Management, totaled R$302,157. Depreciation on adjustments to the fair value in the periods ended December 31, 2013 and December 31, 2012 was R$15,523 for each period, deferred income tax and social contribution were realized on the depreciation amount of R$5,278.
Depreciation for the period ended December 31, 2013, allocated to the consolidated cost of revenues, totals R$36,025 (R$25,337 as of December 31, 2012), and operating expenses total R$4,791 (R$6,575 as of December 31, 2012).
F-96
Table of Contents
In order to expand its production capacity, the Company has been investing in the acquisition of new machinery in Statesville plant (13th machinery), so that advances were made in line item “Constructions in progress”.
The amount of borrowing costs capitalized during 2013 amounts to R$1,036 (R$2,928 in 2012) and the capitalization rate used is 2.57% p.a. in 2013 (1.93% p.a. in 2012).
| 15 | TRADE PAYABLES |
| December 31, 2013 |
December 31, 2012 |
|||||||
| Trade payables |
59,975 | 43,390 | ||||||
|
|
|
|
|
|||||
| Total |
59,975 | 43,390 | ||||||
|
|
|
|
|
|||||
As of December 31, 2013, the average payment period is 17 days (30 days as of December 31, 2012). The Company implements their financial risk management policies to ensure that all obligations are paid in accordance with the originally agreed terms and conditions.
| 16 | BORROWINGS AND FINANCING |
| Type |
Finance charges |
Currency | Maturities |
December 31, 2013 |
December 31, 2012 |
|||||||||||
| Financing of a nonwoven manufacturing machinery – Kami 9 machine (a) |
(a) | LIBOR + | U.S. dollar | Interest: Semiannual through 2013 | 312 | |||||||||||
| 1.25% p.a. |
Principal: semiannual from 2009 to 2013 | 14,547 | ||||||||||||||
| Export credit notes |
(b) | 8% p.a. | Real | Interest: quarterly through 2016 | 537 | |||||||||||
| Principal: by 2016 | 50,000 | |||||||||||||||
| EXIM-PSI |
(c) | 9% p.a. | Real | Interest: quarterly through 2013 | 554 | |||||||||||
| Principal: May 2013 | 50,000 | |||||||||||||||
| Prepayment |
(d) | 4.85% p.a. | U.S. dollar | Interest: semiannual through 2018 | 1,470 | 766 | ||||||||||
| Principal: semiannual from 2013 to 2018 | 111,500 | 106,989 | ||||||||||||||
| Machinery financing |
(e) | LIBOR + 0.85% p.a. | U.S. dollar | Interest: semiannual through 2016 | 1 | 1 | ||||||||||
| Principal: semiannual through 2016 | 9,482 | 11,769 | ||||||||||||||
| (f) | LIBOR + 1.25% p.a. | U.S. dollar | Interest: semiannual through 2023 | 826 | 580 | |||||||||||
| Principal: semiannual through 2023 | 84,698 | 73,121 | ||||||||||||||
F-97
Table of Contents
| Type |
Finance charges |
Currency | Maturities |
December 31, 2013 |
December 31, 2012 |
|||||||||||
| Financing of USA plant |
(g) | Libor + 4% | U.S. dollar | Interest: semiannual through 2013 | 166 | |||||||||||
| Principal: semiannual through 2013 | 10,218 | |||||||||||||||
| (h) | Libor + 2.45% | U.S. dollar | Interest: semiannual through 2015 | 60 | ||||||||||||
| Principal: semiannual through 2015 | 17,530 | |||||||||||||||
| (i) | Libor + 3.91% | U.S. dollar | Interest: semiannual through 2014 | 66 | 60 | |||||||||||
| Principal: semiannual through 2014 | 2,376 | 3,832 | ||||||||||||||
| (j) | Libor + 3.08% | U.S. dollar | Interest: semiannual through 2016 | 116 | 143 | |||||||||||
| Principal: semiannual through 2016 | 13,177 | 16,093 | ||||||||||||||
| (k) | LIBOR + 2.50% | U.S. dollar | Interest: semiannual through 2016 | 32 | 99 | |||||||||||
| Principal: 04/03/2016 | 11,713 | 10,217 | ||||||||||||||
| (l) | SIFMA | U.S. dollar | Interest: monthly through 2030 | 571 | 4 | |||||||||||
| Principal: 2030 | 20,176 | 18,225 | ||||||||||||||
| (m) | LIBOR + 1.50% | U.S. dollar | Interest: semiannual through 2020 | 439 | 489 | |||||||||||
| Principal: semiannual through 2020 | 85,847 | 86,333 | ||||||||||||||
| (n) | LIBOR + 1.20% | U.S. dollar | Interest: semiannual through 2022 | 3 | 500 | |||||||||||
| Principal: semiannual through 2022 | 79,628 | 61,828 | ||||||||||||||
| (o) | LIBOR + 2.85% | U.S. dollar | Interest: semiannual through 2017 | 666 | 636 | |||||||||||
| Principal: 07/01/2017 | 46,381 | 40,277 | ||||||||||||||
| (p) | LIBOR + 3.05% | U.S. dollar | Interest: semiannual through 2014 | 201 | 141 | |||||||||||
| Principal: 08/21/2014 | 11,712 | 10,217 | ||||||||||||||
| (q) | LIBOR + 3.05% | U.S. dollar | Interest: semiannual through 2015 | 301 | ||||||||||||
| Principal: 01/30/2015 | 15,227 | |||||||||||||||
| (r) | LIBOR + 2.10% | U.S. dollar | Interest: semiannual through 2015 | 61 | ||||||||||||
| Principal: 01/28/2015 | 6,103 | |||||||||||||||
| (s) | LIBOR + 2.95% | U.S. dollar | Interest: semiannual through 2015 | 58 | ||||||||||||
| Principal: 04/07/2015 | 7,028 | |||||||||||||||
F-98
Table of Contents
| Type |
Finance charges |
Currency | Maturities |
December 31, 2013 |
December 31, 2012 |
|||||||||||
| (t) | LIBOR + 2.60% | U.S. dollar | Interest: semiannual through 2015 | 49 | ||||||||||||
| Principal: 06/18/2015 | 12,884 | |||||||||||||||
| (u) | LIBOR + 2.10% | U.S. dollar | Interest: semiannual through 2015 | 11 | ||||||||||||
| Principal: 07/01/2015 | 4,685 | |||||||||||||||
| (v) | LIBOR + 2.75% | U.S. dollar | Interest: semiannual through 2015 | 21 | ||||||||||||
| Principal: 12/02/2015 | 12,884 | |||||||||||||||
| Total |
590,930 | 535,707 | ||||||||||||||
|
|
|
|
|
|||||||||||||
| Current portion |
83,694 | 112,361 | ||||||||||||||
| Noncurrent portion |
507,236 | 423,346 | ||||||||||||||
|
|
|
|
|
|||||||||||||
| 590,930 | 535,707 | |||||||||||||||
|
|
|
|
|
|||||||||||||
| a) | The export prepayment contract (machinery financing) is pledged by promissory notes in the amount of US$36,5 million, subject to interest and exchange rate changes, as set forth in the Credit Agreement entered into by the parties. The agreement was settled in July 2013. |
| b) | On February 8, 2013, the Company entered into a NCE – Export Credit Note transaction with Banco Itaú in the amount of R$50,000, at a fixed BRL rate + 8% p. a., together with a swap by the same amount, where Company receives BRL + 8% p. a. and pays 98.70% of CDI. |
| c) | On November 28, 2011, the Company entered into an agreement with Banco Votorantim to raise a loan using funds from the National Bank for Economic and Social Development (BNDES), through the “BNDES-Exim” program, under the “BNDES-Exim Pré-Embarque PSI” category, in the amount of R$50,000. The loan proceeds are used by the Company in the manufacture and export of products included in Group II of Circular Letter 31/2007 of July 30, 2007 issued by the BNDES. Interest was calculated at the rate of 9% p.a., including quarterly payments up to the final maturity of the principal. The agreement was settled on May 15, 2013. |
| d) | On December 26, 2011, the Company entered into a loan agreement Banco Itaú in the amount of US$52,4 million, with a two-year grace period and semiannual payments through September 26, 2018. The interest rate negotiated 4.85% p.a. In order to hedge this transaction against the fluctuations of the U.S. dollar, the Company contracted a swap transaction in the same amount, where Company receives in USD + 4.85% p.a. and pays in CDI + 1.70% p.a.. |
| e) | The amount of R$9,483 refers to the loan agreement entered into between Isofilme and the German bank Kreditanstalt für Wiederaufbau (KFW), signed on July 27, 2005, for the purchase of machinery for the manufacture of nonwoven fabrics, bearing interest rate equivalent to the LIBOR fluctuation + 0.85% p.a., with semiannual payment of principal and interest through 2016. |
| f) | The amount of R$85,915 refers to the installments released, out of the total of US$36,5 million, contracted by Isofilme from Banco HSBC, collateralized by German agency Euler Hermes Kreditversicherungs AG. The amount was used to finance a machine set up in Pouso Alegre, Minas Gerais. The interest rate contracted corresponds to LIBOR fluctuation + 1.25% per annum, with semiannual payment of principal and interest. |
| g) | The financing agreement entered into among Providência USA Inc. and Banco HSBC, on September 19, 2008, and used to finance the plant in the United States, was settled on August 26, 2013. |
| h) | On November 16, 2010 and December 31, 2010, loans totaling US$10,1 million were raised from HSBC to finance the working capital requirements of the plant in the United States, These loans mature on April 24, 2015 and November 25, 2015, and bear average interest rate equivalent to LIBOR fluctuation + 2.45% p.a., with semiannual payment. The agreement was settled on December 17, 2013. |
F-99
Table of Contents
| i) | On March 5, 2012, the Company entered into with HSBC a loan agreement in the amount of US$2,5 million to finance working capital requirements of the plant in the United States. The loan will mature on August 26, 2014; principal and interest will be paid semiannually and bears interest equivalent to LIBOR fluctuation + 3.91% p.a.. |
| j) | On March 4, 2011 and July 7, 2011, US$9 million transactions were contracted from Banco Itaú to finance the US plant’s working capital. These transactions mature on March 4, 2016 and December 10, 2016, subject to semiannual interest based on LIBOR rate + 3.08% p.a., on average. |
| k) | On April 13, 2011, a loan contract of US$5 million was entered into with Banco do Brasil to finance the working capital requirements of the plant in the United States. This loan matures on April 3, 2016, and bears interest rate equivalent to LIBOR fluctuation + 2.50% p.a., with semiannual payment. |
| l) | On May 12, 2010, US$9,1 million was raised to finance the construction of the plant in the United States, The transaction, called as Recovery Zone Facility Bonds, consists of the issue of US government bonds of the county of Iredell, managed by a financial agent (Wells Fargo Bank), and collateralized by HSBC, bearing interest calculated on a weekly basis and paid on a monthly basis in accordance with the SIFMA (securities Industry and Financial Markets Association) rate. The SFIMA rate as of December 31, 2013 was 0.27% p.a. |
| m) | The amount of R$86,286 refers to the installments released out of the total loan contract amounting to US$51,8 million, entered into on February 12, 2010 between Providência USA Inc., and HSBC, collateralized by the German agent Euler Hermes Kreditversicherungs AG. The funds were used to finance the purchase of the machinery installed in the United States. The loan bears interest equivalent to LIBOR fluctuation + 1.50% p.a., with semiannual payment of interest and principal. |
| n) | The amount of R$79,631 refers to the installment released out of the total loan contract amounting to US$37,5 million entered into on August 8, 2011 between Providência USA Inc., and HSBC, collateralized by the German agent Euler Hermes Kreditversicherungs AG, to finance the purchase of the machinery to be installed in the United States, which is released as the machinery and its components are shipped. The loan bears interest equivalent to LIBOR fluctuation + 1.20% p.a. with semiannual payment of interest and principal. |
| o) | On July 27, 2012, a US$20 million transaction was contracted from Banco do Brasil to finance the purchase of the plant in the United States. The transaction will mature on December 29, 2017, subject to semi-annual interest based on LIBOR rate + 2.85% per year. |
| p) | On August 16, 2012, a US$5 million transaction was contracted from Banco Bradesco to finance the US plant’s working capital. The transaction will mature on August 21, 2014, subject to semi-annual interest based on LIBOR rate + 3.05% per year. |
| q) | On January 30, 2013, a US$6,5 million transaction was contracted from Banco Bradesco to finance the US plant’s working capital. The transaction will mature on January 30, 2015, subject to semi-annual interest based on LIBOR rate + 3.05% per year. |
| r) | On February 6. 2013, a US$2,6 million transaction was contracted from Banco do Brasil to finance the US plant’s working capital. The transaction will mature on January 28, 2015, subject to semi-annual interest based on LIBOR rate + 2.10% per year. |
| s) | On April 7, 2013, a US$3,0 million transaction was contracted from Banco Bradesco to finance the US plant’s working capital. The transaction will mature on April 7, 2015, subject to semi-annual interest based on LIBOR rate + 2.95% per year. |
| t) | On September 18, 2013, a US$5,5 million transaction was contracted from Banco Bradesco to finance the US plant’s working capital. The transaction will mature on September 18, 2015, subject to semi-annual interest based on LIBOR rate + 2.60% per year. |
| u) | On July 9, 2013, a US$2,0 million transaction was contracted from Banco do Brasil to finance the US plant’s working capital. The transaction will mature on July 1, 2015, subject to semiannual interest based on LIBOR rate + 2.10% p.a. |
| v) | On December 11, 2013, a US$5,5 million transaction was contracted from Banco Santander to finance the US plant’s working capital. The transaction will mature on December 2, 2015, subject to semi-annual interest based on LIBOR rate + 2.75% per year. |
F-100
Table of Contents
The noncurrent portion matures as follows:
| December 31, 2013 |
December 31, 2012 |
|||||||
| 2014 |
73,152 | |||||||
| 2015 |
123,365 | 60,534 | ||||||
| 2016 |
121,703 | 61,676 | ||||||
| From 2017 to 2030 |
262,168 | 227,984 | ||||||
|
|
|
|
|
|||||
| 507,236 | 423,346 | |||||||
|
|
|
|
|
|||||
Companhia Providência Indústria e Comércio has an international letter of guarantee issued by HSBC to collateralize the amount of US$9,1 million related to the funds raised through the Recovery Zone Facility Bond.
The funds for the exclusive financing of machinery are collateralized by the financed machinery at the remaining balance of the financing. As of December 31, 2013, this amount represents R$260,924, of which R$165,917 refers to the machinery in the plant in the United States and R$95,007 refers to Isofilme’s machinery.
Domestic loans are not collateralized.
Abbreviations:
| CDI | – Interbank Deposit Certificate | |
| LIBOR | – London Interbank Offered Rate | |
| NCE | – Export Credit Note | |
| SIFMA | – Securities Industry and Financial Markets Association |
Also with the objective of financing the construction and buildings and the working capital of the new plants, the Company has available credit lines totaling US$100 million from several financial institutions, bearing interest at rates ranging from Libor + 3% to Libor + 4.94% per annum. These funds will be released as the plants receiving the investments identify their cash requirements.
The carrying amounts of borrowings and financing their respective estimated fair values are as follows:
| Carrying amount | Fair value | |||||||||||||||
| December 31, 2013 |
December 31, 2012 |
December 31, 2013 |
December 31, 2012 |
|||||||||||||
| Borrowings and financing |
590,930 | 535,707 | 576,566 | 539,201 | ||||||||||||
|
|
|
|
|
|
|
|
|
|||||||||
| 590,930 | 535,707 | 576,566 | 539,201 | |||||||||||||
|
|
|
|
|
|
|
|
|
|||||||||
| 17 | TAXES, FEES AND CONTRIBUTIONS PAYABLE |
| December 31, 2013 | December 31, 2012 | |||||||||||||||
| Current liabilities |
Noncurrent liabilities |
Current liabilities |
Noncurrent liabilities |
|||||||||||||
| ICMS |
419 | 154 | 472 | 218 | ||||||||||||
| PIS |
10 | 121 | ||||||||||||||
| COFINS |
22 | 542 | ||||||||||||||
| IRRF |
559 | 578 | ||||||||||||||
| Social security contribution on gross revenues |
454 | 315 | ||||||||||||||
| IRPJ and CSLL |
523 | 614 | ||||||||||||||
| Property tax – Statesville |
2,324 | 1,395 | ||||||||||||||
| Other taxes |
451 | 423 | ||||||||||||||
|
|
|
|
|
|
|
|
|
|||||||||
| 4,762 | 154 | 4,460 | 218 | |||||||||||||
|
|
|
|
|
|
|
|
|
|||||||||
F-101
Table of Contents
| 18 | PROVISIONS FOR TAX, LABOR AND CIVIL RISKS |
The Company is a party to ongoing labor, tax and civil lawsuits at the administrative and judicial levels.
The amounts to be accrued are calculated based on the amounts effectively involved and on the opinion of the outside and in-house legal counsel in charge of the lawsuits. Provisions are only recognized for lawsuits whose likelihood of loss is assessed as probable.
The table below shows the provisions for probable losses and escrow deposits as of December 31, 2013:
| December 31, 2013 | December 31, 2012 | |||||||||||||||
| Provision | Deposits | Provision | Deposits | |||||||||||||
| Labor |
1,037 | 339 | 977 | 23 | ||||||||||||
| Civil |
25 | 25 | ||||||||||||||
| Tax |
33 | 33 | ||||||||||||||
|
|
|
|
|
|
|
|
|
|||||||||
| Total |
1,062 | 372 | 1,002 | 56 | ||||||||||||
|
|
|
|
|
|
|
|
|
|||||||||
| Current |
250 | 427 | ||||||||||||||
| Noncurrent |
812 | 372 | 575 | 56 | ||||||||||||
The changes in the provisions during the period ended December 30, 2013 were as follows:
| Balance at December 31, 2012 |
1,002 | |||
|
|
|
|||
| Additions |
457 | |||
| Write-offs |
(397 | ) | ||
|
|
|
|||
| Balance at December 31, 2013 |
1,062 | |||
|
|
|
| (a) | Labor lawsuits |
In general, labor claims address to overtime, health hazard bonus and/or hazardous duty premium, salary equalization, vacation pay, pain and suffering resulting from accidents, occupational sick and joint liability involving service providers, among others.
| (b) | Civil lawsuits |
In general, civil claims address the usual matters inherent to the Company’s business and refer mainly to indemnity claims, collection of receivables, matters related to the declaration of undue collection of an execution instrument and suspension of protest.
| (c) | Tax lawsuits |
As of December 31, 2013, Isofilme is a party to a lawsuit relating to ICMS (State VAT) on electric power made available but not used.
On April 15, 2013, Decree 46215, which regulates the relinquishment of payment of ICMS on power not effectively used, was published in the Official Gazette of the State of Minas Gerais.
| (d) | Possible contingencies not accrued |
The Company is a party to tax, labor and civil lawsuits whose likelihood of loss is assessed by Management and its legal counsel as possible; no provision was recorded for these lawsuits, as shown below:
| December 31, 2013 |
December 31, 2012 |
|||||||
| Labor |
403 | 874 | ||||||
| Civil |
1,943 | 3,054 | ||||||
| Tax* |
154,904 | |||||||
|
|
|
|
|
|||||
| 157,250 | 3,928 | |||||||
|
|
|
|
|
|||||
F-102
Table of Contents
| * | These lawsuits and administrative proceedings include two tax deficiency notices relating to the determination of the Companhia Providência Indústria e Comércio and Isofilme’s taxable income for 2007 and 2008, drawn up in August and November 2013, which are being timely challenged at administrative level. |
| (e) | Former controlling shareholders |
As of December 31, 2013, the amounts relating to lawsuits under the responsibility of the former controlling shareholders, whose risks of loss are assessed by Management as possible and probable, amount to R$2,327 (R$2,442 as of December 31, 2012).
| 19 | DEFERRED INCOME TAX AND SOCIAL CONTRIBUTION LIABILITIES |
Deferred tax liabilities are recorded to cover the realization of temporary differences and are stated on a net basis. They are broken down as follows:
| 2013 | 2012 | |||||||
| Liabilities |
||||||||
| Income tax (IR) and Social contribution (CS) |
||||||||
| Deferred on the effects of Laws 11638 and 11941 (see Note 11) |
39,609 | 37,785 | ||||||
| Deemed cost of property, plant and equipment |
2,699 | 2,853 | ||||||
|
|
|
|
|
|||||
| 42,308 | 40,638 | |||||||
|
|
|
|
|
|||||
| Income tax and social contribution rate |
34 | % | 34 | % | ||||
| Total deferred income tax and social contribution, net |
14,385 | 13,817 | ||||||
|
|
|
|
|
|||||
In subsidiary Isofilme, temporary differences that give rise to deferred income tax and social contribution liabilities refer mainly to the tax amortization of the goodwill on the acquisition of subsidiary Isofilme.
F-103
Table of Contents
| 20 | EQUITY |
| (a) | Capital |
As of December 31, 2013, capital totaled R$409,003, represented by 80,041,132 book-entry, registered ordinary shares, without par value, held as follows:
| Controlling shareholders and related parties |
||||||||
| FIP Volluto |
13,952,203 | 17.4 | % | |||||
| Investidores Institucionais II – Fundo de Investimento em Participações |
10,074,423 | 12.6 | % | |||||
| FIP Bssf II |
9,417,737 | 11.8 | % | |||||
| FIP Brasil Equity II |
6,278,492 | 7.8 | % | |||||
| Banco Espírito Santo S.A. |
5,861,269 | 7.3 | % | |||||
| Boreal Fundo de Investimentos em Participações* |
4,651,081 | 5.8 | % | |||||
| Espírito Santo Capital – Sociedade de Capital de Risco S.A. |
1,953,757 | 2.4 | % | |||||
| Fundo de Investimentos em Partic. C.A. |
1,162,683 | 1.5 | % | |||||
| Fip Ggpar (Gov. e Gestão Investimentos Ltda.) |
970,724 | 1.2 | % | |||||
| Boreal Ações III Fia* |
2,690,700 | 3.4 | % | |||||
|
|
|
|
|
|||||
| Total controlling shareholders and related parties |
57,013,069 | 71.2 | % | |||||
|
|
|
|
|
|||||
| Management |
||||||||
| Executive Board |
52,009 | 0.1 | % | |||||
| Board of Directors |
4 | 0.0 | % | |||||
| Supervisory Board |
4,000 | 0.0 | % | |||||
|
|
|
|
|
|||||
| Total Management |
56,013 | 0.1 | % | |||||
|
|
|
|
|
|||||
| Free float shares |
||||||||
| Sul América Invest. Distrib. de Títulos e Valores Mobiliários S.A.** |
4,041,400 | 5.0 | % | |||||
| Victoire Brasil Investimentos Administração de Recursos Ltda.*** |
4,380,000 | 5.5 | % | |||||
| Others |
14,532,350 | 18.2 | % | |||||
|
|
|
|
|
|||||
| Total free float shares |
22,953,750 | 28.7 | % | |||||
|
|
|
|
|
|||||
| Treasury shares |
18,300 | 0.0 | % | |||||
|
|
|
|
|
|||||
| Total treasury shares |
18,300 | 0.0 | % | |||||
|
|
|
|
|
|||||
| Total shares |
80,041,132 | 100.0 | % | |||||
|
|
|
|
|
| * | Shareholders related to Boreal Fundo de Investimentos em Participações. |
| ** | Sul América FI em Ações, Sul América Dividendos FI em Ações and NBF Sulamérica Master Prev FIM, three investment funds managed by Sul América Investimentos Distribuidora de Títulos e Valores Mobiliários S.A, with ownership interest equal to or above 5% of the Company’s capital. |
| *** | Victoire Brazil Small Cap. Fund. SP, Victoire Small Cap. Ações FI., Victoire Dividendos FIA., Victoire Brazil Fund. LLC. and VBI Exclusivo Ações Fundo de Investimento (all managed by Victoire Brasil Investimentos Administração de Recursos Ltda.) exceeded the percentage of 5% of total common shares issued by Companhia Providência Indústria e Comércio |
Under the Company’s bylaws, the Company is authorized to increase its capital up to 4,050,000 (four million and fifty thousand) book-entry, registered ordinary shares, with no par value, regardless of any amendment to the bylaws.
| b) | Stock options |
Under the Company’s bylaws, as approved by the Board of Directors and pursuant to the guidelines for the structuring of the Stock Option Plan approved at the Annual General Meetings held on May 11, 2007 and September 10, 2010, the Company is authorized to grant stock options or subscription
F-104
Table of Contents
warrants, with no preemptive rights for existing shareholders, executives and senior employees of the Company and its subsidiaries.
The guidelines adopted to grant stock options are set by the Board of Directors, which may grant stock options to the persons indicated. Stock options to be granted under these guidelines will correspond to, on any time, up to 3% of total shares issued by the Company. The terms and conditions, including the price per share, are set by the Board of Directors on grant or concession date. Pursuant to the provisions of Article 171, paragraph 3 of Brazilian Corporation Law, shareholders will not be entitled to any preemptive rights over the stock option term.
Currently, one stock option plan is effective (the 2nd Stock Option Plan). The plan has three vesting periods to exercise the underlying options: After the lapse of 12 months, the plan’s participant is entitled to acquire 20% of the shares under the option; after the lapse of 24 months, the plan’s participant is entitled to acquire 30% of the shares under the option; and, after the lapse of 36 months, the plan’s participant is entitled to acquire the remaining 50% of the shares under the option. The plan expires within 7 (seven) years.
The recognition in the financial statements begins from the month in which the Company starts to receive the services related to the stock option plan.
The vesting of the stock option is contingent on the employee remaining in the Company.
Up to December 31, 2013, 130,800 shares relating to the plan approved on May 30, 2011 were exercised. The shares delivered by the Company were acquired between September 26, 2011 and September 25, 2012 and were recorded as treasury shares. The effect for the year in the amount of R$162 of the options exercised was recorded as Capital Reserve. Options corresponding to 175,000 shares were also cancelled due to the withdrawal of persons eligible to the plan.
Below are details of the effective plan:
| Approval date |
Number of shares granted |
Exercise price | Maturity date |
Fair value | % of capital | |||||||
| 05/30/2011 |
829,000 | 6.10 | 05/30/2018 | 1,510 | 1.04 | % | ||||||
| 05/25/2012 |
460,000 | 6.35 | 05/25/2019 | 711 | 0.58 | % | ||||||
The assumptions used in the calculation on the grant date fair value were as follows:
| Approval date |
Number of shares granted |
Annual risk-free interest rate |
Total term (in years) |
Expected annual volatility |
Option’s fair value as of the granting date | |||||||||
| 05/30/2011 |
829,000 | 12.15 | % | 3 | 52.86 | % | 1.82 | |||||||
| 05/25/2012 |
460,000 | 8.79 | % | 3 | 48.56 | % | 1.57 | |||||||
F-105
Table of Contents
If options are fully exercised by their holders, the interest held by Company’s current shareholders will be diluted by 1.21%. Such dilution was calculated based on the ratio between (i) the total number of shares under the stock option plan in effect, and (ii) the total number of shares issued by the Company as of December 31, 2013, plus the total number of shares under the stock option plan, i.e.:
“Dilution as of 12/31/2013” = 983,200 / (80,041,132 + 983,200) x 100 = 1.21%
| Changes in options |
2013 | 2012 | ||||||
| Balance at the beginning of the year |
1,289,000 | 829,000 | ||||||
| Options granted |
460,000 | |||||||
| Options exercised |
(130,800 | ) | ||||||
| Options forfeited |
(175,000 | ) | ||||||
|
|
|
|
|
|||||
| Balance at the end of the year |
983,200 | 1,289,000 | ||||||
| Exercise price – plan approved on 5/30/2011 |
6.10 | 6.10 | ||||||
| Exercise price – plan approved on 5/25/2012 |
6.35 | 6.35 | ||||||
| Expiry date – plan approved on 5/30/2011 |
05/30/2018 | 05/30/2018 | ||||||
| Expiry date – plan approved on 5/25/2012 |
05/25/2019 | 05/25/2019 | ||||||
| (c) | Capital reserves |
As of December 31, 2013, the capital reserve balance of R$12,425 (R$11,878 as of December 31, 2012) is comprised of a goodwill reserve recognized on the issuance of shares, in the amount of R$10,865 (R$10,703 as of December 31, 2012), as well as of a special reserve recognized to meet commitments from the new stock option plan, as mentioned in Note 20 (b), whose balance amounts to R$1,560 as of December 31, 2013 (R$1,175 as of December 31, 2012). A reversal of R$206 was made during the year due to forfeiture of stock options as described in Note 20 (b).
| (d) | Treasury shares |
| Changes in treasury shares |
Amount | Number | ||||||
| Balance at December 31, 2012 |
813 | 149,100 | ||||||
| Stock Option Program |
(713 | ) | (130,800 | ) | ||||
| Balance at December 31, 2013 |
100 | 18,300 | ||||||
|
|
|
|
|
|||||
On September 26, 2011, the Company launched the third Share Buyback Program in connection with the Company’s shares, which expired on September 25, 2012.
In this period, the Company bought back 149,100 shares, at the amount of R$813. Through December 31, 2013, the Company sold 130,800 shares due to the exercise of options under the Stock Option plan.
| (e) | Profit reserves |
| December 31, 2013 |
December 31, 2012 |
|||||||
| Legal reserve |
11,086 | 9,740 | ||||||
| Reserve for future investments |
86,597 | 68,518 | ||||||
| Accrued proposed additional dividends |
33,789 | |||||||
|
|
|
|
|
|||||
| Total |
97,683 | 112,047 | ||||||
|
|
|
|
|
|||||
The legal reserve is recorded at 5% of net profit, before any allocation, up to 20% of capital.
The reserve for future investments was proposed by Management and approved at the Shareholders’ Meeting to finance the Company’s investment project, which involves setting up new machinery.
F-106
Table of Contents
| (f) | Dividends |
Shareholders are entitled to a mandatory minimum dividend of 25% of net profit, considering mainly the adjustments to the amounts allocated to the legal reserve in the year.
Dividends were calculated as follows:
| December 31, 2013 |
December 31, 2012 |
|||||||
| (a) Calculation of mandatory minimum dividends: |
||||||||
| Net profit for the year |
26,920 | 45,071 | ||||||
| Legal reserve - 5% |
(1,346 | ) | (2,254 | ) | ||||
|
|
|
|
|
|||||
| Basis for calculation of minimum dividends |
25,574 | 42,817 | ||||||
|
|
|
|
|
|||||
| Mandatory minimum dividends (25%) |
6,394 | 10,704 | ||||||
| (b) Adjusted dividend calculation basis |
||||||||
| Net profit for the year |
26,920 | 45,071 | ||||||
| Legal reserve - 5% |
(1,346 | ) | (2,254 | ) | ||||
| Reversal of capital reserve (stock option) |
206 | |||||||
| Exclusion of the effect of the depreciation of deemed cost on the net profit of the year |
10,245 | 10,245 | ||||||
|
|
|
|
|
|||||
| Adjusted calculation base |
36,025 | 53,062 | ||||||
| (-) Mandatory minimum dividends (25%) |
6,394 | 10,704 | ||||||
| (=) Proposed additional dividends |
42,358 | |||||||
|
|
|
|
|
|||||
| 6,394 | 53,062 | |||||||
| Dividend paid (R$0.22 per share in 2013 and R$0.24 in 2012) |
(17,946 | ) | (19,273 | ) | ||||
|
|
|
|
|
|||||
| Proposed additional dividend (equity) |
33,789 | |||||||
| Dividends per share |
R$ | 0.42 | ||||||
| Total dividend (paid + proposed) |
||||||||
| Dividends per share |
R$ | 0.22 | R$ | 0.66 | ||||
After allocation of the legal reserve, based on the proposal of the Board of Directors to be approved in an Annual General Meeting, the remaining balance of retained earnings as of December 31, 2013 (R$18,079) was allocated to Reserve for future investments.
With respect to the dividend policy, the Company will keep the policy set forth in the bylaws.
| (g) | Basic and diluted earnings per share |
Basic and diluted earnings per share were calculated based on the profit attributable to the Company’s owners and noncontrolling interest in the period, as detailed in the table below. There were no changes in the number of shares issued, and the calculation of the number of dilutive shares made by the Company did not show any significant results that might cause earnings per share to be changed. Accordingly, diluted earnings per share did not present any difference that could be material for reporting purposes, that is, diluted earnings per share were virtually equal to basic earnings per share:
| 2013 | 2012 | |||||||
| Net profit for the period |
26,920 | 45,071 | ||||||
| Number of ordinary shares (thousands) |
80,010 | 79,892 | ||||||
|
|
|
|
|
|||||
| Earnings per share – basic and dilutive |
0.34 | 0.56 | ||||||
|
|
|
|
|
|||||
F-107
Table of Contents
| (h) | Valuation adjustments to equity |
| 2013 | 2012 | |||||||
| Deemed cost of property, plant and equipment (a) |
148,198 | 158,443 | ||||||
| Cumulative translation adjustments (b) |
(1,659 | ) | (581 | ) | ||||
|
|
|
|
|
|||||
| Total |
146,539 | 157,862 | ||||||
|
|
|
|
|
|||||
Changes in the period refer to:
| (a) | Deemed cost of property, plant and equipment: Realization of net income tax depreciation, in the amount of R$10,245, in the periods ended December 31, 2013 and December 31, 2012; |
| (b) | Accumulated translation adjustments: Exchange rate changes on the investment made in subsidiary Providência USA Inc. (negative), in the amount of R$1,078. |
| 21 | REVENUE |
The reconciliation between gross revenue and net revenue is as follows:
| 2013 | 2012 | |||||||
| Gross revenue |
896,231 | 702,610 | ||||||
| Sales returns |
(26,716 | ) | (19,504 | ) | ||||
| Taxes on sales |
(87,513 | ) | (74,472 | ) | ||||
|
|
|
|
|
|||||
| Net revenue |
782,002 | 608,634 | ||||||
| 22 | EXPENSES BY NATURE AND COST OF REVENUES |
The Company’s income statement is presented based on a classification of the expenses according to their function. Information on the nature of these expenses recognized in the income statement is shown below:
| 2013 | 2012 | |||||||
| Cost of revenues |
(578,579 | ) | (423,055 | ) | ||||
| Selling expenses |
||||||||
| Logistics |
(35,226 | ) | (29,670 | ) | ||||
| Commissions |
(3,662 | ) | (2,119 | ) | ||||
| Other |
(2,421 | ) | (2,807 | ) | ||||
|
|
|
|
|
|||||
| Total selling expenses |
(41,309 | ) | (34,596 | ) | ||||
|
|
|
|
|
|||||
| Administrative expenses |
||||||||
| Personnel |
(28,805 | ) | (23,589 | ) | ||||
| Management |
(5,657 | ) | (6,700 | ) | ||||
| Employee benefit expense |
(10,715 | ) | (9,195 | ) | ||||
| Utilities |
(2,476 | ) | (1,247 | ) | ||||
| Services rendered |
(10,360 | ) | (7,110 | ) | ||||
| Travel |
(2,855 | ) | (2,282 | ) | ||||
| Taxes and fees |
(1,717 | ) | (892 | ) | ||||
| Depreciation and amortization expenses |
(9,058 | ) | (6,575 | ) | ||||
| Other |
(6,266 | ) | (4,444 | ) | ||||
|
|
|
|
|
|||||
| Total administrative expenses |
(77,909 | ) | (62,034 | ) | ||||
|
|
|
|
|
|||||
| Other income (expenses) |
939 | |||||||
| Provision for risks * |
(2,717 | ) | (27 | ) | ||||
| Other |
(591 | ) | (833 | ) | ||||
|
|
|
|
|
|||||
| Total other income (expenses) |
(3,308 | ) | 79 | |||||
|
|
|
|
|
|||||
| Total |
(701,105 | ) | (519,606 | ) | ||||
|
|
|
|
|
|||||
F-108
Table of Contents
| * | Includes the amount of R$2,631 relating to payments made to former owners which, by contract were entitled to reimbursement of certain tax recoveries relating to period prior to 2007, and was settled on December 12, 2013. |
| 23 | FINANCE INCOME AND EXPENSES |
| (a) | Finance income |
| 2013 | 2012 | |||||||
| Interest |
748 | 1,635 | ||||||
| Income from derivative transactions |
846 | 7,691 | ||||||
| Interest from short-term investments |
4,334 | 5,938 | ||||||
| Other |
100 | 111 | ||||||
|
|
|
|
|
|||||
| 6,028 | 15,375 | |||||||
|
|
|
|
|
|||||
Changes in finance income in the period ended December 31, 2013, compared to the same period in 2012, are due mainly to the effect of exchange rate changes on assets denominated in foreign currency and the reduction in the earnings on short-term investments due to the decrease in the amounts invested and decrease in income from derivative transactions.
Revenues from derivatives refer to income (loss) on swap transactions, forward exchange contracts and U.S. dollar option contracts.
| (b) | Financial expenses |
| 2013 | 2012 | |||||||
| Interest |
(32,893 | ) | (21,828 | ) | ||||
| Exchange losses |
(5,003 | ) | (3,704 | ) | ||||
| Expenses from derivative transactions |
(5,085 | ) | (8,205 | ) | ||||
| Other |
(2,412 | ) | (2,071 | ) | ||||
|
|
|
|
|
|||||
| (45,393 | ) | (35,808 | ) | |||||
|
|
|
|
|
|||||
The changes in financial expenses for the period ended December 31, 2013, compared to the same period in 2012, refer mainly to addition of interest due to the increase in interest rates in the period, reversal of interest on recoverable taxes and to the effect of rate changes in foreign currency-denominated liabilities.
Expenses on derivatives refer to income (loss) on swap transactions, forward exchange contracts and U.S. dollar option contracts.
| 24 | INCOME TAX AND SOCIAL CONTRIBUTION EXPENSES |
| (a) | Reconciliation of the effective rate of taxes |
| 2013 | 2012 | |||||||
| Income before income tax and social contribution |
41,532 | 68,595 | ||||||
| Statutory tax rate (income tax and social contribution) |
34 | % | 34 | % | ||||
|
|
|
|
|
|||||
| Income tax and social contribution expenses at statutory rates |
(14,121 | ) | (23,322 | ) | ||||
| Tax effects from (additions) deductions: |
||||||||
| Permanent items, net |
(491 | ) | (202 | ) | ||||
|
|
|
|
|
|||||
| Amounts charged to profit or loss |
(14,612 | ) | (23,524 | ) | ||||
| Current |
(2,189 | ) | (2,399 | ) | ||||
| Deferred |
(12,423 | ) | (21,125 | ) | ||||
|
|
|
|
|
|||||
| Amounts charged to profit or loss |
(14,612 | ) | (23,524 | ) | ||||
|
|
|
|
|
|||||
F-109
Table of Contents
| (b) | Statement of changes in deferred income tax and social contribution, net, as of December 31, 2013 |
| 2012 | Changes | 2013 | ||||||||||
| Tax loss carryforwards |
201,307 | 32,408 | 233,715 | |||||||||
| Tax losses – USA |
9,590 | (2,642 | ) | 6,948 | ||||||||
| 1) Tax effects on deferred income tax and social contribution assets |
72,185 | 9,988 | 82,173 | |||||||||
| Temporary difference subject to statutory rate of 34%: |
||||||||||||
| Temporary additions |
17,548 | (305 | ) | 17,243 | ||||||||
| Depreciation |
(82,397 | ) | (27,634 | ) | (110,031 | ) | ||||||
| Other |
9,563 | 5,373 | 14,936 | |||||||||
| Temporary difference subject to statutory rate of 9%: |
||||||||||||
| Provisions |
1,423 | 1,423 | ||||||||||
| 2) Tax effects on deferred income tax and social contribution assets |
(18,670 | ) | (7,545 | ) | (26,215 | ) | ||||||
|
|
|
|
|
|
|
|||||||
| Deferred IRPJ – goodwill |
55,637 | (13,909 | ) | 41,728 | ||||||||
| Deferred CSLL – goodwill |
20,029 | (5,007 | ) | 15,022 | ||||||||
| Deferred IRPJ – deemed cost |
(59,303 | ) | 3,841 | (55,462 | ) | |||||||
| Deferred CSLL – deemed cost |
(21,349 | ) | 1,383 | (19,966 | ) | |||||||
| 3) Effect on deemed cost and goodwill on deferred income tax and social contribution |
(4,986 | ) | (13,692 | ) | (18,678 | ) | ||||||
|
|
|
|
|
|
|
|||||||
| Total tax effects on deferred income tax and social contribution assets (1+2+3) |
48,529 | (11,250 | ) | 37,279 | ||||||||
|
|
|
|
|
|
|
|||||||
| Current income tax and social contribution |
(2,189 | ) | ||||||||||
| Temporary and permanent differences – subsidiaries (liabilities) |
(1,173 | ) | ||||||||||
| Total income tax and social contribution recorded in profit or loss |
(14,612 | ) | ||||||||||
|
|
|
|||||||||||
| 25 | PRIVATE PENSION PLAN |
In December 2009, the Company contracted with Banco Itaú a defined contribution private pension plan called ProvidênciaPrev, whose contributions are made monthly and voluntarily by the participants and also by the Company, in accordance with two groups of salary ranges, based on the maximum contribution required by the Government Social Security System.
The Company, as the sponsor, does not assume any financial obligation for the cost of past services.
The first group includes all employees whose base salary exceeds the ceiling for the social security contribution. The Company’s contributions are equal to 100% of the employees’ basic contributions.
The second group is comprised of the other employees and the Company’s contributions, corresponding to three times the salary of an employee, will be made on the date of eligibility to the benefit, which is related to employee contract termination on entity’s decision.
The amount of the contribution made by the Company for the period ended December 31, 2013 was R$521 (R$355 in the same period of 2012), recorded in profit or loss under “Personnel expenses”.
| 26 | INSURANCE |
The Company takes insurance for assets at amounts considered sufficient by management to cover probable losses, taking into account the nature of their activities. The insurance policies are quoted with several insurance companies, are effective and the premiums were duly paid. The Company manage risks with the objective of minimizing probable risks and claims.
F-110
Table of Contents
As of December 31, 2013 and December 31, 2012, the Company had the following insurance policies:
| Insured amounts | ||||||||
| 2013 | 2012 | |||||||
| Line |
||||||||
| Property |
||||||||
| Named perils and operational risks and loss of profits |
929,136 | 647,892 | ||||||
| Comprehensive civil liability |
||||||||
| Commercial establishments |
105,264 | 82,864 | ||||||
| Civil liability |
||||||||
| D&O |
35,227 | 33,199 | ||||||
| International transportation |
||||||||
| Import and export |
13,275 | 6,831 | ||||||
|
|
|
|
|
|||||
| Total |
1,082,902 | 770,786 | ||||||
|
|
|
|
|
|||||
The insurance coverage can be summarized as follows:
| • | Property (plants) – guarantees indemnity for electrical damages, fire, loss of profits, machinery shutdown, robbery/theft of assets, twist, hurricane, cyclones, tornadoes, collision of land vehicles and aircraft crashes. Includes insurance of forklift trucks and vehicles that guarantees indemnity for losses on, and property damages to, the assets; |
| • | comprehensive civil liability insurance for manufactured products and internal operations, as well as employer risks and contingent risks of motor vehicles; |
| • | civil liability insurance for Directors and/or Officers (D&O); |
| • | transport insurance – insures any and all assets and/or goods/raw materials inherent in the line of activity and transported under the companies’ responsibility; and, |
| • | warranty insurance – insures, if necessary, obligations undertaken by the Company to various public or private agencies, related to prepayments, performance of contractors, suppliers or service providers, bids, proper operation and payment retention. |
The increases in the insured amounts refer basically to the inclusion of a new machinery in Statesville, United States, plant and also arises out of the work performed by Management to increase the insured amounts without increasing the cost of insurance.
| 27 | MANAGEMENT COMPENSATION |
The Extraordinary and General Shareholders Meeting of April 01, 2013 approved the new management compensation proposal for the current year, in the annual amount of up to R$7,050, which will be allocated to management members as set forth in article 10, paragraph 1, of the Company’s bylaws.
As required by IAS 24 - Related Parties Disclosures, in the year ended December 31, 2013, key management personnel’s compensation was as follows:
| 2013 | 2012 | |||||||
| Compensation |
5,066 | 6,700 | ||||||
| Share-based compensation |
547 | 814 | ||||||
|
|
|
|
|
|||||
| 5,613 | 7,514 | |||||||
|
|
|
|
|
|||||
| 28 | NON-CASH TRANSACTIONS |
Through December 31, 2013, the Company borrowed R$7,707 (R$96,408 as of December 31, 2012), which was used to purchase property, plant and equipment items, and as such this transaction is not reflected in the consolidated statement of cash flows.
F-111
Table of Contents
| 29 | COMMITMENTS |
The Company has a property lease agreement, classified as operational leasing, maturing on May 31, 2015, which entails a monthly commitment of R$100.
| 30 | EVENT AFTER THE REPORTING PERIOD |
On January 27, 2014, the Company disclosed a Material Event Notice about the execution of a purchase and sale agreement between PGI Polímeros do Brasil S.A. and Polymer Group, Inc., and some specific Selling Shareholders which hold 57,013,069 common shares issued by the Company, corresponding to approximately 71.25% of the total shares issued, less treasury shares, and, therefore, the Company’s shareholding control. The purchase price of all Shares Sold is R$555,877,422.75 (five hundred and fifty five million, eight hundred and seventy seven thousand, and seventy five cents).
PGI Brasil is a holding Company, subsidiary of PGI, a North American Company, engaged in the manufacture and sale of nonwoven.
The closing of the transaction will occur after the verification and satisfaction of specific suspensive conditions that are usual in similar transactions, including the prior approval by the antitrust authorities in Brazil and the United States.
After the closing of the transaction, the new controlling shareholder will perform a public offering of shares, as requested by the Company’s bylaws and by regulation applicable to the Company.
F-112
Table of Contents
COMPANHIA PROVIDÊNCIA INDÚSTRIA E COMÉRCIO
CONDENSED CONSOLIDATED BALANCE SHEETS AS OF MARCH 31, 2014 AND DECEMBER 31, 2013 (UNAUDITED)
All amounts in thousands of Brazilian reais (R$)
The accompanying notes are an integral part of these interim financial information.
F-113
Table of Contents
COMPANHIA PROVIDÊNCIA INDÚSTRIA E COMÉRCIO
CONDENSED CONSOLIDATED INCOME STATEMENTS FOR THE THREE-MONTH PERIODS ENDED MARCH 31, 2014 AND 2013 (UNAUDITED)
All amounts in thousands of Brazilian reais (R$), unless otherwise stated
| Three-month period ended March 31, | ||||||||
| 2014 | 2013 | |||||||
| Net revenue (Note 21) |
211,749 | 160,609 | ||||||
| Cost of revenues (Note 22) |
(160,554 | ) | (114,921 | ) | ||||
|
|
|
|
|
|||||
| Gross profit |
51,195 | 45,688 | ||||||
| Selling expenses (Note 22) |
(12,943 | ) | (11,507 | ) | ||||
| Administrative expenses (Note 22) |
(22,488 | ) | (18,057 | ) | ||||
| Other income (Note 22) |
(129 | ) | (164 | ) | ||||
|
|
|
|
|
|||||
| (35,560 | ) | (29,728 | ) | |||||
| Operating income |
15,635 | 15,960 | ||||||
| Finance income (Note 23) |
3,652 | 1,432 | ||||||
| Finance expenses (Note 23) |
(15,601 | ) | (9,514 | ) | ||||
|
|
|
|
|
|||||
| Finance expenses, net |
(11,949 | ) | (8,082 | ) | ||||
| Income before income tax and social contribution |
3,686 | 7,878 | ||||||
| Income tax and social contribution (Note 24) |
(5,336 | ) | (2,828 | ) | ||||
|
|
|
|
|
|||||
| Net income (loss) |
(1,650 | ) | 5,050 | |||||
|
|
|
|
|
|||||
| Earnings per share (basic and diluted) (Note 20 (g)) |
(0,02 | ) | 0,06 | |||||
|
|
|
|
|
|||||
The accompanying notes are an integral part of these interim financial information.
F-114
Table of Contents
COMPANHIA PROVIDÊNCIA INDÚSTRIA E COMÉRCIO
CONDENSED CONSOLIDATED STATEMENTS OF COMPREHENSIVE INCOME FOR THE THREE-MONTH PERIODS ENDED MARCH 31, 2014 AND 2013 (UNAUDITED).
All amounts in thousands of Brazilian reais (R$)
| Three-month period ended March 31, |
||||||||
| 2014 | 2013 | |||||||
| Net income (loss) for the period |
(1,650 | ) | 5,050 | |||||
|
|
|
|
|
|||||
| Other comprehensive income |
||||||||
| Items that may be reclassified subsequently to profit or loss |
||||||||
| Foreign currency translation adjustments |
257 | 102 | ||||||
|
|
|
|
|
|||||
| Total comprehensive income (loss) |
(1,393 | ) | 5,152 | |||||
|
|
|
|
|
|||||
The accompanying notes are an integral part of these interim financial information.
F-115
Table of Contents
COMPANHIA PROVIDÊNCIA INDÚSTRIA E COMÉRCIO
CONDENSED CONSOLIDATED STATEMENT OF CHANGES IN EQUITY FOR THE THREE-MONTH PERIODS ENDED MARCH 31, 2014 AND 2013 (UNAUDITED)
All amounts in thousands of Brazilian reais (R$)
| Capital reserves | Profit reserves | Valuation adjustments to equity | ||||||||||||||||||||||||||||||||||||||||||||||||||||||||||
| Capital | Issuance costs |
Share premium reserve |
Stock options |
Total | Legal reserve |
Profit retention |
Investment reserve |
Total | Treasury shares |
Retained earnings |
Deemed cost adjustment |
Accumulated other comprehensive income |
Total | Total equity |
||||||||||||||||||||||||||||||||||||||||||||||
| As of January 01, 2013 |
422,269 | (13,266 | ) | 10,703 | 1,175 | 11,878 | 9,740 | 33,789 | 68,518 | 112,047 | (813 | ) | 158,443 | (581 | ) | 157,862 | 689,977 | |||||||||||||||||||||||||||||||||||||||||||
|
|
|
|
|
|
|
|
|
|
|
|
|
|
|
|
|
|
|
|
|
|
|
|
|
|
|
|
|
|
|
|||||||||||||||||||||||||||||||
| Income for the period |
5,050 | 5,050 | ||||||||||||||||||||||||||||||||||||||||||||||||||||||||||
| Exchange rate changes on foreign investees (Note 12) |
102 | 102 | 102 | |||||||||||||||||||||||||||||||||||||||||||||||||||||||||
|
|
|
|
|
|
|
|
|
|
|
|
|
|
|
|
|
|
|
|
|
|
|
|
|
|
|
|
|
|
|
|||||||||||||||||||||||||||||||
| Total comprehensive income for the period |
5,050 | 102 | 102 | 5,152 | ||||||||||||||||||||||||||||||||||||||||||||||||||||||||
| Realization of deemed cost (Note 14) |
3,881 | (3,881 | ) | (3,881 | ) | |||||||||||||||||||||||||||||||||||||||||||||||||||||||
| (-) Taxes on realization of deemed cost (Note 20) |
(1,319 | ) | 1,319 | 1,319 | ||||||||||||||||||||||||||||||||||||||||||||||||||||||||
|
|
|
|
|
|
|
|
|
|
|
|
|
|
|
|
|
|
|
|
|
|
|
|
|
|
|
|
|
|
|
|||||||||||||||||||||||||||||||
| Total realization of deemed cost |
2,562 | (2,562 | ) | (2,562 | ) | |||||||||||||||||||||||||||||||||||||||||||||||||||||||
|
|
|
|
|
|
|
|
|
|
|
|
|
|
|
|
|
|
|
|
|
|
|
|
|
|
|
|
|
|
|
|||||||||||||||||||||||||||||||
| Contributions/distributions to shareholders: |
||||||||||||||||||||||||||||||||||||||||||||||||||||||||||||
| Treasury shares cancelled (Note 19) |
642 | 642 | ||||||||||||||||||||||||||||||||||||||||||||||||||||||||||
| Share-based payment (Note 20) |
146 | (21 | ) | 125 | 206 | 331 | ||||||||||||||||||||||||||||||||||||||||||||||||||||||
| Total contributions/distributions to shareholders |
146 | (21 | ) | 125 | 642 | 206 | 973 | |||||||||||||||||||||||||||||||||||||||||||||||||||||
|
|
|
|
|
|
|
|
|
|
|
|
|
|
|
|
|
|
|
|
|
|
|
|
|
|
|
|
|
|
|
|||||||||||||||||||||||||||||||
| As of March 31, 2013 |
422,269 | (13,266 | ) | 10,849 | 1,154 | 12,003 | 9,740 | 33,789 | 68,518 | 112,047 | (171 | ) | 7,818 | 155,881 | (479 | ) | 155,402 | 696,102 | ||||||||||||||||||||||||||||||||||||||||||
|
|
|
|
|
|
|
|
|
|
|
|
|
|
|
|
|
|
|
|
|
|
|
|
|
|
|
|
|
|
|
|||||||||||||||||||||||||||||||
|
|
|
|
|
|
|
|
|
|
|
|
|
|
|
|
|
|
|
|
|
|
|
|
|
|
|
|
|
|
|
|||||||||||||||||||||||||||||||
| As of January 01, 2014 |
422,269 | (13,266 | ) | 10,865 | 1,560 | 12,425 | 11,086 | 86,597 | 97,683 | (100 | ) | 148,198 | (1,659 | ) | 146,539 | 665,550 | ||||||||||||||||||||||||||||||||||||||||||||
|
|
|
|
|
|
|
|
|
|
|
|
|
|
|
|
|
|
|
|
|
|
|
|
|
|
|
|
|
|
|
|||||||||||||||||||||||||||||||
| Loss for the period |
(1,650 | ) | (1,650 | ) | ||||||||||||||||||||||||||||||||||||||||||||||||||||||||
| Exchange rate changes on foreign investees (Note 12) |
257 | 257 | 257 | |||||||||||||||||||||||||||||||||||||||||||||||||||||||||
|
|
|
|
|
|
|
|
|
|
|
|
|
|
|
|
|
|
|
|
|
|
|
|
|
|
|
|
|
|
|
|||||||||||||||||||||||||||||||
| Total comprehensive income for the period |
(1,650 | ) | 257 | 257 | (1,393 | ) | ||||||||||||||||||||||||||||||||||||||||||||||||||||||
| Realization of deemed cost (Note 14) |
3,880 | (3,880 | ) | (3,880 | ) | |||||||||||||||||||||||||||||||||||||||||||||||||||||||
| (-) Taxes on realization of deemed cost (Note 20) |
(1,319 | ) | 1,319 | 1,319 | ||||||||||||||||||||||||||||||||||||||||||||||||||||||||
|
|
|
|
|
|
|
|
|
|
|
|
|
|
|
|
|
|
|
|
|
|
|
|
|
|
|
|
|
|
|
|||||||||||||||||||||||||||||||
| Total realization of deemed cost |
2,561 | (2,561 | ) | (2,561 | ) | |||||||||||||||||||||||||||||||||||||||||||||||||||||||
|
|
|
|
|
|
|
|
|
|
|
|
|
|
|
|
|
|
|
|
|
|
|
|
|
|
|
|
|
|
|
|||||||||||||||||||||||||||||||
| Contributions/distributions to shareholders: |
||||||||||||||||||||||||||||||||||||||||||||||||||||||||||||
| Share-based payment (Note 20) |
114 | 114 | 114 | |||||||||||||||||||||||||||||||||||||||||||||||||||||||||
| Total contributions/distributions to shareholders |
114 | 114 | 114 | |||||||||||||||||||||||||||||||||||||||||||||||||||||||||
|
|
|
|
|
|
|
|
|
|
|
|
|
|
|
|
|
|
|
|
|
|
|
|
|
|
|
|
|
|
|
|||||||||||||||||||||||||||||||
| As of March 31, 2014 |
422,269 | (13,266 | ) | 10,865 | 1,674 | 12,539 | 11,086 | 86,597 | 97,683 | (100 | ) | 911 | 145,637 | (1,402 | ) | 144,235 | 664,271 | |||||||||||||||||||||||||||||||||||||||||||
|
|
|
|
|
|
|
|
|
|
|
|
|
|
|
|
|
|
|
|
|
|
|
|
|
|
|
|
|
|
|
|||||||||||||||||||||||||||||||
The accompanying notes are an integral part of these interim financial information.
F-116
Table of Contents
COMPANHIA PROVIDÊNCIA INDÚSTRIA E COMÉRCIO
CONDENSED CONSOLIDATED STATEMENTS OF CASH FLOWS FOR THE THREE-MONTH PERIODS ENDED MARCH 31, 2014 AND 2013 (UNAUDITED)
All amounts in thousands of Brazilian reais (R$)
| Period ended March 31, | ||||||||
| 2014 | 2013 | |||||||
| Cash flows from operating activities |
||||||||
| Net income for the period |
(1,650 | ) | 5,050 | |||||
| Adjustments: |
||||||||
| Depreciation of property, plant and equipment |
11,249 | 9,245 | ||||||
| Amortization of intangible assets |
1,157 | 1,027 | ||||||
| Accrued interests |
12,662 | 6,253 | ||||||
| Loss on disposal of fixed assets |
3 | 128 | ||||||
| Share-based payment |
114 | 185 | ||||||
| Deferred income tax and social contribution |
3,806 | 2,828 | ||||||
| Provision for tax, labor and civil risks |
10 | |||||||
| Provision for doubtful accounts |
87 | 295 | ||||||
|
|
|
|
|
|||||
| 27,438 | 25,011 | |||||||
|
|
|
|
|
|||||
| Changes in assets and liabilities: |
||||||||
| (Increase) decrease in trade receivables |
9,092 | (11,549 | ) | |||||
| Increase in inventories |
(13,558 | ) | (8,689 | ) | ||||
| (Increase) decrease in recoverable taxes |
(3,948 | ) | 305 | |||||
| Decrease in other receivables |
2,964 | 5,002 | ||||||
| Decrease in trade payables |
(18,170 | ) | (5,672 | ) | ||||
| Increase (decrease) in payroll, social security and related taxes |
806 | (2,825 | ) | |||||
| Decrease in taxes, fees and contributions |
(935 | ) | (1,505 | ) | ||||
| Decrease in other payables |
(1,044 | ) | (8 | ) | ||||
|
|
|
|
|
|||||
| (24,793 | ) | (24,941 | ) | |||||
|
|
|
|
|
|||||
| Other cash flows from operating activities: |
||||||||
| Payment of income tax and social contribution taxes |
(1,386 | ) | ||||||
|
|
|
|
|
|||||
| (1,386 | ) | |||||||
| Net cash provided by operating activities |
1,259 | 70 | ||||||
| Cash flows from investing activities |
||||||||
| Purchase of property, plant and equipment |
(7,121 | ) | (6,415 | ) | ||||
| Acquisition of intangible assets |
(1,233 | ) | (935 | ) | ||||
|
|
|
|
|
|||||
| Net cash used in investing activities |
(8,354 | ) | (7,350 | ) | ||||
| Cash flows from financing activities |
||||||||
| Proceeds from borrowings and financing |
23,410 | 70,478 | ||||||
| Payment of borrowings and financing – principal |
(23,616 | ) | (12,111 | ) | ||||
| Payment of borrowings and financing – interest |
(7,104 | ) | (7,081 | ) | ||||
| Sale of shares |
788 | |||||||
|
|
|
|
|
|||||
| Net cash provided by (used in) financing activities |
(7,310 | ) | 52,074 | |||||
| Effect of exchange rate changes on cash and cash equivalents |
(2,441 | ) | (3,076 | ) | ||||
| Decrease or increase in cash and cash equivalents, net |
(16,846 | ) | 41,718 | |||||
|
|
|
|
|
|||||
| Cash and cash equivalents at the beginning of period (Note 6) |
64,250 | 84,145 | ||||||
| Cash and cash equivalents at the end of period (Note 6) |
47,404 | 125,863 | ||||||
|
|
|
|
|
|||||
| Decrease or increase in cash and cash equivalents, net |
(16,846 | ) | 41,718 | |||||
|
|
|
|
|
|||||
The accompanying notes are an integral part of these interim financial information.
F-117
Table of Contents
Cia Providência Indústria e Comércio
COMPANHIA PROVIDÊNCIA INDÚSTRIA E COMÉRCIO
NOTES TO THE CONDENSED INTERIM FINANCIAL INFORMATION
FOR THE THREE-MONTH PERIOD ENDED MARCH 31, 2014 (UNAUDITED)
In thousands of Brazilian reais, except when otherwise indicated
| 1 | GENERAL INFORMATION |
Companhia Providência Indústria e Comércio, headquartered in São José dos Pinhais, State of Paraná, Brazil, and its subsidiaries (the “Company” or the “Group”) are engaged in the manufacture and sale of plastic products, including nonwoven fabrics under the KAMI brand, resulting from the transformation of polypropylene.
The Company has two subsidiaries, one in the City of Pouso Alegre, State of Minas Gerais, Brazil, and another in Statesville, North Carolina, in the United States of America. In order to expand its production capacity in 2012, the Group installed two new machines. The first was installed in the second quarter in Pouso Alegre and the second in Statesville, which started to operate in the last quarter of 2012.
The issuance of these consolidated interim financial information of the Group was authorized by the Board of Directors on May 13, 2014.
| 2 | SUMMARY OF SIGNIFICANT ACCOUNTING POLICIES |
The significant accounting policies applied in the preparation of these consolidated interim financial information are set out below. These policies have been consistently applied to all reporting periods, unless otherwise stated.
| 2.1 | Statement of compliance |
The accompanying consolidated interim financial information have been prepared in accordance with IAS 34 – Interim Financial Reporting, issued by the International Accounting Standards Board (IASB).
| 2.2 | Basis of preparation |
The accompanying condensed consolidated interim financial information has been prepared based on the historical cost and adjusted in order to reflect financial assets and financial liabilities (including derivatives) stated at fair value through profit or loss, as well as the “deemed cost” of land, buildings, machinery and equipment on the date of transition to IFRS.
The preparation of the condensed interim financial information requires Management to use certain accounting estimates and the exercise of judgment by the Company’s management when applying the accounting policies of the Company. The areas involving a higher degree of judgment and complexity, as well as those where assumptions and estimates are significant to the condensed consolidated interim financial information, are disclosed in Note 3.
| (a) | Changes in accounting policies and disclosures |
There are no new IFRS pronouncements or interpretations effective beginning 2014 and 2013 that had a material impact on the Company’s condensed consolidated interim financial information.
| 2.3 | Consolidation |
| (a) | Condensed consolidated interim financial information |
The following accounting policies are applied in the preparation of the condensed consolidated interim financial information.
F-118
Table of Contents
Cia Providência Indústria e Comércio
Subsidiaries
Subsidiaries are all entities over which the Company has the power to direct the relevant activities, in which it is exposed to variable returns from its involvement and has the ability to use its power to affect investor’s returns.
Subsidiaries are fully consolidated from the date control is transferred to the Company and, when applicable, such consolidation is discontinued from the date control ceases.
Intercompany transactions, balances and unrealized gains and losses are eliminated in consolidation. The accounting policies of subsidiaries are changed, where necessary, to ensure consistency with the policies adopted by the Company and its subsidiaries.
| 2.4 | Segment reporting |
Operating segments are reported consistently with the internal report provided to the chief operating decision-maker. The chief operating decision-maker, who is responsible for allocating resources and assessing the performance of the operating segments, is the Board of Directors, which is also responsible for making the strategic decisions of the Company.
Considering that all decisions are made based on consolidated reports, the only product sold by the Company is the nonwoven fabric, and all decisions related to strategic and financial planning, purchases, sales, investments and allocation of funds are made on a consolidated basis, the Company concluded that they have only one reportable segment.
| 2.5 | Foreign currency translation |
| (a) | Functional and reporting currency |
Items included in the interim financial information of each of the consolidated companies are measured using the currency of the primary economic environment where the companies operates (“functional currency”). The consolidated interim financial information are presented in Brazilian reais (R$), which is the Company’s functional currency, and also the reporting currency of the consolidated interim financial information.
| (b) | Transactions and balances |
Foreign currency-denominated transactions are translated into the Company’s functional currency using the exchange rates prevailing at the transactions or the valuation dates, when items are remeasured. Foreign exchange gains and losses resulting from the settlement of such transactions and from the translation using yearend exchange rates of monetary assets and liabilities denominated in foreign currencies are recognized in the income statement as “Finance income” or “Finance costs”.
| (c) | Consolidated companies using a different functional currency |
The results of operations and financial position of the subsidiary located in the United States, which has a functional currency different from the reporting currency, are translated into the reporting currency as follows:
| (i) | The balances of assets and liabilities reported in each balance sheet are translated using the closing rate on the balance sheet date; |
| (ii) | Income and expenses reported in the income statement are translated using average exchange rates, which are a reasonable approximation of the cumulative effect of the rates prevailing on the transaction dates; and |
| (iii) | All resulting exchange differences are recognized as a separate component of equity. |
F-119
Table of Contents
Cia Providência Indústria e Comércio
| 2.6 | Cash and cash equivalents |
Cash and cash equivalents include cash, bank deposits and other highly liquid short-term investments, which are readily convertible into a known cash amount and subject to an insignificant risk of change in value.
| 2.7 | Financial assets |
2.7.1 Classification
The Company classifies their financial assets in the following categories: at fair value through profit or loss and receivables. The Company does not have held-to-maturity and available-for-sale financial assets. The classification depends on the purpose for which the financial assets were acquired. Management determines the classification of financial assets on initial recognition.
| (a) | Financial assets at fair value through profit or loss |
Financial assets and financial liabilities measured at fair value through profit or loss are derivatives contracted to be held to maturity, designated as hedging instruments. All financial assets and financial liabilities in this category are classified as current assets and current liabilities.
| (b) | Receivables |
Receivables are non-derivative financial assets with fixed or determinable payments that are not quoted in an active market, and comprise “trade and other receivables”. They are included in current assets, except for those with maturities 12 months after the end of the reporting period, which are classified as noncurrent assets.
2.7.2 Recognition and measurement
Financial assets are recognized on the trade date – the date in which the Company undertakes to purchase or sell the asset. Loans and receivables are subsequently carried at amortized cost using the effective interest method.
Gains or losses arising from changes in the fair value of financial assets at fair value through profit or loss are presented in the income statement in “Finance income (expenses)” when earned or incurred.
2.7.3 Impairment of financial assets
Assets stated at amortized cost
The Company assets on the balance sheet date whether there is objective evidence that a financial asset or group of financial assets is impaired. A financial asset or group of financial assets is impaired and impairment losses are incurred only if there is objective evidence of impairment as a result of one or more events that occurred after the initial recognition of the asset (a “loss event”) and such loss event (or events) affects the estimated future cash flows of the financial asset or group of financial assets that can be reliably estimated.
The criteria that the Company uses to determine whether there is objective evidence of an impairment loss include:
| (i) | significant financial difficulty of the issuer or debtor; |
| (ii) | a breach of contract, such as a default or delinquency in the payment of interest or principal; |
| (iii) | the Company, for economic or legal reasons arising from the borrower’s financial difficulty, grant to the borrower a concession that a lender would not otherwise consider; |
| (iv) | it becomes probable that the borrower will file for bankruptcy or other financial reorganization; |
F-120
Table of Contents
Cia Providência Indústria e Comércio
| (v) | the disappearance of an active market for that financial asset because of financial difficulties; or |
| (vi) | observable data indicating that there is a measurable decrease in the estimated future cash flows from a portfolio of financial assets since the initial recognition of those assets, although the decrease cannot yet be identified against the individual financial assets in the portfolio, including: |
| • | adverse changes in the payment status of borrowers in the portfolio; and |
| • | national or local economic conditions that correlate with defaults on the assets in the portfolio. |
The amount of any impairment loss is measured as the difference between the asset’s carrying amount and the present value of estimated future cash flows (excluding future credit losses that have not been incurred) discounted at the financial asset’s original effective interest rate. The carrying amount of the asset is reduced and the amount of the loss is recognized in the income statement. If a loan or held-to-maturity investment is subject to a variable interest rate, the discount rate for measuring an impairment loss is the current effective interest rate set out in the contract. As a practical measure, the Company may measure impairment on the basis of an instrument’s fair value using an observable market price.
If, in a subsequent period, the amount of the impairment loss decreases and the decrease can be related objectively to an event occurring after the impairment was recognized (such as an improvement in the debtor’s credit rating), the reversal of the previously recognized loss is recognized in the income statement.
| 2.8 | Derivative financial instruments and hedging activities |
Derivatives are initially recognized at fair value on the date a derivative contract is entered into and are subsequently remeasured at their fair value, with the changes in fair value charged against profit or loss.
Although the Company uses derivatives for hedging purposes, it does not apply the hedge accounting.
The fair values of derivative instruments are disclosed in Note 7.
| 2.9 | Trade receivables |
Trade receivables are amounts due from customers for sales in the ordinary course of business of the Company. If collection is expected in one year or less, they are classified as current assets. Otherwise, they are presented as noncurrent assets.
Trade receivables are initially stated at present value, less the allowance for doubtful accounts, which is recognized when there is objective evidence that the Company will not be able to recover all the amounts due on their original terms. The allowance for doubtful accounts corresponds to the difference between the carrying amount and the recoverable value. The present value is calculated based on the market rates (Interbank Deposit Certificate (CDI which as of March 31, 2014 was equivalent to 10.55% p.a. (9.77% p.a. as of December 31, 2013).
| 2.10 | Inventories |
Inventories are stated at the lower of cost and net realizable value. Cost is determined using the moving weighted average cost method. The cost of finished products and work in process comprise raw materials, direct labor, other direct costs and related overhead expenses (based on normal operating
F-121
Table of Contents
Cia Providência Indústria e Comércio
capacity), except for borrowing costs. Net realizable value is the estimated selling price in the ordinary course of business, less estimated implementation costs and selling expenses. Imports in transit are stated at the accumulated cost of each import.
| 2.11 | Intangible assets |
| (a) | Goodwill |
Goodwill is measured at cost, represented by its carrying amount at the date of transition to IFRS, less accumulated impairment losses, if any.
The carrying amount of goodwill at the date of transition to IFRS was established on the acquisition or subscription of capital in another entity, represented by the cost of acquisition of the investment which exceeds the book value of the investment, calculated by applying the appropriate acquisition or capital subscription percentage on the investee’s equity amount.
In connection with the first time adoption of IFRS, beginning January 1, 2009, the Company no longer amortizes goodwill arising from investments acquired. Considering that goodwill continues to be amortized for tax purposes, the corresponding deferred tax effects are recorded on the portion of amortization deducted for tax purposes.
Goodwill is tested annually for impairment.
| (b) | Software |
Costs on the maintenance or development of software are recognized as an expense when incurred. Expenditures directly associated with identifiable and exclusive software, controlled by the Company and its subsidiaries, and which will probably generate economic benefits greater than the costs for over one year, are recognized as assets. Direct expenses include the compensation payable to the software development team and the appropriate portion of related general expenses.
Software development costs recognized as assets are amortized under the straight-line method over their useful lives, at the rates disclosed in Note 13.
| 2.12 | Property, plant and equipment |
Land, buildings and construction, machinery and equipment, industrial facilities and furniture and fixtures refer mainly to plants and offices and are stated at historical acquisition cost, adjusted for inflation through December 31, 1995, plus the deemed cost, in January 1, 2009.
Property, plant and equipment items are stated at their historical cost, less accumulated depreciation. The historical cost includes expenditures directly attributable to the acquisition of items and may also include financial charges on borrowings used to finance the construction of property, plant and equipment, which are capitalized over the period necessary to build and prepare the asset for the intended use.
Subsequent costs are included in the asset’s carrying amount or recognized as a separate asset, where appropriate, only when it is probable that future economic benefits associated with the item will flow to the Company and the item cost can be measured reliably. The carrying amount of replaced items or parts is derecognized. All other repairs and maintenance are charged to profit or loss, when incurred.
Land is not depreciated. Depreciation of other assets is calculated under the straight-line method to allocate their costs to their residual values over the estimated useful lives. The useful lives are listed in Note 14.
The residual values and useful lives of assets are reviewed and adjusted, if applicable, at the end of each reporting period.
The carrying amount of an asset is written down immediately to its recoverable amount its carrying amount is greater than its estimated recoverable amount (Note 2.13).
F-122
Table of Contents
Cia Providência Indústria e Comércio
Gains and losses from sales are determined by comparing sales proceeds with the carrying amounts and recorded in line item “Other income (expenses), net” in the income statement.
| 2.13 | Impairment of non-financial assets |
Assets with indefinite useful life, e.g. goodwill, are not amortized and are tested annually for impairment. Property, plant and equipment and other non-financial assets are tested annually for impairment, and also whenever events or changes in circumstances indicate that the carrying amount may not be recoverable. In this case, the recoverable value is calculated to determine if assets are impaired. An impairment loss is recognized at the amount by which the carrying amount of an asset exceeds its recoverable amount, which is the higher of net selling price or the value in use of an asset. For measurement purposes, assets are grouped at the lowest level for which there are separately identifiable cash flows.
| 2.14 | Trade payables |
Trade payables refer to amounts payable for goods or services acquired from suppliers in the ordinary course of business, classified as current liabilities if payment is due within one year or less (or in the regular course of business, even if longer). Otherwise, they are recorded as noncurrent liabilities.
Trade payables are initially recognized at fair value and subsequently measured at amortized cost using the effective interest method. In practice, they are usually recognized at the related invoice amount.
| 2.15 | Borrowings |
Borrowings are initially recognized at fair value, less transaction costs incurred and subsequently carried at amortized cost. Any difference between the amounts raised (less transaction costs) and the settlement amount is recognized in the income statement over the period borrowings are outstanding, using the effective interest method.
Borrowings are classified as current liabilities unless the Company has an unconditional right to defer settlement of the liability for at least 12 months after the reporting period.
| 2.16 | Provisions for tax, labor and civil risks |
Provisions are recognized when the Company has a present legal or constructive obligation as a result of past events, it is probable that an outflow of resources will be required to settle the obligation, based on the opinion of their legal counsel, and the amount can be reliably estimated.
| 2.17 | Current and deferred income tax and social contribution |
Income tax and social contribution expenses comprise current and deferred taxes, and are calculated based on the effective income tax and social contribution rates adjusted as prescribed in the prevailing tax laws. The offset of tax loss carry forwards is limited to 30% of taxable income in Brazil. Income taxes are recognized in the income statement, except to the extent that they relate to items recognized directly in comprehensive income or equity.
Deferred income tax and social contribution are recognized on tax loss carry forwards and the related temporary differences arising from differences between the tax bases of assets and liabilities and their carrying amounts in the interim financial information, Deferred income tax and social contribution are calculated at the rates of 15% (plus a 10% surtax, where applicable) and 9%, respectively Brazil.
Deferred income tax and social contribution assets are recognized only to the extent that it is probable that future taxable income will be available against which temporary differences may be offset. Therefore, in order to support recognition, Management prepares annually a study about the utilization of these income-based taxes, based on internal assumptions and future economic scenarios.
For the subsidiary Providência USA Inc., current and deferred taxes are calculated at the rates of 32% for federal tax and 7% for state tax.
F-123
Table of Contents
Cia Providência Indústria e Comércio
| 2.18 | Employee benefits |
| (a) | Pension obligations |
The Company offers their employees a defined contribution private pension plan (Note 25), whose purpose is to accumulate funds that can become monthly income to supplement the Government Social Security benefit. The plan provides for the employee’s voluntary contributions, deducted from the employee payroll, and contributions made by the Company and its subsidiaries, which are recorded as personnel expenses, with a corresponding entry to current liabilities.
| (b) | Share-based payments |
The Company offers to executives and certain employees, a share-based compensation plan (“Stock Options”), which is duly approved by the Board of Directors ((Note 20.b), according to which the Company receives services in exchange for the stock options granted. The fair value of share options granted, calculated on the grant date, is recognized as an expense with a corresponding increase in equity, during the vesting period, to the extent services are provided.
| (c) | Profit sharing |
The Company recognizes a profit sharing liability and expense on accrual basis, in accordance with the compensation policy.
| 2.19 | Capital |
Ordinary shares are classified in equity. Incremental costs directly attributable to the issue of new shares or options are recorded in equity as a deduction from proceeds, net of taxes.
| 2.20 | Revenue recognition |
Revenue comprises the fair value of the consideration received or receivable for the sale of goods in the ordinary course of business of the Company. Revenue is stated net of taxes, returns, as well as after the elimination of intercompany sales. Revenue is recognized when:
| • | The significant risks and rewards of ownership of the products are transferred to the buyer. |
| • | The entity retains neither continuing managerial involvement to the degree usually associated with ownership nor effective control over the goods sold; |
| • | The amount of revenue can be measured reliably; |
| • | it is probable that the economic benefits associated with the transaction will flow to the entity; and |
| • | the costs incurred or to be incurred in respect of the transaction can be measured reliably |
Therefore, the Company recognizes revenues on the date the product is delivered to the buyer.
| 2.21 | Distribution of dividends |
Dividends declared to the Company’s stockholders are recognized as a liability in the interim financial information, based on the Company’s bylaws. Any amount declared above the mandatory minimum dividend is only accrued on the date it is approved by shareholders at the General Meeting.
| 2.22 | New and revised IFRS issued but not yet effective |
The following standards issued were not yet effective on the issuance date of the interim financial information. This list of standards and interpretations issued includes those which the Company reasonably expects to impact disclosures, financial condition or performance upon their application in the future. The Company intends to adopt such standards when they become effective.
F-124
Table of Contents
Cia Providência Indústria e Comércio
IFRS 9 Financial Instruments – Classification and Measurement – IFRS 9 completes the first part of the project to supersede “IAS 39 Financial Instruments: Recognition and Measurement”. IFRS 9 uses a simple approach to determine whether a financial asset is stated at amortized cost or fair value, based on how an entity manages its financial instruments (its business model) and contractual cash flows underlying the financial assets. The standard also requires the adoption of only one method to determine asset impairment. This standard is effective for years beginning January 1, 2015, and the Company does not expect any significant effect as a result of its adoption.
There are no other standards and interpretations issued and not yet adopted that can significantly impact the profit or loss or equity reported by the Company, based on Management’s opinion.
| 3 | CRITICAL ACCOUNTING ESTIMATES AND JUDGMENTS |
Accounting estimates and judgments are continually assessed and are based on historical experience and other factors, including expected future events that are believed to be reasonable under the circumstances.
| 3.1 | Critical accounting estimates and assumptions |
Based on assumptions, the Company makes forward-looking estimates. By definition, the resulting accounting estimates will are rarely equal to actual results.
The estimates and assumptions that present a significant risk of causing a material adjustment to the carrying amounts of assets and liabilities in the next year are discussed below.
| (a) | Income tax, social contribution and other taxes |
The Company recognizes deferred tax assets and liabilities based on the differences between the carrying amount presented in the interim financial information and the tax basis of assets and liabilities using effective tax rates. The Company also recognizes provisions as a result of circumstances where it is probable that additional taxes will be due. When the final tax outcome of these issues is different from the amounts that were initially estimated and recorded, such differences will impact current and deferred income tax assets and liabilities in the period in which such determination is made.
The Company reviews on a regular basis the possibility of recovery of their deferred tax assets, taking into account the historical profit generated and the projected future taxable income, based on a recoverability study.
| (b) | Fair value of derivatives and other financial instruments |
The Company assesses the fair value of financial instruments using available information and valuation methodologies set by Management. However, both the interpretation of market data and the selection of valuation methodologies require considerable judgment and reasonable estimates to produce the most appropriate realizable value. Consequently, the estimates presented in Note 7 are not necessarily indicative of the amounts that can be realized in the current market. The use of different market assumptions and/or estimation methodologies may have a material effect on the estimated realizable values.
| (c) | Provisions for tax, labor and civil risks |
The Company is party to several administrative proceedings and lawsuits, as described in Note 18. Consequently, it recognizes provisions for all risks on lawsuits and administrative proceedings with respect to which the likelihood of loss is assessed as probable and which the amount of the loss can be reliably estimated. The assessment of the likelihood of loss includes the analysis of available evidence, the hierarchy of laws, the applicable case law, most recent decisions issued by the courts and their relevance within the legal system, as well as the opinion of the outside legal counsel. The Company believes that the provisions for tax, civil and labor risks are properly presented in the interim financial information.
F-125
Table of Contents
Cia Providência Indústria e Comércio
| (d) | ICMS tax incentives |
The Company has State VAT (ICMS) tax incentives granted by the government of the State of Paraná and by the government of the State of Minas Gerais. The Federal Supreme Court (STF) handed down decisions in Direct Actions, declaring the unconstitutionality of several state laws that granted ICMS tax incentives without previous agreement between the States.
Despite the fact that the Company does not have ICMS tax incentives covered by the decision handed down by the STF, it consulted its legal counsel, who issued an opinion on the matter, based on which the Company believes that it does not meet the criteria under IAS 37 for the recognition of a liability.
| 4 | FINANCIAL RISK MANAGEMENT |
| 4.1 | Financial risk factors |
The Company has a Risk Management Committee, designated by the Board of Directors, to assist it and is responsible for defining the policy and managing the risks and the financial instruments using control systems that set currency limits and interest exposures and identify financial institutions where Company’s cash and short-term investment funds will be invested in. The carryng amount of all financial instruments, including derivatives, as well as the results obtained compared to the proposed goals, are presented to and analyzed monthly by the Risk Management Committee and submitted to the approval of the Company’s Board of Directors.
Among the procedures defined by the current policy, the Company adopts monthly routines that enable it to project and assess currency exposure since it has transactions and debts in the foreign market and is exposed to these risks.
| (a) | Market risk |
| (i) | Currency and interest rate risk |
The Company is exposed to market risks related to adverse changes in interest and foreign exchange rates, 27% of the indebtedness is denominated to local currency and subject to variable and fixed interest rates, and the remaining 73% is indexed to the LIBOR (London Interbank Offered Rate) and SIFMA (Securities Industry and Financial Markets Association). A significant portion of revenues (31%) derives from sales in foreign markets and is equally exposed to fluctuations in exchange rates.
A portion of the indebtedness is indexed to the Interbank Deposit Certificate (CDI) and is, therefore, subject to variable interest rates. The financial result is partially affected by changes in the benchmark interest rate (Special System for Settlement and Custody (SELIC).
The table below shows the Company’s net foreign currency exposure.
| Consolidated | ||||||||||||||||
| March 31, 2014 |
December 31, 2013 |
|||||||||||||||
| R$ thousand |
US$ thousand |
R$ thousand |
US$ thousand |
|||||||||||||
| Assets: |
||||||||||||||||
| Trade receivables |
85,071 | 37,592 | 85,958 | 36,693 | ||||||||||||
| Liabilities: |
||||||||||||||||
| Trade payables |
(7,781 | ) | (3,438 | ) | (2,989 | ) | (1,276 | ) | ||||||||
| Borrowings and financing |
(515,126 | ) | (227,630 | ) | (540,393 | ) | (230,681 | ) | ||||||||
|
|
|
|
|
|
|
|
|
|||||||||
| Short positions |
(522,907 | ) | (231,068 | ) | (543,382 | ) | (231,957 | ) | ||||||||
|
|
|
|
|
|
|
|
|
|||||||||
| Total exposure |
(437,836 | ) | (193,476 | ) | (457,424 | ) | (195,264 | ) | ||||||||
|
|
|
|
|
|
|
|
|
|||||||||
F-126
Table of Contents
Cia Providência Indústria e Comércio
The Company invests in foreign operations, whose net assets are exposed to the currency risk. Currency exposure arising from the investment in foreign operations is hedged mainly through borrowings denominated in the same currency as these investments.
Sensitivity to the foreign exchange rate – The impacts arising from a fluctuation by 25% and 50% in the reasonable possible scenario of the U.S. dollar exchange rate for each financial instrument exposed are as follows:
| Risk | (-) 50 % | (-) 25 % | Reasonable possible scenario |
(+) 25 % | (+) 50 % | |||||||||||||||||||
| Foreign exchange rate |
Dollar | 1.2300 | 1.8450 | 2.4600 | 3.0750 | 3.6900 | ||||||||||||||||||
| Trade receivables |
Dollar | (38,833 | ) | (15,714 | ) | 7,406 | 30,525 | 53,645 | ||||||||||||||||
| Borrowings |
Dollar | 235,141 | 95,149 | (44,843 | ) | (184,835 | ) | (324,828 | ) | |||||||||||||||
| Trade payables |
Dollar | 3,552 | 1,437 | (677 | ) | (2,792 | ) | (4,907 | ) | |||||||||||||||
|
|
|
|
|
|
|
|
|
|
|
|||||||||||||||
| Gains or Losses |
199,860 | 80,872 | (38,114 | ) | (157,102 | ) | (276,090 | ) | ||||||||||||||||
|
|
|
|
|
|
|
|
|
|
|
|||||||||||||||
In addition to the sensitivity analysis presented above, the Company measures its financial instruments considering the reasonable possible effects in profit or loss and equity against the risks assessed by the Company’s management at the end of the reporting period. Based on the financial position as of March 31, 2014, it is estimated that these effects would approximate the amounts disclosed in the reasonable possible scenario column of the table above, as the assumptions used by the Company approximate those described above.
Sensitivity to the interest rate – The impacts of a 25% and 50% fluctuation of interest rates on profit or loss in the reasonable possible scenario of indexes (CDI/LIBOR6) in the 12-month period are described below:
| Risk | (-) 50 % | (-) 25 % | Reasonable possible scenario |
(+) 25 % | (+) 50 % | |||||||||||||||||||
| Rates |
CDI/Selic | 5.63 | 8.44 | 11.25 | 14.06 | 16.88 | ||||||||||||||||||
| Rates |
LIBOR6 | 0.16 | 0.25 | 0.33 | 0.41 | 0.49 | ||||||||||||||||||
| Short-term investments |
CDI/Selic | 1,846 | 2,805 | 3,789 | 4,799 | 5,835 | ||||||||||||||||||
| Borrowings and financing |
LIBOR6 | (7,510 | ) | (7,764 | ) | (8,032 | ) | (8,271 | ) | (8,524 | ) | |||||||||||||
|
|
|
|
|
|
|
|
|
|
|
|||||||||||||||
| Loss |
(5,664 | ) | (4,959 | ) | (4,243 | ) | (3,472 | ) | (2,689 | ) | ||||||||||||||
|
|
|
|
|
|
|
|
|
|
|
|||||||||||||||
In addition to the sensitivity analysis presented above, the Company measures its financial instruments considering the reasonable possible effects on profit or loss and equity against the risks assessed by the Company’s management at the end of the reporting period. Based on the financial position of outstanding short-term investments and borrowings and financing as of March 31, 2014, it is estimated that these effects would be close to the amounts disclosed in the reasonable possible scenario column of the table above, as the assumptions used by the Company are close to those described above.
| (ii) | Derivative transactions |
The Company carries out transactions in the foreign market and are exposed to market risks arising from fluctuations in foreign currencies and interest rates. The exposure to the risk arising from future payments in local currency of liabilities linked to the foreign exchange market is hedged mainly by the portfolio of trade receivables from export sales or realized by the Company.
F-127
Table of Contents
Cia Providência Indústria e Comércio
The Company also carries out transactions with derivatives pegged to foreign currencies, mainly the U.S. dollar, for hedging purposes (hedge against possible interest and exchange rate fluctuations), based on the guidelines set in the Market Risk Management Policy approved by the Board of Directors and implemented by the Risk Management Committee.
The objective of the Market Risk Management Policy is basically to hedge at least 75% of the Company’s short-term cash flow for defined periods ranging from 9 to 12 months, primarily through traditional market transactions, such as, for example, Non-Deliverable Forward (NDF) contracts, options and the dollar futures on the Brazilian Commodities & Futures Exchange (BM&F), defining limits by type of transaction and counterparty.
In order to measure the effects of the fluctuations in the indices and rates linked to derivative transactions, the Company prepared the sensitivity analysis table below, including a scenario considered as reasonable possible by the Company’s management, a situation considered possible of at least 25% reduction in the variables used, and a situation considered remote of at least 50% reduction in the risk variables:
Sensitivity analysis table
| Transaction |
Risk | (-) 50% | (-) 25% | Reasonable possible scenario |
(+) 25% | (+) 50% | ||||||||||||||||||
| Swap US$ x CDI |
CDI fluctuation | (20,994 | ) | (9,359 | ) | 2,586 | 14,823 | 27,333 | ||||||||||||||||
| Currency forward (NDF) |
US$ fluctuation | (12,876 | ) | (7,670 | ) | (962 | ) | 3,180 | 8,451 | |||||||||||||||
|
|
|
|
|
|
|
|
|
|
|
|||||||||||||||
| Gain (loss) |
(33,870 | ) | (17,029 | ) | 1,624 | 18,003 | 35,784 | |||||||||||||||||
|
|
|
|
|
|
|
|
|
|
|
|||||||||||||||
The amounts in the sensitivity analysis table were determined considering the US dollar curve and the future US dollar quotations published by the BM&F. Based on these rates, the Company applied the reduction percentages in accordance with each scenario, projected the cash flows up through to the maturity of transactions and discounted them through the balance sheet date.
This analysis was only considered for purposes of compliance with the prevailing legislation, in Brazil for public companies (CVM 475/08), since the Company carries out derivative transactions only for hedging purposes and elimination of the effects of currency and interest rate fluctuations, which are not used for speculative purposes.
In addition to the sensitivity analysis, the Company measures its financial instruments considering the reasonable possible effects on profit or loss and equity against the risks assessed by the Company’s management at the end of the reporting period. Based on the financial position and notional amount of outstanding derivatives as of March 31, 2014, it is estimated that these effects would approximate the amounts disclosed in the reasonable possible scenario column of the table above, as the assumptions used by the Company approximate those described above.
| (b) | Credit risk |
The Company’s sales policy is closely related to the Credit Policy established by the Company and to the level of credit risk which it is willing to accept in the course of its business. To minimize possible default, the Company diversifies its receivables portfolio, selects customers, and monitors sales terms and individual credit limits, and requires collaterals.
The credit quality of financial assets that are neither past due nor impaired can be assessed by reference to external credit ratings or to historical information about default rates for counterparties.
F-128
Table of Contents
Cia Providência Indústria e Comércio
Trade receivables: the credit risk of customers is subject to the procedures, controls and policies established by the Company for this purpose. Credit limits are set for all customers based on internal classification criteria. The amounts classified in Group 1 refer to customers with no default in the past. The amounts in Group 2 refer to defaulting customers in the past, i.e., those which on any time were included in the criteria for recognition of allowance for doubtful accounts.
| March 31, 2014 |
December 31, 2013 |
|||||||
| Trade receivables |
||||||||
| Group 1 |
162,925 | 175,662 | ||||||
| Group 2 |
5,147 | 5,147 | ||||||
|
|
|
|
|
|||||
| 168,072 | 180,809 | |||||||
Cash and cash equivalents: the credit risk of balances with banks and other financial institutions is managed by the treasury area according to the policy established.
| Bank account, deposits and short-term investments | March 31, 2014 |
December 31, 2013 |
||||||
| brAAA |
37,001 | 43,742 | ||||||
| brA+f |
6,570 | 6,436 | ||||||
| brA |
7,579 | |||||||
| AA- |
3,833 | 6,493 | ||||||
|
|
|
|
|
|||||
| 47,404 | 64,250 | |||||||
|
|
|
|
|
|||||
Source: Standard & Poor’s and Fitch Ratings
| (c) | Liquidity risk |
Cash flow is projected in the operating entities consolidated by the Company’s Finance Department. The liquidity risk management of the Company, which is Management’s responsibility, monitors rolling forecasts of the liquidity requirements of the Company to ensure they have sufficient cash to meet operating needs.
Surplus cash held by the operating entities, in addition to the balance required for working capital management, is invested in short-term instruments, in order to offer maximum liquidity and cover disbursements.
F-129
Table of Contents
Cia Providência Indústria e Comércio
The table below analyzes the consolidated non-derivative financial assets and liabilities and derivative financial assets and liabilities to be settled by the Company, according to relevant maturity dates, corresponding to the remaining period in the balance sheet through the contractual maturity date. Derivative financial liabilities are included in the analysis if their contractual maturities are essential for an understanding of the timing of the cash flows. The amounts disclosed in the table are the contractual undiscounted cash flows.
| Up to 1 month |
1 to 3 months |
3 months to 1 year |
1 to 5 years |
Over 5 years | Total | |||||||||||||||||||
| At March 31, 2014 |
||||||||||||||||||||||||
| Assets |
||||||||||||||||||||||||
| Cash and cash equivalents |
47,404 | 47,404 | ||||||||||||||||||||||
| Derivative financial instruments |
14,746 | 14,746 | ||||||||||||||||||||||
| Trade receivables |
65,519 | 86,660 | 13,229 | 2,664 | 168,072 | |||||||||||||||||||
| Escrow deposits |
411 | 411 | ||||||||||||||||||||||
|
|
|
|
|
|
|
|
|
|
|
|
|
|||||||||||||
| 127,669 | 86,660 | 13,229 | 3,075 | 230,633 | ||||||||||||||||||||
| Liabilities: |
||||||||||||||||||||||||
| Trade payables |
(31,740 | ) | (10,065 | ) | (41,805 | ) | ||||||||||||||||||
| Borrowings and financing |
||||||||||||||||||||||||
| – Floating rates |
(7,969 | ) | (3,371 | ) | (58,800 | ) | (278,964 | ) | (90,867 | ) | (439,971 | ) | ||||||||||||
| – Fixed rates |
(83 | ) | (993 | ) | (29,288 | ) | (141,341 | ) | (21,277 | ) | (192,982 | ) | ||||||||||||
|
|
|
|
|
|
|
|
|
|
|
|
|
|||||||||||||
| (39,792 | ) | (14,429 | ) | (88,088 | ) | (420,305 | ) | (112,144 | ) | (674,758 | ) | |||||||||||||
| 87,877 | 72,231 | (74,859 | ) | (417,230 | ) | (112,144 | ) | (444,125 | ) | |||||||||||||||
|
|
|
|
|
|
|
|
|
|
|
|
|
|||||||||||||
Derivatives are managed based on net fair value. These derivatives include interest rate swaps, non-deliverable forward and e U.S. dollar option contracts used by the Company to manage the consolidated interest rate profile.
| 4.2 | Capital management |
The objectives of the Company in managing capital are to safeguard their ability to continue as going concerns in order to offer returns to shareholders and security to other stakeholders and to maintain an efficient capital structure.
Capital management is monitored using the debt/capitalization ratio, whose objective is to maintain a ratio equal to or lower than 0.65. As of March 31, 2014, this ratio was 0.46 (0.47 as of December 31, 2013), which demonstrates that the Company’s capital structure is maintained within the preset limits. The table below shows the calculation:
| March 31, 2014 |
December 31, 2013 |
|||||||
| Total borrowings balance |
569,704 | 590,930 | ||||||
| Equity balance |
664,271 | 665,550 | ||||||
|
|
|
|
|
|||||
| Capitalization |
1,233,975 | 1,256,480 | ||||||
| Total debt / capitalization |
||||||||
| Total debt |
0.46 | 0.47 | ||||||
| 4.3 | Fair value estimation |
The carrying amounts of trade receivables (net of allowance for doubtful accounts) and payables, approximate their fair values. The fair values of financial liabilities for disclosure purposes are estimated by discounting the future contractual cash flows at the current market interest rate available to the Company for similar financial instruments, as disclosed in Note 16.
F-130
Table of Contents
Cia Providência Indústria e Comércio
The Company categorize its financial instruments measured at fair value through profit or loss, according to the following hierarchy levels:
Level 1 – prices quoted (unadjusted) in active markets for identical assets or liabilities. This level does not apply to the Company as of March 31, 2014;
Level 2 – inputs other than prices quoted in active markets included in Level 1 that are observable for an asset or liability, either directly or indirectly; and
Level 3 – techniques using input with significant effects on the fair value recorded that are not based on observable market inputs. This level does not apply to the Company as of March 31, 2014.
| March 31, 2014 |
December 31, 2013 |
|||||||
| Level 2 | Level 2 | |||||||
| Current assets |
||||||||
| Cash and cash equivalents |
||||||||
| Fair value through profit or loss |
47,404 | 64,250 | ||||||
|
|
|
|
|
|||||
| 47,404 | 64,250 | |||||||
|
|
|
|
|
|||||
| Derivative financial assets |
||||||||
| Derivative financial instruments |
14,746 | 24,674 | ||||||
|
|
|
|
|
|||||
| 14,746 | 24,674 | |||||||
|
|
|
|
|
|||||
| Total current assets |
62,150 | 88,924 | ||||||
|
|
|
|
|
|||||
The Company did not transfer assets or liabilities between the hierarchy levels of fair value for the three-month period ended March 31, 2014 and for the year ended December 31, 2013.
| 5 | FINANCIAL INSTRUMENTS BY CATEGORY |
| March 31, 2014 |
December 31, 2013 |
|||||||
| Cash and cash equivalents |
||||||||
| Banks and short-term investments |
47,404 | 64,250 | ||||||
|
|
|
|
|
|||||
| 47,404 | 64,250 | |||||||
|
|
|
|
|
|||||
| Financial assets |
||||||||
| Loans and receivables: |
||||||||
| Trade receivables |
168,072 | 180,809 | ||||||
| Escrow deposits |
411 | 372 | ||||||
|
|
|
|
|
|||||
| 168,483 | 181,181 | |||||||
|
|
|
|
|
|||||
| Fair value through profit or loss: |
||||||||
| Derivative financial instruments |
14,746 | 24,674 | ||||||
|
|
|
|
|
|||||
| 14,746 | 24,674 | |||||||
|
|
|
|
|
|||||
| Total assets |
230,633 | 270,105 | ||||||
|
|
|
|
|
|||||
| Financial liabilities |
||||||||
| Stated at amortized cost: |
||||||||
| Trade payables |
41,805 | 59,975 | ||||||
| Borrowings and financing |
569,704 | 590,930 | ||||||
|
|
|
|
|
|||||
| Total liabilities |
611,509 | 650,905 | ||||||
|
|
|
|
|
|||||
F-131
Table of Contents
Cia Providência Indústria e Comércio
| 6 | CASH AND CASH EQUIVALENTS |
The balance of line item ‘Cash and cash equivalents’ includes cash held by the Company. At the end of the reporting period, this balance, as recorded in the statement of cash flows, may be reconciled with the related balance sheet items, as shown below:
| March 31, 2014 |
December 31, 2013 |
|||||||
| Banks and cash on hand |
15,422 | 11,124 | ||||||
| Short-term investment funds |
31,982 | 53,126 | ||||||
|
|
|
|
|
|||||
| Cash and cash equivalents in the balance sheet |
47,404 | 64,250 | ||||||
|
|
|
|
|
|||||
Short-term investment funds comprise mainly of investment funds, whose investment portfolios are comprised basically of highly liquid investments in federal government bonds, repurchase transactions and Bank Certificates of Deposit (CDB), yielding average interest of 102% (102% as of December 31, 2013) of the Interbank Deposit Certificate (CDI) fluctuation. The Company does not invest in exclusive investment funds.
| 7 | DERIVATIVE FINANCIAL INSTRUMENTS |
| Assets | ||||||||
| March 31, 2014 |
December 31, 2013 |
|||||||
| Interest rate swaps (a) |
15,499 | 21,571 | ||||||
| Foreign exchange forwards contracts (b) |
(943 | ) | 1,487 | |||||
| US dollar option contracts (c) |
190 | 1,616 | ||||||
|
|
|
|
|
|||||
| Current portion |
14,746 | 24,674 | ||||||
|
|
|
|
|
|||||
The fair values of derivatives were calculated by the Company and represent the exit price on the balance sheet date. Consequently, the fair values calculated are only valid on the dates of the consolidated information and may be subject to subsequent changes due to changes in market variables in the future, in particular with respect to fluctuations in exchange rates.
The financial derivatives entered into by the consolidated companies do not require margin call, and amounts are only increased or reduced on the established dates.
| (a) | Interest rate swaps – CDI x US$ and LIBOR6 floating x fixed |
The notional amounts of the interest rate swap contracts outstanding as of March 31, 2014 total R$154,601 (R$167,294 as of December 31, 2013).
In order to hedge its liability exposures (CDI and LIBOR interest rates) from borrowings and financing, the Company entered into swap contracts, traded in Bolsa de Mercadorias e Futuros – BM&F and registered with CETIP, whose balances and conditions are as follows:
| • | Banco Itaú: US$52,4 million – Company receives in US$ + 4.85% p.a. and pays in CDI + 1.70% p.a., maturing on a semiannual basis through September 2018; |
| • | Banco Itaú: R$50 million – Company receives in R$ + 8% p.a., and pays in 98.70% of CDI p.a., maturing on a quarterly basis through February 2016; and |
| • | Banco Santander: R$ 4 million – Company receives in R$ + 8% p.a., and pays in 100% of CDI p.a., maturing on a quarterly basis through February 2016. |
| (b) | Forward foreign exchange contracts: |
The notional amounts of the outstanding forward foreign exchange contracts outstanding as of March 31, 2014 total R$ 24,061 (R$28,147 as of December 31, 2013).
F-132
Table of Contents
Cia Providência Indústria e Comércio
In order to hedge against the volatility of liability exposures in U.S. dollars, arising from the total exposure (cash flows) through March 31, 2014, the Company entered into Non-Deliverable Forward contracts in U.S. dollars, in the following amounts and conditions:
| • | Banco HSBC: US$3,9 million – long position in U.S. dollars, strike rate of R$2.5267, maturing on October 15, 2014; November 17, 2014 and December 15, 2014. |
| • | Banco Itaú BBA: US$2,8 million – long position in U.S. dollars, strike rate of R$2.4748, maturing on September 15, 2013; |
| • | Banco Bradesco: US$4 million – long position in U.S. dollars, strike rate of R$2.4126, maturing on June 16, 2014; July 15, 2014; August 15, 2014. |
| (c) | U.S. dollar call option contracts: |
The notional values of the US dollar call option contracts outstanding as of March 31, 2014 total R$24,061 (R$27,713 as of December 31, 2013). Total premium paid was R$1,142.
In order to hedge against the volatility of the liability exposures in U.S. dollar, arising from the total exposure (cash flows) through March 31, 2014, the Company entered into call option contracts in U.S. dollars in the following amounts and conditions:
| • | Banco Votorantim: US$3,1 million – call option at the rate of R$2.3618, maturing on April 15, 2014 and July 15, 2014; premium paid: R$317 thousand; |
| • | Banco Itaú: US$5,7 million – call option at the rate of R$2.4588, maturing on May 15, 2014; June 16, 2014, August 15, 2014 and November 17, 2014; premium paid: R$635 thousand; |
| • | Banco Bradesco: US$1 million – call option at the rate of R$2.52, maturing on December 15, 2014; premium paid: R$114 thousand; and |
| • | Banco Santander: US$0,7 million – call option at the rate of R$2.5040, maturing on October 15, 2014; premium paid: R$76 thousand. |
| 8 | TRADE RECEIVABLES |
| March 31, 2014 |
December 31, 2013 |
|||||||
| Trade receivables – domestic customers |
88,077 | 99,840 | ||||||
| Trade receivables – foreign customers |
85,300 | 86,187 | ||||||
| Allowance for doubtful accounts – domestic customers |
(5,076 | ) | (4,989 | ) | ||||
| Allowance for doubtful accounts – foreign customers |
(229 | ) | (229 | ) | ||||
|
|
|
|
|
|||||
| Trade receivables, net |
168,072 | 180,809 | ||||||
|
|
|
|
|
|||||
| Current portion |
165,408 | 177,822 | ||||||
| Noncurrent portion |
2,664 | 2,987 | ||||||
As of March 31, 2014, the average days sales outstanding is 73 days (73 days as of December 31, 2013). The Company recognized an allowance for doubtful accounts for all domestic trade receivables past-due over 90 days. For foreign trade receivables, the allowance for doubtful accounts relies on the analysis of the current financial condition and the economic and political environment in the country where each borrower is located.
F-133
Table of Contents
Cia Providência Indústria e Comércio
The aging list of trade receivables is as follows:
| March 31, 2014 |
December 31, 2013 |
|||||||
| Current |
157,509 | 174,109 | ||||||
| Up to 60 days past-due |
7,954 | 4,996 | ||||||
| 61 to 90 days past-due |
2,605 | 630 | ||||||
| Over 90 days past-due |
5,309 | 6,292 | ||||||
|
|
|
|
|
|||||
| Total |
173,377 | 186,027 | ||||||
|
|
|
|
|
|||||
| Allowance for doubtful accounts |
(5,305 | ) | (5,218 | ) | ||||
|
|
|
|
|
|||||
| Total |
168,072 | 180,809 | ||||||
|
|
|
|
|
|||||
The changes in the allowance for doubtful accounts were as follows:
| March 31, 2014 |
December 31, 2013 |
|||||||
| Opening balance |
(5,218 | ) | (5,102 | ) | ||||
| Allowance for doubtful accounts |
(243 | ) | (946 | ) | ||||
| Unused amounts reversed |
156 | 830 | ||||||
|
|
|
|
|
|||||
| Closing balance |
(5,305 | ) | (5,218 | ) | ||||
The recognition and derecognition of the allowance for doubtful accounts were recorded in “Selling expenses” in the income statement. Amounts charged to the allowance for doubtful account are generally written off when there is no expectation of recovering the accounts.
The maximum exposure to credit risk on the reporting period is the carrying amount of each type of receivables mentioned above.
| 9 | INVENTORIES |
| March 31, 2014 |
December 31, 2013 |
|||||||
| Raw materials |
21,385 | 15,760 | ||||||
| Auxiliary raw materials |
9,094 | 10,470 | ||||||
| Work in process |
5,365 | 1,116 | ||||||
| Finished products |
22,221 | 20,903 | ||||||
| Storeroom supplies |
16,846 | 15,870 | ||||||
| Goods in transit |
2,766 | |||||||
|
|
|
|
|
|||||
| Total |
77,677 | 64,119 | ||||||
|
|
|
|
|
|||||
Management expects inventories to be consumed within a period of less than 12 months.
| 10 | RECOVERABLE TAXES |
| March 31, 2014 |
December 31, 2013 |
|||||||||||||||
| Current assets |
Noncurrent assets |
Current assets |
Noncurrent assets |
|||||||||||||
| State VAT (ICMS) |
13,930 | 534 | 10,936 | 592 | ||||||||||||
| Federal VAT (IPI) |
5,883 | 6,241 | ||||||||||||||
| Tax on revenue (COFINS) |
21,016 | 4,817 | 19,672 | 4,817 | ||||||||||||
| Tax on revenue (PIS) |
4,636 | 1,049 | 4,345 | 1,049 | ||||||||||||
| Prepayments of income tax and social contribution |
1,000 | 87 | 1,456 | 86 | ||||||||||||
| Withholding income tax (IRRF) |
2,526 | 1,045 | 2,338 | 1,043 | ||||||||||||
|
|
|
|
|
|
|
|
|
|||||||||
| Total |
48,991 | 7,532 | 44,988 | 7,587 | ||||||||||||
|
|
|
|
|
|
|
|
|
|||||||||
F-134
Table of Contents
Cia Providência Indústria e Comércio
Current ICMS credits arise from purchase of raw materials consumed on production sold to foreign countries. The Company files qualification/accreditation processes with the State Government of Paraná, to subsequently trade (sale) and/or use them as part of the payment of the electric energy bill.
Noncurrent ICMS credits arise from the purchase of property, plant and equipment items which are realizable within 48 months, pursuant to prevailing regulations.
PIS/COFINS credits refer to taxes paid when importing a new machine, whose credits can be offset against with future PIS/COFINS payables.
As of December 31, 2013, the period covered originally under the Special Regime for Recovery of Exporting Company Tax Amounts (REINTEGRA), introduced by Decree 7633/2011 and extended by MP 601/2012, ended. In 2013 the Company recorded R$6,410 (R$5,679 in 2012) relating to credits obtained through this tax grant, of which part will be received in cash in 2014 through a reimbursement request and the outstanding balance will be offset against other federal taxes.
| 11 | DEFERRED INCOME TAX AND SOCIAL CONTRIBUTION ASSETS |
The Company adopted the Transitional Tax Regime (RTT) introduced by Law 11.941/09, according to which corporate income tax (IRPJ), social contribution (CSLL), taxes on revenues (PIS and COFINS) for fiscal years 2008 and 2009 continue to be calculated based on the accounting methods and criteria prescribed by Law 6.404, of December 15, 1.976, effective as of December 31, 2.007. Accordingly, deferred income tax and social contribution calculated on the adjustments arising from the adoption of the new accounting practices introduced by Law 11.638/07 and Law 11.941/09 (laws that regulated in Brazil the transition to IFRS) were recorded in the Company’s interim financial information, when applicable, in conformity with IAS 12. The Company elected such option in the Corporate Income Tax Return (DIPJ) on June 30, 2011.
The balances of deferred income tax and social contribution credits on tax loss carry forwards and temporary differences are as follows:
| March 31, 2014 |
December 31, 2013 |
|||||||
| Income tax and social contribution assets – Companhia Providência Indústria e Comércio |
||||||||
| Accumulated tax losses |
233,715 | 233,715 | ||||||
| Income tax and social contribution rate |
34 | % | 34 | % | ||||
| Deferred income tax and social contribution credits on tax losses |
79,463 | 79,463 | ||||||
| Deferred income tax and social contribution credits on goodwill arising from downstream merger |
52,021 | 56,750 | ||||||
|
|
|
|
|
|||||
| Total deferred income tax and social contribution assets – Companhia Providência Indústria e Comércio |
131,484 | 136,213 | ||||||
|
|
|
|
|
|||||
| Income tax assets - Providência USA Inc. |
||||||||
| Accumulated tax losses |
7,316 | 6,948 | ||||||
| Federal tax (32% rate) |
2,341 | 2,223 | ||||||
| State tax – North Carolina (rate of 7%) |
512 | 486 | ||||||
| Exchange gain on foreign currency translation |
943 | 984 | ||||||
|
|
|
|
|
|||||
| Total deferred income tax asset – Providência USA Inc. |
3,796 | 3,693 | ||||||
| Total deferred income and social contribution tax assets |
135,280 | 139,906 | ||||||
| Income tax and social contribution liabilities |
||||||||
| Income tax |
||||||||
| Deemed cost of property, plant and equipment |
(218,001 | ) | (221,844 | ) | ||||
| Temporary differences: |
||||||||
| Difference between depreciation for accounting records and recognized for tax purposes |
(80,258 | ) | (76,673 | ) | ||||
| Other temporary differences* |
4,120 | (3,700 | ) | |||||
| Total temporary differences |
(76,138 | ) | (80,373 | ) | ||||
|
|
|
|
|
|||||
| (294,139 | ) | (302,217 | ) | |||||
| Income tax rate |
25 | % | 25 | % | ||||
| Deferred income tax debts on deemed cost and temporary differences |
(73,535 | ) | (75,555 | ) | ||||
F-135
Table of Contents
Cia Providência Indústria e Comércio
| March 31, 2014 |
December 31, 2013 |
|||||||
| Income tax and social contribution assets – Companhia Providência Indústria e Comércio |
||||||||
| Social contribution |
||||||||
| Deemed cost of property, plant and equipment |
(218,001 | ) | (221,844 | ) | ||||
| Temporary differences: |
||||||||
| Difference between depreciation for accounting records and recognized for tax purposes |
(80,258 | ) | (76,673 | ) | ||||
| Other temporary differences* |
5,555 | (2,278 | ) | |||||
| Total temporary differences |
(74,703 | ) | (78,951 | ) | ||||
|
|
|
|
|
|||||
| (292,704 | ) | (300,795 | ) | |||||
| Social contribution rate |
9 | % | 9 | % | ||||
| Deferred social contribution debts on deemed cost and temporary differences |
(26,343 | ) | (27,072 | ) | ||||
| Total deferred income tax and social contribution – liabilities |
(99,878 | ) | (102,627 | ) | ||||
|
|
|
|
|
|||||
| Total deferred income tax and social contribution, net |
35,402 | 37,279 | ||||||
|
|
|
|
|
|||||
| * | The balance of other temporary differences is basically comprised of: allowance for doubtful accounts, accrued profit sharing and foreign currency changes recognized on the accrual basis. |
The realization of deferred income tax and social contribution are broken down by year as follows:
| March 31, 2014 |
December 31, 2013 |
|||||||
| Through December 2014 |
18,144 | 22,770 | ||||||
| From January 2015 to December 2015 |
21,215 | 21,215 | ||||||
| From January 2016 to December 2016 |
23,169 | 23,169 | ||||||
| From January 2017 to December 2017 |
9,421 | 9,421 | ||||||
| From January 2018 to December 2023 |
63,331 | 63,331 | ||||||
|
|
|
|
|
|||||
| 135,280 | 139,906 | |||||||
|
|
|
|
|
|||||
Deferred income tax and social contribution assets, arising from tax loss carry forwards and temporary differences, are recognized to the extent that is probable that future taxable profit will be available, supported by projections using internal assumptions and future economic scenarios, which may, therefore, change, as approved by the Board of Directors.
Deferred income tax and social contribution assets on goodwill arising from downstream merger refers to tax effects of the reversed merger into the Company in February 2007 of Alnilan S.A., an investment vehicle used in the acquisition of Companhia Providência Indústria e Comércio, which recognized goodwill from such acquisition. As an investment vehicle Alnilan S.A. was not considered the accounting acquirer. As such following the regulation prescribed by CVM Instruction 319/99 and CVM Instruction 349/2001, when going public in July 2007, the Company wrote off the goodwill merged by means of a full provision, and recognized the related deferred income tax and social contribution credit. For accounting and tax purposes, the goodwill and the related provision were amortized on a straight-line basis at the rate of 10% per annum through December 31, 2008.
Beginning January 1, 2009, as a result of the changes introduced by Law 11638/07 and Law 11941/09 and the adoption of IFRS, the goodwill arising from the merger and the related provision were no longer amortized for accounting purposes. Therefore, the amounts corresponding to the deferred income tax and social contribution benefits on future tax amortization of the goodwill are recognized as deferred income tax and social contribution credit.
F-136
Table of Contents
Cia Providência Indústria e Comércio
| 12 | INVESTMENTS |
The adjustments resulting from the translation of the interim financial information of Providência USA Inc., which were originally prepared in U.S. dollar and translated into Brazilian reais, were recorded as cumulative translation adjustments under accumulated other comprehensive income in equity. In the three-month period ended March 31, 2014, the Company recognized as other comprehensive income foreign currency translation adjustment gain derived from exchange rate changes on foreign investments of R$257 (R$102 in 2013).
| 13 | INTANGIBLE ASSETS |
| (a) | Breakdown |
| Software | Goodwill | Total | ||||||||||
| As of December 31, 2013 |
7,997 | 33,133 | 41,130 | |||||||||
|
|
|
|
|
|
|
|||||||
| Adjusted cost |
24,674 | 39,759 | 64,433 | |||||||||
| Accumulated amortization |
(16,631 | ) | (6,626 | ) | (23,257 | ) | ||||||
|
|
|
|
|
|
|
|||||||
| As of March 31, 2014 |
8,043 | 33,133 | 41,176 | |||||||||
|
|
|
|
|
|
|
|||||||
| (b) | Changes in intangible assets |
| Internally-generated software development costs |
Goodwill | Total | ||||||||||
| As of December 31, 2012 |
9,550 | 33,133 | 42,683 | |||||||||
|
|
|
|
|
|
|
|||||||
| Additions |
2,403 | 2,403 | ||||||||||
| Amortization |
(4,267 | ) | (4,267 | ) | ||||||||
| Exchange rate changes |
150 | 150 | ||||||||||
| Transfer |
161 | 161 | ||||||||||
|
|
|
|
|
|
|
|||||||
| As of December 31, 2013 |
7,997 | 33,133 | 41,130 | |||||||||
|
|
|
|
|
|
|
|||||||
| Additions |
1.233 | 1.233 | ||||||||||
| Amortization |
(1.157 | ) | (1.157 | ) | ||||||||
| Exchange rate changes |
(30 | ) | (30 | ) | ||||||||
|
|
|
|
|
|
|
|||||||
| As of March 31, 2014 |
8,043 | 33,133 | 41,176 | |||||||||
|
|
|
|
|
|
|
|||||||
In January 2008, the direct parent company Providência Participações Ltda. was merged (downstream merger) into its subsidiary Isofilme Indústria e Comércio de Plásticos Ltda. (Isofilme). The goodwill recognized by Providência Participações Ltda. in its accounting records, arising from the acquisition of Isofilme, was being amortized on a straight-line basis at the rate of 20% p.a. based on the expected future earnings, supported by an economic appraisal report prepared by a specialized company that used a real discount rate of 9.60% p.a. Beginning January 1, 2009, goodwill is no longer being amortized in the accounting records in a systematic manner, and is only subject to impairment tests, in accordance with IAS 36 - Impairment of assets.
Since the Company opted for the Transitional Tax Regime introduced by Law 11638/07 and Law 11941/09, the goodwill described above continued to be amortized for purposes of calculation of the provision for income tax and social contribution for the year ended December 31, 2009, and the related effects of deferred income tax and social contribution are recognized in profit or loss. Such goodwill was being amortized for tax purposes, and was fully amortized in February, 2013.
F-137
Table of Contents
Cia Providência Indústria e Comércio
Goodwill, in the amount of R$ 33,133, is based on expected future profitability and annually tested for impairment. The last test was performed on December 31, 2013. The assumptions adopted in the calculation of the recoverable amount through the projection of cash flows were based on the analysis of their performance over the past years, analysis and expectations of growth of the operating market, besides Management’s expectations and strategies. Projected amounts were presented in real terms, i.e., they did not consider future inflation effects, and cash flows from operating activities were projected from January 1, 2014 to December 31, 2023. As of March 31, 2014, no impairment indicators were identified for the aforementioned goodwill.
In order to calculate the recoverable amounts, the Company considered the present value of perpetuity of the cash flows for the last year of projection. The discount rate used to calculate the present value of projected cash flows was 9.77% p.a..
| 14 | PROPERTY, PLANT AND EQUIPMENT |
| Land | Buildings and construction |
Machinery and equipment |
Plants | Construction in progress |
Other tangible assets |
Total | ||||||||||||||||||||||
| Cost of property, plant and equipment, gross |
||||||||||||||||||||||||||||
| As of December 31, 2012 |
20,380 | 139,029 | 941,384 | 10,307 | 105,215 | 10,233 | 1,226,548 | |||||||||||||||||||||
|
|
|
|
|
|
|
|
|
|
|
|
|
|
|
|||||||||||||||
| Additions |
1,653 | 17,588 | 1,377 | 12,136 | 1,143 | 33,897 | ||||||||||||||||||||||
| Currency gain (loss) on foreign currency translation |
403 | 4,696 | 23,145 | 35 | 9,720 | 25 | 38,024 | |||||||||||||||||||||
| Write-offs |
(316 | ) | (256 | ) | (14 | ) | (586 | ) | ||||||||||||||||||||
| Transfers |
8,970 | 112,109 | (121,885 | ) | 806 | |||||||||||||||||||||||
|
|
|
|
|
|
|
|
|
|
|
|
|
|
|
|||||||||||||||
| As of December 31, 2013 |
20,783 | 154,348 | 1,093,910 | 11,463 | 5,186 | 12,193 | 1,297,883 | |||||||||||||||||||||
|
|
|
|
|
|
|
|
|
|
|
|
|
|
|
|||||||||||||||
| Additions |
679 | 4,916 | 125 | 1,280 | 121 | 7,121 | ||||||||||||||||||||||
| Currency gain (loss) on foreign currency translation |
(107 | ) | (1,226 | ) | (8,360 | ) | (8 | ) | (93 | ) | (61 | ) | (9,855 | ) | ||||||||||||||
| Write-offs |
(1 | ) | (3 | ) | (4 | ) | ||||||||||||||||||||||
|
|
|
|
|
|
|
|
|
|
|
|
|
|
|
|||||||||||||||
| As of March 31, 2014 |
20,676 | 153,801 | 1,090,465 | 11,580 | 6,373 | 12,250 | 1,295,145 | |||||||||||||||||||||
|
|
|
|
|
|
|
|
|
|
|
|
|
|
|
|||||||||||||||
| Accumulated depreciation: |
||||||||||||||||||||||||||||
| As of December 31, 2012 |
(22,368 | ) | (355,559 | ) | (5,053 | ) | (6,520 | ) | (389,500 | ) | ||||||||||||||||||
|
|
|
|
|
|
|
|
|
|
|
|
|
|
|
|||||||||||||||
| Depreciation |
(4,622 | ) | (34,415 | ) | (745 | ) | (1,034 | ) | (40,816 | ) | ||||||||||||||||||
| Write-offs |
187 | 93 | 5 | 285 | ||||||||||||||||||||||||
|
|
|
|
|
|
|
|
|
|
|
|
|
|
|
|||||||||||||||
| As of December 31, 2013 |
(26,990 | ) | (389,787 | ) | (5,705 | ) | (7,549 | ) | (430,031 | ) | ||||||||||||||||||
|
|
|
|
|
|
|
|
|
|
|
|
|
|
|
|||||||||||||||
| Depreciation |
(1,193 | ) | (9,551 | ) | (203 | ) | (302 | ) | (11,249 | ) | ||||||||||||||||||
| Write-offs |
1 | 1 | ||||||||||||||||||||||||||
|
|
|
|
|
|
|
|
|
|
|
|
|
|
|
|||||||||||||||
| As of March 31, 2014 |
(28,183 | ) | (399,338 | ) | (5,908 | ) | (7,850 | ) | (441,279 | ) | ||||||||||||||||||
|
|
|
|
|
|
|
|
|
|
|
|
|
|
|
|||||||||||||||
| Property plant and equipment, net: |
||||||||||||||||||||||||||||
| As of December 31, 2012 |
20,380 | 116,661 | 585,825 | 5,254 | 105,215 | 3,713 | 837,048 | |||||||||||||||||||||
| As of December 31, 2013 |
20,783 | 127,358 | 704,123 | 5,758 | 5,186 | 4,644 | 867,852 | |||||||||||||||||||||
| As of March 31, 2014 |
20,676 | 125,618 | 691,127 | 5,672 | 6,373 | 4,400 | 853,866 | |||||||||||||||||||||
F-138
Table of Contents
Cia Providência Indústria e Comércio
As allowed by IFRS 1, the Company adopted the deemed cost to determine the fair value of property, plant and equipment, whose carrying amount was substantially lower than its fair value.
The adjustment in the consolidated balance sheet as of January 1, 2009, which was made based on the appraisal report and reviewed by Management, totaled R$302,157. Depreciation on adjustments to the fair value in the three-month periods ended March 31, 2014 and 2013 was R$3,880 for each period, deferred income tax and social contribution were realized on the depreciation amount of R$1,319 for each period.
Depreciation for the three-month period ended March 31, 2014, allocated to the consolidated cost of revenues, totals R$8,954 (R$7,762 as of March 31, 2013), and operating expenses total R$2,295 (R$1,483 as of March 31, 2013).
In order to expand its production capacity, the Company has been investing in the acquisition of new machinery in Statesville plant (13th machinery), so that advances were made in line item “Constructions in progress”.
No borrowing costs were capitalized during the three-month period ended March 31, 2014 (R$482 in the same period of 2013) and the capitalization rate used is 2.39% p.a. in the three-month period ended March 31, 2013.
| 15 | TRADE PAYABLES |
| March 31, 2014 |
December 31, 2013 |
|||||||
| Trade payables – domestic suppliers |
34,023 | 56,986 | ||||||
| Trade payables – foreign suppliers |
7,782 | 2,989 | ||||||
|
|
|
|
|
|||||
| Total |
41,805 | 59,975 | ||||||
|
|
|
|
|
|||||
As of March 31, 2014, the average payment period is 15 days (17 days as of December 31, 2013). The Company implements their financial risk management policies to ensure that all obligations are paid in accordance with the originally agreed terms and conditions.
F-139
Table of Contents
Cia Providência Indústria e Comércio
| 16 | BORROWINGS AND FINANCING |
| Type |
Finance charges |
Currency | Maturities |
March 31, 2014 |
December 31, 2013 |
|||||||||||
| Export credit notes |
(a) | 8% p.a. | Real | Interest: quarterly through 2016 | 526 | 537 | ||||||||||
| Principal: by 2016 | 50,000 | 50,000 | ||||||||||||||
| Prepayment |
(b) | 4.85% p.a. | US dollar | Interest: semiannual through 2018 | 30 | 1,470 | ||||||||||
| Principal: semiannual from 2013 to 2018 | 97,033 | 111,500 | ||||||||||||||
| Export credit notes |
(c) | 8% p.a. | Real | Interest: quarterly through 2016 | 52 | |||||||||||
| Principal: by 2016 | 4,000 | |||||||||||||||
| Machinery financing |
(d) | LIBOR + 0.85% p.a. | US dollar | Interest: semiannual through 2016 | 85 | 1 | ||||||||||
| Principal: semiannual through 2016 | 9,312 | 9,482 | ||||||||||||||
| (e) | LIBOR + 1.25% p.a. | US dollar | Interest: semiannual through 2023 | 115 | 826 | |||||||||||
| Principal: semiannual through 2023 | 77,371 | 84,698 | ||||||||||||||
| Financing of USA plant |
(f) | Libor + 3.91% | US dollar | Interest: semiannual through 2014 | 66 | |||||||||||
| Principal: semiannual through 2014 | 2,376 | |||||||||||||||
| (g) | Libor + 3.08% | US dollar | Interest: semiannual through 2016 | 120 | 116 | |||||||||||
| Principal: semiannual through 2016 | 11,032 | 13,177 | ||||||||||||||
| (h) | LIBOR + 2.50% | US dollar | Interest: semiannual through 2016 | 32 | ||||||||||||
| Principal: 04/03/2016 | 11,273 | 11,713 | ||||||||||||||
| (i) | SIFMA | US dollar | Interest: monthly through 2030 | 5 | 571 | |||||||||||
| Principal: 2030 | 20,264 | 20,176 | ||||||||||||||
| (j) | LIBOR + 1.50% | US dollar | Interest: semiannual through 2020 | 816 | 439 | |||||||||||
| Principal: semiannual through 2020 | 82,930 | 85,847 | ||||||||||||||
| (k) | LIBOR + 1.20% | US dollar | Interest: semiannual through 2022 | 227 | 3 | |||||||||||
| Principal: semiannual through 2022 | 71,944 | 79,628 | ||||||||||||||
| (l) | LIBOR + 2.85% | US dollar | Interest: semiannual through 2017 | 441 | 666 | |||||||||||
F-140
Table of Contents
Cia Providência Indústria e Comércio
| Type |
Finance charges |
Currency | Maturities |
March 31, 2014 |
December 31, 2013 |
|||||||||||
| Principal: 07/01/2017 | 44,348 | 46,381 | ||||||||||||||
| (m) | LIBOR + 3.05% | US dollar | Interest: semiannual through 2014 | 110 | 201 | |||||||||||
| Principal: 08/21/2014 | 11,315 | 11,712 | ||||||||||||||
| (n) | LIBOR + 3.05% | US dollar | Interest: semiannual through 2015 | 225 | 301 | |||||||||||
| Principal: 01/30/2015 | 14,709 | 15,227 | ||||||||||||||
| (o) | LIBOR + 2.10% | US dollar | Interest: semiannual through 2015 | 22 | 61 | |||||||||||
| Principal: 01/28/2015 | 5,895 | 6,103 | ||||||||||||||
| (p) | LIBOR + 2.95% | US dollar | Interest: semiannual through 2015 | 111 | 58 | |||||||||||
| Principal: 04/07/2015 | 6,789 | 7,028 | ||||||||||||||
| (q) | LIBOR + 2.60% | US dollar | Interest: semiannual through 2015 | 141 | 49 | |||||||||||
| Principal: 06/18/2015 | 12,446 | 12,884 | ||||||||||||||
| (r) | LIBOR + 2.10% | US dollar | Interest: semiannual through 2015 | 34 | 11 | |||||||||||
| Principal: 01/07/2015 | 4,473 | 4,685 | ||||||||||||||
| (s) | LIBOR + 2.75% | US dollar | Interest: semiannual through 2015 | 115 | 21 | |||||||||||
| Principal: 12/02/2015 | 12,446 | 12,884 | ||||||||||||||
| (t) | LIBOR + 2.5% | US dollar | Interest: semiannual through 2016 | 109 | ||||||||||||
| Principal: 01/05/2016 | 18,840 | |||||||||||||||
|
|
|
|
|
|||||||||||||
| Total |
569,704 | 590,930 | ||||||||||||||
|
|
|
|
|
|||||||||||||
| Current portion |
95,750 | 83,694 | ||||||||||||||
| Noncurrent portion |
473,954 | 507,236 | ||||||||||||||
|
|
|
|
|
|||||||||||||
| 569,704 | 590,930 | |||||||||||||||
|
|
|
|
|
|||||||||||||
| a) | On February 8, 2013, the Company entered into a NCE – Export Credit Note transaction with Banco Itaú in the amount of R$50,000, at a fixed BRL rate + 8% p.a., together with a swap by the same amount, where Company receives BRL + 8% p.a. and pays 98.70% of CDI. |
| b) | On December 26, 2011, the Company entered into a loan agreement Banco Itaú in the amount of US$52,4 million, with a two-year grace period and semiannual payments through September 26, 2018. The interest rate negotiated 4.85% p.a. In order to hedge this transaction against the fluctuations of the US dollar, the Company contracted a swap transaction in the same amount, where Company receives in USD + 4.85% p.a. and pays in CDI + 1.70% p.a.. |
| c) | On January 30, 2014, the Company entered into a NCE transaction with Banco Santander in the amount of R$4,000 at a fixed BRL rate + 8% p.a., together with a swap by the same amount, where Company receives BRL + 8% p.a. and pays of 100% of CDI. |
F-141
Table of Contents
Cia Providência Indústria e Comércio
| d) | The amount of R$9,397 refers to the loan agreement entered into between Isofilme and the German bank Kreditanstalt für Wiederaufbau (KFW), signed on July 27, 2005, for the purchase of machinery for the manufacture of nonwoven fabrics, bearing interest rate equivalent to the LIBOR fluctuation + 0.85% p.a., with semiannual payment of principal and interest through 2016. |
| e) | The amount of R$77,486 refers to the installments released, out of the total of US$37,5 million, contracted by Isofilme from Banco HSBC, collateralized by German agency Euler Hermes Kreditversicherungs AG. The amount was used to finance a machine set up in Pouso Alegre, Minas Gerais. The interest rate contracted corresponds to LIBOR fluctuation + 1.25% per annum, with semiannual payment of principal and interest. |
| f) | On March 5, 2012, the Company entered into with HSBC a loan agreement in the amount of US$2,5 million to finance working capital requirements of the plant in the United States. The loan matured on February 21, 2014; principal and interest was paid semiannually and bears interest equivalent to LIBOR fluctuation + 3.91% p.a. |
| g) | On March 4, 2011 and July 7, 2011, US$9 million transactions were contracted from Banco Itaú to finance the US plant’s working capital. These transactions mature on March 4, 2016 and December 10, 2016, subject to semiannual interest based on LIBOR rate + 3.08% p.a., on average. |
| h) | On April 13, 2011, a loan contract of US$5 million was entered into with Banco do Brasil to finance the working capital requirements of the plant in the United States. This loan matures on April 3, 2016, and bears interest rate equivalent to LIBOR fluctuation + 2.50% p.a., with semiannual payment. |
| i) | On May 12, 2010, US$9,1 million was raised to finance the construction of the plant in the United States, The transaction, called as Recovery Zone Facility Bonds, consists of the issue of US government bonds of the county of Iredell, managed by a financial agent (Wells Fargo Bank), and collateralized by HSBC, bearing interest calculated on a weekly basis and paid on a monthly basis in accordance with the SIFMA (securities Industry and Financial Markets Association) rate. The SFIMA rate as of March 31, 2014 was 0.15% p.a. |
| j) | The amount of R$72,171 refers to the installments released out of the total loan contract amounting to US$ 36,2 million, entered into on February 12, 2010 between Providência USA Inc., and HSBC, collateralized by the German agent Euler Hermes Kreditversicherungs AG. The funds were used to finance the purchase of the machinery installed in the United States. The loan bears interest equivalent to LIBOR fluctuation + 1.50% p.a., with semiannual payment of interest and principal. |
| k) | The amount of R$ 79,631 refers to the installment released out of the total loan contract amounting to US$37,5 million entered into on August 8, 2011 between Providência USA Inc., and HSBC, collateralized by the German agent Euler Hermes Kreditversicherungs AG, to finance the purchase of the machinery to be installed in the United States, which is released as the machinery and its components are shipped. The loan bears interest equivalent to LIBOR fluctuation + 1.20% p.a. with semiannual payment of interest and principal. |
| l) | On July 27, 2012, a US$20 million transaction was contracted from Banco do Brasil to finance the purchase of the plant in the United States. The transaction will mature on December 29, 2017, subject to semi-annual interest based on LIBOR rate + 2.85% per year. |
| m) | On August 16, 2012, a US$5 million transaction was contracted from Banco Bradesco to finance the US plant’s working capital. The transaction will mature on August 21, 2014, subject to semi-annual interest based on LIBOR rate + 3.05% per year. |
| n) | On January 30, 2013, a US$6,5 million transaction was contracted from Banco Bradesco to finance the US plant’s working capital. The transaction will mature on January 30, 2015, subject to semi-annual interest based on LIBOR rate + 3.05% per year. |
| o) | On February 6, 2013, a US$2,6 million transaction was contracted from Banco do Brasil to finance the US plant’s working capital. The transaction will mature on January 28, 2015, subject to semi-annual interest based on LIBOR rate + 2.10% per year. |
| p) | On April 7, 2013, a US$3,0 million transaction was contracted from Banco Bradesco to finance the US plant’s working capital. The transaction will mature on April 7, 2015, subject to semi-annual interest based on LIBOR rate + 2.95% per year. |
F-142
Table of Contents
Cia Providência Indústria e Comércio
| q) | On September 18, 2013, a US$5,5 million transaction was contracted from Banco Bradesco to finance the US plant’s working capital. The transaction will mature on September 18, 2015, subject to semi-annual interest based on LIBOR rate + 2.60% per year. |
| r) | On July 9, 2013, a US$2,0 million transaction was contracted from Banco do Brasil to finance the US plant’s working capital. The transaction will mature on July 1, 2015, subject to semiannual interest based on LIBOR rate + 2.10% p.a. |
| s) | On December 11, 2013, a US$5,5 million transaction was contracted from Banco Santander to finance the US plant’s working capital. The transaction will mature on December 2, 2015, subject to semi-annual interest based on LIBOR rate + 2.75% per year. |
| t) | On January 15, 2014, a US$8 million transaction was contrated from Banco HSBC to finance the US plant’s working capital. The transaction will mature on January 05, 2016, subject to semi-annual interest based on LIBOR + 2.50% p.a. |
The noncurrent portion matures as follows:
| March 31, 2014 |
December 31, 2013 |
|||||||
| 2015 |
76,989 | 123,365 | ||||||
| 2016 |
141,371 | 121,703 | ||||||
| 2017 |
98,804 | 262,168 | ||||||
| From 2018 to 2030 |
156,790 | |||||||
|
|
|
|
|
|||||
| 473,954 | 507,236 | |||||||
|
|
|
|
|
|||||
Companhia Providência Indústria e Comércio has an international letter of guarantee issued by HSBC to collateralize the amount of US$9,1 million related to the funds raised through the Recovery Zone Facility Bond.
The funds for the exclusive financing of machinery are collateralized by the financed machinery at the remaining balance of the financing. As of March 31, 2014, this amount represents R$241,800, of which R$155,917 refers to the machinery in the plant in the United States and R$86,883 refers to Isofilme’s machinery.
Domestic loans are not collateralized.
Abbreviations:
| CDI | – Interbank Deposit Certificate | |
| LIBOR | – London Interbank Offered Rate | |
| NCE | – Export Credit Note | |
| SIFMA | – Securities Industry and Financial Markets Association |
Also with the objective of financing the construction and buildings and the working capital of the new plants, the Company has available credit lines totaling US$100 million from several financial institutions, bearing interest at rates ranging from Libor + 3.00% to Libor + 4.94% per annum. These funds will be released as the plants receiving the investments identify their cash requirements.
The carrying amounts of borrowings and financing their respective estimated fair values are as follows:
| Carrying amount | Fair value | |||||||||||||||
| March 31, 2014 | December 31, 2013 | March 31, 2014 | December 31, 2013 | |||||||||||||
| Borrowings and financing |
569,704 | 590,930 | 554,102 | 576,566 | ||||||||||||
|
|
|
|
|
|
|
|
|
|||||||||
| 569,704 | 590,930 | 554,102 | 576,566 | |||||||||||||
|
|
|
|
|
|
|
|
|
|||||||||
The fair values presented above included in the level 2 category have been determined in accordance with generally accepted pricing models based on a discounted cash flow analysis, with the most significant inputs being the discount rate that reflects the market interest rates for similar liabilities on the date of the assessment.
F-143
Table of Contents
Cia Providência Indústria e Comércio
| 17 | TAXES, FEES AND CONTRIBUTIONS PAYABLE |
| March 31, 2014 | December 31, 2013 | |||||||||||||||
| Current liabilities |
Noncurrent liabilities |
Current liabilities |
Noncurrent liabilities |
|||||||||||||
| ICMS |
407 | 125 | 419 | 154 | ||||||||||||
| PIS |
10 | 10 | ||||||||||||||
| COFINS |
22 | 22 | ||||||||||||||
| IRRF |
545 | 559 | ||||||||||||||
| IRPJ and CSLL |
657 | 523 | ||||||||||||||
| Social security contribution on gross revenues |
435 | 454 | ||||||||||||||
| Property tax – Statesville |
2,324 | |||||||||||||||
| Other taxes |
394 | 451 | ||||||||||||||
|
|
|
|
|
|
|
|
|
|||||||||
| Total |
2,470 | 125 | 4,762 | 154 | ||||||||||||
|
|
|
|
|
|
|
|
|
|||||||||
| 18 | PROVISIONS FOR TAX, LABOR AND CIVIL RISKS |
The Company is a party to ongoing labor, tax and civil lawsuits at the administrative and judicial levels.
The amounts to be accrued are calculated based on the amounts effectively involved and on the opinion of the outside and in-house legal counsel in charge of the lawsuits. Provisions are only recognized for lawsuits whose likelihood of loss is assessed as probable.
The table below shows the provisions for probable losses and escrow deposits as of March 31, 2014:
| March 31, 2014 | December 31, 2013 | |||||||||||||||
| Provision | Deposits | Provision | Deposits | |||||||||||||
| Labor |
1,052 | 371 | 1,037 | 339 | ||||||||||||
| Civil |
20 | 25 | ||||||||||||||
| Tax |
33 | 33 | ||||||||||||||
| Other |
7 | |||||||||||||||
|
|
|
|
|
|
|
|
|
|||||||||
| Total |
1,072 | 411 | 1,062 | 372 | ||||||||||||
|
|
|
|
|
|
|
|
|
|||||||||
| Current |
240 | 250 | ||||||||||||||
| Noncurrent |
832 | 411 | 812 | 372 | ||||||||||||
The changes in the provisions during the three-month period ended March 31, 2014 were as follows:
| Balance at December 31, 2013 |
1,062 | |||
|
|
|
|||
| Additions |
55 | |||
| Write-offs |
(45 | ) | ||
|
|
|
|||
| Balance at March 31, 2014 |
1,072 | |||
|
|
|
| (a) | Labor lawsuits |
In general, labor claims address to overtime, health hazard bonus and/or hazardous duty premium, salary equalization, vacation pay, pain and suffering resulting from accidents, occupational sick and joint liability involving service providers, among others.
| (b) | Civil lawsuits |
In general, civil claims address the usual matters inherent to the Company’s business and refer mainly to indemnity claims, collection of receivables, matters related to the declaration of undue collection of an execution instrument and suspension of protest.
F-144
Table of Contents
Cia Providência Indústria e Comércio
| (c) | Tax lawsuits |
As of March 31, 2014, Isofilme is a party to a lawsuit relating to ICMS (State VAT) on electric power made available but not used.
On April 15, 2013, Decree 46215, which regulates the relinquishment of payment of ICMS on power not effectively used, was published in the Diário Oficial do Estado de Minas Gerais.
| (d) | Possible contingencies not accrued |
The Company is a party to tax, labor and civil lawsuits whose likelihood of loss is assessed by Management and its legal counsel as possible; no provision was recorded for these lawsuits, as shown below:
| March 31, 2014 |
December 31, 2013 |
|||||||
| Labor |
368 | 403 | ||||||
| Civil |
1,720 | 1,943 | ||||||
| Tax* |
154,904 | 154,904 | ||||||
|
|
|
|
|
|||||
| 156,992 | 157,250 | |||||||
|
|
|
|
|
|||||
| * | These lawsuits and administrative proceedings include two tax deficiency notices relating to the determination of the Companhia Providência Indústria e Comércio and Isofilme’s taxable income for 2007 and 2008, drawn up in August and November 2013, which are being timely challenged at administrative level. |
| (e) | Former controlling shareholders |
As of March 31, 2014, the amounts relating to lawsuits under the responsibility of the former controlling shareholders, whose risks of loss are assessed by Management as possible and probable, amount to R$2,279 (R$2,327 as of December 31, 2013).
| 19 | DEFERRED INCOME TAX AND SOCIAL CONTRIBUTION LIABILITIES |
Deferred tax liabilities are recorded to cover the realization of temporary differences and are stated on a net basis. They are broken down as follows:
| March 31, 2014 |
December 31, 2013 |
|||||||
| Liabilities |
||||||||
| Income tax (IR) and Social contribution (CS) |
||||||||
| Deferred on the effects of Laws 11638 and 11941 |
45,740 | 39,609 | ||||||
| Deemed cost of property, plant and equipment |
2,660 | 2,699 | ||||||
|
|
|
|
|
|||||
| 48,400 | 42,308 | |||||||
|
|
|
|
|
|||||
| Income tax and social contribution rate |
34 | % | 34 | % | ||||
| Total deferred income tax and social contribution, net |
16,455 | 14,385 | ||||||
|
|
|
|
|
|||||
In subsidiary Isofilme, temporary differences that give rise to deferred income tax and social contribution liabilities refer mainly to the tax amortization of the goodwill on the acquisition of subsidiary Isofilme.
F-145
Table of Contents
Cia Providência Indústria e Comércio
| 20 | EQUITY |
| (a) | Capital |
As of March 31, 2014 and December 31, 2013, capital totaled R$409,003, represented by 80,041,132 book-entry, registered ordinary shares, without par value, held as follows:
| March 31, 2014 | December 31, 2013 | |||||||||||||||
| Controlling shareholders and related parties |
||||||||||||||||
| FIP Volluto |
13,952,203 | 17.4 | % | 13,952,203 | 17.4 | % | ||||||||||
| Investidores Institucionais II – Fundo de Investimento em Participações |
10,074,423 | 12.6 | % | 10,074,423 | 12.6 | % | ||||||||||
| FIP Bssf II |
9,417,737 | 11.8 | % | 9,417,737 | 11.8 | % | ||||||||||
| FIP Brasil Equity II |
6,278,492 | 7.8 | % | 6,278,492 | 7.8 | % | ||||||||||
| Banco Espírito Santo S.A. |
5,861,269 | 7.3 | % | 5,861,269 | 7.3 | % | ||||||||||
| Boreal Fundo de Investimentos em Participações* |
4,651,081 | 5.8 | % | 4,651,081 | 5.8 | % | ||||||||||
| Espírito Santo Capital – Sociedade de Capital de Risco S.A. |
1,953,757 | 2.4 | % | 1,953,757 | 2.4 | % | ||||||||||
| Fundo de Investimentos em Partic. C.A. |
1,162,683 | 1.5 | % | 1,162,683 | 1.5 | % | ||||||||||
| Fip Ggpar (Gov. e Gestão Investimentos Ltda.) |
970,724 | 1.2 | % | 970,724 | 1.2 | % | ||||||||||
| Boreal Ações III Fia* |
2,690,700 | 3.4 | % | 2,690,700 | 3.4 | % | ||||||||||
|
|
|
|
|
|
|
|
|
|||||||||
| Total controlling shareholders and related parties |
57,013,069 | 71.2 | % | 57,013,069 | 71.2 | % | ||||||||||
|
|
|
|
|
|
|
|
|
|||||||||
| Management |
||||||||||||||||
| Executive Board |
52,009 | 0.1 | % | 52,009 | 0.1 | % | ||||||||||
| Board of Directors |
4 | 0.0 | % | 4 | 0.0 | % | ||||||||||
| Supervisory Board |
4 | 0.0 | % | 4 | 0.0 | % | ||||||||||
|
|
|
|
|
|
|
|
|
|||||||||
| Total Management |
56,013 | 0.1 | % | 56,013 | 0.1 | % | ||||||||||
|
|
|
|
|
|
|
|
|
|||||||||
| Free float shares |
||||||||||||||||
| Sul América Invest. Distrib. de Títulos e Valores Mobiliários S.A.** |
4,041,400 | 5.0 | % | 4,041,400 | 5.0 | % | ||||||||||
| Victoire Brasil Investimentos Administração de Recursos Ltda.*** |
4,495,000 | 5.7 | % | 4,380,000 | 5.5 | % | ||||||||||
| Others |
14,417,350 | 18.0 | % | 14,532,350 | 18.2 | % | ||||||||||
|
|
|
|
|
|
|
|
|
|||||||||
| Total free float shares |
22,953,750 | 28.7 | % | 22,953,750 | 28.7 | % | ||||||||||
|
|
|
|
|
|
|
|
|
|||||||||
| Treasury shares |
18,3 | 0.0 | % | 18,3 | 0.0 | % | ||||||||||
|
|
|
|
|
|
|
|
|
|||||||||
| Total treasury shares |
18,3 | 0.0 | % | 18,3 | 0.0 | % | ||||||||||
|
|
|
|
|
|
|
|
|
|||||||||
| Total shares |
80,041,132 | 100.0 | % | 80,041,132 | 100.0 | % | ||||||||||
|
|
|
|
|
|
|
|
|
|||||||||
| * | Shareholders related to Boreal Fundo de Investimentos em Participações. |
| ** | Sul América FI em Ações, Sul América Dividendos FI em Ações and NBF Sulamérica Master Prev FIM, three investment funds managed by Sul América Investimentos Distribuidora de Títulos e Valores Mobiliários S.A, with ownership interest equal to or above 5% of the Company’s capital. |
| *** | Victoire Brazil Small Cap. Fund. SP, Victoire Small Cap. Ações FI., Victoire Dividendos FIA., Victoire Brazil Fund. LLC. and VBI Exclusivo Ações Fundo de Investimento (all managed by Victoire Brasil Investimentos Administração de Recursos Ltda.) exceeded the percentage of 5% of total common shares issued by Companhia Providência Indústria e Comércio. |
Under article 6º of the Company’s bylaws, the Company is authorized to increase its capital up to the limit of 4,050,000 (four million and fifty thousand) book-entry, registered common shares, with no par value, regardless of any amendment to the bylaws, and the Board of Directors must approve the terms on the issuance of shares, including par value, form and the time to pay-in capital.
F-146
Table of Contents
Cia Providência Indústria e Comércio
| b) | Stock options |
Under the Company’s bylaws, as approved by the Board of Directors and pursuant to the guidelines for the structuring of the Stock Option Plan approved at the Annual General Meetings held on May 11, 2007 and September 10, 2010, the Company is authorized to grant stock options or subscription warrants, with no preemptive rights for existing shareholders, executives and senior employees of the Company and its subsidiaries.
The guidelines adopted to grant stock options are set by the Board of Directors, which may grant stock options to the persons indicated. Stock options to be granted under these guidelines will correspond to, on any time, up to 3% of total shares issued by the Company. The terms and conditions, including the price per share, of the stock option plans are set by the Board of Directors on grant or concession date. Pursuant to the provisions of Article 171, paragraph 3 of Brazilian Corporation Law, shareholders will not be entitled to any preemptive rights over the stock option term.
Currently, two stock option plans are effective. The plans have three vesting periods to exercise the underlying options: After the lapse of 12 months, the plan’s participant is entitled to acquire 20% of the shares under the option; after the lapse of 24 months, the plan’s participant is entitled to acquire 30% of the shares under the option; and, after the lapse of 36 months, the plan’s participant is entitled to acquire the remaining 50% of the shares under the option. The plan expires within 7 (seven) years.
The recognition in the interim financial information begins from the month in which the Company starts to receive the services related to the stock option plan.
The vesting of the stock option is contingent on the employee remaining employed by the Company.
Up to March 31, 2014, 130,800 shares relating to the plan approved on May 30, 2011 were exercised. The shares delivered by the Company were acquired between September 26, 2011 and September 25, 2012 and were recorded as treasury shares. The effect for the year ended December 31, 2013, in the amount of R$162 of the options exercised was recorded as Capital Reserve. Options corresponding to 175,000 shares were also cancelled due to the withdrawal of persons eligible to the plan.
Below are details of the effective plan:
| Approval date |
Number of shares granted | Exercise price | Maturity date | Fair value | % of capital | |||||||
| 05/30/2011 |
829,000 | 6.10 | 05/30/2018 | 1,510 | 1.04 | % | ||||||
| 05/25/2012 |
460,000 | 6.35 | 05/25/2019 | 711 | 0.58 | % | ||||||
The assumptions used in the calculation on the grant date fair value were as follows:
| Approval date |
Number of shares granted |
Annual risk-free interest rate |
Total term (in years) |
Expected annual volatility |
Option’s fair value as of the granting date | |||||||||
| 05/30/2011 |
829,000 | 12.15 | % | 3 | 52.86 | % | 1.82 | |||||||
| 05/25/2012 |
460,000 | 8.79 | % | 3 | 48.56 | % | 1.57 | |||||||
F-147
Table of Contents
Cia Providência Indústria e Comércio
If options are fully exercised by their holders, the interest held by Company’s current shareholders will be diluted by 1.21%. Such dilution was calculated based on the ratio between (i) the total number of shares under the stock option plan in effect, and (ii) the total number of shares issued by the Company as of March 31, 2014, plus the total number of shares under the stock option plan, i.e.:
“Dilution as of 03/31/2014” = 983,200 / (80,041,132 + 983,200) x 100 = 1.21%
| Changes in options |
Three-month period ended March 31, 2014 |
Year 2013 | ||||||
| Balance at the beginning of the period |
983,200 | 1,289,000 | ||||||
| Options granted |
— | — | ||||||
| Options exercised |
(130,800 | ) | ||||||
| Options forfeited |
(175,000 | ) | ||||||
|
|
|
|
|
|||||
| Balance at the end of the period |
983,200 | 983,200 | ||||||
| Exercise price – plan approved on 5/30/2011 |
6.10 | 6.10 | ||||||
| Exercise price – plan approved on 5/25/2012 |
6.35 | 6.35 | ||||||
| Expiry date – plan approved on 5/30/2011 |
05/30/2018 | 05/30/2018 | ||||||
| Expiry date – plan approved on 5/25/2012 |
05/25/2019 | 05/25/2019 | ||||||
| (c) | Capital reserves |
As of March 31, 2014, the capital reserve balance of R$12,539 (R$12,425 as of December 31, 2013) is comprised of a goodwill reserve recognized on the issuance of shares, in the amount of R$10,865 (R$10,865 as of December 31, 2013), as well as of a special reserve recognized to meet commitments from the new stock option plan, as mentioned in Note 20 (b), whose balance amounts to R$1,674 as of March 31, 2014 (R$1,560 as of December 31, 2013).
| (d) | Treasury shares |
On September 26, 2011, the Company launched the third Share Buyback Program in connection with the Company’s shares, which expired on September 25, 2012.
In this period, the Company bought back 149,100 shares, at the amount of R$813. Through March 31, 2014, the Company sold 130,800 shares due to the exercise of options under the Stock Option plan.
| (e) | Profit reserves |
| March 31, 2014 |
December 31, 2013 |
|||||||
| Legal reserve |
11,086 | 11,086 | ||||||
| Reserve for future investments |
86,597 | 86,597 | ||||||
|
|
|
|
|
|||||
| Total |
97,683 | 97,683 | ||||||
|
|
|
|
|
|||||
The legal reserve is recorded at 5% of net profit, before any allocation, up to 20% of capital.
The reserve for future investments was proposed by Management and approved at the Shareholders’ Meeting to finance the Company’s investment project, which involves setting up new machinery.
| (f) | Dividends |
Shareholders are entitled to a mandatory minimum dividend of 25% of net profit, considering mainly the adjustments to the amounts allocated to the legal reserve in the year.
With respect to the dividend policy, the Company will keep the policy set forth in the bylaws.
F-148
Table of Contents
Cia Providência Indústria e Comércio
| (g) | Basic and diluted earnings per share |
Basic and diluted earnings per share were calculated based on the profit attributable to the Company’s owners and noncontrolling interest in the period, as detailed in the table below. There were no changes in the number of shares issued, and the calculation of the number of dilutive shares made by the Company did not show any significant results that might cause earnings per share to be changed. Accordingly, diluted earnings per share did not present any difference that could be material for reporting purposes, that is, diluted earnings per share were virtually equal to basic earnings per share:
| March 31, 2014 | March 31, 2013 | |||||||
| Net profit for the period |
(1,650 | ) | 5,050 | |||||
| Number of ordinary shares (thousands) |
80,022 | 80,022 | ||||||
|
|
|
|
|
|||||
| Earnings per share – basic and dilutive |
(0.02 | ) | 0.06 | |||||
|
|
|
|
|
|||||
| (h) | Valuation adjustments to equity |
| March 31, 2014 | March 31, 2013 | |||||||
| Deemed cost of property, plant and equipment (a) |
145,637 | 155,881 | ||||||
| Cumulative translation adjustments (b) |
(1,402 | ) | (479 | ) | ||||
|
|
|
|
|
|||||
| Total |
144,235 | 155,402 | ||||||
|
|
|
|
|
|||||
Changes in the period refer to:
| (a) | Deemed cost of property, plant and equipment: Realization of net income tax depreciation, in the amount of R$2,561, in the period ended March 31, 2014; |
| (b) | Accumulated translation adjustments: Exchange rate changes on the investment made in subsidiary Providência USA Inc., in the amount of R$257. |
| 21 | REVENUE |
The reconciliation between gross revenue and net revenue is as follows:
| March 31, 2014 | March 31, 2013 | |||||||
| Gross revenue |
243,266 | 185,387 | ||||||
| Sales returns |
(7,212 | ) | (6,284 | ) | ||||
| Taxes on sales |
(24,305 | ) | (18,494 | ) | ||||
|
|
|
|
|
|||||
| Net revenue |
211,749 | 160,609 | ||||||
| 22 | EXPENSES BY NATURE AND COST OF REVENUES |
The Company’s income statement is presented based on a classification of the expenses according to their function. Information on the nature of these expenses recognized in the income statement is shown below:
| March 31, 2014 | March 31, 2013 | |||||||
| Cost of revenues |
(160,554 | ) | (114,921 | ) | ||||
| Selling expenses |
||||||||
| Logistics |
(11,889 | ) | (10,363 | ) | ||||
| Commissions |
(715 | ) | (564 | ) | ||||
| Other |
(339 | ) | (580 | ) | ||||
|
|
|
|
|
|||||
| Total selling expenses |
(12,943 | ) | (11,507 | ) | ||||
|
|
|
|
|
|||||
F-149
Table of Contents
Cia Providência Indústria e Comércio
| March 31, 2014 | March 31, 2013 | |||||||
| Administrative expenses |
||||||||
| Personnel |
(7,934 | ) | (7,103 | ) | ||||
| Management |
(1,387 | ) | (1,469 | ) | ||||
| Employee benefit expense |
(3,141 | ) | (2,879 | ) | ||||
| Utilities |
(493 | ) | (773 | ) | ||||
| Services rendered |
(3,434 | ) | (1,767 | ) | ||||
| Travel |
(538 | ) | (672 | ) | ||||
| Taxes and fees |
(317 | ) | (273 | ) | ||||
| Depreciation and amortization expenses |
(3,340 | ) | (1,483 | ) | ||||
| Other |
(1,904 | ) | (1,638 | ) | ||||
|
|
|
|
|
|||||
| Total administrative expenses |
(22,488 | ) | (18,057 | ) | ||||
|
|
|
|
|
|||||
| Other income (expenses) |
(15 | ) | 22 | |||||
| Other |
(114 | ) | (186 | ) | ||||
|
|
|
|
|
|||||
| Total other income (expenses) |
(129 | ) | (164 | ) | ||||
|
|
|
|
|
|||||
| Total |
(196,114 | ) | (144,649 | ) | ||||
|
|
|
|
|
|||||
| 23 | FINANCE INCOME AND EXPENSES |
| (a) | Finance income |
| March 31, 2014 | March 31, 2013 | |||||||
| Interest |
110 | 434 | ||||||
| Income or expenses from derivative transactions |
1,601 | (328 | ) | |||||
| Interest from short-term investments |
946 | 1,393 | ||||||
| Other |
995 | (67 | ) | |||||
|
|
|
|
|
|||||
| 3,652 | 1,432 | |||||||
|
|
|
|
|
|||||
Changes in finance income in the period ended March 31, 2014, compared to the same period in 2013, are due mainly to the reduction in the earnings on short-term investments due to the decrease in the amounts invested and decrease in income from derivative transactions.
Income from derivatives refer to gains on swap transactions, forward exchange contracts and US dollar option contracts.
| (b) | Financial expenses |
| March 31, 2014 | March 31, 2013 | |||||||
| Interest |
(6,749 | ) | (6,580 | ) | ||||
| Exchange losses |
(2,730 | ) | (900 | ) | ||||
| Expenses from derivative transactions |
(5,101 | ) | (1,421 | ) | ||||
| Other |
(1,021 | ) | (613 | ) | ||||
|
|
|
|
|
|||||
| (15,601 | ) | (9,514 | ) | |||||
|
|
|
|
|
|||||
The changes in financial expenses for the period ended March 31, 2014, compared to the same period in 2013, refer mainly to addition of interest due to the increase in interest rates in the period, reversal of interest on recoverable taxes and to the effect of rate changes in foreign currency-denominated liabilities.
Expenses on derivatives refer to losses on swap transactions, forward exchange contracts and US dollar option contracts.
F-150
Table of Contents
Cia Providência Indústria e Comércio
| 24 | INCOME TAX AND SOCIAL CONTRIBUTION EXPENSES |
| (a) | Reconciliation of the effective rate of taxes |
| March 31, 2014 |
March 31, 2013 |
|||||||
| Income before income tax and social contribution |
3,686 | 7,878 | ||||||
| Statutory tax rate (income tax and social contribution) |
34 | % | 34 | % | ||||
|
|
|
|
|
|||||
| Income tax and social contribution expenses at statutory rates |
(1,253 | ) | (2,679 | ) | ||||
| Tax effects from (additions) deductions: |
||||||||
| Tax loss carryforwards for which no tax credit has been recognized |
(4,078 | ) | ||||||
| Permanent items, net |
(5 | ) | (149 | ) | ||||
|
|
|
|
|
|||||
| Amounts charged to profit or loss |
(5,336 | ) | (2,828 | ) | ||||
| Current |
(1,530 | ) | ||||||
| Deferred |
(3,806 | ) | (2,828 | ) | ||||
|
|
|
|
|
|||||
| Amounts charged to profit or loss |
(5,336 | ) | (2,828 | ) | ||||
|
|
|
|
|
|||||
| (b) | Changes in deferred income tax and social contribution, net, as of March 31, 2014 |
| December 31, 2013 |
Changes | March 31, 2014 |
||||||||||
| Tax loss carryforwards |
233,715 | 233,715 | ||||||||||
| Tax losses – USA |
6,948 | 368 | 7,316 | |||||||||
| 1) Tax effects on deferred income tax and social contribution assets |
82,173 | 142 | 82,315 | |||||||||
| Temporary difference subject to statutory rate of 34%: |
||||||||||||
| Temporary additions |
17,243 | 634 | 17,877 | |||||||||
| Depreciation |
(110,031 | ) | (6,557 | ) | (116,588 | ) | ||||||
| Other |
14,936 | 10,062 | 24,998 | |||||||||
| Temporary difference subject to statutory rate of 9%: |
||||||||||||
| Provisions |
1,423 | 1,423 | ||||||||||
| 2) Tax effects on deferred income tax and social contribution assets |
(26,216 | ) | 1,403 | (24,813 | ) | |||||||
|
|
|
|
|
|
|
|||||||
| Deferred IRPJ - goodwill |
41,728 | (3,477 | ) | 38,251 | ||||||||
| Deferred CSLL - goodwill |
15,022 | (1,252 | ) | 13,770 | ||||||||
| Deferred IRPJ - deemed cost |
(55,462 | ) | 962 | (54,500 | ) | |||||||
| Deferred CSLL - deemed cost |
(19,966 | ) | 345 | (19,621 | ) | |||||||
| 3) Effect on deemed cost and goodwill on deferred income tax and social contribution |
(18,678 | ) | (3,422 | ) | (22,100 | ) | ||||||
|
|
|
|
|
|
|
|||||||
| Total tax effects on deferred income tax and social contribution assets (1+2+3) |
37,279 | (1,877 | ) | 35,402 | ||||||||
|
|
|
|
|
|
|
|||||||
| Current income tax and social contribution |
(1,530 | ) | ||||||||||
| Temporary and permanent differences – subsidiaries (liabilities) |
(1,929 | ) | ||||||||||
| Total income tax and social contribution recorded in profit or loss |
(5,336 | ) | ||||||||||
|
|
|
|||||||||||
The Company is waiting for the Provisional Act 627/13 to be converted into law in order to decide about the anticipated or not adoption.
| 25 | PRIVATE PENSION PLAN |
In December 2009, the Company contracted with Banco Itaú a defined contribution private pension plan called ProvidênciaPrev, whose contributions are made monthly and voluntarily by the participants and also by the Company, in accordance with two groups of salary ranges, based on the maximum contribution required by the Government Social Security System.
F-151
Table of Contents
Cia Providência Indústria e Comércio
The Company, as the sponsor, does not assume any financial obligation for the cost of past services.
The first group includes all employees whose base salary exceeds the ceiling for the social security contribution. The Company’s contributions are equal to 100% of the employees’ basic contributions.
The second group is comprised of the other employees and the Company’s contributions, corresponding to three times the salary of an employee, will be made on the date of eligibility to the benefit, which is related to employee contract termination on entity’s decision.
The amount of the contribution made by the Company for the three-month period ended March 31, 2014 was R$207 (R$144 in the same period of 2013), recorded in profit or loss under “Personnel expenses”.
| 26 | INSURANCE |
The Company takes insurance for assets at amounts considered sufficient by management to cover probable losses, taking into account the nature of their activities. The insurance policies are quoted with several insurance companies, are effective and the premiums were duly paid. The Company manage risks with the objective of minimizing probable risks and claims.
As of March 31, 2014 and December 31, 2013, the Company had the following insurance policies:
| Insured amounts | ||||||||
| March 31, 2014 | December 31, 2013 | |||||||
| Line |
||||||||
| Property |
||||||||
| Named perils and operational risks and loss of profits |
881,226 | 929,136 | ||||||
| Comprehensive civil liability |
||||||||
| Commercial establishments |
103,767 | 105,264 | ||||||
| Civil liability |
||||||||
| D&O |
35,841 | 35,227 | ||||||
| International transportation |
||||||||
| Import and export |
13,156 | 13,275 | ||||||
|
|
|
|
|
|||||
| Total |
1,033,990 | 1,082,902 | ||||||
|
|
|
|
|
|||||
The insurance coverage can be summarized as follows:
| • | Property (plants) – guarantees indemnity for electrical damages, fire, loss of profits, machinery shutdown, robbery/theft of assets, twist, hurricane, cyclones, tornadoes, collision of land vehicles and aircraft crashes. Includes insurance of forklift trucks and vehicles that guarantees indemnity for losses on, and property damages to, the assets; |
| • | comprehensive civil liability insurance for manufactured products and internal operations, as well as employer risks and contingent risks of motor vehicles; |
| • | civil liability insurance for Directors and/or Officers (D&O); |
| • | transport insurance – insures any and all assets and/or goods/raw materials inherent in the line of activity and transported under the companies’ responsibility; and, |
| • | warranty insurance – insures, if necessary, obligations undertaken by the Company to various public or private agencies, related to prepayments, performance of contractors, suppliers or service providers, bids, proper operation and payment retention. |
The increases in the insured amounts refer basically to the inclusion of a new machinery in Statesville, United States, plant and also arises out of the work performed by Management to increase the insured amounts without increasing the cost of insurance.
F-152
Table of Contents
Cia Providência Indústria e Comércio
| 27 | MANAGEMENT COMPENSATION |
The Extraordinary and General Shareholders Meeting of April 01, 2014 approved the new management compensation proposal for the current year, in the annual amount of up to R$ 7,050, which will be allocated to management members as set forth in article 10, paragraph 1, of the Company’s bylaws.
In the three-month period ended March 31, 2014 and 2013, key management personnel’s compensation was as follows:
| March 31, 2014 | March 31, 2013 | |||||||
| Compensation |
1,273 | 1,284 | ||||||
| Share-based compensation |
114 | 185 | ||||||
|
|
|
|
|
|||||
| 1,387 | 1,469 | |||||||
|
|
|
|
|
|||||
| 28 | NON-CASH TRANSACTIONS |
Through March 31, 2014, there are no non-cash transactions that were not reflected in the consolidated statement of cash flows (borrowing of R$ 7,707 as of March 31, 2013 used to purchase property, plant and equipments items).
| 29 | COMMITMENTS |
The Company has a property lease agreement, classified as operational leasing, maturing on May 31, 2015, which entails a monthly commitment of R$100.
| 30 | PURCHASE AND SALE AGREEMENT WITH PGI POLÍMEROS DO BRASIL S.A. AND POLYMER GROUP, INC. |
On January 27, 2014, PGI Polímeros do Brasil S.A. and Polymer Group, Inc., and some specific Selling Shareholders which hold 57,013,069 common shares issued by the Company, corresponding to approximately 71.25% of the total shares issued, less treasury shares, and, therefore, the Company’s shareholding control, have committed to a share purchase and sale agreement. The purchase price of all Shares Sold is R$555,877,422.75 (five hundred and fifty five million, eight hundred and seventy seven thousand, and seventy five cents).
PGI Brasil is a holding Company, subsidiary of PGI, a North American Company, engaged in the manufacture and sale of nonwoven.
The closing of the transaction will occur after the verification and satisfaction of customary closing conditions that are usual in similar transactions, including the prior approval by the antitrust authorities in Brazil and the United States. After the closing of the transaction, the new controlling shareholder will perform a public offering of shares, as requested by the Company’s bylaws and by regulation applicable to the Company.
| 31 | EVENT AFTER THE REPORTING PERIOD |
On April 30, 2014 the documentation for the merger of the subisidiary Isofilme Indústria e Comércio de Plásticos Ltda. was approved in Extraordinary Shareholders Metting. Due to this fact, on April 30, 2014 the total net equity of Isofilme Indústria e Comércio de Plásticos Ltda. was merged into Companhia Providência Indústria e Comércio. The merger has the objective of integrate the businesses, higher synergy and the rationalization of the activities with a reduction of administrative and operational costs as a consequence.
F-153
Table of Contents
Independent Auditor’s Report to the members of Fiberweb Limited (formerly Fiberweb plc)
We have audited the accompanying consolidated financial statements of Fiberweb Limited (formerly Fiberweb plc) and its subsidiaries (the “Company”), which comprise the consolidated balance sheet as at December 31, 2012, 2011, and 2010, and the related consolidated income statement, statements of comprehensive income, changes in equity, and cash flows for the years then ended, and the related notes to the consolidated financial statements.
Management’s Responsibility for the Consolidated Financial Statements
Management is responsible for the preparation and fair presentation of these consolidated financial statements in accordance with International Financial Reporting Standards, as issued by the International Accounting Standards Board; this includes the design, implementation, and maintenance of internal control relevant to the preparation and fair presentation of consolidated financial statements that are free from material misstatement, whether due to fraud or error.
Auditors’ Responsibility
Our responsibility is to express an opinion on these consolidated financial statements based on our audits. We conducted our audits in accordance with auditing standards generally accepted in the United States of America. Those standards require that we plan and perform the audit to obtain reasonable assurance about whether the consolidated financial statements are free from material misstatement.
An audit involves performing procedures to obtain audit evidence about the amounts and disclosures in the consolidated financial statements. The procedures selected depend on the auditor’s judgment, including the assessment of the risks of material misstatement of the consolidated financial statements, whether due to fraud or error. In making those risk assessments, the auditor considers internal control relevant to the Company’s preparation and fair presentation of the consolidated financial statements in order to design audit procedures that are appropriate in the circumstances, but not for the purpose of expressing an opinion on the effectiveness of the Company’s internal control. Accordingly, we express no such opinion. An audit also includes evaluating the appropriateness of accounting policies used and the reasonableness of significant accounting estimates made by management, as well as evaluating the overall presentation of the consolidated financial statements.
We believe that the audit evidence we have obtained is sufficient and appropriate to provide a basis for our audit opinion.
Opinion
In our opinion, the consolidated financial statements referred to above present fairly, in all material respects, the financial position of Fiberweb Limited and its subsidiaries as of December 31, 2012, 2011, 2010, and the results of their operations and their cash flows for the years then in accordance with International Financial Reporting Standards, as issued by the International Accounting Standards Board.
/s/ Deloitte LLP
London, UK
December 6, 2013
F-154
Table of Contents
Consolidated Income Statement for the year ended 31 December
| Notes | 2012 £’m* |
2011 £’m* |
2010 £’m* |
|||||||||||||
| Continuing operations |
||||||||||||||||
| Revenue |
3 | 300.1 | 297.8 | 269.2 | ||||||||||||
| Cost of sales |
(235.4 | ) | (235.4 | ) | (200.8 | ) | ||||||||||
| Gross profit |
64.7 | 62.4 | 68.4 | |||||||||||||
| Distribution costs |
(30.4 | ) | (28.9 | ) | (26.2 | ) | ||||||||||
| Administrative expenses |
(25.8 | ) | (21.1 | ) | (25.6 | ) | ||||||||||
| Other operating income |
4 | 2.6 | 1.8 | 0.8 | ||||||||||||
| Share of results of associates and joint ventures |
— | — | (0.7 | ) | ||||||||||||
| Restructuring costs |
4 | (3.5 | ) | (4.6 | ) | 0.6 | ||||||||||
| Operating profit from continuing operations |
3,4 | 7.6 | 9.6 | 17.3 | ||||||||||||
| Investment income |
5 | 0.6 | — | — | ||||||||||||
| Finance costs |
5 | (2.4 | ) | (16.0 | ) | (14.9 | ) | |||||||||
| Net finance costs |
(1.8 | ) | (16.0 | ) | (14.9 | ) | ||||||||||
| Profit/(loss) before tax |
5.8 | (6.4 | ) | 2.4 | ||||||||||||
| Income tax on operations |
6 | (2.5 | ) | 1.2 | (3.7 | ) | ||||||||||
| Recognition of deferred tax |
6 | — | 3.0 | 3.6 | ||||||||||||
| Tax |
(2.5 | ) | 4.2 | (0.1 | ) | |||||||||||
| Profit/(loss) for the year from continuing operations |
3.3 | (2.2 | ) | 2.3 | ||||||||||||
| (Loss)/profit for the year from discontinued operations |
29 | (0.1 | ) | 11.8 | 4.8 | |||||||||||
| Net profit |
3.2 | 9.6 | 7.1 | |||||||||||||
| Continuing operations: |
||||||||||||||||
| Basic |
8 | 2.0p | (1.3 | )p | 1.7p | |||||||||||
| Diluted |
8 | 2.0p | (1.3 | )p | 1.7p | |||||||||||
| From continuing and discontinued operations: |
||||||||||||||||
| Basic |
8 | 1.9p | 5.8p | 5.3p | ||||||||||||
| Diluted |
8 | 1.9p | 5.8p | 5.2p | ||||||||||||
| * | —restated following the adoption of amendments to IAS 19 Employee Benefits which has been applied retrospectively |
F-155
Table of Contents
Consolidated Statement of Comprehensive Income for the year ended 31 December
| Note | 2012* £’m |
2011* £’m |
2010* £’m |
|||||||||||||
| Net profit/(loss) for the year |
3.2 | 9.6 | 7.1 | |||||||||||||
| Items that will not be reclassified subsequently to profit or loss: |
||||||||||||||||
| Actuarial gains/(losses) on defined benefit pension schemes |
23 | 0.7 | (9.2 | ) | (1.1 | ) | ||||||||||
| Items that may be reclassified subsequently to profit or loss: |
||||||||||||||||
| Foreign exchange transferred from reserves to profit on disposal of businesses |
29 | — | (32.9 | ) | — | |||||||||||
| Exchange differences on translation of foreign operations |
(5.1 | ) | 2.7 | 3.4 | ||||||||||||
| Cash flow hedges: |
||||||||||||||||
| —Gains/(losses) arising during the year |
0.1 | (1.9 | ) | 2.6 | ||||||||||||
| —Less: reclassification adjustments for losses included in profit |
— | 5.5 | (1.4 | ) | ||||||||||||
| Tax on items recognised directly in equity |
0.7 | 4.4 | 0.2 | |||||||||||||
|
|
|
|
|
|
|
|||||||||||
| Total comprehensive expense for the year |
(0.4 | ) | (21.8 | ) | 10.8 | |||||||||||
|
|
|
|
|
|
|
|||||||||||
| * | —restated following the adoption of amendments to IAS 19 Employee Benefits which has been applied retrospectively |
F-156
Table of Contents
Consolidated Balance Sheet as at 31 December
| Note | 2012* £’m |
2011* £’m |
2010* £’m |
|||||||||||||
| Non-current assets |
||||||||||||||||
| Intangible assets: |
||||||||||||||||
| Goodwill |
10 | 39.0 | 40.2 | 34.7 | ||||||||||||
| Other |
10 | 6.0 | 5.0 | 1.9 | ||||||||||||
| Property, plant and equipment |
11 | 86.3 | 90.3 | 214.2 | ||||||||||||
| Investments in associates and joint ventures |
12 | — | — | 55.4 | ||||||||||||
| Other investments |
13 | — | — | 0.3 | ||||||||||||
| Deferred tax assets |
24 | 15.5 | 14.4 | 18.2 | ||||||||||||
| 146.8 | 149.9 | 324.7 | ||||||||||||||
| Current assets |
||||||||||||||||
| Inventories |
14 | 36.4 | 40.9 | 49.4 | ||||||||||||
| Trade and other receivables |
15 | 44.2 | 64.2 | 76.6 | ||||||||||||
| Cash and cash equivalents |
15 | 14.6 | 182.3 | 26.1 | ||||||||||||
| Assets held for sale |
16 | 0.7 | — | 15.0 | ||||||||||||
| 95.9 | 287.4 | 167.1 | ||||||||||||||
|
|
|
|
|
|
|
|||||||||||
| TOTAL ASSETS |
242.7 | 437.3 | 491.8 | |||||||||||||
|
|
|
|
|
|
|
|||||||||||
| Current liabilities |
||||||||||||||||
| Trade and other payables |
17 | (49.7 | ) | (53.4 | ) | (68.8 | ) | |||||||||
| Tax liabilities |
(7.3 | ) | (8.8 | ) | (8.3 | ) | ||||||||||
| Obligations under finance leases |
18 | (0.1 | ) | (0.3 | ) | — | ||||||||||
| Bank overdrafts and loans |
20 | — | (159.9 | ) | (7.6 | ) | ||||||||||
| Provisions |
22 | (2.5 | ) | (5.8 | ) | (4.7 | ) | |||||||||
| Liabilities classified as held for sale |
16 | (0.2 | ) | — | — | |||||||||||
| (59.8 | ) | (228.2 | ) | (89.4 | ) | |||||||||||
| Net current assets |
36.1 | 59.2 | 77.7 | |||||||||||||
| Non-current liabilities |
||||||||||||||||
| Obligations under finance leases |
18 | — | (0.1 | ) | — | |||||||||||
| Bank loans |
20 | — | — | (169.7 | ) | |||||||||||
| Retirement benefit obligations |
23 | (5.5 | ) | (25.6 | ) | (35.5 | ) | |||||||||
| Deferred tax liabilities |
24 | (3.4 | ) | (3.7 | ) | (15.6 | ) | |||||||||
| Provisions |
22 | — | — | (3.0 | ) | |||||||||||
| (8.9 | ) | (29.4 | ) | (223.8 | ) | |||||||||||
|
|
|
|
|
|
|
|||||||||||
| TOTAL LIABILITIES |
(68.7 | ) | (257.6 | ) | (313.2 | ) | ||||||||||
|
|
|
|
|
|
|
|||||||||||
| NET ASSETS |
174.0 | 179.7 | 178.6 | |||||||||||||
| Equity |
||||||||||||||||
| Share capital |
26 | 8.7 | 8.7 | 6.1 | ||||||||||||
| Share premium account |
110.8 | 110.8 | 84.5 | |||||||||||||
| Merger reserve |
93.5 | 93.5 | 93.5 | |||||||||||||
| Other reserve |
93.1 | 93.1 | 93.1 | |||||||||||||
| Capital reserve |
0.3 | 0.8 | 1.0 | |||||||||||||
| Hedging reserve |
0.1 | — | 38.9 | |||||||||||||
| Translation reserve |
3.6 | 8.7 | (3.6 | ) | ||||||||||||
| Retained earnings |
(136.1 | ) | (135.9 | ) | (134.9 | ) | ||||||||||
| Equity attributable to equity holders of the parent |
174.0 | 179.7 | 178.6 | |||||||||||||
|
|
|
|
|
|
|
|||||||||||
| TOTAL EQUITY |
174.0 | 179.7 | 178.6 | |||||||||||||
|
|
|
|
|
|
|
|||||||||||
| * | —restated following the adoption of amendments to IAS 19 Employee Benefits which has been applied retrospectively |
F-157
Table of Contents
Consolidated Cash Flow Statement for the year ended 31 December
| Note | 2012 £’m |
2011 £’m |
2010 £’m |
|||||||||||||
| Operating activities |
||||||||||||||||
| Net cash flows from operating activities |
28 | 2.6 | 20.5 | 37.7 | ||||||||||||
| Investing activities |
||||||||||||||||
| Purchase of property, plant and equipment |
(13.9 | ) | (22.6 | ) | (33.0 | ) | ||||||||||
| Purchase of intangible assets |
(0.6 | ) | (0.8 | ) | (0.2 | ) | ||||||||||
| Proceeds on disposal of property, plant and equipment |
0.2 | 18.3 | 1.9 | |||||||||||||
| Acquisition of businesses, net of cash acquired |
29 | — | (7.9 | ) | — | |||||||||||
| Dividends received from associates and joint ventures |
12 | — | 1.6 | — | ||||||||||||
| Net proceeds on disposal of businesses |
15.0 | 161.2 | — | |||||||||||||
| Additional investment in joint venture |
— | (0.3 | ) | — | ||||||||||||
| Interest received |
0.6 | — | 0.1 | |||||||||||||
| Net cash inflow from investing activities |
1.3 | 149.5 | (31.2 | ) | ||||||||||||
| Financing activities |
||||||||||||||||
| Commitment fees paid |
(0.6 | ) | (0.6 | ) | — | |||||||||||
| Interest paid |
(3.1 | ) | (8.8 | ) | (8.0 | ) | ||||||||||
| Facility fees paid |
— | — | (4.8 | ) | ||||||||||||
| Dividends paid to shareholders |
7 | (5.2 | ) | (6.0 | ) | (5.2 | ) | |||||||||
| Cash paid on foreign exchange forward contracts carried at fair value through profit or loss |
— | (1.2 | ) | — | ||||||||||||
| Repayment of interest rate swap break costs |
(2.7 | ) | (1.8 | ) | (0.9 | ) | ||||||||||
| Repayment of interest rate swaps on termination |
(2.0 | ) | — | — | ||||||||||||
| Repayment of external loans |
(158.5 | ) | (18.8 | ) | 16.5 | |||||||||||
| Decrease in finance leases |
(0.3 | ) | (0.4 | ) | (1.5 | ) | ||||||||||
| Proceeds from Rights Issue, net of costs |
— | 23.8 | — | |||||||||||||
| Net cash outflow from financing activities |
(172.4 | ) | (13.8 | ) | (3.9 | ) | ||||||||||
| Net (decrease)/increase in cash and cash equivalents |
(168.5 | ) | 156.2 | 2.6 | ||||||||||||
| Foreign exchange differences |
0.8 | — | 1.5 | |||||||||||||
| Cash and cash equivalents at beginning of year |
182.3 | 26.1 | 22.0 | |||||||||||||
| Cash and cash equivalents at end of year |
14.6 | 182.3 | 26.1 | |||||||||||||
F-158
Table of Contents
Consolidated Statement of Changes in Equity for the year ended 31 December
| Equity attributable to equity holders of the parent |
||||||||||||||||||||||||||||||||||||
| Share Capital £’m |
Share Premium £’m |
Merger Reserve £’m |
Other Reserve £’m |
Capital Reserve £’m |
Hedging Reserve £’m |
Translation Reserve £’m |
Retained Earnings £’m |
Total Equity £’m |
||||||||||||||||||||||||||||
| At 1 January 2010* |
6.1 | 84.5 | 93.5 | 93.1 | 1.2 | (4.8 | ) | 35.5 | (136.5 | ) | 172.6 | |||||||||||||||||||||||||
| Profit for the year |
— | — | — | — | — | — | — | 7.1 | 7.1 | |||||||||||||||||||||||||||
| Other comprehensive income for the year |
— | — | — | — | — | 1.2 | 3.4 | (0.9 | ) | 3.7 | ||||||||||||||||||||||||||
|
|
|
|
|
|
|
|
|
|
|
|
|
|
|
|
|
|
|
|||||||||||||||||||
| Total comprehensive income for the year |
— | — | — | — | — | 1.2 | 3.4 | 6.2 | 10.8 | |||||||||||||||||||||||||||
|
|
|
|
|
|
|
|
|
|
|
|
|
|
|
|
|
|
|
|||||||||||||||||||
| Transfer to income: |
||||||||||||||||||||||||||||||||||||
| Share option costs |
— | — | — | (0.2 | ) | — | — | 0.6 | 0.4 | |||||||||||||||||||||||||||
| Dividends paid |
— | — | — | — | — | — | — | (5.2 | ) | (5.2 | ) | |||||||||||||||||||||||||
| At 31 December 2010* |
6.1 | 84.5 | 93.5 | 93.1 | 1.0 | (3.6 | ) | 38.9 | (134.9 | ) | 178.6 | |||||||||||||||||||||||||
| Profit for the year |
— | — | — | — | — | — | — | 9.6 | 9.6 | |||||||||||||||||||||||||||
| Other comprehensive income for the year |
— | — | — | — | — | 3.6 | (30.2 | ) | (4.8 | ) | (31.4 | ) | ||||||||||||||||||||||||
|
|
|
|
|
|
|
|
|
|
|
|
|
|
|
|
|
|
|
|||||||||||||||||||
| Total comprehensive income for the year |
— | — | — | — | — | 3.6 | (30.2 | ) | 4.8 | (21.8 | ) | |||||||||||||||||||||||||
|
|
|
|
|
|
|
|
|
|
|
|
|
|
|
|
|
|
|
|||||||||||||||||||
| Transfer to income: |
||||||||||||||||||||||||||||||||||||
| Share option costs |
— | — | — | — | (0.1 | ) | — | — | 0.2 | 0.1 | ||||||||||||||||||||||||||
| Shares issued for acquisition of subsidiary |
0.3 | 4.6 | — | — | — | — | — | — | 4.9 | |||||||||||||||||||||||||||
| Rights Issue |
2.2 | 21.7 | — | — | — | — | — | — | 23.9 | |||||||||||||||||||||||||||
| Shares issued to satisfy LTIP awards |
0.1 | — | — | — | (0.1 | ) | — | — | — | — | ||||||||||||||||||||||||||
| Dividends paid |
— | — | — | — | — | — | — | (6.0 | ) | (6.0 | ) | |||||||||||||||||||||||||
| At 31 December 2011* |
8.7 | 110.8 | 93.5 | 93.1 | 0.8 | — | 8.7 | (135.9 | ) | 179.7 | ||||||||||||||||||||||||||
| Profit for the year |
— | — | — | — | — | — | — | 3.2 | 3.2 | |||||||||||||||||||||||||||
| Other comprehensive income/ (expense) for the year |
— | — | — | — | — | 0.1 | (5.1 | ) | 1.5 | (3.5 | ) | |||||||||||||||||||||||||
|
|
|
|
|
|
|
|
|
|
|
|
|
|
|
|
|
|
|
|||||||||||||||||||
| Total comprehensive income/ (expense) for the year |
— | — | — | — | — | 0.1 | (5.1 | ) | 4.7 | (0.3 | ) | |||||||||||||||||||||||||
|
|
|
|
|
|
|
|
|
|
|
|
|
|
|
|
|
|
|
|||||||||||||||||||
| Movements relating to share based payments |
— | — | — | — | (0.5 | ) | — | — | 0.3 | (0.2 | ) | |||||||||||||||||||||||||
| Dividends paid |
— | — | — | — | — | — | — | (5.2 | ) | (5.2 | ) | |||||||||||||||||||||||||
| At 31 December 2012* |
8.7 | 110.8 | 93.5 | 93.1 | 0.3 | 0.1 | 3.6 | (136.1 | ) | 174.0 | ||||||||||||||||||||||||||
| * | —restated following the adoption of amendments to IAS 19 Employee Benefits which has been applied retrospectively |
F-159
Table of Contents
Notes to the Accounts for the year ended 31 December 2012
1. General information
The information for the years ended 31 December 2010, 2011 and 2012 does not constitute statutory accounts as defined in Section 434 of the Companies Act 2006. A copy of the statutory accounts for each of those years has been delivered to the Registrar of Companies. The auditor’s report on those accounts was not qualified, did not include a reference to any matters to which the auditors drew attention by way of emphasis without qualifying the report and did not contain statements under Section 498(2) or (3) of the Companies Act 2006.
Fiberweb Limited (formerly Fiberweb plc) is a company incorporated in the United Kingdom on 22 January 2006 under the Companies Act 2006. The Fiberweb Group (“Fiberweb” or “the Group”) is an international Group of businesses that develops and manufactures specialist industrial materials.
These Financial Statements are presented in pounds Sterling because that is the currency of the ultimate parent company, Fiberweb plc. Foreign operations are included in accordance with the policies set out in Note 2.
2. Accounting policies
Basis of preparation
The consolidated Financial Statements are prepared on an historical cost basis, adjusted for certain derivative financial instruments which are stated at fair value.
The Company has elected to prepare its parent company Financial Statements in accordance with United Kingdom Generally Accepted Accounting Policies (“UK GAAP”). Amendments to IAS 19 Revised Employee Benefits (effective 1 January 2013) has been adopted retrospectively. Comparative periods have been restated in accordance with IAS 19.
The consolidated Financial Statements have been prepared on a going concern basis. In addition, Notes 20 and 21 to the Consolidated Financial Statements include the Group’s objectives, policies and processes for managing its capital, its financial risk management objectives, details of its financial instruments and hedging activities and its exposures to liquidity risk. Credit risk exposure is discussed in Note 15.
At 31 December 2012, the Group had cash of £14.6 million, and bank loans of £Nil. On 21 December 2012, the Group entered into a new revolving credit facility (“RCF”) provided by a syndicate of several international banks. The RCF has a remaining term of four and a quarter years until 31 March 2017 and comprises a £40 million multi-currency facility. The RCF is subject to the financial covenants set out in Note 20. At 31 December 2012, £Nil was drawn down under the RCF.
The Group prepares regular business forecasts and monitors its projected compliance with its banking covenants under the RCF, which is reviewed by the Board. Forecasts are then adjusted for sensitivities which address the principal risks to which the Group is exposed, such as fluctuations in raw material prices, exchange rates and best estimates of the possible impact of the macroeconomic environment on the Group’s underlying trading results. Consideration is then given to the potential actions available to management to mitigate the impact of one or more of the sensitivities.
The Group’s central and sensitised forecasts, after applying reasonable possible adverse variations in trading performance, show that the Group is able to operate within the level of the RCF and remain covenant compliant. Covenant tests are required quarterly under the RCF.
After making enquiries, the Directors have a reasonable expectation that the Company and the Group have adequate resources to continue in operational existence for the foreseeable future. Accordingly, they continue to
F-160
Table of Contents
adopt the going concern basis in preparing the consolidated financial statements. Fiberweb plc was acquired by PGI on 15 November 2013 (see Note 33).
The consolidated Financial Statements have been prepared in accordance with International Financial Reporting Standards (“IFRSs”) as issued by the International Accounting Standards Board (“IASB”).
Adoption of new and revised standards
In the current year, the following new and revised Standards and Interpretations have been adopted but have no significant impact on the consolidated results or financial position in these Financial Statements.
| • | Amendment to IFRS 7 Financial Instruments: Disclosures Enhanced Derecognition Disclosure Requirements |
| • | Amendments to IAS 12 Deferred Tax: Recovery of Underlying Assets |
Their adoption has not had any significant impact on the amounts reported in the Financial Statements but may impact the accounting for future transactions and arrangements.
At the date of authorisation of these Financial Statements, the following Standards and Interpretations, which have not been applied in these Financial Statements, were in issue but not yet effective (and in some cases had not yet been adopted by the EU):
| • | Certain elements of Annual Improvements to IFRSs 2009-2011 Cycle |
| • | Amendments to IFRS 7 Financial Instruments: Disclosures |
| • | Amendments to IAS 32 Financial Instruments: Presentation—Offsetting Financial Assets and Financial Liabilities |
The Directors do not expect that the adoption of these Standards and Interpretations in future periods will have a material impact on the Financial Statements of the Group. The Group assessed the impact of the following revised standards and interpretations or amendments that were not effective as of 31 December 2012. The adoption of these standards did not have a significant effect on the consolidated results or financial position in these Financial Statements.
| • | IFRS 9 Financial Instruments: Classification and Measurement—effective for periods beginning on or after 1 January 2015 impacts both the measurement and disclosures of financial instruments. |
| • | IFRS 10 Consolidated Financial Statements—effective for periods beginning on or after 1 January 2013 replaces the guidance of control and consolidation in IAS 27 and SIC-12 Consolidation—Special Purpose Entities. The core principle that a consolidated entity presents a parent and its subsidiaries as if they were a single entity remains unchanged, as do the mechanics of consolidation. |
| • | IFRS 11 Joint Arrangements—effective for periods beginning on or after 1 January 2013 requires joint arrangements to be accounted for as a joint operation or as a joint venture depending on the rights and obligations of each party to the arrangement. Proportionate consolidation for joint ventures will be eliminated and equity accounting will be mandatory. It is anticipated that the application of the standard will have no significant impact on the Group. |
| • | IFRS 12 Disclosure of Interest in Other Entities—effective for periods beginning on or after 1 January 2013 requires enhanced disclosures of the nature, risks and financial effects associated with the Group’s interests in subsidiaries, associates, joint arrangements and unconsolidated structured entities. |
| • | IFRS 13 Fair Value Measurement—effective for periods beginning on or after 1 January 2013 explains how to measure fair value and aims to enhance fair value disclosures. The standard does not materially change the measurement of fair value but codifies it in one place. |
F-161
Table of Contents
| • | Amendments to IAS 1 Presentation of Financial Statements—effective for periods beginning on or after 1 July 2012. |
| • | IAS 27 Separate Financial Statements (revised May 2011)—effective for periods beginning on or after 1 January 2013 prescribes the accounting and disclosure requirements for investments in subsidiaries, joint ventures and associates when an entity elects to prepare separate Financial Statements. |
| • | IAS 28 Investments in Associates and Joint Ventures (revised May 2011—effective for periods beginning on or after 1 January 2013 prescribes the application of the equity method to account for associates and joint ventures. The standard defines “significant influence” and prescribes how investments in associates and joint ventures are tested for impairment. |
Amendments to IAS 19—a revised version of IAS 19 was effective from 1 January 2013. The revised standard was adopted for the financial years ended 31 December 2012, 2011, and 2010. The IAS 19 liability recognised in the balance sheet was reduced by £1.0m and IAS 19 amounts recognised in the income statement increased by £0.7m. These amendments were adopted and applied retrospectively for all periods presented.
The principal accounting policies used in the preparation of these Financial Statements are detailed below. These accounting policies, presentation and methods of computation have been consistently applied to all periods presented.
Discontinued operations
A discontinued operation is a component of the Group’s business that represents a separate major line of business or geographical area of operations that has been disposed of or is held for sale, or is a subsidiary acquired exclusively with a view to resale. Classification of a discontinued operation occurs upon disposal or when the operation meets the criteria to be classified as held for sale, if earlier. When an operation is classified as a discontinued operation, the comparative income statement is represented as if the operation had been discontinued from the start of the comparative period.
Basis of consolidation
Subsidiaries are entities controlled by Fiberweb. Control exists when Fiberweb has the power, directly or indirectly, to govern the financial and operating policies of an entity to obtain economic benefit from its activities. The Financial Statements of subsidiaries are included in the Group’s Financial Statements from the date that control commences until the date that control ceases in accordance with the acquisition method of accounting. Where necessary, adjustments are made to the Financial Statements of subsidiaries to bring the accounting policies used into line with those used by the Group.
All intra-Group transactions, balances, income and expenses are eliminated on consolidation.
Associated undertakings are those investments other than subsidiary or joint venture undertakings where the Group is in a position to exercise a significant influence, typically through the participation in the financial and operating decisions of the investee. Investments in associated undertakings are stated at cost, plus the Group’s share of post- acquisition reserves, less dividends received and provision for impairment.
Joint ventures are those entities other than subsidiary or associated undertakings where the Group is deemed to have joint control over the financial and operating policies of the entity. This is usually contractual. Investments in joint ventures are accounted for using the equity method under IAS 31 and therefore are treated as investments in associated undertakings (above) upon consolidation.
Business combinations
The acquisition of subsidiaries is accounted for using the acquisition method. The cost of the acquisition is measured at the aggregate of the fair values, at the date of exchange, of assets given, liabilities incurred or
F-162
Table of Contents
assumed, and equity instruments issued by the Group in exchange for control of the acquiree. The acquiree’s identifiable assets, liabilities and contingent liabilities that meet the conditions for recognition under IFRS 3 are recognised at their fair value at the acquisition date. Costs attributable to the business combination are expensed as incurred for acquisitions post 1 January 2010 following the adoption of IFRS 3 (revised).
Goodwill arising on acquisition is recognised as an asset and initially measured at cost, being the excess of the cost of the business combination over the Group’s interest in the net fair value of the identifiable assets, liabilities and contingent liabilities recognised. If, after reassessment, the Group’s interest in the net fair value of the acquiree’s identifiable assets, liabilities and contingent liabilities exceeds the cost of the business combination, the excess is recognised immediately in profit or loss.
Any non-controlling interest in the acquiree is either initially measured at fair value at the acquisition date, or at its proportionate interest in the fair value of the identifiable assets and liabilities of the acquiree.
Goodwill
Goodwill on acquisitions, being the excess of fair value of the consideration paid over the fair value of the net assets acquired, is capitalised and tested for impairment on an annual basis, or more frequently when there is an indication that there may be an impairment. For the purposes of impairment testing, goodwill is allocated to each of the Group’s cash-generating units expected to benefit from the synergies of the combination. If the recoverable amount of the cash-generating unit is less than the carrying amount of the unit, the impairment loss is allocated first to reduce the carrying amount of the goodwill allocated to the unit and then to the other assets of the unit. An impairment loss recognised for goodwill is not reversed in subsequent periods.
On disposal of a subsidiary, associate or jointly controlled entity, the attributable amount of goodwill is included in the determination of the profit or loss on disposal.
Goodwill arising on acquisitions before the date of transition to IFRSs has been retained at the previous UK GAAP amounts subject to being tested for impairment at that date. Goodwill written off to reserves under UK GAAP prior to 1998 has not been reinstated and is not included in determining any subsequent profit or loss on disposal.
Revenue recognition
Revenue is measured at the fair value of the consideration received or receivable. Group revenue represents amounts receivable for goods supplied by the Group in the normal course of business, net of discounts, VAT and other sales-related taxes and excluding intercompany transactions and sales by associated undertakings.
Sale of goods
Revenue from the sale of goods is recognised when all of the following conditions are satisfied:
| • | The Group has transferred to the buyer the significant risks and rewards of ownership of the goods; |
| • | The Group retains neither continuing managerial involvement to the degree usually associated with ownership nor effective control over the goods sold; |
| • | The amount of revenue can be measured reliably; |
| • | It is probable that the economic benefits associated with the transaction will flow to the entity; and |
| • | The costs incurred or to be incurred in respect of the transaction can be measured reliably. |
Interest income is accrued on a time basis, by reference to the principal outstanding and at the effective interest rate applicable.
F-163
Table of Contents
Dividend income from investments is recognised when the shareholders’ rights to receive payment have been established.
Research and development expenditure
Research expenditure is charged against income in the year in which it is incurred. An internally-generated intangible asset arising from the Group’s development expenditure is recognised only if the asset can be separately identified, it is probable that the asset will generate future economic benefits and the development costs of the asset can be measured reliably.
Share-based payments
Fiberweb operates share-based compensation plans which are detailed in Note 25. The equity-settled share-based payments under these schemes are measured at fair value at the date of grant. The fair value determined at the grant date is expensed on a straight-line basis over the vesting period based on the Group’s estimate of shares that will eventually vest.
No expense is recognised (and any previously recognised expense is reversed) for awards that do not ultimately vest, except where vesting is conditional upon a measure linked to Fiberweb’s share price (“a market condition”) or other market conditions. The likelihood of achieving the market condition is taken into account in the fair value and, therefore, the award is treated as vesting irrespective of whether or not the market condition is satisfied, provided that any other performance condition is met.
When an award is cancelled, it is treated as if it had vested on the date of cancellation, and any expense not yet recognised for the award is recognised immediately in the income statement.
The cost of share-based compensation schemes is recognised as an expense within staff costs in the income statement (see Note 9).
Leases
The Group as lessor
Rental income from operating leases is recognised in income on a straight-line basis over the term of the relevant lease, unless another systematic basis is more representative of the time pattern in which use benefit derived from the leased asset is diminished. Initial direct costs incurred in negotiating and arranging an operating lease are added to the carrying amount of the leased asset and recognised on a straight-line basis over the lease term.
The Group as lessee
Where assets are financed by lease agreements that give rights similar to ownership (finance leases), the assets are treated as if they had been purchased and the leasing commitments are shown as obligations to the lessors. The capitalisation values of the assets are written off on a straight-line basis over the shorter of the periods of the leases or the useful lives of the assets concerned. The capital elements of future leases are recorded as liabilities, while the interest elements are charged to the income statement over the period of the leases to produce a constant rate of charge on the balance of capital payments outstanding.
For all other leases (operating leases), the rental payments are charged to the income statement on a straight-line basis over the lives of the leases.
Post-retirement benefits
Payments to defined contribution retirement benefit schemes are charged as an expense as they fall due.
F-164
Table of Contents
For defined benefit retirement benefit schemes, the cost is determined using the Projected Unit Credit Method, with actuarial valuations being carried out annually on 31 December. Actuarial gains and losses are recognised in full in the period in which they occur. They are recognised outside profit or loss and presented in the Consolidated Statement of Comprehensive Income.
Past service cost are recognised immediately.
The retirement benefit obligation recognised in the balance sheet represents the present value of the defined benefit obligation as adjusted for unrecognised past service costs, and reduced by the fair value of scheme assets. Any asset resulting from this calculation is limited to past service cost, plus the present value of available refunds and reductions in future contributions to the plan.
Retirement benefit scheme contribution levels are determined by valuations undertaken by independent qualified actuaries. In certain overseas subsidiaries, to comply with local legislation and to obtain taxation advantages, provision is made for the total actuarial liability less the current surrender value of the supporting investment.
Treasury
Transactions in foreign currencies are translated into Sterling at the rate of exchange at the date of the transaction. Monetary assets and liabilities denominated in foreign currencies at the balance sheet date are recorded at the rates of exchange prevailing at that date. Any gain or loss arising from a change in exchange rates subsequent to the date of transaction is recognised in the income statement. Where monetary assets and liabilities have been designated effective hedges against net investments in foreign operations, the exchange gains and losses arising on those assets and liabilities are taken directly to reserves.
The income statements of overseas operations are translated into Sterling at the average exchange rates for the year and their balance sheets are translated into Sterling at the exchange rates ruling at the balance sheet date. All exchange differences arising on consolidation are taken to reserves, subject to the requirements of IAS 21 The Effect of Changes in Foreign Exchange Rates. All other translation differences are taken to the income statement.
Derivative financial instruments utilised by the Group comprise foreign exchange contracts, interest rate swaps and commodity derivatives. All such instruments are used for hedging purposes to manage the risk profile of an underlying exposure of the Group in line with the Group’s risk management policies. The Group designates these derivatives as either hedges of highly probable forecast transactions or hedges of foreign currency risk of firm commitments (cash flow hedges) or hedges of investments in foreign operations.
All derivative instruments are recorded on the balance sheet at fair value. Recognition of gains or losses on derivative instruments depends on whether the instrument is designated as a hedge and the type of exposure it is designed to hedge.
The effective portion of changes in the fair value of derivatives that are designated and qualify as cash flow hedges are deferred in equity. The gain or loss relating to the ineffective portion is recognised immediately in profit or loss.
Amounts deferred in equity are recycled in profit or loss in the periods when the hedged item is recognised in profit or loss in the same line of the income statement as the recognised hedged item. However, when the forecast transaction that is hedged results in the recognition of a non-financial asset or a non-financial liability, the gains and losses previously deferred in equity are transferred from equity and included in the initial measurement of the cost of the asset or liability.
Hedge accounting is discontinued when the Group revokes the hedging relationship, the hedging instrument expires or is sold, terminated, or exercised, or no longer qualifies for hedge accounting. Any cumulative gain or
F-165
Table of Contents
loss deferred in equity at that time remains in equity and is recognised when the forecast transaction is ultimately recognised in profit or loss. When a forecast transaction is no longer expected to occur, the cumulative gain or loss that was deferred in equity is recognised immediately in profit or loss.
Hedges of net investments in foreign operations are accounted for similarly to cash flow hedges. Any gain or loss on the hedging instrument relating to the effective portion of the hedge is recognised immediately in profit or loss.
Gains or losses deferred in the foreign currency translation reserve are recognised in profit or loss on disposal of the foreign operation.
Changes in the fair value of the derivative financial instruments that do not qualify for hedge accounting are recognised in the income statement as they arise.
Operating profit
Operating profit is stated after charging restructuring costs and after the share of results of associates and joint ventures, but before investment income and finance costs (see Note 4).
Taxation
The charge for taxation is based on the profit for the year and takes into account taxation deferred due to temporary differences between the treatment of certain items for taxation and accounting purposes.
Deferred tax is the tax expected to be payable or recoverable on differences between the carrying amounts of assets and liabilities in the Financial Statements and the corresponding tax bases in the computation of taxable profit, and is accounted for using the balance sheet liability method.
No provision is made for temporary differences on unremitted earnings of foreign subsidiaries, joint ventures or associates where the Group has control and the reversal of the temporary difference is not foreseeable.
The carrying amount of deferred tax assets is reviewed at each balance sheet date and reduced to the extent that it is no longer probable that sufficient taxable profits will be available to allow all or part of the asset to be recovered.
Deferred tax is calculated at the tax rates that are expected to apply in the period when the liability is settled or the asset is realised. Deferred tax is charged or credited in the income statement, except when it relates to items charged or credited to equity, in which case the deferred tax is also dealt with in equity.
Property, plant and equipment
Property, plant and equipment are stated in the balance sheet at cost less accumulated depreciation and provision for impairment. Depreciation is provided on the cost or valuation of property, plant and equipment less estimated residual value and is calculated on a straight-line basis over the following estimated useful lives of the assets:
| Land |
not depreciated | |||
| Building |
Up to 40 years maximum | |||
| Plant and Machinery (including essential commissioning costs) |
3 to 15 years | |||
| Tooling, vehicles, computer and office equipment are categorised within Plant and Machinery. |
Finance costs which are directly attributable to the construction of major items of property, plant and equipment are capitalised as part of those assets. The commencement of capitalisation begins when both finance costs and
F-166
Table of Contents
expenditures for the asset are being incurred and activities that are necessary to get the asset ready for use are in progress. Capitalisation ceases when substantially all the activities that are necessary to get the asset ready for use are complete. During the year ended 31 December 2012, an average rate of 3.8% (2011: 5.3%, 2010: 5.2%) was used for the capitalisation of finance costs.
Intangible assets excluding goodwill
Licenses are shown at amortised cost. Amortisation provided on the cost of licenses is calculated on a straight-line basis over the useful life of the licenses.
Where computer software is not an integral part of a related item of computer hardware, the software is treated as an intangible asset. Computer software is capitalised on the basis of the costs incurred to acquire and bring to use the specific software. Amortisation is provided on the cost of software and is calculated on a straight-line basis over the useful life of the software.
The Group makes an assessment of the fair value of intangible assets arising on acquisitions. An intangible asset will be recognised as long as the asset is separable or arises from contractual or other legal rights, and its fair value can be measured reliably. Amortisation is provided on the fair value of the asset, excluding goodwill, and is calculated on a straight-line basis over the following useful economic lives of the assets:
Customer relationships—8 to 12 years
Technology—10 years
Brand names and trade names—10 to 12 years
Non-compete agreements—3 years
At each balance sheet date, the Group reviews the carrying value of its tangible and intangible assets to determine whether there is any indication that those assets have suffered an impairment loss. If any such indication exists, the recoverable amount of the asset is estimated in order to determine the extent of the impairment loss. Where the asset does not generate cash flows that are independent from other assets, the Group estimates the recoverable amount of the cash-generating unit to which the asset belongs. An intangible asset with an indefinite life is tested for impairment annually and whenever there is an indication that the asset may be impaired.
Recoverable amount is the higher of fair value less costs to sell and value in use. In assessing value in use, the estimated future cash flows are discounted to their present value using a pre-tax discount rate that reflects current market assessments of the time value of money and the risks specific to the asset for which the estimates of future cash flows have not been adjusted. If the recoverable amount of an asset or cash-generating unit is estimated to be less than its carrying amount, the carrying amount of the asset or cash-generating unit is reduced to its recoverable amount. An impairment loss is recognised immediately, unless the relevant asset is carried at a revalued amount, in which case the impairment loss is treated as a revaluation decrease.
Where an impairment loss subsequently reverses, the carrying amount of the asset or cash-generating unit is increased to the revised estimate of its recoverable amount, but so that the increased carrying amount does not exceed the carrying amount that would have been determined had no impairment loss been recognised for the asset or cash-generating unit in prior years. A reversal of an impairment loss is recognised as income immediately, unless the relevant asset is carried at a revalued amount, in which case the reversal of the impairment loss is treated as a revaluation increase.
Inventory
Inventory is stated at the lower of cost and net realisable value. Cost comprises the cost of raw materials and an appropriate proportion of labour and overheads in the case of work in progress and finished goods. Cost is calculated on a first in first out basis. Provision is made for slow moving or obsolete inventory as appropriate.
F-167
Table of Contents
Financial instruments
Financial assets and financial liabilities are recognised on the Group’s balance sheet when the Group becomes a party to the contractual provisions of the instrument.
Financial assets
Investments are recognised and derecognised on a trade date where the purchase or sale of an investment is under contract whose terms require delivery of the investment within the timeframe established by the market concerned, and are initially measured at fair value, plus transaction costs, except for those financial assets classified as at fair value through profit and loss, which are initially measured at fair value.
Financial assets are classified into the following categories: financial assets “at fair value through profit and loss” (FVTPL), “held to maturity” investments, “available-for-sale” (AFS) financial assets and “loans and receivables”. The classification depends on the nature and purpose of the financial assets and is determined at the time of initial recognition. As at 31 December 2012, 2011 and 2010, the Group did not have any “held-to-maturity” investments or AFS financial assets. The Group does not enter into hedge transactions for speculative purposes.
Financial assets at FVTPL
Financial assets are classified as at FVTPL where the financial asset is either held for trading or it is designated as at FVTPL.
A financial asset is classified as held for trading if:
| • | it has been acquired principally for the purpose of selling in the near future; or |
| • | it is a part of an identified portfolio of financial instruments that the Group manages together and has a recent actual pattern of short-term profit-taking; or |
| • | it is a derivative that is not designated and effective as a hedging instrument. |
A financial asset other than a financial asset held for trading may be designated as at FVTPL upon initial recognition if:
| • | such designation eliminates or significantly reduces a measurement or recognition inconsistency that would otherwise arise; or |
| • | the financial asset forms part of a group of financial assets or financial liabilities or both, which is managed and its performance is evaluated on a fair value basis, in accordance with the Group’s documented risk management or investment strategy, and information about the Group is provided internally on that basis; or |
| • | it forms part of a contract containing one or more embedded derivatives, and IAS 39 Financial Instruments: Recognition and Measurement permits the entire combined contract (asset or liability) to be designated as at FVTPL. |
Financial assets at FVTPL are stated at fair value, with any resultant gain or loss recognised in profit or loss. The net gain or loss recognised in profit or loss incorporates any dividend or interest earned on the financial asset.
Loans and receivables
Trade receivables, loans, and other receivables that have fixed or determinable payments that are not quoted in an active market are classified as loans and receivables. Loans and receivables are measured at amortised cost using the effective interest method, less any impairment. Interest income is recognised by applying the effective interest rate, except for short-term receivables when the recognition of interest would be immaterial.
F-168
Table of Contents
The one-year Vendor Loan Note of US$26.0 million issued following the disposal of the Hygiene business was classified as an other receivable in 2011.
Trade receivables
Trade receivables do not carry any interest and are stated at their nominal value as reduced by appropriate allowances for estimated irrecoverable amounts.
Cash and cash equivalents
Cash and cash equivalents comprise cash on hand and demand deposits, and other short-term highly liquid investments that are readily convertible to a known amount of cash and are subject to an insignificant risk of changes in value.
Financial liabilities and equity
Financial liabilities and equity instruments are classified according to the substance of the contractual arrangements entered into. An equity instrument is any contract that evidences a residual interest in the assets of the Group after deducting all of its liabilities.
Financial liabilities
Financial liabilities are classified as either financial liabilities “at FVTPL” or “other financial liabilities”.
Financial liabilities at FVTPL
Financial liabilities are classified as at FVTPL where the financial liability is either held for trading or it is designated as at FVTPL.
A financial liability is classified as held for trading if:
| • | it has been incurred principally for the purpose of disposal in the near future; or |
| • | it is part of an identified portfolio of financial instruments that the Group manages together and has a recent actual pattern of short-term profit-taking; or |
| • | it is a derivative that is not designated and effective as a hedging instrument. |
A financial liability other than a financial liability held for trading may be designated as at FVTPL upon initial recognition if:
| • | such designation eliminates or significantly reduces a measurement or recognition inconsistency that would otherwise arise; or |
| • | the financial liability forms part of a group of financial assets or financial liabilities or both, which is managed and its performance is evaluated on a fair value basis, in accordance with the Group’s documented risk management or investment strategy, and information about the Group is provided internally on that basis; or |
| • | it forms part of a contract containing one or more embedded derivatives, and IAS 39 Financial Instruments: Recognition and Measurement permits the entire combined contract (asset or liability) to be designated as at FVTPL. |
Financial liabilities at FVTPL are stated at fair value, with any resultant gain or loss recognised in profit or loss. The net gain or loss recognised in profit or loss incorporates any interest paid on the financial liability.
F-169
Table of Contents
Other financial liabilities
Other financial liabilities, including borrowings, are initially measured at fair value, net of transaction costs. Other financial liabilities are subsequently measured at amortised cost using the effective interest method, with interest expense recognised on an effective yield basis. The effective interest method is a method of calculating the amortised costs of a financial liability and of allocating interest expense over the relevant period. The effective interest rate is the rate that exactly discounts estimated future cash payments through the expected life of the financial liability, or, where appropriate, a shorter period.
Bank borrowings
Interest-bearing bank loans and overdrafts are recorded at the proceeds received, net of direct issue costs. Finance charges, including premiums payable on settlement or redemption and direct issue costs, are accounted for on an accrual basis to the profit and loss account using the effective interest method and are added to the carrying amount of the instrument to the extent that they are not settled in the period in which they arise.
Trade payables
Trade payables are not interest bearing and are stated at their nominal value.
Equity instruments
Equity instruments issued by the Company are recorded at the proceeds received net of direct issue costs.
Critical accounting judgements and key sources of estimation uncertainty
The key assumptions concerning the future, and other key sources of estimation uncertainty at the balance sheet date, that have a significant risk of causing a material adjustment to the carrying amounts of assets and liabilities within the next financial year, are discussed below.
The judgements used by management in the application of the Group’s accounting policies in respect of these key areas of estimation are considered to be the most significant.
Impairment of goodwill and tangible fixed assets
Determining whether goodwill or tangible fixed assets are impaired requires an estimation of the value in use of the cash-generating units to which the goodwill has been allocated or the individual assets. The value in use calculation requires the entity to estimate future cash flows expected to arise from the cash-generating unit or asset and a suitable discount rate in order to calculate present value. The carrying amount of goodwill and tangible fixed assets at the balance sheet date was £39.0 million (2011: £40.2 million; 2010: £34.7 million) and £86.3 million (2011: £90.3 million; 2010: £214.2 million) respectively.
Details regarding the goodwill and tangible fixed asset carrying value and assumptions used in carrying out the impairment reviews are provided in Notes 10 and 11.
Pensions and other post-retirement benefits
Determining the present value of future obligations of pension and other post-retirement benefit schemes requires an estimation of future mortality rates, future changes in employee benefits and length of service. These assumptions are determined in association with qualified actuaries. Following the US$25 million (£15.5 million) one-off cash contribution made to the US pensions funds in December 2012, the net pension liability related to defined benefit type schemes at the balance sheet date was £5.5 million (2011: £25.6 million, 2010: £35.5 million). Details regarding the carrying value and assumptions used in arriving at the carrying value are provided in Note 23.
F-170
Table of Contents
Taxation
Deferred tax assets are recognised on tax losses to the extent that they are considered recoverable over the forecast period. Details about deferred tax assets held in respect of losses are provided in Note 24.
3. Segmental information
The Group’s reportable segments are defined according to markets served: Technical Fabrics and Geosynthetics. Fiberweb manages the trading results of individual reporting entities and operational sites analysed by the specific markets they serve. Segmentation of assets and liabilities is on a reporting entity basis, as reported to the Fiberweb Executive Team. The Fiberweb Executive Team reviews the trading results of the divisions before the allocation of global Research and Development costs (“R&D”) and Health and Safety expenses (“HSE”)—shown in the table below as trading profit.
Technical Fabrics consists of the former Industrial divisions, excluding certain Geotextile businesses in the USA which are now part of the new Geosynthetics segment, but including the retained Dryer Sheet business at Old Hickory and the retained Hygiene operations in Europe, which form an integral part of our sites at Biesheim, France and Terno d’Isola, Italy.
Geosynthetics is made up of the Group’s existing UK-based Geotextile operations, the Boddingtons and Tubex businesses acquired during 2011, and the Group’s Geotextile and Construction businesses in the USA.
3a. Segmental revenues and results
Year ended 31 December 2012*
| Technical Fabrics £’m |
Geosynthetics £’m |
Total £’m |
||||||||||
| Continuing operations |
||||||||||||
| External sales by origin |
220.3 | 79.8 | 300.1 | |||||||||
| Trading profit |
16.1 | 1.8 | 17.9 | |||||||||
| Unallocated corporate costs |
(10.3 | ) | ||||||||||
| Operating profit from continuing operations |
7.6 | |||||||||||
| Net finance costs |
(1.8 | ) | ||||||||||
| Profit before tax |
5.8 | |||||||||||
| * | —restated following the adoption of amendments to IAS 19 Employee Benefits which has been applied retrospectively |
Unallocated corporate costs primarily include the central costs for central functions that are not allocated to the reporting segments together with global R&D and health and safety costs.
| Other information—continuing operations |
Technical Fabrics £’m |
Geosynthetics £’m |
Unallocated Corporate £’m |
Total £’m |
||||||||||||
| Operating profit margin % |
6.0 | % | 0.3 | % | — | 2.6 | % | |||||||||
| Capital additions (Notes 10 and 11) |
6.5 | 7.3 | 1.9 | 15.7 | ||||||||||||
| Depreciation and amortisation |
11.5 | 0.8 | 0.5 | 12.8 | ||||||||||||
| Impairment losses recognised in profit or loss |
2.6 | 0.7 | — | 3.3 | ||||||||||||
F-171
Table of Contents
Year ended 31 December 2011*
| Technical Fabrics £’m |
Geosynthetics £’m |
Total £’m |
||||||||||
| Continuing operations |
||||||||||||
| External sales by origin |
234.5 | 63.3 | 297.8 | |||||||||
| Trading profit |
24.7 | (7.6 | ) | 17.1 | ||||||||
| Unallocated corporate costs |
(7.5 | ) | ||||||||||
| Operating profit from continuing operations |
9.6 | |||||||||||
| Finance costs |
(16.0 | ) | ||||||||||
| Loss before tax |
(6.4 | ) | ||||||||||
| * | —restated following the adoption of amendments to IAS 19 Employee Benefits which has been applied retrospectively |
Unallocated corporate costs primarily include the central costs for central functions that are not allocated to the reporting segments together with global R&D and health and safety costs.
Profit after tax includes a £Nil (2011: a loss of £0.7 million, 2010: £4.1 million) share of results from associates and joint ventures within Geosynthetics and a profit of £Nil (2011: £7.3 million, 2010: £0.7 million) within discontinued operations.
| Other information—continuing operations |
Technical Fabrics £’m |
Geosynthetics £’m |
Unallocated Corporate £’m |
Total £’m |
||||||||||||
| Operating profit margin % |
9.4 | % | (13.1 | )% | — | 2.9 | % | |||||||||
| Capital additions |
14.6 | 2.2 | 0.1 | 16.9 | ||||||||||||
| Depreciation and amortisation |
10.8 | 0.7 | 0.8 | 12.3 | ||||||||||||
| Impairment losses recognised in profit or loss |
1.0 | 0.6 | — | 1.6 | ||||||||||||
Year ended 31 December 2010*
| Technical Fabrics £’m |
Geosynthetics £’m |
Total £’m |
||||||||||
| Continuing operations |
||||||||||||
| External sales by origin |
218.7 | 50.5 | 269.2 | |||||||||
| Trading profit |
32.9 | (1.9 | ) | 31.0 | ||||||||
| Unallocated corporate costs |
(13.7 | ) | ||||||||||
| Operating profit from continuing operations |
17.3 | |||||||||||
| Finance costs |
(14.9 | ) | ||||||||||
| Profit before tax |
2.4 | |||||||||||
| * | —restated following the adoption of amendments to IAS 19 Employee Benefits which has been applied retrospectively |
F-172
Table of Contents
Unallocated corporate costs primarily include the central costs for central functions that are not allocated to the reporting segments together with global R&D and health and safety costs.
| Other information—continuing operations |
Technical Fabrics £’m |
Geosynthetics £’m |
Unallocated Corporate £’m |
Total £’m |
||||||||||||
| Operating profit margin % |
13.8 | % | (5.0 | )% | — | 6.4 | % | |||||||||
| Capital additions |
26.0 | 0.4 | 0.3 | 26.7 | ||||||||||||
| Depreciation and amortisation |
10.5 | 0.1 | 0.6 | 11.2 | ||||||||||||
| Impairment losses recognised in profit or loss |
1.2 | — | — | 1.2 | ||||||||||||
| Asset write-downs recognised in profit or loss |
0.8 | — | — | 0.8 | ||||||||||||
3b. Segment assets and liabilities
| 2012* £’m |
2011* £’m |
2010* £’m |
||||||||||
| Assets: |
||||||||||||
| Technical Fabrics |
165.5 | 182.9 | 193.1 | |||||||||
| Geosynthetics |
36.3 | 30.6 | 6.4 | |||||||||
| Consolidated total assets, excluding tax assets and cash |
201.8 | 213.5 | 199.5 | |||||||||
| Unallocated corporate assets |
40.9 | 223.8 | 292.3 | |||||||||
| Consolidated total assets |
242.7 | 437.3 | 491.8 | |||||||||
| Liabilities: |
||||||||||||
| Technical Fabrics |
42.5 | 32.9 | 58.8 | |||||||||
| Geosynthetics |
8.1 | 8.8 | 2.7 | |||||||||
| Segment liabilities, excluding tax liabilities and debt |
50.6 | 41.7 | 61.5 | |||||||||
| Unallocated corporate liabilities |
18.1 | 215.9 | 251.7 | |||||||||
| Consolidated total liabilities |
68.7 | 257.6 | 313.2 | |||||||||
| * | —restated following the adoption of amendments to IAS 19 Employee Benefits which has been applied retrospectively |
Unallocated corporate assets and liabilities primarily include cash and debt, tax balances and investments.
3c. Geographical information
| 2012* | 2011* | 2010* | ||||||||||||||||||||||
| External sales by origin (Continuing Group) |
Non-current assets |
External sales by origin (Continuing Group) |
Non-current assets |
External sales by origin (Continuing Group) |
Non-current assets |
|||||||||||||||||||
| £’m | £’m | £’m | £’m | £’m | £’m | |||||||||||||||||||
| United Kingdom |
28.5 | 23.9 | 31.6 | 16.3 | 19.1 | 55.6 | ||||||||||||||||||
| United States |
147.4 | 45.0 | 125.8 | 52.7 | 125.2 | 57.7 | ||||||||||||||||||
| Sweden |
— | — | — | — | 36.1 | |||||||||||||||||||
| Germany |
41.3 | 14.0 | 55.4 | 15.3 | 54.1 | 21.7 | ||||||||||||||||||
| Italy |
39.2 | 30.7 | 41.8 | 31.5 | 40.2 | 79.4 | ||||||||||||||||||
| France |
41.7 | 17.7 | 40.7 | 19.5 | 30.6 | 20.9 | ||||||||||||||||||
| China |
— | — | — | — | — | 34.6 | ||||||||||||||||||
| Other(1) |
2.0 | — | 2.5 | 0.2 | — | 0.5 | ||||||||||||||||||
| 300.1 | 131.3 | 297.8 | 135.5 | 269.2 | 306.5 | |||||||||||||||||||
| (1) | Other includes countries which the Group does not consider to be individually material. |
| (2) | *— restated following the adoption of amendments to IAS 19 Employee Benefits which has been applied retrospectively |
F-173
Table of Contents
As required by IFRS 8 Operating Segments, non-current assets are shown above excluding financial instruments, deferred tax assets, post-employment benefit assets, and rights arising under insurance contracts.
3d. Information about major customers
In the continuing Group, no individual customer makes up more than 9% of the Group’s revenue. In the year ended 31 December 2012, revenues of £26.6 million (2011: £32.8 million, 2010: £28.3 million) and £Nil (2011: £Nil, 2010: £Nil) are included within Technical Fabrics and Geosynthetics revenues respectively which arose from sales to the Group’s single largest customer.
4. Profit/(loss) for the year
Profit/(loss) for the year is stated after charging/(crediting):
| Continuing | Discontinued | Total | ||||||||||||||||||||||||||||||||||||||
| Note | 2012* £’m |
2011* £’m |
2010* £’m |
2012* £’m |
2011* £’m |
2010* £’m |
2012* £’m |
2011* £’m |
2010* £’m |
|||||||||||||||||||||||||||||||
| Net foreign exchange (gains)/losses |
(0.2 | ) | 0.2 | (0.4 | ) | — | — | (0.3 | ) | (0.2 | ) | 0.2 | (0.7 | ) | ||||||||||||||||||||||||||
| Change in the fair value of derivative instruments outstanding at year end and classified as FVTPL |
— | — | 0.2 | — | 0.7 | 0.3 | — | 0.7 | 0.5 | |||||||||||||||||||||||||||||||
| Other operating income |
(2.6 | ) | (1.8 | ) | (0.8 | ) | — | (1.1 | ) | (1.5 | ) | (2.6 | ) | (2.9 | ) | (2.3 | ) | |||||||||||||||||||||||
| Research and development costs |
4.4 | 4.5 | 4.0 | — | 3.9 | 4.6 | 4.4 | 8.4 | 8.6 | |||||||||||||||||||||||||||||||
| Depreciation of property, plant and equipment |
11 | 12.4 | 12.3 | 11.2 | — | 14.3 | 14.5 | 12.4 | 26.6 | 25.7 | ||||||||||||||||||||||||||||||
| Impairment and write-downs of property, plant and equipment |
11 | 2.3 | 1.5 | 1.7 | — | 3.1 | — | 2.3 | 4.6 | 1.7 | ||||||||||||||||||||||||||||||
| Amortisation of intangible assets (included in administration expenses) |
10 | 1.0 | 0.8 | 0.2 | — | 0.4 | 0.2 | 1.0 | 1.2 | 0.4 | ||||||||||||||||||||||||||||||
| Impairment and write-downs of intangible assets |
10 | — | 0.1 | — | — | — | 0.1 | — | 0.1 | 0.1 | ||||||||||||||||||||||||||||||
| Impairment of intangible assets transferred to held for sale |
16 | 0.6 | — | — | — | — | — | 0.6 | — | — | ||||||||||||||||||||||||||||||
|
|
|
|
|
|
|
|
|
|
|
|
|
|
|
|
|
|
|
|
|
|||||||||||||||||||||
| Total depreciation and amortisation expense |
16.3 | 14.7 | 13.1 | — | 17.8 | 14.8 | 16.3 | 32.5 | 27.9 | |||||||||||||||||||||||||||||||
|
|
|
|
|
|
|
|
|
|
|
|
|
|
|
|
|
|
|
|
|
|||||||||||||||||||||
| Total employee costs |
9 | 60.8 | 62.6 | 58.4 | — | 25.3 | 27.0 | 60.8 | 87.9 | 85.4 | ||||||||||||||||||||||||||||||
|
|
|
|
|
|
|
|
|
|
|
|
|
|
|
|
|
|
|
|
|
|||||||||||||||||||||
| Cost of inventories recognised as an expense |
233.0 | 232.7 | 200.9 | — | 179.7 | 162.8 | 233.0 | 412.4 | 363.7 | |||||||||||||||||||||||||||||||
| Write-downs of inventories recognised as an expense |
(0.3 | ) | (0.3 | ) | 0.3 | — | — | — | (0.3 | ) | (0.3 | ) | 0.3 | |||||||||||||||||||||||||||
| * | —restated following the adoption of amendments to IAS 19 Employee Benefits which has been applied retrospectively |
Other operating income for continuing operations of £2.6 million (2011: £1.8 million, 2010: £0.8 million) comprises government grants, rental income, IT services to third parties and other sundry items.
Year ended 31 December 2012
Within cost of sales, significant items include:
| • | Impairment charges and other asset write-downs of £2.3 million in Technical Fabrics in respect of a pilot line and a number of assets in Old Hickory, USA which have a nil value in use and which will therefore not be transferred to the planned warehouse and converting facility. |
| • | Impairment charges of £0.3 million in Berlin and Aschersleben in Technical Fabrics in respect of inventories, equipment and patents held for discontinued product lines. |
| • | Profit on disposal of £0.2 million for previously impaired assets at Terno d’Isola in Italy in Technical Fabrics. |
F-174
Table of Contents
Within administrative expenses, significant items include:
| • | An impairment of £0.6 million primarily of allocated goodwill and acquired intangibles recognised on the transfer of the Geosynthetics Australian business to held for sale (see Note 16). |
Within the operating results, there are restructuring costs of £3.5 million which comprise:
| • | £2.7 million in respect of the final closure of manufacturing at the Terram site in Pontypool. |
| • | £1.2 million of restructuring costs for the cost reduction programme as a result of the disposal of the Hygiene business reflecting the smaller size of the Group and actions to reduce the cost base in the Group’s German operations in response to the contraction in European residential construction markets. |
| • | A credit of £0.4 million following the receipt of a repayment on a previously impaired financial asset. |
Year ended 31 December 2011
Within cost of sales, significant items include:
| • | £0.7 million loss in respect of the ineffective portion of the mark-to-market valuation in respect of polypropylene hedge instruments. |
| • | Asset impairments of £1.0 million at Terno d’Isola in Italy and £0.6 million recorded in Geosynthetics for obsolete equipment in Wales which was not transferred to the Maldon site. |
| • | Additional costs of £0.4 million arising on the sale and leaseback of the Utility plant at Old Hickory, USA. |
Within administrative expenses, significant items include:
| • | £0.3 million in respect of transaction costs and related professional fees in connection with the acquisition of Boddingtons and Tubex and other potential transactions. |
| • | A curtailment gain and immediate recognition of a past service cost credit of £6.4 million in respect of changes made to benefits under the Group’s US post-retirement medical benefit schemes. |
| • | In addition, a £0.3 million impairment arose on the Group’s 10% investment in Cordustex (Pty) Limited. |
Within the operating result, there are restructuring costs of £4.6 million which comprise:
| • | £2.3 million of restructuring costs for the cost reduction programme as a result of the disposal of the Hygiene business reflecting the smaller size of the Group. |
| • | £3.5 million in respect of the integration of Boddingtons and Tubex with Terram in the Geosynthetics Division including the transfer of production from Terram’s Pontypool facility to the Geosynthetics facility in Maldon. |
| • | £1.7 million in respect of the transfer of production from the Königswinter site in Germany to Berlin in Technical Fabrics. |
| • | £0.1 million in respect of other restructuring activities across the Group, offset by a £0.4 million write back of a provision not required for Korma. In addition, a £2.6 million gain was recognised on the sale of land and buildings on the Korma site which had been fully impaired following the cessation of operations in December 2008. |
Year ended 31 December 2010
Within cost of sales, significant items include:
| • | £0.7 million gain in respect of the ineffective portion of the mark-to-market valuation adjustment in respect of polypropylene hedge instruments. |
F-175
Table of Contents
| • | An impairment charge of £0.6 million was recorded on the transfer of the Old Hickory utility plant to assets held for sale to reflect fair value less costs to sell (see Note 16). |
Within administrative items, significant one-off costs include £3.7 million of transaction costs and related professional fees in connection with the acquisition of Boddingtons International Limited in January 2011 (see Note 29) and an aborted acquisition opportunity. In addition, an impairment charge of £0.6 million was recognised to write off the cost of investment in Terram Geosynthetics Private Limited, which at the time was not considered to be recoverable.
The restructuring credit of £0.6 million is in respect of a gain of £0.6 million on the disposal of assets that were previously impaired at our Korma site in Italy following its closure.
5. Investment income and finance costs
| 2012* |
2011* £’m |
2010* £’m |
||||||||||
| Interest income on Vendor Loan Note |
0.6 | — | — | |||||||||
| Other interest income |
— | — | — | |||||||||
|
|
|
|
|
|
|
|||||||
| Total investment income |
0.6 | — | — | |||||||||
|
|
|
|
|
|
|
|||||||
| Interest on bank loans and overdrafts |
(0.3 | ) | (8.3 | ) | (6.4 | ) | ||||||
| Interest on obligations under finance leases |
— | (0.1 | ) | — | ||||||||
|
|
|
|
|
|
|
|||||||
| Total interest expense |
(0.3 | ) | (8.4 | ) | (6.4 | ) | ||||||
|
|
|
|
|
|
|
|||||||
| Net finance expense from pension schemes (Note 23) |
(0.9 | ) | (1.2 | ) | (1.4 | ) | ||||||
| Interest capitalised in the cost of qualifying assets (Note 11) |
0.1 | 0.3 | 0.7 | |||||||||
| Other finance costs |
(1.3 | ) | (5.4 | ) | (5.1 | ) | ||||||
| (2.4 | ) | (14.7 | ) | (12.2 | ) | |||||||
| Fair value losses on interest rate swaps transferred from equity for cash flow hedges of floating rate debt |
— | (1.3 | ) | (2.7 | ) | |||||||
|
|
|
|
|
|
|
|||||||
| Total finance costs from continuing operations |
(1.8 | ) | (16.0 | ) | (14.9 | ) | ||||||
|
|
|
|
|
|
|
|||||||
| Net finance costs from continuing operations |
(1.8 | ) | (16.0 | ) | (14.9 | ) | ||||||
| * | —restated following the adoption of amendments to IAS 19 Employee Benefits which has been applied retrospectively |
Other finance costs of £1.3 million (2011: £5.4 million, 2010: £5.1 million) include normal amortisation of prepaid facility fees of £0.3 million (2011: £1.5 million, 2010: £1.2 million). In addition, following the successful completion of the refinancing on 21 December 2012, the remaining facility fees of £0.3 million capitalised in respect of the previous Revolving Credit Facility (“the old RCF”) were expensed. In the year ended 31 December 2011, a charge of £1.8 million was recognised within the costs of disposal of the Hygiene business within discontinued operations in respect of accelerated facility fee amortisation following the corresponding reduction in the Group’s old RCF. Other components are commitment fees on the undrawn RCF of £0.7 million (2011: £0.6 million, 2010: £1.6 million) and amortisation of swap break costs of £Nil (2011: £3.3 million, 2010: £2.3 million).
Capitalised finance costs of £0.1 million (2011: £0.3 million, 2010: £0.7 million) relate to the construction of the new needlepunch line at the Group’s manufacturing plant in Maldon, UK and the digital printer in the USA. In 2011, the capitalised finance costs related to new lines at the Group’s manufacturing plants in Italy and in Berlin, Germany. In 2010, the capitalised finance costs related to the construction of the new research and development facility and the Steamworks both in Old Hickory.
In July 2010, the Group entered into US dollar and Euro interest rate swaps for the term of the old RCF and for the majority of the loan facility in each currency. As a consequence, the interest rate swap contracts under the old RCF were terminated, crystallising break costs of £5.4 million which were amortised through the Group’s
F-176
Table of Contents
finance charge over the original remaining term of the previous RCF i.e. July 2010 to end of September 2011. These swap break costs were being repaid in quarterly instalments over the term of the old RCF. Following the Hygiene disposal, the outstanding balances under these contracts were repaid during January 2012.
In the year ended 31 December 2011, no allocation of interest charges relating to the Group’s old RCF were made to discontinued operations on the basis that debt and related costs are managed on a group basis and cannot meaningfully be directly allocated.
6. Taxation
| 2012* £’m |
2011* £’m |
2010* £’m |
||||||||||
| Current tax—continuing operations |
||||||||||||
| Current income tax charge |
1.8 | (0.2 | ) | 2.0 | ||||||||
| Adjustments in respect of previous periods |
(0.2 | ) | (0.7 | ) | — | |||||||
| Deferred tax—continuing operations |
||||||||||||
| Origination and reversal of temporary differences |
2.6 | (1.6 | ) | 1.7 | ||||||||
| Adjustments in respect of previous periods |
(1.7 | ) | 1.3 | — | ||||||||
| Income tax charge/(credit) on operations |
2.5 | (1.2 | ) | 3.7 | ||||||||
| Partial recognition of temporary differences in respect of US, UK and Italian operations |
— | (3.0 | ) | (3.6 | ) | |||||||
|
|
|
|
|
|
|
|||||||
| Total income tax charge/(credit) for the year—continuing operations |
2.5 | (4.2 | ) | 0.1 | ||||||||
|
|
|
|
|
|
|
|||||||
| * | —restated following the adoption of amendments to IAS 19 Employee Benefits which has been applied retrospectively |
The total tax charge/(credit) for the year includes a credit of £2.3 million (2011: £5.5 million, 2010: £0.1 million) in respect of UK operations. All other tax items relate to overseas operations. Domestic income tax is calculated at 24.5% (2011: 26.5%, 2010: £28%) of the estimated assessable profit for the year. Taxation for other jurisdictions is calculated at the rates prevailing in the relevant jurisdictions.
In the period to 31 December 2011, in the light of post-demerger restructuring action and taking into account the forecast future profitability of the US operations, including management’s view of possible sensitivities to those forecasts, the Group recognised a deferred tax asset in respect of historic US tax losses, with recognition in that year of £6.1 million (2010: £6.4 million) in respect of US deductible temporary differences, generating a credit of £1.0 million in continuing operations (2010: £3.6 million in continuing operations, £1.1 million in discontinued operations) to the deferred tax expense for the year and a credit of £5.1 million (2010: £1.7 million) directly in equity in relation to temporary differences on retirement benefit obligations. In addition, as a result of future forecast profitability, deferred tax assets were partially recognised on historic UK and Italian losses amounting to £2.0 million (2010: £Nil).
F-177
Table of Contents
The total income tax charge/(credit) for the year can be reconciled to the total accounting profit as follows:
| 2012* £’m |
2011* £’m |
2010* £’m |
||||||||||
| Profit/(loss) before tax on continuing operations |
5.8 | (6.4 | ) | 2.4 | ||||||||
| Standard UK tax rate |
24.5 | % | 26.5 | % | 28.0 | % | ||||||
| Profit/(loss) before tax multiplied by the standard UK tax rate |
1.4 | (1.7 | ) | 0.7 | ||||||||
| Effects of: |
||||||||||||
| Expenses not deductible for tax purposes |
1.0 | 1.3 | 0.3 | |||||||||
| Losses not recognised |
0.5 | — | 2.4 | |||||||||
| Increased recognition of deferred tax assets |
— | (3.0 | ) | (3.6 | ) | |||||||
| Items on which deferred tax has not been recognised |
(0.6 | ) | (2.6 | ) | (0.6 | ) | ||||||
| Adjustments in respect of previous periods |
(1.9 | ) | 0.6 | — | ||||||||
| Effects of different tax rates in overseas jurisdictions |
1.7 | 1.4 | 0.9 | |||||||||
| Tax charge/(credit) for the year |
2.5 | (4.2 | ) | 0.1 | ||||||||
| Overall effective tax rate |
43.1 | % | 65.6 | % | 4 | % | ||||||
| * | —restated following the adoption of amendments to IAS 19 Employee Benefits which has been applied retrospectively |
The difference between the actual tax charge and that expected on the profit for the year has been based on the UK rate of Corporation Tax of 24.5% (2011: 26.5%, 2010: 28%). The comparison of actual tax is made against the UK standard rate rather than the blended rate of taxation for the Group, in order to provide a more consistent approach; the use of a blended rate would lead to a distortion year-on-year as the mix of profits and losses has changed considerably as have the underlying tax rates in various jurisdictions.
In addition to the income tax charge in the income statement, a net £0.8 million credit (2011: £4.4 million credit, 2010: £0.2 million credit) has been recorded in equity in the period, comprising a debit of £Nil (2011: £0.7 million, 2010: £1.4 million) in respect of fair value adjustments on financial instruments and a credit of £0.8 million in respect of retirement benefit obligations (2011: a credit of £5.1 million, 2010: a credit of £1.6 million).
The effective rate of tax on continuing profits in the year ended 31 December 2012 of £5.8 million (2011: loss of £6.4 million, 2010: profit of £2.4 million) is 43.1% (2011: 65.6%, 2010: 4 %). In the year ended 31 December 2011, the high effective rate was due to the credit of £3.0 million (2010: £3.6 million) on the full recognition of deferred tax assets on historic US tax losses and partial recognition on UK and Italian losses.
7. Dividends
| 2012 £’m |
2011 £’m |
2010 £’m |
||||||||||
| Amounts recognised as distributions to equity holders in the year: |
||||||||||||
| Final dividend for the year ended 31 December 2011 of 2.0p (2010: 2.5p; 2009: 2.5p) |
3.5 | 4.2 | 3.1 | |||||||||
| Interim dividend for the year ended 31 December 2012 of 1.0p (2011: 1.0p; 2010: 1,7p) |
1.7 | 1.8 | 2.1 | |||||||||
| 5.2 | 6.0 | 5.2 | ||||||||||
| Proposed final dividend for the year ended 31 December 2012 of 2.2p (2011: 2.0p; 2010: 2.5p) per share |
3.8 | 3.5 | 3.1 | |||||||||
The proposed final dividends were subject to approval by shareholders at the Annual General Meeting and have not been included as a liability in these Financial Statements. There are no Corporation Tax consequences of the proposed dividends for the Group.
F-178
Table of Contents
8. Earnings per share
| 2012* £’m |
2011* £’m |
2010* £’m |
||||||||||
| Earnings |
||||||||||||
| Continuing operations |
||||||||||||
| Basic and diluted: |
||||||||||||
| Profit/(loss) for the year—attributable to ordinary shareholders |
3.3 | (2.2 | ) | 2.3 | ||||||||
| Discontinued operations |
||||||||||||
| Basic and diluted: |
||||||||||||
| (Loss)/profit for the year—attributable to ordinary shareholders (Note 29) |
(0.1 | ) | 11.8 | 4.8 | ||||||||
|
|
|
|
|
|
|
|||||||
| Total |
||||||||||||
|
|
|
|
|
|
|
|||||||
| Basic and diluted: |
||||||||||||
| Profit for the year—attributable to ordinary shareholders |
3.2 | 9.6 | 7.1 | |||||||||
| Number of shares |
||||||||||||
| Weighted average number of 5p ordinary shares: |
||||||||||||
| For basic earnings per share |
173,583,551 | 165,247,456 | 133,328,166 | |||||||||
| For diluted earnings per share |
175,134,831 | 165,736,162 | 137,822,155 | |||||||||
| Earnings per share |
||||||||||||
| Continuing operations |
||||||||||||
| Basic: |
2.0 | p | (1.3 | )p | 1.7 | p | ||||||
| Diluted: |
2.0 | p | (1.3 | )p | 1.7 | p | ||||||
| * | —restated following the adoption of amendments to IAS 19 Employee Benefits which has been applied retrospectively |
| 2012 | 2011 | 2010 | ||||||||||
| Discontinued operations |
||||||||||||
| Basic: |
(0.1 | )p | 7.1 | p | 3.6 | p | ||||||
| Diluted: |
(0.1 | )p | 7.1 | p | 3.5 | p | ||||||
|
|
|
|
|
|
|
|||||||
| Total |
||||||||||||
|
|
|
|
|
|
|
|||||||
| Basic: |
1.9 | p | 5.8 | p | 5.3 | p | ||||||
| Diluted: |
1.9 | p | 5.8 | p | 5.2 | p | ||||||
F-179
Table of Contents
9. Employees
| 2012 Number |
2011 Number |
2010 Number |
||||||||||
| Average monthly number (including Executive Directors) |
||||||||||||
| By region |
||||||||||||
| Europe |
808 | 780 | 619 | |||||||||
| North America |
471 | 477 | 484 | |||||||||
| Rest of World |
11 | 8 | — | |||||||||
| Continuing operations |
1,290 | 1,265 | 1,103 | |||||||||
| Discontinued operations |
— | 645 | 700 | |||||||||
| 1,290 | 1,910 | 1,803 | ||||||||||
| By market |
||||||||||||
| Technical Fabrics |
983 | 994 | 973 | |||||||||
| Geosynthetics |
307 | 271 | 130 | |||||||||
| Continuing operations |
1,290 | 1,265 | 1,103 | |||||||||
| Discontinued operations |
— | 645 | 700 | |||||||||
| 1,290 | 1,910 | 1,803 | ||||||||||
| 2012* £’m Continuing |
2012* £’m Discontinued |
2012* £’m Total |
2011* £’m Continuing |
2011* £’m Discontinued |
2011* £’m Total |
2010* £’m Continuing |
2010* £’m Discontinued |
2010* £’m Total |
||||||||||||||||||||||||||||
| Employment costs |
||||||||||||||||||||||||||||||||||||
| Wages and salaries |
52.3 | — | 52.3 | 51.7 | 19.8 | 71.5 | 48.5 | 21.4 | 69.9 | |||||||||||||||||||||||||||
| Social security costs |
7.2 | — | 7.2 | 8.2 | 4.9 | 13.1 | 7.2 | 4.7 | 11.9 | |||||||||||||||||||||||||||
| Pension costs (Note 23) |
1.5 | — | 1.5 | 2.5 | 0.6 | 3.1 | 2.3 | 0.9 | 3.2 | |||||||||||||||||||||||||||
| (Credit)/expense of share-based payments (Note 25) |
(0.2 | ) | — | (0.2 | ) | 0.2 | — | 0.2 | 0.4 | — | 0.4 | |||||||||||||||||||||||||
| 60.8 | — | 60.8 | 62.6 | 25.3 | 87.9 | 58.4 | 27.0 | 85.4 | ||||||||||||||||||||||||||||
| * | —restated following the adoption of amendments to IAS 19 Employee Benefits which has been applied retrospectively |
10. Intangible assets
| Goodwill £’m |
Acquired Intangibles £’m |
Software & Licences £’m |
Total £’m |
|||||||||||||
| Cost |
||||||||||||||||
| At 1 January 2010 |
92.7 | — | 10.0 | 102.7 | ||||||||||||
| Exchange adjustments |
1.5 | — | 1.0 | 2.5 | ||||||||||||
| Additions |
— | — | 0.2 | 0.2 | ||||||||||||
| Asset write-downs |
— | — | (0.4 | ) | (0.4 | ) | ||||||||||
| Disposals |
— | — | (1.3 | ) | (1.3 | ) | ||||||||||
| At 1 January 2011 |
94.2 | — | 9.5 | 103.7 | ||||||||||||
| Exchange adjustments |
(0.1 | ) | — | 0.4 | 0.3 | |||||||||||
| Arising on acquisition |
6.0 | 5.0 | — | 11.0 | ||||||||||||
| Additions |
— | — | 0.7 | 0.7 | ||||||||||||
| Asset write-downs |
— | — | (0.1 | ) | (0.1 | ) | ||||||||||
| Disposal of subsidiaries |
— | — | (4.2 | ) | (4.2 | ) | ||||||||||
F-180
Table of Contents
| Goodwill £’m |
Acquired Intangibles £’m |
Software & Licences £’m |
Total £’m |
|||||||||||||
| At 1 January 2012 |
100.1 | 5.0 | 6.3 | 111.4 | ||||||||||||
| Exchange adjustments |
(3.5 | ) | — | (0.3 | ) | (3.8 | ) | |||||||||
| Additions |
— | — | 2.2 | 2.2 | ||||||||||||
| Transferred to held for sale (Note 16) |
(0.4 | ) | (0.2 | ) | — | (0.6 | ) | |||||||||
| At 31 December 2012 |
96.2 | 4.8 | 8.2 | 109.2 | ||||||||||||
| Amortisation and impairment |
||||||||||||||||
| At 1 January 2010 |
(57.6 | ) | — | (8.4 | ) | (66.0 | ) | |||||||||
| Exchange adjustments |
(1.9 | ) | — | (0.4 | ) | (2.3 | ) | |||||||||
| Asset write-down |
— | — | 0.3 | 0.3 | ||||||||||||
| Charge for the year |
— | — | (0.4 | ) | (0.4 | ) | ||||||||||
| Disposals |
— | — | 1.3 | 1.3 | ||||||||||||
| At 1 January 2011 |
(59.5 | ) | — | (7.6 | ) | (67.1 | ) | |||||||||
| Exchange adjustments |
(0.4 | ) | — | (0.1 | ) | (0.5 | ) | |||||||||
| Charge for the year |
— | (0.6 | ) | (0.6 | ) | (1.2 | ) | |||||||||
| Disposal of subsidiaries |
— | — | 2.6 | 2.6 | ||||||||||||
| At 1 January 2012 |
(59.9 | ) | (0.6 | ) | (5.7 | ) | (66.2 | ) | ||||||||
| Exchange adjustments |
2.7 | — | 0.3 | 3.0 | ||||||||||||
| Charge for the year |
— | (0.6 | ) | (0.4 | ) | (1.0 | ) | |||||||||
| At 31 December 2012 |
(57.2 | ) | (1.2 | ) | (5.8 | ) | (64.2 | ) | ||||||||
| Carrying amount: |
||||||||||||||||
| 31 December 2012 |
39.0 | 3.6 | 2.4 | 45.0 | ||||||||||||
| 31 December 2011 |
40.2 | 4.4 | 0.6 | 45.2 | ||||||||||||
| 31 December 2010 |
34.7 | — | 1.9 | 36.6 | ||||||||||||
Licences are amortised over the period to which they relate, which is on average five years.
Acquired intangibles consist of:
| • | Order backlog |
| • | Customer lists and relationships |
| • | Technology |
| • | Brand and trade names |
| • | Non-compete agreements |
Goodwill acquired in a business combination is allocated, at acquisition, to the cash-generating units (“CGUs”) that are expected to benefit from the business combination. The carrying amount of goodwill has been allocated as follows:
| 2012 £’m |
2011 £’m |
2010 £’m |
||||||||||
| Technical Fabrics—Europe |
21.5 | 21.7 | 22.3 | |||||||||
| Technical Fabrics—US |
11.9 | 12.5 | 12.4 | |||||||||
| Geosynthetics |
5.6 | 6.0 | — | |||||||||
| 39.0 | 40.2 | 34.7 | ||||||||||
The business tests goodwill for impairment annually or more frequently if there are indications that goodwill might be impaired.
F-181
Table of Contents
The recoverable amounts of the CGUs are determined from value in use calculations, based on pre-tax cash flows discounted using a pre-tax discount rate. The key assumptions for the value in use calculations are those regarding the discount rates, growth rates and expected changes to selling prices and direct costs during the period.
The business prepares cash flow forecasts derived from the most recent financial budgets approved by management. Growth rates used for 2013 to 2015 are based on selling price and cost assumptions for each business individually, built from management’s current knowledge and specific expectations for future profit evolution in the short term. Forecasts specifically exclude any incremental profits that may be generated through targeted investments in new technologies or strategic markets. Cash flows are then extrapolated for the following 40 years; growth rates from 2015 are in line with current inflation at 2%.
Value in use calculations assume an annual level of maintenance capital expenditure throughout the forecast period, with periodic higher investments included based on previous experience of the useful lives of the equipment in use. Specific capital injections to fund projects and new technologies are excluded from value in use calculations.
The rate used to discount the forecast cash flows is estimated by reference to the Group’s weighted average cost of capital and the degree of risk that management feels attaches to a CGU. The discount rates applied in the review at December 2012 range from 9% to 12% (2011: 9% to 11%, 2010: 9% to 10%).
Headroom ranges between 13% and 78%. The fair value of the European Technical Fabrics goodwill exceeds the carrying value by £12.1 million (2011: £46.3 million) using a pre-tax discount rate of 10.6% (2011: 10.4%). If the pre-tax discount rate increased above 12.0% or forecast EBITDA reduced by more than 13%, the fair value would fall below its carrying amount.
The US Technical Fabrics and Geosynthetics goodwill is comfortably supported by forecasts. A pre-tax discount rate of 10.6% in line with the Group’s pre-tax weighted average cost of capital has been applied.
Except with respect to European Technical Fabrics, management believes that there are no reasonably possible changes to the key assumptions which would result in the carrying amount of the CGUs exceeding the recoverable amounts.
11. Property, plant and equipment
| Land & Buildings £’m |
Fixtures & Equipment £’m |
Total £’m |
||||||||||
| Cost or valuation |
||||||||||||
| At 1 January 2010 |
110.9 | 350.1 | 461.0 | |||||||||
| Exchange adjustments |
1.7 | 5.6 | 7.3 | |||||||||
| Additions |
3.0 | 30.5 | 33.5 | |||||||||
| Interest capitalised in the cost of qualifying assets |
— | 0.7 | 0.7 | |||||||||
| Disposals |
(1.9 | ) | (3.8 | ) | (5.7 | ) | ||||||
| Assets reclassified as held for sale |
(0.3 | ) | (15.3 | ) | (15.6 | ) | ||||||
| Asset write-downs |
(0.9 | ) | (3.3 | ) | (4.2 | ) | ||||||
| At 1 January 2011 |
112.5 | 364.5 | 477.0 | |||||||||
| Exchange adjustments |
(0.3 | ) | (0.3 | ) | (0.6 | ) | ||||||
| Additions |
0.6 | 20.3 | 20.9 | |||||||||
| Interest capitalised in the cost of qualifying assets |
— | 0.3 | 0.3 | |||||||||
| Disposals |
(1.3 | ) | (1.0 | ) | (2.3 | ) | ||||||
| Arising on acquisition |
0.1 | 3.5 | 3.6 | |||||||||
F-182
Table of Contents
| Land & Buildings £’m |
Fixtures & Equipment £’m |
Total £’m |
||||||||||
| Disposal of subsidiaries |
(62.7 | ) | (176.1 | ) | (238.8 | ) | ||||||
| Asset write-downs |
(4.6 | ) | (4.0 | ) | (8.6 | ) | ||||||
| At 1 January 2012 |
44.3 | 207.2 | 251.5 | |||||||||
| Exchange adjustments |
(1.7 | ) | (7.3 | ) | (9.0 | ) | ||||||
| Additions |
1.2 | 12.3 | 13.5 | |||||||||
| Interest capitalised in the cost of qualifying assets |
— | 0.1 | 0.1 | |||||||||
| Disposals |
— | (1.0 | ) | (1.0 | ) | |||||||
| Reclassified as held for sale (Note 16) |
— | (0.4 | ) | (0.4 | ) | |||||||
| Asset write-downs |
— | (2.8 | ) | (2.8 | ) | |||||||
| At 31 December 2012 |
43.8 | 208.1 | 251.9 | |||||||||
| Accumulated depreciation and impairment |
||||||||||||
| At 1 January 2010 |
(45.5 | ) | (196.2 | ) | (241.7 | ) | ||||||
| Exchange adjustments |
(0.8 | ) | (2.6 | ) | (3.4 | ) | ||||||
| Depreciation charge for the year |
(3.6 | ) | (22.1 | ) | (25.7 | ) | ||||||
| Disposals |
1.8 | 3.7 | 5.5 | |||||||||
| Asset write downs |
0.1 | 2.4 | 2.5 | |||||||||
| At 1 January 2011 |
(48.0 | ) | (214.8 | ) | (262.8 | ) | ||||||
| Exchange adjustments |
0.4 | 1.1 | 1.5 | |||||||||
| Depreciation charge for the year |
(3.7 | ) | (22.9 | ) | (26.6 | ) | ||||||
| Disposals |
0.1 | 0.2 | 0.3 | |||||||||
| Impairments |
— | (1.5 | ) | (1.5 | ) | |||||||
| Disposal of subsidiaries |
24.6 | 97.8 | 122.4 | |||||||||
| Asset write-downs |
4.6 | 0.9 | 5.5 | |||||||||
| At 1 January 2012 |
(22.0 | ) | (139.2 | ) | (161.2 | ) | ||||||
| Exchange adjustments |
0.8 | 5.5 | 6.3 | |||||||||
| Depreciation charge for the year |
(1.8 | ) | (10.6 | ) | (12.4 | ) | ||||||
| Disposals |
— | 0.8 | 0.8 | |||||||||
| Impairments |
— | (1.4 | ) | (1.4 | ) | |||||||
| Reclassified as held for sale (Note 16) |
— | 0.4 | 0.4 | |||||||||
| Asset write-downs |
— | 1.9 | 1.9 | |||||||||
| At 31 December 2012 |
(23.0 | ) | (142.6 | ) | (165.6 | ) | ||||||
| Carrying amount: |
||||||||||||
| 31 December 2012 |
20.8 | 65.5 | 86.3 | |||||||||
| 31 December 2011 |
22.3 | 68.0 | 90.3 | |||||||||
| 31 December 2010 |
64.5 | 149.7 | 214.2 | |||||||||
Assets held in the Australian Geosynthetics business have been classified as held for sale in the year ended 31 December 2012 (see Note 16). At 31 December 2010, assets of £15.3 million relating to the Old Hickory utility plant and £0.3 million relating to land at Peine were classified as held for sale (see Note 16). Significant asset impairments and write downs in 2012 comprise a pilot line and a number of assets which have no value in use in Old Hickory, USA in Technical Fabrics and which will therefore not be transferred to the planned new warehouse and converting facility (see Note 4). In 2011, impairments were comprised primarily of obsolete equipment at the Terno d’Isola business in Technical Fabrics and equipment at the Pontypool plant which was not transferred to the Geosynthetics Maldon site as part of the integration (see Note 4).
| Capital commitments |
2012 £’m |
2011 £’m |
2010 £’m |
|||||||||
| Capital expenditure contracted for but not provided |
2.2 | 6.5 | 8.9 | |||||||||
F-183
Table of Contents
The carrying amount of the Group’s fixtures and equipment includes an amount of £0.1 million (2011: £0.4 million, 2010: £Nil) in respect of assets held under finance leases.
At 31 December 2012, the carrying amount of the Group’s fixtures and equipment includes an amount of £9.6 million (2011: £5.4 million, 2010: £7.1 million) in respect of assets in the course of construction relating to plant and machinery in France, Germany, the UK and the USA.
Where assets have been impaired, the recoverable amount has been determined by reference to its value in use, estimated using a discount rate of 10.6% (2011: 10.4%, 2010: 9%).
12. Interests in associates and joint ventures
| 2012 £’m |
2011 £’m |
2010 £’m |
||||||||||
| Cost of investment in associates and joint ventures |
— | 55.4 | 49.5 | |||||||||
| Dividends received |
— | (1.6 | ) | — | ||||||||
| Share of post-tax profits—discontinued operations |
— | 7.3 | 6.5 | |||||||||
| Disposal |
— | (61.1 | ) | — | ||||||||
| Impairment |
— | — | (0.6 | ) | ||||||||
| — | — | 55.4 | ||||||||||
| Share of results of: |
||||||||||||
| FitesaFiberweb |
— | 7.3 | 4.0 | |||||||||
|
|
|
|
|
|
|
|||||||
| Total accumulated share of results |
— | 13.8 | 6.5 | |||||||||
|
|
|
|
|
|
|
|||||||
The names and interests in major associated undertakings and joint ventures are shown in Note 32. The Group’s share of the FitesaFiberweb joint venture was disposed of on 30 December 2011 as part of the disposal of the Hygiene business.
There are no amounts relating to associates or joint ventures in the Consolidated Income Statement, Consolidated Statement of Comprehensive Income or Consolidated Balance Sheet for the year ended 31 December 2012.
Aggregate amounts relating to associates and joint ventures in the year ended 31 December:
| 2011 £’m |
2010 £’m Restated |
|||||||
| Total assets |
— | 245.3 | ||||||
|
|
|
|
|
|||||
| Total liabilities |
— | (134.5 | ) | |||||
|
|
|
|
|
|||||
| Net assets |
— | 110.8 | ||||||
| Within discontinued operations: |
||||||||
| Revenue |
196.0 | 160.6 | ||||||
| Profit after tax |
14.6 | 8.1 | ||||||
| Share of profit for the year |
7.3 | 4.0 | ||||||
| Share of capital expenditure contracted but not provided |
— | 19.1 | ||||||
13. Other investments
| 2012 £’m |
2011 £’m |
2010 £’m |
||||||||||
| Cost |
||||||||||||
| At 1 January |
— | 0.3 | 0.3 | |||||||||
| Impairment |
— | (0.3 | ) | — | ||||||||
| At 31 December |
— | — | 0.3 | |||||||||
F-184
Table of Contents
The Group’s investment in Cordustex (Pty) Limited was fully impaired during the year ended 31 December 2011. This entity is now in business rescue in South Africa.
14. Inventories
| 2012 £’m |
2011 £’m |
2010 £’m |
||||||||||
| Raw materials |
12.5 | 13.2 | 19.3 | |||||||||
| Work-in-progress |
4.1 | 5.3 | 4.1 | |||||||||
| Finished goods |
19.8 | 22.4 | 26.0 | |||||||||
| 36.4 | 40.9 | 49.4 | ||||||||||
15. Other financial assets
Trade and other receivables
| 2012 £’m |
2011 £’m |
2010 £’m |
||||||||||
| Trade receivables |
30.4 | 30.1 | 55.7 | |||||||||
| Amounts owed by related parties (Note 31) |
3.7 | 4.0 | 3.9 | |||||||||
| Other receivables, prepayments and accrued income |
10.0 | 13.4 | 16.1 | |||||||||
| Vendor Loan Note |
— | 16.7 | — | |||||||||
| Derivative financial instruments |
0.1 | — | 0.9 | |||||||||
| 44.2 | 64.2 | 76.6 | ||||||||||
As part of the proceeds for the disposal of the Hygiene business, the Group issued a one-year Vendor Loan Note to Petropar for US$26 million at a coupon rate of 6% payable on redemption. The Loan Note was due for redemption on 30 December 2012 but was repaid early on 2 August 2012 for US$25 million as full and final settlement.
Trade receivables
The average credit period granted on sales of goods is 41 days (2011: 45 days, 2010: 50 days). No interest is charged on receivables paid within their due date. Thereafter, the seller reserves the right to charge interest on the overdue outstanding balance at rates ranging from 1.5% to 4% above the bank base interest rate of the relevant jurisdiction. An allowance has been made for estimated irrecoverable amounts from the sale of goods of £3.2 million (2011: £3.1 million, 2010: £4.8 million). This allowance has been determined by reference to past default experience and taking into account the Group’s credit insurance cover existing as at 31 December 2012. The Group has no credit insurance in place for sales made post 31 December 2012. Before accepting any new customer, the Group uses an external credit scoring system to assess the potential customer’s credit quality and define credit limits by customer.
The Directors consider that the carrying amount of trade and other receivables approximates their fair value.
Amounts owed by related parties includes amounts owed by the former parent company of £3.6 million (2011: £3.6 million, 2010: £3.6 million) in respect of indemnities provided for Corporation Tax liabilities in accordance with the terms of the Demerger Agreement.
Included in the Group’s trade receivable balance are debtors with a carrying amount of £3.0 million (2011: £3.5 million, 2010: £3.4 million) which are past due at the reporting date and for which the Group has not provided as there has not been a significant change in credit quality and the amounts are still considered recoverable.
F-185
Table of Contents
Ageing of past due but not impaired receivables
| 2012 £’m |
2011 £’m |
2010 £’m |
||||||||||
| Amounts overdue by: |
||||||||||||
| Less than 30 days |
3.0 | 3.5 | 3.4 | |||||||||
| Between 30-60 days |
— | — | — | |||||||||
| Between 60-90 days |
— | — | — | |||||||||
| More than 90 days |
— | — | — | |||||||||
| 3.0 | 3.5 | 3.4 | ||||||||||
Ageing of impaired trade receivables
| 2012 £’m |
2011 £’m |
2010 £’m |
||||||||||
| Amounts overdue by: |
||||||||||||
| Less than 30 days |
1.9 | 1.1 | 2.8 | |||||||||
| Between 30—60 days |
0.2 | 0.7 | 1.0 | |||||||||
| Between 60—90 days |
0.3 | 0.4 | 0.2 | |||||||||
| More than 90 days |
0.8 | 0.9 | 0.8 | |||||||||
| 3.2 | 3.1 | 4.8 | ||||||||||
Movement in the allowance for estimated unrecoverable amounts in respect of trade receivables
| 2012 £’m |
2011 £’m |
2010 £’m |
||||||||||
| Balance at the beginning of the period |
3.1 | 4.8 | 5.1 | |||||||||
| Reduction from discontinued operations |
— | (0.5 | ) | — | ||||||||
| Impairment losses recognised |
0.1 | 0.2 | 0.7 | |||||||||
| Amounts released/written off |
— | (1.4 | ) | (1.0 | ) | |||||||
| Balance at the end of the year |
3.2 | 3.1 | 4.8 | |||||||||
Cash and cash equivalents
| 2012 £’m |
2011 £’m |
2010 £’m |
||||||||||
| Cash on hand and at bank |
14.6 | 182.3 | 26.1 | |||||||||
| Net cash and cash equivalents for cash flow purposes |
14.6 | 182.3 | 26.1 | |||||||||
Cash and cash equivalents comprise cash held by the business and short-term bank deposits with an original maturity of three months or less. The carrying amount of these assets approximates their fair value.
The carrying amounts of the Group’s cash and cash equivalents at the reporting date are denominated in the following currencies. Note that the Group operates a multi-currency cash pooling arrangement with a legal right to set off overdraft facilities against cash.
| US Dollar £’m |
Euro £’m |
Swedish Krona £’m |
Sterling £’m |
Other £’m |
Total £’m |
|||||||||||||||||||
| 31 December 2012 |
||||||||||||||||||||||||
| Cash on hand and at bank |
7.5 | 6.6 | — | 0.3 | 0.2 | 14.6 | ||||||||||||||||||
| 31 December 2011 |
||||||||||||||||||||||||
| Cash on hand and at bank |
167.4 | 14.3 | 0.1 | 0.4 | 0.1 | 182.3 | ||||||||||||||||||
| 31 December 2010 |
||||||||||||||||||||||||
| Cash on hand and at bank |
13.7 | 16.6 | 1.2 | (6.7 | ) | 1.3 | 26.1 | |||||||||||||||||
F-186
Table of Contents
Restricted cash—as at 31 December 2011, the Group held the US$260 million proceeds from the disposal of the Hygiene business on 30 December 2011. This money was held on Trust at 31 December 2011 to be used to pay down the Group’s outstanding debt under the old RCF. The cash was used to repay the outstanding drawdowns under the old RCF on 5 January 2012.
Credit risk
The Group’s principal financial assets are bank balances and cash, trade and other receivables and investments. The credit risk on liquid funds and derivative financial instruments is limited because the counterparties are banks with high credit ratings assigned by international credit rating agencies.
The Group’s credit risk is primarily attributable to its trade receivables. The amounts presented in the balance sheet are net of allowances for doubtful receivables. An allowance for impairment is made where there is an identified loss event which, based on previous experience, is evidence of a reduction of the cash flows. During the year, the Group had global credit insurance cover to mitigate the risk of a material bad debt. No credit insurance cover is held for 2013.
The Group policy provided cover up to agreed limits, subject to an aggregate deductible of €0.5 million (2011: €0.6 million, 2010: €0.6 million). Group policy requires rigorous review of the customer’s current financial health and careful management of the maximum exposure to the Group at any one time. The amount of risk accepted by the Group is subject to defined approval limits up to the Executive Directors.
The Group’s concentration of credit risk has reduced following the disposal of the Hygiene businesses, where a significant percentage of sales were to a small group of key customers.
Categories of financial assets
Details of the significant accounting policies and methods adopted, including the criteria for recognition, the basis of measurement and the basis on which income and expenses are recognised, in respect of each class of financial asset are disclosed in Note 2.
| Carrying value | ||||||||||||
| 2012 £’m |
2011 £’m |
2010 £’m |
||||||||||
| Derivative instruments in designated hedge accounting relationships |
0.1 | — | 0.9 | |||||||||
| Receivables (including cash and cash equivalents) |
59.5 | 246.5 | 116.8 | |||||||||
| 59.6 | 246.5 | 117.7 | ||||||||||
16. Disposal groups classified as held for sale
In October 2012, the Board approved the disposal of the Group’s operations in Australia and negotiations for its sale have subsequently taken place. These operations, which at the balance sheet date were expected to be sold within 12 months, have been classified as a disposal group held for sale and presented separately in the balance sheet. An impairment of £0.6 million arose on the transfer of the business to held for sale primarily in respect of allocated goodwill and acquired intangibles. As disclosed in Note 32 the disposal completed on 27 February 2013.
F-187
Table of Contents
The major classes of assets and liabilities comprising the operations classified as held for sale are as follows:
| 2012 £’m |
||||
| Inventories |
0.3 | |||
| Trade and other receivables |
0.3 | |||
| Deferred tax assets |
0.1 | |||
|
|
|
|||
| Total assets classified as held for sale |
0.7 | |||
|
|
|
|||
| Trade and other payables |
(0.2 | ) | ||
|
|
|
|||
| Total liabilities classified as held for sale |
(0.2 | ) | ||
|
|
|
|||
| Net assets of disposal group |
0.5 | |||
In 2010, assets held for sale of £15.0 million comprised £0.3 million of land at Peine, in the former Hygiene segment, and £15.3 million in respect of the Old Hickory utility plant (Technical Fabrics segment), less £0.6 million to adjust to fair value and for costs to sell. The Peine land was sold in September 2011. The utility plant at Old Hickory was sold to a third party and leased back under an operating lease in February 2011.
17. Trade and other payables
| 2012 £’m |
2011 £’m |
2010 £’m |
||||||||||
| Trade payables |
32.7 | 29.0 | 41.3 | |||||||||
| Other taxation and social security |
4.7 | 3.0 | 0.7 | |||||||||
| Accruals and deferred income |
12.3 | 18.3 | 23.2 | |||||||||
| Financial guarantee contracts (Note 32) |
— | 0.7 | 1.9 | |||||||||
| Derivative financial instruments |
— | 2.4 | 1.7 | |||||||||
| 49.7 | 53.4 | 68.8 | ||||||||||
Trade payables principally comprise amounts outstanding for trade purchases and ongoing costs. The average credit period taken for trade purchases is 64 days (2011: 52 days, 2010: 50 days). The Directors consider that the carrying amount of trade and other payables approximates their fair value.
Categories of financial liabilities
Details of the significant accounting policies and methods adopted, including the criteria for recognition, the basis of measurement and the basis on which income and expenses are recognised, in respect of each class of financial liability are disclosed in Note 2.
| Carrying value | ||||||||||||
| 2012 £’m |
2011 £’m |
2010 £’m |
||||||||||
| Derivative instruments in designated hedge accounting relationships |
— | — | 1.7 | |||||||||
| Fair value through profit and loss |
— | 2.4 | — | |||||||||
| Other financial liabilities at amortised cost |
52.3 | 217.1 | 252.1 | |||||||||
| 52.3 | 219.5 | 253.8 | ||||||||||
F-188
Table of Contents
18. Obligations under finance leases
| Minimum lease payments |
Present value of minimum lease payments |
|||||||||||||||||||||||
| 2012 £’m |
2011 £’m |
2010 £’m |
2012 £’m |
2011 £’m |
2010 £’m |
|||||||||||||||||||
| Amounts payable under finance leases: |
||||||||||||||||||||||||
| Within one year, present value of lease obligations |
0.1 | 0.3 | — | 0.1 | 0.3 | — | ||||||||||||||||||
| In the second to fifth years, present value of lease obligations |
— | 0.1 | — | — | 0.1 | — | ||||||||||||||||||
It is the Group’s policy to lease certain of its fixtures and equipment under finance leases. For the year ended 31 December 2012, the average effective borrowing rate was 8.2% (2011: 8.3%, 2010: nil%). Interest rates are fixed at the contract date or vary based on prevailing interest rates.
As at the year ended 31 December 2012, finance lease obligations denominated in GBP were £Nil (2011: £0.1 million, 2010:£Nil) and denominated in Euro were £0.1 million (2011: £0.3 million, 2010: £Nil).
The fair value of the Group’s lease obligations approximates their carrying amount.
Obligations under finance leases were secured by the lessors’ charges over the leased assets.
19. Operating lease arrangements
The Group as lessee
| 2012 £’m |
2011 £’m |
2010 £’m |
||||||||||
| Minimum lease payments under operating leases recognised as an expense in the year |
3.0 | 3.1 | 1.5 | |||||||||
At the balance sheet date, the business has outstanding commitments under non-cancellable operating leases, which fall due as follows:
| 2012 £’m |
2011 £’m |
2010 £’m |
||||||||||
| Within one year |
3.7 | 3.3 | 1.4 | |||||||||
| In the second to fifth years inclusive |
9.5 | 9.4 | 1.7 | |||||||||
| After five years |
7.5 | 9.0 | — | |||||||||
| 20.7 | 21.7 | 3.1 | ||||||||||
Operating lease payments represent amounts payable by the Group for certain of its office properties, plant and equipment. Leases are negotiated for an average term of one year for office properties, twelve years for warehouses and four years for equipment. Rentals are generally fixed or adjusted for based on inflation.
The Group as lessor
Rental income of £0.6 million was earned during the year (2011 and 2010: £Nil). At the balance sheet date, the Group had contracted with Fitesa for the following future minimum lease payments:
| 2012 £’m |
2011 £’m |
2010 £’m |
||||||||||
| Within one year |
0.3 | 0.8 | — | |||||||||
| In the second to fifth years inclusive |
— | 0.3 | — | |||||||||
| 0.3 | 1.1 | — | ||||||||||
F-189
Table of Contents
20. Bank overdrafts and loans
| 2012 £’m |
2011 £’m |
2010 £’m |
||||||||||
| Bank loans |
— | 159.9 | 177.3 | |||||||||
The borrowings are repayable as follows:
| 2012 £’m |
2011 £’m |
2010 £’m |
||||||||||
| On demand or within one year |
— | 159.9 | 7.6 | |||||||||
| In the second year |
— | — | 8.6 | |||||||||
| In the third to fifth years inclusive |
— | — | 161.1 | |||||||||
| — | 159.9 | 177.3 | ||||||||||
| Less: Amount due for settlement within one year (shown under current liabilities) |
— | (159.9 | ) | (7.6 | ) | |||||||
| Amounts due for settlement after more than one year |
— | — | 169.7 | |||||||||
At 31 December 2011, all of the Group’s borrowings under the old RCF were disclosed as due for settlement within one year as these amounts were repaid in full on 5 January 2012 following the disposal of the Hygiene business.
The fair value of the Group’s borrowings was not materially different from their carrying values.
The carrying amounts of the Group’s borrowings at the reporting date are denominated in the following currencies:
| US Dollar £’m |
Euro £’m |
Swedish Krona £’m |
Sterling £’m |
Other £’m |
Total £’m |
|||||||||||||||||||
| 31 December 2012 |
||||||||||||||||||||||||
| Bank overdrafts |
— | — | — | — | — | — | ||||||||||||||||||
| Bank loans |
— | — | — | — | — | — | ||||||||||||||||||
| — | — | — | — | — | — | |||||||||||||||||||
| 31 December 2011 |
||||||||||||||||||||||||
| Bank overdrafts |
— | — | — | — | — | — | ||||||||||||||||||
| Bank loans |
75.9 | 55.9 | 13.0 | 15.0 | 0.1 | 159.9 | ||||||||||||||||||
| 75.9 | 55.9 | 13.0 | 15.0 | 0.1 | 159.9 | |||||||||||||||||||
| 31 December 2010 |
||||||||||||||||||||||||
| Bank overdrafts |
— | — | — | — | — | — | ||||||||||||||||||
| Bank loans |
84.8 | 67.2 | 21.8 | 3.5 | — | 177.3 | ||||||||||||||||||
| 84.8 | 67.2 | 21.8 | 3.5 | — | 177.3 | |||||||||||||||||||
The average interest rates on borrowings from unrelated third parties are as follows:
| 2012 | 2011 | 2010 | ||||||||||
| United States dollar |
3.91 | % | 4.28 | % | 3.36 | % | ||||||
| Euro |
5.29 | % | 5.34 | % | 3.73 | % | ||||||
| Swedish Krona |
3.38 | % | 5.99 | % | 3.57 | % | ||||||
| Great British Pounds Sterling |
4.64 | % | 3.73 | % | 3.50 | % | ||||||
A new loan facility (the “new RCF”) was entered into in December 2012 for a term of 41/4 years until 31 March 2017 for an amount of £40 million.
F-190
Table of Contents
The previous loan facility (“the old RCF”) was entered into in February 2010 for a term of 31/2 years until July 2013 and for an amount of £200 million, comprising multi-currency facilities of €110 million and US$170 million. Following the disposal of the Hygiene business on 30 December 2011, the multi-currency facilities were reduced to €30 million and US$40 million.
The majority of borrowings are arranged at floating rates, thus exposing the Group to interest rate risk, against which, in the past, the Group has sought to protect itself through interest rate swaps (see Note 21). As the Group is currently in a net cash position, no interest rate swaps are currently held. The effective rates on borrowings during 2012 are not materially different from their nominal interest rates.
Bank overdrafts are repayable on demand. The business has secured loans of £Nil (2011: £0.2 million. 2010: £1.2 million). The new RCF is guaranteed by a number of the Group’s trading entities in respect of the parent’s liabilities. All other bank loans are unsecured, although there are some cases where parent guarantees have been issued in respect of bank loans to overseas subsidiaries.
At the year end, the Group had available £40 million (2011: $Nil, 2010: $27.8 million) of undrawn committed borrowing facilities. Following the Hygiene disposal on 30 December 2011, the amounts outstanding under the RCF were repaid on 5 January 2012 and the full facilities under the revised RCF were undrawn.
Covenants under the new RCF include an EBITDA/net debt gearing covenant of 2.5x and an interest cover covenant of 5.0x. Under the facility, covenant tests are required on a half yearly basis. Please refer to Note 33 for changes in the RCF subsequent to 31 December 2012.
During the year ended 31 December 2012, Fiberweb France set up a €5.0 million debt factoring arrangement of which €3.1 million was utilised at 31 December 2012.
At 31 December 2011, the Geosynthetics segment had a £3.5 million invoice discounting facility of which £1.1 million was utilised at 31 December 2011. Fiberweb terminated this facility during 2012 and no amounts were outstanding as at 31 December 2012.
Liquidity risk management
The Group is exposed to short-term liquidity risks if outflows exceed the funds currently available at the time. Ultimate responsibility for liquidity risk management rests with the Board of Directors. The Board, in conjunction with the Group’s treasury function, have built an appropriate liquidity risk management framework for the management of the Group’s short, medium and long-term funding and liquidity management requirements. The Group manages liquidity risk by maintaining adequate reserves under the revolving credit facility and continuously monitoring forecast and actual cash flows and ensuring adequate funds are drawn down to cover any outflows required, subject to the restrictions imposed by the Group’s banking covenants. The additional undrawn facilities that the Group has at its disposal to further reduce liquidity risk are set out above.
The following table details the Group’s expected maturity for its non-derivative financial assets. The table has been drawn up based on undiscounted contractual maturities of the financial assets.
| Within 1 year £’m |
Total £’m |
|||||||
| 31 December 2012 |
||||||||
| Non-interest bearing |
30.4 | 30.4 | ||||||
| 31 December 2011 |
||||||||
| Non-interest bearing |
46.8 | 46.8 | ||||||
| 31 December 2010 |
||||||||
| Non-interest bearing |
90.7 | 90.7 | ||||||
F-191
Table of Contents
The following table details the Group’s remaining contractual maturity for its non-derivative financial liabilities. The table has been drawn up based on undiscounted cash flows of financial liabilities and includes both interest and principal cash flows.
| Within 1 year £’m |
1-5 years £’m |
Total £’m |
||||||||||
| 31 December 2012 |
||||||||||||
| Non-interest bearing |
52.4 | — | 52.4 | |||||||||
| Finance lease liability |
0.1 | — | 0.1 | |||||||||
| 52.5 | — | 52.5 | ||||||||||
| 31 December 2011 |
||||||||||||
| Non-interest bearing |
56.1 | — | 56.1 | |||||||||
| Finance lease liability |
0.3 | 0.1 | 0.4 | |||||||||
| Variable interest rate instruments |
159.9 | — | 159.9 | |||||||||
| 216.3 | 0.1 | 216.4 | ||||||||||
| 31 December 2010 |
||||||||||||
| Non-interest bearing |
69.9 | 3.0 | 72.9 | |||||||||
| Finance lease liability |
— | — | — | |||||||||
| Variable interest rate instruments |
7.6 | 169.7 | 177.3 | |||||||||
| 77.5 | 172.7 | 250.2 | ||||||||||
The following table details the Group’s liquidity analysis for its derivative financial instruments. The table has been drawn up based on the undiscounted net cash flows on the derivative instruments that settle on a net basis and the undiscounted gross cash flows on those derivatives that require gross settlement. When the amount payable or receivable is not fixed, the amount disclosed has been determined by reference to the projected interest and foreign currency rates as illustrated by the yield curves existing at the reporting date.
| Within 1 month £’m |
Within 1-12 months £’m |
Within 2-5 years £’m |
Total £’m |
|||||||||||||
| 31 December 2012 |
||||||||||||||||
| Commodity derivatives |
— | 0.1 | — | 0.1 | ||||||||||||
| — | 0.1 | — | 0.1 | |||||||||||||
| 31 December 2011 |
||||||||||||||||
| Interest rate swaps |
— | — | (2.0 | ) | (2.0 | ) | ||||||||||
| Commodity derivatives |
(0.4 | ) | — | — | (0.4 | ) | ||||||||||
| (0.4 | ) | — | (2.0 | ) | (2.4 | ) | ||||||||||
| 31 December 2010 |
||||||||||||||||
| Interest rate swaps |
— | — | (1.7 | ) | (1.7 | ) | ||||||||||
| Commodity derivatives |
0.6 | 0.3 | — | 0.9 | ||||||||||||
| Foreign exchange forward contracts |
— | — | — | — | ||||||||||||
| 0.6 | 0.3 | (1.7 | ) | (0.8 | ) | |||||||||||
Capital risk management
The Group manages its capital to ensure that entities within the Group will be able to continue as going concerns while maximising the return to stakeholders through the optimisation of the debt and equity balance. The capital structure of the Group consists of debt which includes borrowings disclosed in this note, cash and cash equivalents and equity attributable to equity holders of the parent, comprising issued capital, reserves and retained earnings as disclosed in Notes 26 and 27. The Group reviews its capital structure regularly and as part of such review, it considers the cost of capital and the risks associated with each class of capital.
F-192
Table of Contents
Externally imposed capital requirement
Under the revolving credit facility described above, the Group is subject to the capital requirements of a gearing ratio (net debt to EBITDA) and an interest cover ratio (EBITDA to interest) which will be measured every six months on 30 June and 31 December. EBITDA is defined as underlying operating profit adjusted to exclude interest, taxation, depreciation and amortisation and certain other non-cash items. Underlying operating profit excludes significant items consider one-off in nature by management. The net debt to EBITDA requirement is for 2.5x cover. The EBITDA to interest ratio must exceed 5.0x.
The Group has remained within the limits of its facilities at all times over the life of the facilities.
The immediate impact of exchange rate fluctuations on the Group’s net debt versus the slower impact on the Group’s trading results can adversely impact the calculation of the Group’s gearing covenant at the covenant test dates. This risk is mitigated under the terms of the new RCF Agreement, which matches the exchange rates applicable for the translation of both EBITDA and net debt to the cumulative average exchange rates for the relevant period.
21. Derivative financial instruments
| 2012 Assets £’m |
2012 Liabilities £’m |
2011 Assets £’m |
2011 Liabilities £’m |
2010 Assets £’m |
2010 Liabilities £’m |
|||||||||||||||||||
| Derivatives that are designated and effective as hedging instruments carried at fair value |
||||||||||||||||||||||||
| Interest rate swaps |
— | — | — | — | — | (1.7 | ) | |||||||||||||||||
| Commodity derivatives |
0.1 | — | — | — | 0.9 | — | ||||||||||||||||||
| Financial assets carried at fair value through profit or loss (FVTPL) |
||||||||||||||||||||||||
| Held for trading derivatives that are not designated in hedge accounting relationships: |
||||||||||||||||||||||||
| Interest rate swaps |
— | — | — | (2.0 | ) | — | — | |||||||||||||||||
| Forward foreign currency contracts |
— | — | — | (0.4 | ) | — | — | |||||||||||||||||
| Note 15, 17 |
0.1 | — | — | (2.4 | ) | 0.9 | (1.7 | ) | ||||||||||||||||
The fair values of all derivative financial instruments shown in the table above are based on market values of equivalent instruments at the balance sheet date and are held as assets and liabilities within other receivables and payables. Derivative instruments are fair valued based on the estimated market valuations provided by the respective bank with which the instrument is held.
Fair value measurements recognised in the statement of financial position
The Group is required to analyse its financial instruments that are measured subsequent to initial recognition at fair value, and to classify them into Levels 1 to 3 based on the degree to which the fair value is observable:
| • | Level 1 fair value measurements are those derived from quoted prices (unadjusted) in active markets for identical assets or liabilities; |
| • | Level 2 fair value measurements are those derived from inputs other than quoted prices included within Level 1 that are observable for the asset or liability, either directly (i.e. as prices) or indirectly (i.e. derived from prices); and |
| • | Level 3 fair value measurements are those derived from valuation techniques that include inputs for the asset or liability that are not based on observable market data (unobservable inputs). |
F-193
Table of Contents
All fair value measurements of financial instruments recognised in the statement of financial position are classified as Level 2 as defined above. Note that there were no transfers between the levels during the year.
Financial risk management objectives
The Group’s corporate treasury function provides services to the business, co-ordinates access to domestic and international financial markets, and monitors and manages the financial risks relating to operations. These risks include market risk (including currency risk, fair value interest rate risk and price risk), credit risk, liquidity risk and cash flow interest rate risk.
The Group seeks to manage the effects of these risks by using derivative financial instruments to hedge these exposures. The use of financial derivatives is governed by the Group’s policies approved by the Board of Directors, which provide written principles on foreign exchange risk, interest rate risk, credit risk, the use of financial derivatives and non-derivative financial instruments, and the investment of excess liquidity. Compliance with policies and exposure limits is reviewed by the Group Finance Director on a continuous basis and periodically by internal audit. The Group does not enter into or trade financial instruments, including derivative financial instruments, for speculative purposes.
Market risk
The Group’s activities expose it primarily to the financial risks of changes in foreign currency exchange rates and interest rates. The Group enters into a variety of financial instruments to manage its exposure to interest rate and foreign currency risk, including:
| • | forward foreign exchange contracts to hedge the exchange rate risk arising in trading subsidiaries, primarily through net sales to customers and purchases from suppliers in currencies other than their domestic local currency; |
| • | interest rate swaps to mitigate the risk of rising interest rates, and |
| • | forward foreign exchange swaps to hedge the exchange rate risk arising on net balance sheet exposure around the Group. |
There has been no change to the Group’s exposure to market risks or the manner in which it manages and measures the risk.
Foreign currency risk management
The overall policy of the Group is to use borrowings in currency to manage the translational currency risk arising from assets and earnings in overseas subsidiaries. The currency profile of borrowings under the RCF broadly mirrors both the currency profile of the Group’s net assets and EBITDA. Foreign currency-denominated borrowings are largely designated as net investment hedges. Foreign exchange forwards are used to manage the net balance sheet exposure. It is the Group’s policy not to undertake speculative currency transactions.
The Group’s business is characterised by a relatively low level of cross border activity, and therefore the Group has little transactional currency exposure. Overall, the volume of transactions with a currency impact is below 10% of turnover. However, the Group’s policy is that, where significant transactional exposures exist, these exposures should be hedged with maturities not to exceed 12 months.
The Group monitors the translational foreign currency exposures of its financial assets and liabilities on a monthly basis, adapting its portfolio of loans and hedges as may be required.
F-194
Table of Contents
Changes in the fair value of foreign exchange contracts taken out to hedge transactional risk are taken to the income statement. As at 31 December 2012, the Group had committed to a notional amount of £3.9 million (2011: £18.4 million, 2010: £33.4 million) of forward contracts to buy or sell foreign currency. The fair value of such transactions was £Nil (2011: £Nil, 2010: £Nil).
The following table details the forward foreign currency contracts outstanding at the year-end:
Forward foreign exchange contracts
| Outstanding contracts: |
Average exchange rates | Foreign currency | Contract value | Fair value | ||||||||||||||||||||||||||||||||||||||||||||
| 2012 | 2011 | 2010 | 2012 | 2011 | 2010 | 2012 £’m |
2011 £’m |
2010 £’m |
2012 £’m |
2011 £’m |
2010 £’m |
|||||||||||||||||||||||||||||||||||||
| Buy EUR/sell GBP |
— | 1.20 | 1.18 | — | 4.5 | 6.5 | — | 3.7 | 5.5 | — | — | 0.1 | ||||||||||||||||||||||||||||||||||||
| Buy GBP/sell EUR |
1.23 | 1.20 | — | 4.8 | 12.0 | — | 3.9 | 9.9 | — | — | — | — | ||||||||||||||||||||||||||||||||||||
| Buy USD/sell GBP |
— | 1.57 | 1.56 | — | 7.5 | 7.5 | — | 4.8 | 4.8 | — | — | — | ||||||||||||||||||||||||||||||||||||
| Buy USD/sell RMB |
— | — | 6.58 | — | — | 10.0 | — | — | 6.4 | — | — | — | ||||||||||||||||||||||||||||||||||||
| Sell SEK/buy GBP |
— | — | — | — | — | — | — | — | — | — | — | — | ||||||||||||||||||||||||||||||||||||
| Sell EUR/buy SEK |
— | — | 8.97 | — | — | 19.5 | — | — | 16.7 | — | — | (0.1 | ) | |||||||||||||||||||||||||||||||||||
| 3.9 | 18.4 | 33.4 | — | — | — | |||||||||||||||||||||||||||||||||||||||||||
All contracts mature within 30 days of year end.
Foreign currency sensitivity analysis
The Group is mainly exposed to fluctuations in the exchange rate applicable for the US dollar and the euro. Operating profit, EBITDA and net debt are the key inputs into the Group’s gearing covenant and the exchange impacts on these variables are monitored closely.
The following table illustrates the impact on the Group’s continuing operating profit, and equity of a 10% increase and decrease in sterling against each of these currencies, assuming all other variables are unchanged. The use of a 10% variation has been chosen in light of the magnitude of recent fluctuations in both the US dollar and euro values against sterling. These values have been computed using the currency profile of the Group’s operating profit. For the restatement of the Group’s operating profit the sterling equivalents have been retranslated by flexing the cumulative average exchange rates used by the Group for the relevant periods. For the restatement of the Group’s equity, the sterling equivalents have been retranslated by flexing the actual closing exchange rates used by the Group at the period ends. The relevant cumulative average and closing exchange rates used by the Group for 2010, 2011 and 2012 are shown in the table below.
Table of exchange rates
| 2012 | 2011 | 2010 | ||||||||||
| USD: Average |
1.59 | 1.60 | 1.55 | |||||||||
| Year end |
1.63 | 1.55 | 1.57 | |||||||||
| EUR: Average |
1.23 | 1.15 | 1.17 | |||||||||
| Year end |
1.23 | 1.20 | 1.17 | |||||||||
F-195
Table of Contents
| 2012 £’m |
2011 £’m |
2010 £’m |
||||||||||
| Flexing the USD/£ cross rate |
||||||||||||
| Continuing operating profit: |
||||||||||||
| As reported |
7.6 | 9.6 | 17.3 | |||||||||
| Restated assuming a 10% increase in the USD/£ cross rate |
5.6 | 7.8 | 15.9 | |||||||||
| Restated assuming a 10% decrease in the USD/£ cross rate |
10.0 | 11.7 | 18.8 | |||||||||
| Equity: |
||||||||||||
| As reported |
174.0 | 179.7 | 178.6 | |||||||||
| Restated assuming a 10% increase in the USD/£ cross rate |
168.2 | 173.1 | 172.6 | |||||||||
| Restated assuming a 10% decrease in the USD/£ cross rate |
181.7 | 188.5 | 186.0 | |||||||||
| Flexing the Euro/£ cross rate |
||||||||||||
| Continuing operating profit: |
||||||||||||
| As reported |
7.6 | 9.6 | 17.3 | |||||||||
| Restated assuming a 10% increase in the Euro/£ cross rate |
8.2 | 9.5 | 16.5 | |||||||||
| Restated assuming a 10% decrease in the Euro/£ cross rate |
6.8 | 9.6 | 18.0 | |||||||||
| 2012 £’m |
2011 £’m |
2010 £’m |
||||||||||
| Flexing the Euro/£ cross rate |
||||||||||||
| Equity: |
||||||||||||
| As reported |
174.0 | 179.7 | 178.6 | |||||||||
| Restated assuming a 10% increase in the Euro/£ cross rate |
168.1 | 170.3 | 169.6 | |||||||||
| Restated assuming a 10% decrease in the Euro/£ cross rate |
181.8 | 191.9 | 189.3 | |||||||||
The impact of exchange rate fluctuations on the Group’s operating profit in 2010, 2011 and 2012 has not been as notable as might be expected in the face of significant movements in both the Euro and US Dollar cross rate with sterling. This is attributable to the use of a 13 month cumulative average exchange rate to convert profits, which slows the impact of spot changes in the cross rate.
Interest rate risk
The Group is predominantly exposed to interest rate fluctuations on the portion of the revolving credit facility that is not covered by hedging arrangements. The total amount drawn down under the RCF at the year end was £Nil (2011: £157.8 million, 2010: £173.7 million). The amount drawn down at 31 December 2011 was repaid in full on 5 January 2012 using the proceeds from the disposal of the Hygiene business. The Group’s policy is to use a combination of debt and derivative instruments to hedge portions of its interest rate exposure for varying periods, up to the maturity of its underlying borrowing facilities. Interest rate swaps are entered into after due consideration by the Group’s treasury function of actual base interest rates and financial market projections for future changes to those rates based on economic conditions, and such swaps must be approved by the Board of Directors in line with Group policy.
As a result of the previous RCF, the Group entered into a series of interest rate swaps for totals of US$100 million and €60 million (2010: US$100 million, Euro 60 million), spread over several banks, whereby it paid a blended average fixed rate of 1.79% for US dollar and 1.89% for Euros and received floating rate. The interest rate swaps settled on a semi-annual basis. The floating rate on the interest rate swaps was 6-month US dollar LIBOR and 6-month EURIBOR respectively. The Group settled the difference between the fixed and floating interest rate on a net basis. The interest rate swaps settlements and the interest payments on the loan occurred simultaneously and the amount deferred in equity was recognised in the profit or loss over the period that the floating rate interest payments on debt impacted profit or loss.
Following the disposal of the Hygiene business and the repayment of all amounts drawn under the RCF, the swaps were terminated during January 2012. The swaps were due to mature in 2013 and had been designated interest risk hedges. As a result of the Hygiene disposal, the underlying cash flows were no longer highly probable and the hedge relationship was broken following shareholder approval of the disposal of 6 December
F-196
Table of Contents
2011. The fair market value of the swaps at 31 December 2011 was a loss of £1.9 million (2010: a loss of £1.7 million) and this loss was recognised as part of the costs of disposal of the Hygiene business in the year ended 31 December 2011. Any additional charges recognised in the year ended 31 December 2012 on the final settlement and repayment of the swaps have been disclosed as discontinued operations (see Note 29).
The following table summarises the notional principal amounts and remaining terms of the interest rate swap contracts outstanding as at the reporting date:
Outstanding receive floating pay fixed contracts:
| Average contract fixed interest rate |
Notional principal amount |
Fair Value | ||||||||||||||||||||||||||||||||||
| 2012 % |
2011 % |
2010 % |
2012 £’m |
2011 £’m |
2010 £’m |
2012 £’m |
2011 £’m |
2010 £’m |
||||||||||||||||||||||||||||
| Maturing in 2012 |
— | 2.86 | 1.83 | — | 114.3 | 115.3 | — | (2.0 | ) | (1.7 | ) | |||||||||||||||||||||||||
Interest rate risk sensitivity analysis
The interest sensitivity analysis below is based on the assumption that changes in market interest rates affect the interest income or expense of variable interest financial instruments and that a change in market interest rates only affects interest income or expense in relation to financial instruments with fixed interest rates if these are recognised at their fair value.
Under these assumptions, if market interest rates over the course of the year were on average 1% higher or lower for all currencies in which the Group had borrowings this would increase or decrease profit before tax and equity as follows:
| 2012 £’m |
2011 £’m |
2010 £’m |
||||||||||
| Average amount drawn down under the revolving credit facility |
1.7 | 159.6 | 172.3 | |||||||||
| Average amount covered by hedging arrangements |
— | 114.7 | 112.2 | |||||||||
| Average amount exposed to interest rate fluctuations |
1.7 | 44.9 | 60.1 | |||||||||
| Effect on profit before tax and equity in the event of a 1% rise or fall in average interest rates over the period |
— | 0.4 | 0.6 | |||||||||
During the years ended 31 December 2010, 2011 and 2012, there was no notable change in the Group’s sensitivity to interest rate fluctuations as a result of the high proportion of the Group’s borrowings that are hedged by interest rate swaps, effectively restricting exposure to changes in variable relevant base interest rates. Following the disposal of the Hygiene business on 30 December 2011 and the repayment of amounts outstanding under the RCF, the Group’s interest rate exposure has been reduced significantly and the interest rate swaps were terminated during January 2012.
Commodity risks
The Group faces commodity raw material price exposure to a number of raw materials, mainly polypropylene and, to a lesser extent, polyester and polyethylene. The monthly management reporting process highlights the net impact, adverse or favourable, of fluctuations in raw material prices and this is considered by the Board. The Group prefers to manage its exposure to polypropylene and others through business arrangements with its suppliers and customers, which neutralise part of the exposure. However, the market for appropriate hedging instruments is monitored continuously by management with a view to mitigate this risk.
In December 2012, the Group took out one hedge contract for 2,400 tonnes of propylene purchases for periods between 1 January 2013 and 31 December 2013. As at 31 December 2012, no amounts were owed to or from the Group in respect of the settlement of this contract.
F-197
Table of Contents
In 2011, the Group took out three hedge contracts for 16,000 tonnes of polypropylene purchases for periods between 1 January 2011 and 31 December 2011. As at 31 December 2011, the Group owed £0.3 million in respect of the final settlement of this contract.
In July 2010, the Group took out a hedge contract for 12,000 tonnes of polypropylene purchases for the period 1 July 2010 to 31 December 2010; at 31 December 2010, the Group was owed £0.3 million in respect of the final settlement of this contract. In December 2010, the Group entered into a contract to hedge the price of 14,400 tonnes of polypropylene purchases in the period 1 January 2011 to 31 December 2011. As at 31 December 2010, the fair value of this hedge was a gain of £0.7 million, which was recognised directly in the hedge reserve within Group equity.
22. Provisions
| Restructuring provisions £’m |
||||
| At 1 January 2010 |
9.0 | |||
| Exchange gains |
0.1 | |||
| Charged in the year |
0.2 | |||
| Utilised in the year |
(1.6 | ) | ||
| At 1 January 2011 |
7.7 | |||
| Exchange gains |
(0.1 | ) | ||
| Created in the year |
9.5 | |||
| Disposed with subsidiaries |
(3.2 | ) | ||
| Released during the year |
(0.4 | ) | ||
| Utilised in the year |
(7.7 | ) | ||
| At 1 January 2012 |
5.8 | |||
| Exchange gains |
(0.1 | ) | ||
| Created in the year |
3.5 | |||
| Released during year |
(0.7 | ) | ||
| Utilised in the year |
(6.0 | ) | ||
| At 31 December 2012 |
2.5 | |||
Restructuring provisions represent costs provided in relation to obligations existing at the balance sheet date for reorganisation across the Group:
| • | Provisions include a balance of £0.6 million in respect of the closure in December 2008 of our Korma, Italy facility. |
| • | £0.4 million in respect of potential warranty claims in connection with the Group’s disposal of Bidim in June 2008. |
| • | Restructuring costs of £1.0 million related to the Group restructuring performed following the Hygiene disposal together with a £0.3 million provision in respect of the transfer of a line from a former Hygiene site. |
| • | Integration costs of £0.2 million arising following the acquisitions of Boddingtons and Tubex. |
The provision brought forward relates primarily to the Group restructuring following the Hygiene disposal (£2.7 million), with £0.6 million relating to the Geosynthetics integration, £0.2 million in respect of accrued professional fees and £0.4 million in respect of potential warranty claims in connection with the Group’s disposal
F-198
Table of Contents
of Bidim in June 2008. In addition, £0.5 million was held in respect of redundancy costs together with a balance of £1.4 million in respect of the closure of our Korma, Italy facility.
| 2012 £’m |
2011 £’m |
2010 £’m |
||||||||||
| Analysed as: |
||||||||||||
| Current liabilities |
2.5 | 5.8 | 4.7 | |||||||||
| Non-current liabilities |
— | — | 3.0 | |||||||||
| 2.5 | 5.8 | 7.7 | ||||||||||
23. Pensions and other post-retirement benefits
The Group operates a number of pension plans worldwide. The majority of these are defined contribution in nature. The normal pension cost for the continuing Group, including early retirement costs, was £1.8 million (2011: £2.5 million, 2010: £2.3 million) of which £1.3 million (2011: £2.3 million, 2010: £2.1 million) was in respect of foreign schemes. This includes £1.7 million (2011: £2.3 million, 2010: £1.6 million) relating to defined contribution schemes. The pension costs are assessed in accordance with the advice of independent qualified actuaries, where practicable, using a variety of methods and assumptions and otherwise, in respect of certain foreign schemes, in accordance with local regulations.
The Group made a one-off contribution of US$25 million (£15.5 million) to the US defined benefit pension schemes during December 2012.
The Group’s current foreign pension schemes mainly relate to defined contribution plans.
The most significant defined benefit pension plans are in North America, where the Group operates two funded pension arrangements. These plans are closed to new members and benefits are frozen. Pension costs for these plans have been calculated by independent qualified actuaries, using the projected unit method and assumptions appropriate to the arrangements in place.
The Group also operates a post-retirement benefit plan in North America which principally provides life assurance benefits for its current and future retirees. The costs of these benefits are also assessed by independent qualified actuaries using methods and assumptions appropriate under IAS 19.
In accordance with IAS 19 the latest actuarial valuations of the Group’s defined benefit pension schemes and healthcare plans have been reviewed and updated as at 31 December 2012. The following weighted average financial assumptions have been adopted:
| North America | Rest of World | |||||||||||||||||||||||
| Per annum (%) |
2012* | 2011* | 2010* | 2012* | 2011* | 2010* | ||||||||||||||||||
| Discount rate |
3.9 | 4.1 | 5.3 | 3.0 | 4.5 | 4.8 | ||||||||||||||||||
| Rate of increase to pensionable salaries |
— | — | — | 2.8 | 2.8 | 2.8 | ||||||||||||||||||
| Price inflation |
2.0 | 2.0 | 2.0 | 2.0 | 2.0 | 2.0 | ||||||||||||||||||
| Rate of increase to pensions in payment |
— | — | — | 1.0 | 1.0 | 1.8 | ||||||||||||||||||
| Rate of healthcare cost increases |
|
8% reducing to 5% over the next three years |
|
|||||||||||||||||||||
| — | — | — | — | — | ||||||||||||||||||||
| * | —restated following the adoption of amendments to IAS 19 Employee Benefits which has been applied retrospectively |
F-199
Table of Contents
Mortality assumptions
Mortality assumptions for the US plans are based on the US standard table RP2000 with allowance for future improvements in mortality allowed for in line with projections scale AA. Generational tables have been used so that the basis used to calculate liabilities in respect of future pensioners assumes lower mortality (i.e. a larger allowance for improvements) than for current pensioners. The expected future lifetimes calculated using these assumptions are summarised as follows:
| 2012 | 2011 | 2010 | ||||||||||
| Expected future lifetime of: |
||||||||||||
| —a 65 year old current male pensioner |
19.5 years | 19.4 years | 19.7 years | |||||||||
| —a 65 year old current female pensioner |
21.3 years | 21.3 years | 21.6 years | |||||||||
| —a 65 year old future female pensioner (currently aged 45) |
21.0 years | 21.0 years | 21.2 years | |||||||||
| —a 65 year old future male pensioner (currently aged 45) |
22.9 years | 22.8 years | 22.5 years | |||||||||
The key sensitivities regarding the principal assumptions used to measure the scheme liabilities relate to the discount rate and the mortality rate and are set out below:
| Assumption |
Change in assumption | Impact on scheme liabilities | ||
| Discount rate |
Increase/decrease by 0.5% | Decrease/increase by 5.9%/6.6% | ||
| Rate of mortality |
Increase by 1 year | Increase by 3% |
Since the majority of the Group’s defined benefit liabilities relate to the frozen US schemes, changes to inflation and salary assumptions do not have a material impact on the Group’s liabilities.
The fair value of the assets and liabilities of the schemes at each balance sheet date were:
| North America | Rest of World | Total | ||||||||||||||||||||||||||||||||||||||||||||||||||||||||||
| 2012* £’m |
2011* £’m |
2010* £’m |
2009* £’m |
2008* £’m |
2012* £’m |
2011* £’m |
2010* £’m |
2009* £’m |
2008* £’m |
2012* £’m |
2011* £’m |
2010* £’m |
2009* £’m |
2008* £’m |
||||||||||||||||||||||||||||||||||||||||||||||
| Assets |
||||||||||||||||||||||||||||||||||||||||||||||||||||||||||||
| Equities |
3.3 | 13.6 | 12.5 | 11.6 | 11.5 | — | — | — | — | — | 3.3 | 13.6 | 12.5 | 11.6 | 11.5 | |||||||||||||||||||||||||||||||||||||||||||||
| Government bonds |
7.0 | 6.0 | 10.0 | 13.4 | 15.9 | — | — | — | — | — | 7.0 | 6.0 | 10.0 | 13.4 | 15.9 | |||||||||||||||||||||||||||||||||||||||||||||
| Corporate bonds |
20.0 | 16.4 | 9.5 | 3.7 | 4.5 | — | — | — | — | — | 20.0 | 16.4 | 9.5 | 3.7 | 4.5 | |||||||||||||||||||||||||||||||||||||||||||||
| Other |
24.6 | 0.7 | 2.2 | 0.8 | 1.2 | 1.1 | 1.1 | 0.8 | 1.0 | 1.1 | 25.7 | 1.8 | 3.0 | 1.8 | 2.3 | |||||||||||||||||||||||||||||||||||||||||||||
|
|
|
|
|
|
|
|
|
|
|
|
|
|
|
|
|
|
|
|
|
|
|
|
|
|
|
|
|
|
|
|||||||||||||||||||||||||||||||
| Total fair value of scheme assets |
54.9 | 36.7 | 34.2 | 29.5 | 33.1 | 1.1 | 1.1 | 0.8 | 1.0 | 1.1 | 56.0 | 37.8 | 35.0 | 30.5 | 34.2 | |||||||||||||||||||||||||||||||||||||||||||||
|
|
|
|
|
|
|
|
|
|
|
|
|
|
|
|
|
|
|
|
|
|
|
|
|
|
|
|
|
|
|
|||||||||||||||||||||||||||||||
| Obligations |
||||||||||||||||||||||||||||||||||||||||||||||||||||||||||||
| Present value of funded defined benefit obligations |
(57.1) | (59.1 | ) | (50.8 | ) | (47.1 | ) | (50.9 | ) | (1.4 | ) | (1.3 | ) | (1.2 | ) | (1.1 | ) | (1.2 | ) | (58.5) | (60.4) | (52.0 | ) | (48.2 | ) | (52.1 | ) | |||||||||||||||||||||||||||||||||
| Present value of unfunded defined benefit obligations |
(1.2) | (1.4 | ) | (13.5 | ) | (11.9 | ) | (10.7 | ) | (1.8 | ) | (1.6 | ) | (5.0 | ) | (5.3 | ) | (6.9 | ) | (3.0) | (3.0) | (18.5 | ) | (17.2 | ) | (17.6 | ) | |||||||||||||||||||||||||||||||||
|
|
|
|
|
|
|
|
|
|
|
|
|
|
|
|
|
|
|
|
|
|
|
|
|
|
|
|
|
|
|
|||||||||||||||||||||||||||||||
| Total value of scheme obligations |
(58.3) | (60.5 | ) | (64.3 | ) | (59.0 | ) | (61.6 | ) | (3.2 | ) | (2.9 | ) | (6.2 | ) | (6.4 | ) | (8.1 | ) | (61.5) | (63.4) | (70.5 | ) | (65.4 | ) | (69.7 | ) | |||||||||||||||||||||||||||||||||
|
|
|
|
|
|
|
|
|
|
|
|
|
|
|
|
|
|
|
|
|
|
|
|
|
|
|
|
|
|
|
|||||||||||||||||||||||||||||||
| Liability recognised on the balance sheet date |
(3.4) | (23.8 | ) | (30.1 | ) | (29.5 | ) | (28.5 | ) | (2.1 | ) | (1.8 | ) | (5.4 | ) | (5.4 | ) | (7.0 | ) | (5.5) | (25.6) | (35.5 | ) | (34.9 | ) | (35.5 | ) | |||||||||||||||||||||||||||||||||
| * | —restated following the adoption of amendments to IAS 19 Employee Benefits which has been applied retrospectively |
The funding policy for the schemes is reviewed on a systematic basis and in consultation with an independent qualified actuary where appropriate in order to ensure that the funding contributions from sponsoring employers are appropriate to meet the liabilities of the schemes over the long term.
F-200
Table of Contents
The expected rates of return on plan assets reflect the Group’s discount rate used for each Plan.
Cash held due to the one–off contribution of US$25 million made in December 2012 will be redeployed under investment strategy to equities in the first few months of 2013.
| North America | Rest of World | Total | ||||||||||||||||||||||||||||||||||
| 2012* £’m |
2011* £’m |
2010* £’m |
2012* £’m |
2011* £’m |
2010* £’m |
2012* £’m |
2011* £’m |
2010* £’m |
||||||||||||||||||||||||||||
| Analysis of income statement charge |
||||||||||||||||||||||||||||||||||||
| Current service cost—continuing operations |
— | 0.1 | 0.2 | 0.1 | 0.1 | 0.3 | 0.1 | 0.2 | 0.5 | |||||||||||||||||||||||||||
| Current service cost—discontinued operations |
— | 0.1 | 0.1 | — | — | 0.3 | — | 0.1 | 0.4 | |||||||||||||||||||||||||||
| Interest cost—continuing operations |
2.7 | 2.9 | 3.1 | 0.1 | 0.2 | 0.1 | 2.8 | 3.1 | 3.2 | |||||||||||||||||||||||||||
| Interest cost—discontinued operations |
— | 0.2 | 0.3 | — | 0.1 | 0.1 | — | 0.3 | 0.4 | |||||||||||||||||||||||||||
| Expected return on assets—continuing operations |
(1.9 | ) | (1.9 | ) | (1.9 | ) | — | — | — | (1.9 | ) | (1.9 | ) | (1.8 | ) | |||||||||||||||||||||
| Immediate recognition of losses arising over the year—continuing operations |
— | — | — | — | — | 0.1 | — | — | 0.1 | |||||||||||||||||||||||||||
| Recognition of past service cost—continuing operations |
(0.3 | ) | (4.8 | ) | — | — | — | — | (0.3 | ) | (4.8 | ) | — | |||||||||||||||||||||||
| Recognition of past service costs—discontinued operations |
— | (1.5 | ) | — | — | — | — | — | (1.5 | ) | — | |||||||||||||||||||||||||
| Gains due to settlements and curtailments—continuing operations |
— | (0.7 | ) | — | — | — | (0.1 | ) | — | (0.7 | ) | (0.1 | ) | |||||||||||||||||||||||
| Gains due to settlements and curtailments—discontinued operations |
— | (1.3 | ) | — | — | — | — | — | (1.3 | ) | — | |||||||||||||||||||||||||
| Pension liability disposed |
— | (2.9 | ) | — | — | (3.0 | ) | — | — | (5.9 | ) | — | ||||||||||||||||||||||||
| Expense recognised in income statement—continuing operations |
0.5 | (4.4 | ) | 1.4 | 0.2 | 0.3 | 0.4 | 0.7 | (4.1 | ) | 1.9 | |||||||||||||||||||||||||
| Expense recognised in income statement—discontinued operations |
— | (5.4 | ) | 0.4 | — | (2.9 | ) | 0.4 | — | (8.3 | ) | 0.8 | ||||||||||||||||||||||||
| * | —restated following the adoption of amendments to IAS 19 Employee Benefits which has been applied retrospectively |
Current service costs in respect of trading operations have been recognised in the income statement within administrative expenses.
As part of the disposal of the Hygiene business, the Group disposed of pension and post retirement schemes in the US, Italy and Germany which are disclosed within pension liabilities disposed in the table above for the year ended 31 December 2011.
F-201
Table of Contents
Net interest payable of £0.9 million (2011: £1.2 million, 2010: £1.4 million) has been recognised within finance costs for continuing operations (see Note 5).
| North America | Rest of World | Total | ||||||||||||||||||||||||||||||||||
| 2012* £’m |
2011* £’m |
2010* £’m |
2012* £’m |
2011* £’m |
2010* £’m |
2012* £’m |
2011* £’m |
2010* £’m |
||||||||||||||||||||||||||||
| Changes to the fair value of scheme assets during the year |
||||||||||||||||||||||||||||||||||||
| Fair value of scheme assets at beginning of year |
36.7 | 34.2 | 29.5 | 1.1 | 0.8 | 1.0 | 37.8 | 35.0 | 30.5 | |||||||||||||||||||||||||||
| Expected return on assets |
1.9 | 1.9 | 1.9 | — | — | — | 1.9 | 1.9 | 1.8 | |||||||||||||||||||||||||||
| Actual employer contributions |
18.9 | 4.2 | 3.2 | 0.1 | 0.7 | 1.1 | 19.0 | 4.9 | 4.3 | |||||||||||||||||||||||||||
| Contributions by plan participants |
— | 0.3 | 0.3 | — | — | — | — | 0.3 | 0.3 | |||||||||||||||||||||||||||
| Net benefits paid out |
(3.1 | ) | (3.8 | ) | (3.9 | ) | (0.2 | ) | (0.3 | ) | (1.0 | ) | (3.3 | ) | (4.1 | ) | (4.9 | ) | ||||||||||||||||||
| Actuarial gains/(losses) on assets |
2.2 | (0.4 | ) | 2.3 | 0.1 | (0.1 | ) | — | 2.3 | (0.5 | ) | 2.4 | ||||||||||||||||||||||||
| Foreign currency exchange rate changes |
(1.8 | ) | 0.3 | 0.9 | — | — | (0.4 | ) | (1.8 | ) | 0.3 | 0.5 | ||||||||||||||||||||||||
| Settlements |
— | — | — | — | — | 0.1 | — | — | 0.1 | |||||||||||||||||||||||||||
| Other events |
0.1 | — | — | — | — | — | 0.1 | — | — | |||||||||||||||||||||||||||
| Fair value of plan assets at end of year |
54.9 | 36.7 | 34.2 | 1.1 | 1.1 | 0.8 | 56.0 | 37.8 | 35.0 | |||||||||||||||||||||||||||
| * | —restated following the adoption of amendments to IAS 19 Employee Benefits which has been applied retrospectively |
| North America | Rest of World | Total | ||||||||||||||||||||||||||||||||||
| 2012* £’m |
2011* £’m |
2010* £’m |
2012* £’m |
2011* £’m |
2010* £’m |
2012* £’m |
2011* £’m |
2010* £’m |
||||||||||||||||||||||||||||
| Changes to the defined benefit obligation during the year |
||||||||||||||||||||||||||||||||||||
| Defined benefit obligation at beginning of year |
60.1 | 64.3 | 59.0 | 2.9 | 6.2 | 6.4 | 63.0 | 70.5 | 65.4 | |||||||||||||||||||||||||||
| Current service cost |
— | 0.2 | 0.3 | 0.1 | 0.1 | 0.6 | 0.1 | 0.3 | 0.9 | |||||||||||||||||||||||||||
| Interest cost |
2.7 | 3.2 | 3.4 | 0.1 | 0.3 | 0.2 | 2.8 | 3.4 | 3.6 | |||||||||||||||||||||||||||
| Contributions by plan participants |
— | 0.7 | 0.3 | — | — | — | — | 0.7 | 0.3 | |||||||||||||||||||||||||||
| Past service cost |
— | (7.2 | ) | — | — | — | — | — | (7.2 | ) | — | |||||||||||||||||||||||||
| Actuarial losses/(gains) on scheme liabilities* |
1.2 | 8.9 | 3.3 | 0.4 | (0.2 | ) | 0.2 | 1.6 | 8.7 | 3.5 | ||||||||||||||||||||||||||
| Net benefits paid out |
(3.1 | ) | (3.8 | ) | (3.9 | ) | (0.2 | ) | (0.3 | ) | (1.0 | ) | (3.3 | ) | (4.1 | ) | (4.9 | ) | ||||||||||||||||||
| Gains due to settlements and curtailments |
— | (2.0 | ) | — | — | — | — | — | (2.0 | ) | — | |||||||||||||||||||||||||
| Past service costs not recognised |
— | (1.3 | ) | — | — | — | — | — | (1.3 | ) | — | |||||||||||||||||||||||||
| Liabilities disposed of (Note 29) |
— | (2.9 | ) | — | — | (3.0 | ) | — | — | (5.9 | ) | — | ||||||||||||||||||||||||
| Foreign currency exchange rate changes |
(2.6 | ) | 0.4 | 1.9 | (0.1 | ) | (0.2 | ) | (0.2 | ) | (2.7 | ) | 0.3 | 1.7 | ||||||||||||||||||||||
| Defined benefit obligation at end of year |
58.3 | 60.5 | 64.3 | 3.2 | 2.9 | 6.2 | 61.5 | 63.4 | 70.5 | |||||||||||||||||||||||||||
| * | Includes changes to the actuarial assumptions. |
| * | —restated following the adoption of amendments to IAS 19 Employee Benefits which has been applied retrospectively |
F-202
Table of Contents
| North America | Rest of World | Total | ||||||||||||||||||||||||||||||||||
| 2012* £’m |
2011* £’m |
2010* £’m |
2012* £’m |
2011* £’m |
2010* £’m |
2012* £’m |
2011* £’m |
2010* £’m |
||||||||||||||||||||||||||||
| Actual return on scheme assets |
4.1 | 1.6 | 4.2 | 0.1 | (0.1 | ) | — | 4.2 | 1.5 | 4.2 | ||||||||||||||||||||||||||
| Analysis of amounts recognised in the Consolidated Statement of Comprehensive Income |
||||||||||||||||||||||||||||||||||||
|
|
|
|
|
|
|
|
|
|
|
|
|
|
|
|
|
|
|
|||||||||||||||||||
| Total actuarial gains/(losses) recognised in the year |
1.0 | (9.3 | ) | (0.9 | ) | (0.3 | ) | 0.1 | (0.2 | ) | 0.7 | (9.2 | ) | (1.1 | ) | |||||||||||||||||||||
|
|
|
|
|
|
|
|
|
|
|
|
|
|
|
|
|
|
|
|||||||||||||||||||
| Total gains/(losses) in the Consolidated Statement of Comprehensive Income |
1.0 | (9.3 | ) | (0.9 | ) | (0.3 | ) | 0.1 | (0.2 | ) | 0.7 | (9.2 | ) | (1.1 | ) | |||||||||||||||||||||
|
|
|
|
|
|
|
|
|
|
|
|
|
|
|
|
|
|
|
|||||||||||||||||||
| Cumulative amount of losses recognised in the Consolidated Statement of Comprehensive Income |
(26.9) | (27.9 | ) | (18.6 | ) | (1.8 | ) | (1.6 | ) | (1.7 | ) | (29.8) | (29.5) | (20.3 | ) | |||||||||||||||||||||
| * | —restated following the adoption of amendments to IAS 19 Employee Benefits which has been applied retrospectively |
| North America | Rest of World | Total | ||||||||||||||||||||||||||||||||||||||||||||||||||||||||||
| 2012* £’m |
2011* £’m |
2010* £’m |
2009* £’m |
2008* £’m |
2012* £’m |
2011* £’m |
2010* £’m |
2009* £’m |
2008* £’m |
2012* £’m |
2011* £’m |
2010* £’m |
2009* £’m |
2008* £’m |
||||||||||||||||||||||||||||||||||||||||||||||
| History of Asset Values, Defined Benefit Obligations |
||||||||||||||||||||||||||||||||||||||||||||||||||||||||||||
| Fair value of assets |
54.9 | 36.7 | 34.2 | 29.5 | 33.1 | 1.1 | 1.1 | 0.8 | 1.0 | 1.1 | 56.0 | 37.8 | 35.0 | 30.5 | 34.2 | |||||||||||||||||||||||||||||||||||||||||||||
| Defined benefit obligations |
58.3 | 60.5 | 64.3 | 59.0 | 61.6 | 3.2 | 2.9 | 6.2 | 6.4 | 8.1 | 61.5 | 63.4 | 70.5 | 65.4 | 69.7 | |||||||||||||||||||||||||||||||||||||||||||||
| Deficit |
(3.4 | ) | (23.8 | ) | (30.1 | ) | (29.5 | ) | (28.5 | ) | (2.1 | ) | (1.8 | ) | (5.4 | ) | (5.4 | ) | (7.0 | ) | (5.5 | ) | (25.6 | ) | (35.5 | ) | (34.9 | ) | (35.5 | ) | ||||||||||||||||||||||||||||||
| Experience (losses)/gains on scheme assets |
2.2 | (0.4 | ) | 2.3 | 0.2 | (7.1 | ) | 0.1 | (0.1 | ) | — | (0.1 | ) | — | 2.3 | (0.5 | ) | 2.3 | 0.1 | (7.1 | ) | |||||||||||||||||||||||||||||||||||||||
| Experience (losses)/gains on scheme liabilities |
(0.1 | ) | 0.8 | 0.9 | (1.6 | ) | (0.1 | ) | — | 0.3 | — | 0.2 | — | (0.1 | ) | 1.1 | 0.9 | (1.4 | ) | (0.1 | ) | |||||||||||||||||||||||||||||||||||||||
| * | —restated following the adoption of amendments to IAS 19 Employee Benefits which has been applied retrospectively |
| North America £’m |
Rest of World £’m |
Total £’m |
||||||||||
| Employer contributions in 2013 are estimated to be: |
0.1 | 0.2 | 0.3 | |||||||||
F-203
Table of Contents
24. Deferred tax
| Fixed assets £’m |
Other assets £’m |
Goodwill and other intangibles £’m |
Tax losses and tax credits £’m |
Retirement benefits £’m |
Total £’m |
|||||||||||||||||||
| At 1 January 2010* |
(17.0 | ) | 3.1 | (0.6 | ) | 9.5 | 5.5 | 0.5 | ||||||||||||||||
| Credited/ (charged) in the year |
(1.7 | ) | (0.3 | ) | (0.7 | ) | 4.8 | — | 2.1 | |||||||||||||||
| Recognised directly in equity |
— | (1.4 | ) | — | — | 1.6 | 0.2 | |||||||||||||||||
| Exchange adjustments |
(0.5 | ) | — | — | 0.2 | 0.1 | (0.2 | ) | ||||||||||||||||
| At 1 January 2011* |
(19.2 | ) | 1.4 | (1.3 | ) | 14.5 | 7.2 | 2.6 | ||||||||||||||||
| (Charged)/credited in year |
(0.8 | ) | 1.2 | (0.8 | ) | 8.2 | (2.8 | ) | 5.0 | |||||||||||||||
| Recognised directly in equity |
— | (0.4 | ) | — | (0.3 | ) | 5.1 | 4.4 | ||||||||||||||||
| Arising on acquisition |
— | (0.3 | ) | (1.3 | ) | — | — | (1.6 | ) | |||||||||||||||
| Disposal of subsidiaries |
7.4 | 0.4 | (0.3 | ) | (6.6 | ) | (0.8 | ) | 0.1 | |||||||||||||||
| Exchange adjustments |
0.1 | 0.1 | — | (0.1 | ) | 0.1 | 0.2 | |||||||||||||||||
| At 1 January 2012* |
(12.5 | ) | 2.4 | (3.7 | ) | 15.7 | 8.8 | 10.7 | ||||||||||||||||
| Credited/(charged) in year |
3.7 | — | 0.3 | 4.8 | (7.7 | ) | 1.1 | |||||||||||||||||
| Recognised directly in equity |
— | — | — | — | 0.7 | 0.7 | ||||||||||||||||||
| Reclassified as held for sale |
— | — | — | (0.1 | ) | — | (0.1 | ) | ||||||||||||||||
| Exchange adjustments |
0.4 | (0.1 | ) | 0.1 | (0.4 | ) | (0.3 | ) | (0.3 | ) | ||||||||||||||
| At 31 December 2012* |
(8.4 | ) | 2.3 | (3.3 | ) | 20.0 | 1.5 | 12.1 | ||||||||||||||||
| * | —restated following the adoption of amendments to IAS 19 Employee Benefits which has been applied retrospectively |
In accordance with IAS 12, certain deferred tax assets and liabilities have been offset. The following is the analysis of the deferred tax balances (after offset) for financial reporting purposes:
| 2012* £’m |
2011* £’m |
2010* £’m |
||||||||||
| Deferred tax liabilities |
(3.4 | ) | (3.7 | ) | (15.6 | ) | ||||||
| Deferred tax assets |
15.5 | 14.4 | 18.2 | |||||||||
| 12.1 | 10.7 | 2.6 | ||||||||||
| * | —restated following the adoption of amendments to IAS 19 Employee Benefits which has been applied retrospective |
At the balance sheet date, the Group has unrecognised deferred tax assets relating to tax losses and other temporary differences of £6.3 million (2011: £4.9 million, 2010: £13.3 million) available for offset against future profits. These assets have not been recognised as the precise incidence of future profits in the relevant countries and legal entities cannot be predicted accurately at this time.
The UK deferred tax asset has been valued at the substantively enacted rate of 23%. The UK Government has announced a further Corporation Tax rate reduction to 21% in April 2014. This will reduce the value of the UK deferred tax asset when the 21% rate is substantively enacted.
At the balance sheet date, the aggregate amount of temporary differences associated with undistributed earnings of subsidiaries for which deferred tax liabilities have not been recognised was £Nil (2011: £0.1 million, 2010: £0.1 million). No liability has been recognised in respect of these differences because the Group is in a position to control the timing of the reversal of the temporary differences and it is probable that such differences will not reverse in the foreseeable future.
Temporary differences arising in connection with interests in associates and joint ventures are insignificant.
F-204
Table of Contents
25. Share-based payments
In the year ended 31 December 2012, the Group recognised a total credit, within staff costs, in relation to share-based payments under equity-settled schemes of £0.2 million (2011: £0.3 million expense, 2010: £0.4 million).
The schemes in operation during the year are as follows:
Long Term Incentive Plan (“LTIP”) The LTIP provides for the grant of free shares in the form of contingent shares.
The first award of shares under the LTIP was made on 27 November 2006, when 1,143,938 shares were granted. Further awards of 1,333,333 shares, 1,807,029 shares and 2,284,172 shares under the LTIP were made on 12 and 29 May 2008 and 26 June 2009 respectively. In 2011, awards of 2,455,434 shares and 85,000 shares were made on 3 May 2011 and 14 November 2011 respectively. In 2012, awards of 2,127,111 were made on 18 May 2012.
Shares in relation to all three of the outstanding awards will be released to participants at the end of an expected three year performance period, dependent on the extent to which the performance conditions have been satisfied. Subject to good leaver provisions, awards are forfeited if the employee leaves before the end of the vesting period.
For the 2009 and 2011 schemes, fifty per cent of the shares awarded under the grants are governed by a Total Shareholder Return (“TSR”) market based performance condition. The remaining fifty per cent is governed by an EPS performance condition. For the 2012 scheme, fifty per cent of the shares awarded under the grants are governed by a TSR market based performance condition, twenty five per cent are governed by an EPS performance condition with the remaining twenty five per cent governed by a return on operating assets condition.
The Group recognised a total credit in relation to LTIP awards of £0.2 million (2011: £0.3 million expense, 2010: £0.4 million). Awards outstanding at the end of the year were 3,803,961 (2011: 3,028,385, 2010: 4,134,342). The weighted average fair value of the LTIP awards during the period was 63.3 p per share or £2.3 million in total (2011: 71.0 p per share or £2.2 million, 2010: 55.7 p per share or £2.3 million).
The following table summarises the evolution of the Group’s LTIP awards during the period:
| Number of shares outstanding |
2008 LTIP |
2009 LTIP |
2011 LTIP |
2012 LTIP |
Total Shares |
| ||||||||||||||||
| At 1 January 2011 |
2,330,170 | 1,804,172 | — | — | 4,134,342 | |||||||||||||||||
| Adjustment for Rights Issue |
— | 414,960 | — | — | 414,960 | |||||||||||||||||
| Granted |
— | — | 2,525,434 | — | 2,525,434 | |||||||||||||||||
| Lapsed through employee turnover |
(120,408 | ) | (147,600 | ) | (30,750 | ) | — | (298,758 | ) | |||||||||||||
| Lapsed on vesting |
(2,209,762 | ) | — | — | — | (2,209,762 | ) | |||||||||||||||
| Lapsed on disposal of the Hygiene business |
— | (802,332 | ) | (735,499 | ) | — | (1,537,831 | ) | ||||||||||||||
| At 1 January 2012 |
— | 1,269,200 | 1,759,185 | — | 3,028,385 | |||||||||||||||||
| Granted |
— | — | — | 2,127,111 | 2,127,111 | |||||||||||||||||
| Lapsed through employee turnover |
— | — | (82,335 | ) | — | (82,335 | ) | |||||||||||||||
| Lapsed on vesting |
— | (1,269,200 | ) | — | — | (1,269,200 | ) | |||||||||||||||
| At 31 December 2012 |
— | — | 1,676,850 | 2,127,111 | 3,803,961 | |||||||||||||||||
F-205
Table of Contents
| £’m | £’m | £’m | £’m | £’m | ||||||||||||||||
| At 1 January 2011 |
0.4 | 0.6 | — | — | 1.0 | |||||||||||||||
| Charged to income |
— | 0.2 | 0.1 | — | 0.3 | |||||||||||||||
| Released through retained earnings on vesting |
(0.4 | ) | — | — | — | (0.4 | ) | |||||||||||||
| At 1 January 2012 |
— | 0.8 | 0.1 | — | 0.9 | |||||||||||||||
| (Credited)/charged to income |
— | (0.5 | ) | 0.2 | 0.1 | (0.2 | ) | |||||||||||||
| Released through retained earnings on vesting |
— | (0.3 | ) | — | — | (0.3 | ) | |||||||||||||
| At 31 December 2012 |
— | — | 0.3 | 0.1 | 0.4 | |||||||||||||||
The total credit for the year relating to employee share-based payment plans was £0.2 million (2011: £0.3 million expense, 2010: £0.4 million expense), all of which related to equity-settled share-based payment transactions. After deferred tax, the total credit to the income statement was £0.2 million (2011: £0.3 million charge, 2010: £0.4 million charge). The weighted average remaining contractual life of share-based payment schemes outstanding at 31 December 2012 was 1.9 years (2011: 1.6 years, 2010: 0.9 years).
Fair value assumptions
The fair value of shares awarded under the plans has been calculated using the market value of shares adjusted to take into account the TSR market based performance condition where applicable. The calculation has been performed using the stochastic pricing model. The assumptions made in performing the calculation for each award are listed below:
| 2009 LTIP |
2011 LTIP |
2011 LTIP |
2012 LTIP |
|||||||||||||
| Grant date |
26 June 2009 |
3 May 2011 |
14 November 2011 |
18 May 2012 |
||||||||||||
| Number of participants |
21 | 33 | 2 | 18 | ||||||||||||
| Performance period |
3 years | 3 years | 3 years | 3 years | ||||||||||||
| Risk free rate |
7.8 | % | 1.48 | % | 0.6 | % | 0.41 | % | ||||||||
| Stochastic model assumptions: |
||||||||||||||||
| —Share price at grant date (p) |
69.25 | 73.00 | 56.25 | 57.00 | ||||||||||||
| —Exercise price (p) |
— | — | — | — | ||||||||||||
| —Volatility |
50.0 | % | 52.1 | % | 44.2 | % | 43.3 | % | ||||||||
| —Expected dividend yield |
6.0 | % | 5.75 | % | 6.22 | % | 5.26 | % | ||||||||
| Fair value of shares: |
||||||||||||||||
| —TSR element (p) |
47.51 | 43.20 | 25.22 | 33.75 | ||||||||||||
| —EPS element (p) |
57.75 | 60.94 | 46.50 | 48.57 | ||||||||||||
| —RoOA element (p) |
— | — | — | 48.57 | ||||||||||||
Expected volatility for the grants is based on the historical volatility taking into account the expected vesting term for each grant. Awards of shares with no exercise price are not affected by the risk free rate of interest. In relation to the EPS element of the 2011 and 2012 LTIP plans, expected vesting percentages of Nil applied to both (2011: 50% for the 2011 scheme, 2010: 100%). For the 2012 scheme a 37% vesting percentage has been applied to the return on capital employed element. These vesting percentages have been calculated after taking into account expected staff retention rates and the probabilities attached to attainment of the performance condition.
The weighted average exercise price of all share-based payment schemes outstanding at December 2010, 31 December 2011 and 2012 was Nil.
F-206
Table of Contents
26. Share capital
| 2012 £’m |
2011 £’m |
2010 £’m |
||||||||||
| Authorised: 200 million ordinary shares of 5p each |
10.0 | 10.0 | 10.0 | |||||||||
| Issued and fully paid ordinary shares of 5p |
8.7 | 8.7 | 6.1 | |||||||||
| Number of shares in issue |
Number of shares |
Number of shares |
Number of shares |
|||||||||
| 2012 | 2011 | 2010 | ||||||||||
| At 1 January |
173,583,551 | 122,658,136 | 122,440,375 | |||||||||
| Issued to satisfy LTIP awards |
— | 2,226,966 | 217,761 | |||||||||
| Issued to satisfy Rights Issue |
— | 42,387,882 | — | |||||||||
| Issued on Boddingtons acquisition |
— | 4,505,512 | — | |||||||||
| Issued on Tubex acquisition |
— | 1,805,055 | — | |||||||||
| At 31 December |
173,583,551 | 173,583,551 | 122,658,136 | |||||||||
The Company has one class of ordinary shares which carry no right to fixed income.
There were no new share issues during the year ended 31 December 2012.
217,761 shares were issued on 8 March 2010 to satisfy the 2006 LTIP awards which vested in part satisfaction of the EPS target to which the awards were subject.
On 10 January 2011, the Company issued 4,505,512 ordinary shares as part of the consideration for the acquisition of the Boddingtons International Limited (see Note 29).
On 2 March 2011, the Company announced a Rights Issue which provided shareholders with the right to acquire one additional ordinary share at an issue price of 60p for every three ordinary shares held on 2 March 2011. The Rights Issue resulted in the issue of an additional 42,387,882 ordinary shares on 18 March 2011 and raised net proceeds of £23.8 million, consisting of gross proceeds of £25.4 million net of issue costs of £1.6 million.
On 19 May 2011, the Company issued 1,805,055 ordinary shares as part of the consideration for the acquisition of Tubex Limited (see Note 29).
On 3 June 2011, the Company issued 2,226,966 ordinary shares to satisfy LTIP awards granted in 2008 vesting under the rules of the LTIP.
27. Movements on reserves
On demerger in November 2006, former parent company, BBA Aviation plc (“BBA”) waived loans owed to it by Fiberweb entities totalling £90.0 million and creating distributable reserves in Fiberweb plc. BBA also converted £87.4 million of debt to equity in Fiberweb.
The merger reserve comprises the excess between the nominal value of the shares issued in consideration of the transfer of subsidiaries and the book value of those subsidiary investments transferred.
The other reserve comprises adjustments in respect of the Group reorganisation which took place as part of the demerger. This reserve primarily represents the difference between the capital structure of the Fiberweb entities that were owned directly by BBA prior to the demerger and the capital structure of Fiberweb and its subsidiaries after completion of the demerger restructuring. This reserve is not distributable.
The capital reserve represents amounts accrued in respect of the cost of equity-settled share options in accordance with IFRS 2 “Share-based Payments” (see Note 25).
F-207
Table of Contents
The hedging reserve represents unrealised gains or losses on hedge instruments.
The translation reserve represents the gains or losses on translation of the Group’s overseas subsidiaries.
28. Cash flow from operating activities
| 2012 £’m |
2011 £’m |
2010 £’m |
||||||||||
| Profit from operations before tax |
5.9 | 22.4 | 19.1 | |||||||||
| Depreciation of property, plant and equipment (Note 11) |
12.4 | 26.6 | 25.7 | |||||||||
| Amortisation of intangible assets (Note 10) |
1.0 | 1.2 | 0.4 | |||||||||
| Loss on sale of property, plant and equipment |
0.3 | 0.9 | (0.5 | ) | ||||||||
| (Decrease)/increase in provisions |
(8.6 | ) | 1.2 | (1.6 | ) | |||||||
| Excess of pension scheme contributions over charge |
(19.2 | ) | (4.8 | ) | (3.0 | ) | ||||||
| Share-based payments (Note 25) |
(0.2 | ) | 0.2 | 0.4 | ||||||||
| Loss/(profit) on disposal of Hygiene business (Note 29) |
1.5 | (8.9 | ) | — | ||||||||
| Non-cash impairment and asset write-downs (Note 10 and 11) |
2.7 | 5.1 | 1.7 | |||||||||
| Non-cash impairment of held for sale assets (Note 16) |
0.6 | — | — | |||||||||
| Profit on sale of previously impaired equipment |
(0.2 | ) | (2.6 | ) | — | |||||||
| Pension curtailment and past service cost gains (Note 23) |
— | (8.4 | ) | — | ||||||||
| Other non-cash items |
(0.5 | ) | 0.8 | 0.1 | ||||||||
| Operating cash flows before movement in working capital |
(4.3 | ) | 33.7 | 42.3 | ||||||||
| Decrease/(increase) in inventories |
2.6 | (4.4 | ) | 0.1 | ||||||||
| Decrease/(increase) in receivables |
2.3 | (19.9 | ) | (8.9 | ) | |||||||
| Increase/(decrease) in payables |
5.2 | 14.5 | 4.5 | |||||||||
| Cash generated by operations |
5.8 | 23.9 | 38.0 | |||||||||
| Income taxes paid |
(3.2 | ) | (3.4 | ) | (0.3 | ) | ||||||
| Net cash from operating activities |
2.6 | 20.5 | 37.7 | |||||||||
29. Acquisitions and disposals
Year ended 31 December 2012
There were no acquisitions in the year ended 31 December 2012. No changes were made to the acquisition accounting recognised in prior years.
Year ended 31 December 2011
The Group acquired 100% of the issued share capital of Boddingtons International Limited, a leading specialist geosynthetic and accessory manufacturer, the parent company of the Boddingtons Group of Companies, on 6 January 2011 for approximately £8.2 million total consideration consisting of £4.6 million in cash and 4,505,512 Fiberweb shares. At acquisition, the Boddingtons Group had net debt of £0.9 million. Boddingtons has been integrated into the Group’s Geosynthetics segment. The business has been renamed Fiberweb Geosynthetics.
The consolidated Fiberweb results for the year would not have been significantly different had Boddingtons been acquired on 1 January 2011.
The Group acquired 100% of the issued share capital of Tubex Limited, the largest European specialist producer of tree shelters, the parent company of the Tubex group of companies, on 17 May 2011 for approximately £5.1 million total consideration consisting of £3.85 million in cash and 1,805,055 Fiberweb shares. At acquisition, Tubex had net debt of £0.1 million. Tubex has been integrated into the Group’s Geosynthetics segment.
F-208
Table of Contents
The Group’s sales would have been £4.4 million higher and operating profit would have been £0.9 million higher had Tubex been acquired on 1 January 2011.
No changes were made to the provisional fair values disclosed at 31 December 2011. Adjustments are made to the assets acquired and liabilities assumed during the allocation period to the extent that further information and knowledge come to light that more accurately reflect conditions at the acquisition date. The adjustments made have impacted assets acquired to reflect more accurately the estimated realisable or settlement value. Similarly adjustments have been made to acquired liabilities to record onerous commitments or other commitments existing at the acquisition date but not recognised by the acquire. Adjustments have also been made to reflect the associated tax effects.
The consideration paid in respect of the acquisitions comprises amounts paid on completion, including the issue of Fiberweb shares. The fair value of the shares issued as consideration was the market value at the date of the acquisition.
Transaction costs and expenses such as professional fees are charged to the income statement within administrative expenses.
Based on the initial estimate of the fair value of the assets and liabilities for Boddingtons and Tubex at the date of acquisition, the Group has recognised goodwill of £3.5 million in respect of Boddingtons and £2.5 million in respect of Tubex. The acquisitions provide opportunities for further development of the Group’s activities and create enhanced returns. This goodwill cannot be allocated to identifiable assets and liabilities and reflects:
| • | The assembled workforce. |
| • | The benefits of synergies and economies of scale resulting from the integration with existing Fiberweb businesses. Significant synergies will arise from the integration of Boddingtons with Terram and with Acorn and Tubex in the UK. |
None of the goodwill recognised is expected to be deductible for Income Tax purposes.
F-209
Table of Contents
A summary of the effect of the acquisitions is detailed below:
| Book value at acquisition £’m |
Provisional fair value adjustments £’m |
Fair value of assets acquired £’m |
||||||||||
| Intangible assets |
0.3 | 4.7 | 5.0 | |||||||||
| Property, plant and equipment |
2.9 | 0.7 | 3.6 | |||||||||
| Inventories |
2.2 | — | 2.2 | |||||||||
| Trade and other receivables |
4.7 | — | 4.7 | |||||||||
| Trade and other payables |
(4.3 | ) | (0.2 | ) | (4.5 | ) | ||||||
| Bank loans and overdrafts |
(1.1 | ) | — | (1.1 | ) | |||||||
| Finance leases |
(0.7 | ) | — | (0.7 | ) | |||||||
| Cash |
0.8 | — | 0.8 | |||||||||
| Provisions for liabilities and charges |
(0.1 | ) | (0.4 | ) | (0.5 | ) | ||||||
| Tax and deferred tax |
(0.7 | ) | (1.5 | ) | (2.2 | ) | ||||||
| 4.0 | 3.3 | 7.3 | ||||||||||
| Goodwill |
6.0 | |||||||||||
| Consideration |
13.3 | |||||||||||
| Satisfied by: |
||||||||||||
| Cash consideration |
8.4 | |||||||||||
| Shares |
4.9 | |||||||||||
| Net debt acquired |
1.0 | |||||||||||
| Transaction costs and expenses |
0.4 | |||||||||||
|
|
|
|
|
|
|
|||||||
| Total expected spend in respect of current year acquisitions |
14.7 | |||||||||||
|
|
|
|
|
|
|
|||||||
| The net cash outflow in the year in respect of acquisition comprised: |
||||||||||||
| Cash consideration |
8.4 | |||||||||||
| Net debt acquired |
1.0 | |||||||||||
| Net cash outflow in respect of acquisitions |
9.4 | |||||||||||
| Acquisition related costs |
0.4 | |||||||||||
|
|
|
|
|
|
|
|||||||
| Total cash outflow in respect of acquisitions |
9.8 | |||||||||||
|
|
|
|
|
|
|
|||||||
The fair value of the financial assets includes receivables with a fair value of £4.7 million and a gross contractual value of £4.9 million. The best estimate at acquisition date of the contractual cash flows not to be collected was £0.2 million.
The acquired businesses contributed £19.4 million to the Group’s sales and increased the Group’s profit before interest and tax for the period ended 31 December 2011 by £0.9 million.
Disposal of the Hygiene business
On 30 December 2011, the Group disposed of the Hygiene business following the transfer of control to Petropar SA. The business disposed differed from the previously disclosed Hygiene segment as the disposal excluded the Dryer Sheet business in the USA, the Terno d’Isola plant in Italy, the Biesheim plant in France and the Coronor business in Germany.
F-210
Table of Contents
The net assets of the Hygiene business at the date of disposal were as follows:
| £’m | ||||
| Intangible assets |
1.6 | |||
| Property, plant and equipment |
116.4 | |||
| Investment in associate |
61.8 | |||
| Inventories |
15.0 | |||
| Trade and other receivables |
38.9 | |||
| Amounts owed by Fiberweb Group |
1.3 | |||
| Cash and cash equivalents |
3.1 | |||
| Trade and other payables |
(23.6 | ) | ||
| Current and deferred tax liabilities |
(6.2 | ) | ||
| Retirement benefit obligations |
(5.9 | ) | ||
| Provisions for liabilities and charges |
(3.2 | ) | ||
| Sub-total |
199.2 | |||
| Cumulative translation reserve |
(32.9 | ) | ||
| Net assets |
166.3 | |||
| Profit on disposal |
1.5 | |||
|
|
|
|||
| Total consideration |
167.8 | |||
|
|
|
|||
| Satisfied by: |
||||
| Cash consideration |
167.3 | |||
| Cash disposal costs |
(3.0 | ) | ||
| 164.3 | ||||
| Vendor Loan Note |
16.7 | |||
| Non-cash disposal costs |
(2.3 | ) | ||
| Deferred cash disposal costs |
(3.5 | ) | ||
| Non-cash tax on profit on disposal |
(7.4 | ) | ||
| 167.8 | ||||
| Net cash inflow arising on disposal: |
||||
| Cash consideration received less disposal costs |
164.3 | |||
| Less cash and cash equivalents disposed |
(3.1 | ) | ||
| 161.2 | ||||
The results of the discontinued operations, which have been included in the consolidated Income Statement, are as follows:
| 2012 £’m |
2011 £’m |
2010 £’m |
||||||||||
| Revenue |
— | 210.8 | 194.0 | |||||||||
| Expenses |
— | (198.6 | ) | (188.8 | ) | |||||||
| Underlying operating profit |
— | 12.2 | 5.2 | |||||||||
| Finance costs |
— | (0.5 | ) | (0.6 | ) | |||||||
| Profit before tax |
(0.5 | ) | 11.7 | 4.6 | ||||||||
| Tax on the above |
— | (1.4 | ) | 0.2 | ||||||||
| Gain on disposal of discontinued operations |
0.4 | 1.5 | — | |||||||||
| —before tax |
(1.5 | ) | 8.9 | — | ||||||||
| —tax |
1.9 | (7.4 | ) | — | ||||||||
| Net (loss)/profit attributable to discontinued operations (attributable to the owners of the company) |
(0.1 | ) | 11.8 | 4.8 | ||||||||
During the year ended 31 December 2012, the amounts included within discontinued operations include:
| • | Additional proceeds of £0.5 million resulting from the finalisation of the Completion Accounts process. |
F-211
Table of Contents
| • | As part of the proceeds for the disposal of the Hygiene business, the Group issued a one-year Vendor Loan Note to Petropar for US$26 million at a coupon rate of 6% payable on redemption on 30 December 2012. This was repaid early on 2 August 2012 for US$25 million as full and final settlement. The US$1 million (£0.6 million) discount on settlement has been recorded within discontinued operations. |
| • | An adjustment to the tax charge arising on the disposal of £1.9 million. |
| • | Finance costs and related foreign exchange losses arising on the final repayment of the RCF drawdowns and related swaps of £1.0 million. |
| • | Additional costs of £0.5 million relating to the disposed operations. |
During the year ended 31 December 2011, the Hygiene business contributed £19.9 million to the Group’s net operating cash flows, paid £5.2 million in respect of investing activities and paid £Nil in respect of financing activities.
A loss of £1.5 million arose on the disposal in the year ended 31 December 2011, being the proceeds of disposal less the carrying amount of the businesses’ net assets plus disposal costs following the finalisation of the completion accounts process and various tax changes as outlined above. The proceeds of disposal consisted of US$260 million in cash and a US$26 million one-year Vendor Loan Note. The 2012 adjustments increased the overall gain on disposal by £0.4 million to £1.9 million.
Disposal costs to date, and included in the 2011 profit on disposal, included various finance costs directly related to the disposal which consist of:
| • | Write down of prepaid facility fees of £1.8 million to reflect the reduced RCF following the Hygiene disposal. |
| • | Break fees and related costs of £0.1 million incurred on the early repayment of the RCF drawdowns with the proceeds of the Hygiene disposal. |
| • | Interest rate swap hedge ineffectiveness of £1.2 million arising as a result of cashflows from the underlying RCF drawdowns ceasing to be probable as a result of the disposal of the Hygiene business. |
| • | Offset by a credit of £0.8 million in respect of the immediate recognition of past service costs on the post retirement medical benefit scheme as a result of the disposal. |
30. Contingent liabilities
The Fiberweb business is party to legal proceedings and claims which arise in the normal course of business, including specific product liability and environmental claims in Fiberweb North America. Any liabilities are likely to be mitigated by legal defences, insurance, reserves and third party indemnities.
The Directors do not currently anticipate that the outcome of the proceedings and claims set out above either individually, or in aggregate, will have a material adverse effect upon Fiberweb’s financial position.
31. Related party transactions
Transactions between Fiberweb and its subsidiaries, which are related parties, have been eliminated on consolidation and are not disclosed in this note. Details of transactions between Fiberweb and other related parties are detailed below.
F-212
Table of Contents
Compensation of key management personnel
The remuneration of Directors and other members of key management personnel of the Group is set out below in aggregate.
| 2012 £’m |
2011 £’m |
2019 £’m |
||||||||||
| Short-term benefits |
1.3 | 2.4 | 2.6 | |||||||||
| Post-employment benefits |
0.2 | 0.2 | 0.1 | |||||||||
| Termination benefits |
0.3 | 0.9 | — | |||||||||
| Share-based payments |
(0.1 | ) | 0.2 | 0.3 | ||||||||
| 1.7 | 3.7 | 3.0 | ||||||||||
Amounts included in the above expense that are outstanding at 31 December 2012 are £Nil (2011: £0.9 million, 2010: £0.3 million).
Transactions with associates and joint ventures
Terram Geosynthetics Private Limited
As at 31 December 2012, the Group held a 26% interest in Terram Geosynthetics Private Limited (“Terram India”).
In 2012, the Group made purchases of £1.0 million from Terram India and received income of £0.1 million in respect of cross charges. The Group has a balance due from Terram India at the year end of £0.1 million (2011: £Nil, 2010: £Nil) included within trade and other receivables.
FitesaFiberweb joint venture
FitesaFiberweb was formed on 31 July 2009. It was subsequently disposed on 30 December 2011 as part of the disposal of the Hygiene business. In accordance with a Transition of Services Agreement signed on completion, during 2011 the Group continued to provide certain administrative support services for FitesaFiberweb, primarily in connection with IT and human resource support. The Group also provided Research & Development services for the joint venture. Administrative support services were charged at cost plus an appropriate mark-up, based on either time spent or volume of transactions processed. R&D fees were charged at an agreed rate per volume of product sold.
For the year ended 31 December 2012, FitesaFiberweb was not at any point deemed to be a related party. Therefore transactions between the Group and FitesaFiberweb in 2012 have not been provided in this note.
| 2011 £’m |
2010 £’m |
|||||||
| Amounts included in Other Operating Income (Note 4): |
||||||||
| Transition services provided (administrative & IT support) |
0.9 | 0.9 | ||||||
| Research and development fees |
0.4 | 0.4 | ||||||
| 1.3 | 1.3 | |||||||
| Amounts included in Other Receivables (Note 15) |
0.4 | 0.3 | ||||||
The amounts outstanding at 31 December 2011 were unsecured and were settled in cash. As part of the FitestaFiberweb joint venture’s financing arrangements, the Group provided a guarantee for a loan of £24.9 million. This guarantee was released following the disposal of the Hygiene business. During the year ended 31 December 2012, the Group received a fee for this guarantee of £0.1 million (2011: £0.2 million, 2010: £0.1 million).
F-213
Table of Contents
No provisions have been made for doubtful debts in respect of the amounts owed by related parties.
Other related party transactions
| 2012 £’m |
2011 £’m |
2010 £’m |
||||||||||
| Net amounts owed by BBA—tax indemnity (see Note 15) |
3.6 | 3.6 | 3.6 | |||||||||
32. Subsidiary and associated undertakings
The following is a list of the principal subsidiary and associated undertakings of the Group as at 31 December 2012, each of which is wholly-owned unless otherwise stated.
| Name |
Country of | |||||
| Subsidiaries |
||||||
| Fiberweb Technical Fabrics (Shanghai) Company Limited |
China | |||||
| Fiberweb (Tianjin) Speciality Nonwovens Company Limited |
China | |||||
| Fiberweb France SAS |
France | |||||
| Fiberweb Geosynthetiques SARL |
France | |||||
| Fiberweb Holding Deutschland GmbH |
Germany | |||||
| Fiberweb Berlin GmbH |
Germany | |||||
| Fiberweb Aschersleben GmbH |
Germany | |||||
| Fiberweb Geo GmbH |
Germany | |||||
| Fiberweb Asia Pacific Limited |
Hong Kong | |||||
| Fiberweb Italia SpA |
Italy | |||||
| Korma SpA |
Italy | |||||
| Fiberweb Terno d’Isola Srl |
Italy | |||||
| Fiberweb Holdings Limited |
UK | |||||
| Fiberweb US Holdings Limited |
UK | |||||
| Terram Limited |
UK | |||||
| Fiberweb Geosynthetics Limited |
UK | |||||
| Fiberweb Joint Venture 1 Limited |
UK | |||||
| Fiberweb Joint Venture 2 Limited |
UK | |||||
| Fiberweb Brazil Limited |
UK | |||||
| Fiberweb Washougal, Incorporated |
USA | |||||
| Fiberweb, Incorporated |
USA | |||||
| Fiberweb Industrial Textiles Corporation |
USA | |||||
| Fiberweb USA Holdings, Incorporated |
USA | |||||
| Associates and other investments | % interest | |||||
| Cordustex (Pty) Limited |
10 | South Africa | ||||
| Terram Geosynthetics Private Limited |
26 | India | ||||
33. Subsequent events
The disposal of the Resin Bond line in Terno d’Isola, Italy to Fitesa Italy Srl was announced in January 2013 and took place in mid 2013. Accordingly, no amounts have been provided in these Financial Statements for the closure costs of the site and related redundancies which are expected to be in the range of £1.5–2.0 million.
F-214
Table of Contents
On 27 February 2013 the Group completed the disposal of its Australian Geosynthetics subsidiary, Fiberweb Melbourne Pty Ltd, to Tapex Pty Ltd for a consideration of AU$1.125 million (£0.7 million), which is subject to a completion accounts adjustment.
Fiberweb completed the acquisition of an additional 39% of Terram Geosynthetics Private Limited (“TGPL”) on 12 July 2013 for £2.0 million, increasing its stake from 26% to 65%. The investment will enable expansion at TGPL, including the addition of value-added geocomposite manufacturing capability. On completion, Fiberweb will consolidate around £2.5 million of debt associated with TGPL.
The Finance Act 2012, which provides for a reduction in the main rate of UK corporation tax from 24% to 23% effective from 1 April 2013, was substantively enacted on 3 July 2012. This rate reduction has been reflected in the calculation of UK deferred tax at the balance sheet date.
The UK corporation tax rate reduction to 21% from 1 April 2014 and 20% from 1 April 2015 was substantively enacted by the UK Government in July 2013. As these rate reductions were not substantively enacted at 31 December 2012, the rate reductions are not yet reflected in these financial statements in accordance with IAS 10 Events after the reporting period, as they are non-adjusting events occurring after the reporting period and therefore deferred tax assets held in respect of the UK entities have been valued at 23%.
We estimate that the future rate changes would reduce the UK deferred tax asset recognised at 31 December 2012 from £5.5 million to £5.0 million.
On 15 November 2013, Fiberweb plc was acquired by PGI Acquisition Limited, a subsidiary of Polymer Group, Inc (“PGI”). Fiberweb plc subsequently re-registered as Fiberweb Limited. This transaction impacts a number of the amounts shown in the financial statements. In particular:
| • | Awards made under the Long Term Incentive Plan vested as a result of the change of control. The assumptions in these financial statements were based on normal assumptions with vesting over a three year period. As a result of the early vesting on the change of control, an additional IFRS 2 charge of £0.9 million was incurred. |
| • | 2,999,236 shares were issued on 14 November 2013 to satisfy the awards vesting under the Long Term Incentive Plan as a result of the change of control. |
| • | As a result of the change of control, the Revolving Credit Facility was cancelled and repaid on 29 November 2013. |
| • | A number of adviser fees that were contingent on a successful transaction completion vested resulting in additional deal related costs of £2.5 million which are not reflected in these financial statements. |
| • | The change of control will impact the amount of tax losses carried forward in a number of jurisdictions. The change of control may restrict the ability to utilise some of the UK tax losses. As this will depend on future actions, the impact on the deferred tax asset recognised on UK losses in these financial statements cannot yet be quantified. |
| • | A post transaction integration programme has commenced. The actions and financial impact of this programme are not yet known although the closure of the Richmond office has been announced. It is too early to quantify the costs related to this integration programme. |
F-215
Table of Contents
Fiberweb Limited
CONDENSED CONSOLIDATED INCOME STATEMENT (unaudited)
Nine months ended 30 September
| Nine months ended 30 September 2013 |
Nine months ended 30 September 2012 |
|||||||||||
| Note | Total £’m |
Total £’m |
||||||||||
| Continuing Operations |
||||||||||||
| Revenue |
3 | 220.3 | 229.3 | |||||||||
| Cost of sales |
(173.4 | ) | (180.9 | ) | ||||||||
|
|
|
|
|
|||||||||
| Gross profit |
46.9 | 48.4 | ||||||||||
| Distribution costs |
(22.1 | ) | (22.8 | ) | ||||||||
| Administrative expenses |
(40.6 | ) | (18.4 | ) | ||||||||
| Other operating income |
4 | 2.3 | 2.0 | |||||||||
| Restructuring costs |
5 | (3.7 | ) | (3.4 | ) | |||||||
|
|
|
|
|
|||||||||
| Operating (loss)/ profit from continuing operations |
3 | (17.2 | ) | 5.8 | ||||||||
| Investment income |
— | 0.6 | ||||||||||
| Finance cost |
(0.7 | ) | (1.8 | ) | ||||||||
|
|
|
|
|
|||||||||
| Net finance expense |
6 | (0.7 | ) | (1.2 | ) | |||||||
|
|
|
|
|
|||||||||
| (Loss)/profit before tax |
(17.9 | ) | 4.6 | |||||||||
| Income tax on operations |
7 | (2.8 | ) | (2.2 | ) | |||||||
|
|
|
|
|
|||||||||
| (Loss)/ profit for the period from continuing operations |
(20.7 | ) | 2.4 | |||||||||
|
|
|
|
|
|||||||||
| Loss for the period from discontinued operations |
15 | — | (0.1 | ) | ||||||||
|
|
|
|
|
|||||||||
| Net (loss)/profit for the period |
(20.7 | ) | 2.3 | |||||||||
| Attributable to: |
||||||||||||
| Equity holders of the parent |
(20.6 | ) | 2.3 | |||||||||
| Non-controlling interest |
(0.1 | ) | — | |||||||||
|
|
|
|
|
|||||||||
| (20.7 | ) | 2.3 | ||||||||||
|
|
|
|
|
|||||||||
| (Loss)/Earnings per share, attributable to the ordinary equity holders of the parent |
||||||||||||
| Continuing operations |
||||||||||||
| Basic |
9 | (11.9 | )p | 1.4p | ||||||||
| Diluted |
9 | (11.9 | )p | 1.4p | ||||||||
|
|
|
|
|
|||||||||
| From continuing operations and discontinued operations |
||||||||||||
| Basic |
9 | (11.9 | )p | 1.3p | ||||||||
| Diluted |
9 | (11.9 | )p | 1.3p | ||||||||
|
|
|
|
|
|||||||||
F-216
Table of Contents
CONDENSED CONSOLIDATED STATEMENT OF COMPREHENSIVE INCOME (unaudited)
Nine months ended 30 September
| Nine months ended | ||||||||
| 30 September 2013 £’m |
30 September 2012 £’m |
|||||||
| Net (loss)/profit for the period |
(20.7 | ) | 2.4 | |||||
| Items that will not be reclassified subsequently to profit or loss: |
||||||||
| Actuarial gains on defined benefit pension schemes |
1.3 | 1.6 | ||||||
| Tax on items recognised directly in equity |
(0.4 | ) | (0.1 | ) | ||||
| Items that may be reclassified subsequently to profit or loss: |
||||||||
| Exchange differences on translation of foreign operations |
1.5 | (6.5 | ) | |||||
| Cash flow hedges: |
||||||||
| —Gains arising during the period |
0.1 | — | ||||||
| —Less: reclassification adjustments for gains included in profit |
(0.1 | ) | — | |||||
|
|
|
|
|
|||||
| Total comprehensive expense for the period |
(18.3 | ) | (2.7 | ) | ||||
|
|
|
|
|
|||||
| Attributable to: |
||||||||
| Equity holders of the parent |
(18.2 | ) | (2.7 | ) | ||||
| Non-controlling interest |
(0.1 | ) | — | |||||
F-217
Table of Contents
CONDENSED CONSOLIDATED BALANCE SHEET (unaudited)
As at 30 September
| Note | 30 September 2013 £’m |
31 December 2012* £’m |
||||||||||
| Non-current assets |
||||||||||||
| Intangible assets: |
||||||||||||
| Goodwill |
11 | 19.4 | 39.0 | |||||||||
| Other intangible assets |
10 | 8.2 | 6.0 | |||||||||
| Property, plant and equipment |
10 | 88.3 | 86.3 | |||||||||
| Deferred tax assets |
9.8 | 15.5 | ||||||||||
|
|
|
|
|
|||||||||
| 125.7 | 146.8 | |||||||||||
| Current assets |
||||||||||||
| Inventories |
44.4 | 36.4 | ||||||||||
| Trade and other receivables |
43.0 | 44.2 | ||||||||||
| Cash and cash equivalents |
9.1 | 14.6 | ||||||||||
| Assets held for sale |
— | 0.7 | ||||||||||
|
|
|
|
|
|||||||||
| 96.5 | 95.9 | |||||||||||
|
|
|
|
|
|||||||||
| TOTAL ASSETS |
222.2 | 242.7 | ||||||||||
|
|
|
|
|
|||||||||
| Current liabilities |
||||||||||||
| Trade and other payables |
(48.5 | ) | (49.7 | ) | ||||||||
| Tax liabilities |
(6.5 | ) | (7.3 | ) | ||||||||
| Obligations under finance leases |
— | (0.1 | ) | |||||||||
| Bank overdrafts and loans |
12 | (3.3 | ) | — | ||||||||
| Provisions |
(4.7 | ) | (2.5 | ) | ||||||||
| Liabilities classified as held for sale |
— | (0.2 | ) | |||||||||
|
|
|
|
|
|||||||||
| (63.0 | ) | (59.8 | ) | |||||||||
|
|
|
|
|
|||||||||
| Net current assets |
33.5 | 36.1 | ||||||||||
|
|
|
|
|
|||||||||
| Non-current liabilities |
||||||||||||
| Bank loans |
12 | (2.1 | ) | — | ||||||||
| Retirement benefit obligations |
(4.9 | ) | (5.5 | ) | ||||||||
| Deferred tax liabilities |
(1.5 | ) | (3.4 | ) | ||||||||
|
|
|
|
|
|||||||||
| (8.5 | ) | (8.9 | ) | |||||||||
|
|
|
|
|
|||||||||
| TOTAL LIABILITIES |
(71.5 | ) | (68.7 | ) | ||||||||
|
|
|
|
|
|||||||||
| NET ASSETS |
150.7 | 174.0 | ||||||||||
|
|
|
|
|
|||||||||
| Equity |
||||||||||||
| Share capital |
8.7 | 8.7 | ||||||||||
| Share premium account |
110.8 | 110.8 | ||||||||||
| Merger reserve |
93.5 | 93.5 | ||||||||||
| Other reserve |
93.1 | 93.1 | ||||||||||
| Capital reserve |
0.5 | 0.3 | ||||||||||
| Translation reserve |
5.1 | 3.6 | ||||||||||
| Hedging reserve |
0.1 | 0.1 | ||||||||||
| Retained earnings |
(161.7 | ) | (136.1 | ) | ||||||||
|
|
|
|
|
|||||||||
| Equity attributable to equity holders of the parent |
150.1 | 174.0 | ||||||||||
|
|
|
|
|
|||||||||
| Equity attributable to non-controlling interests |
0.6 | — | ||||||||||
|
|
|
|
|
|||||||||
| TOTAL EQUITY |
150.7 | 174.0 | ||||||||||
|
|
|
|
|
|||||||||
| * | Comparative periods have been restated following the adoption of IAS 19 Employee Benefits which has been applied retrospectively (see Note 20). |
F-218
Table of Contents
CONDENSED CONSOLIDATED CASH FLOW STATEMENT (unaudited)
Nine months ended 30 September
| Nine months ended | ||||||||||||
| Note | 30 September 2013 £’m |
30 September 2012 £’m |
||||||||||
| Operating activities |
||||||||||||
| Net cash flows from operating activities |
16 | 7.4 | 11.1 | |||||||||
| Investing activities |
||||||||||||
| Purchase of property, plant and equipment |
(8.6 | ) | (12.1 | ) | ||||||||
| Purchase of intangible assets |
(2.9 | ) | (0.3 | ) | ||||||||
| Proceeds on disposal of property, plant and equipment |
3.0 | 0.2 | ||||||||||
| Proceeds on disposal of businesses |
14,15 | 0.6 | 15.0 | |||||||||
| Interest received |
0.1 | 0.6 | ||||||||||
| Acquisition of business, net of cash acquired |
13 | (2.0 | ) | — | ||||||||
|
|
|
|
|
|||||||||
| Net cash (outflow)/inflow from investing activities |
(9.8 | ) | 3.4 | |||||||||
|
|
|
|
|
|||||||||
| Financing activities |
||||||||||||
| Commitment fees paid |
(0.2 | ) | (0.5 | ) | ||||||||
| Facility fees paid |
(0.6 | ) | — | |||||||||
| Interest paid |
(0.1 | ) | (3.0 | ) | ||||||||
| Dividends paid to shareholders |
(3.8 | ) | (3.5 | ) | ||||||||
| Cash paid for foreign exchange forward contracts carried at fair value through profit or loss |
(0.1 | ) | — | |||||||||
| Repayment of interest rate swap break costs |
— | (2.7 | ) | |||||||||
| Repayment of interest rate swaps on termination |
— | (2.0 | ) | |||||||||
| Repayment of external loans |
— | (158.5 | ) | |||||||||
| Repayment of obligations under finance leases |
(0.1 | ) | (0.2 | ) | ||||||||
|
|
|
|
|
|||||||||
| Net cash outflow from financing activities |
(4.9 | ) | (170.4 | ) | ||||||||
|
|
|
|
|
|||||||||
| Net decrease in cash and cash equivalents |
(7.3 | ) | (155.9 | ) | ||||||||
| Foreign exchange differences |
(1.5 | ) | — | |||||||||
| Net Cash and cash equivalents at beginning of period |
14.6 | 182.3 | ||||||||||
|
|
|
|
|
|||||||||
| Net Cash and cash equivalents at end of period |
5.8 | 26.4 | ||||||||||
|
|
|
|
|
|||||||||
F-219
Table of Contents
CONDENSED CONSOLIDATED STATEMENT OF CHANGES IN EQUITY (unaudited)
Nine months ended 30 September 2013
| Equity attributable to equity holders of the parent | ||||||||||||||||||||||||||||||||||||||||
| Share capital £’m |
Share premium £’m |
Merger reserve £’m |
Other reserve £’m |
Capital reserve £’m |
Hedging reserve £’m |
Translation reserve £’m |
Retained Earnings £’m |
Non- controlling interest £’m |
Total Equity £’m |
|||||||||||||||||||||||||||||||
| At 1 January 2012 (Restated*) |
8.7 | 110.8 | 93.5 | 93.1 | 0.8 | — | 8.7 | (135.9 | ) | — | 179.7 | |||||||||||||||||||||||||||||
| Profit for the period |
— | — | — | — | — | — | — | 2.3 | — | 2.3 | ||||||||||||||||||||||||||||||
| Other comprehensive (expense)/income for the period |
— | — | — | — | — | — | (6.5 | ) | 1.5 | — | (5.0 | ) | ||||||||||||||||||||||||||||
|
|
|
|
|
|
|
|
|
|
|
|
|
|
|
|
|
|
|
|
|
|||||||||||||||||||||
| Total comprehensive (expense)/income for the period |
— | — | — | — | — | — | (6.5 | ) | 3.8 | — | (2.7 | ) | ||||||||||||||||||||||||||||
| Transfer to income: |
||||||||||||||||||||||||||||||||||||||||
| Movements related to share based payments |
— | — | — | — | (0.4 | ) | — | — | 0.3 | — | (0.1 | ) | ||||||||||||||||||||||||||||
| Dividends paid |
— | — | — | — | — | — | — | (5.2 | ) | — | (5.2 | ) | ||||||||||||||||||||||||||||
|
|
|
|
|
|
|
|
|
|
|
|
|
|
|
|
|
|
|
|
|
|||||||||||||||||||||
| At 30 September 2012 |
8.7 | 110.8 | 93.5 | 93.1 | 0.4 | — | 2.2 | (137.0 | ) | — | 171.7 | |||||||||||||||||||||||||||||
|
|
|
|
|
|
|
|
|
|
|
|
|
|
|
|
|
|
|
|
|
|||||||||||||||||||||
| At 1 January 2013 |
8.7 | 110.8 | 93.5 | 93.1 | 0.3 | 0.1 | 3.6 | (136.1 | ) | — | 174.0 | |||||||||||||||||||||||||||||
| Loss for the period |
— | — | — | — | — | — | — | (20.6 | ) | (0.1 | ) | (20.7 | ) | |||||||||||||||||||||||||||
| Other comprehensive income for the period |
— | — | — | — | — | — | 1.5 | 0.9 | — | 2.4 | ||||||||||||||||||||||||||||||
|
|
|
|
|
|
|
|
|
|
|
|
|
|
|
|
|
|
|
|
|
|||||||||||||||||||||
| Total comprehensive income/(expense) for the period |
— | — | — | — | — | — | 1.5 | (19.7 | ) | (0.1 | ) | (18.3 | ) | |||||||||||||||||||||||||||
| Transfer to income: |
||||||||||||||||||||||||||||||||||||||||
| Movements related to share based payments |
— | — | — | — | 0.2 | — | — | — | — | 0.2 | ||||||||||||||||||||||||||||||
| Arising on acquisition |
— | — | — | — | — | — | — | — | 0.7 | 0.7 | ||||||||||||||||||||||||||||||
| Dividends |
— | — | — | — | — | — | — | (5.9 | ) | — | (5.9 | ) | ||||||||||||||||||||||||||||
|
|
|
|
|
|
|
|
|
|
|
|
|
|
|
|
|
|
|
|
|
|||||||||||||||||||||
| At 30 September 2013 |
8.7 | 110.8 | 93.5 | 93.1 | 0.5 | 0.1 | 5.1 | (161.7 | ) | 0.6 | 150.7 | |||||||||||||||||||||||||||||
|
|
|
|
|
|
|
|
|
|
|
|
|
|
|
|
|
|
|
|
|
|||||||||||||||||||||
| * | Comparative periods have been restated following the adoption of IAS 19 Employee Benefits which has been applied retrospectively (see Note 20). |
F-220
Table of Contents
The information for the year ended 31 December 2012 does not constitute statutory accounts as defined in section 434 of the Companies Act 2006. A copy of the statutory accounts for that year has been delivered to the Registrar of Companies. The auditor’s report on those accounts was not qualified, did not include a reference to any matters to which the auditors drew attention by way of emphasis without qualifying the report and did not contain statements under section 498(2) or (3) of the Companies Act 2006.
2. Accounting policies
The annual financial statements of Fiberweb Limited (formerly Fiberweb plc) are prepared in accordance with International Financial Reporting Standards (IFRSs) as issued by the IASB. The condensed consolidated financial statements have been prepared in accordance with International Accounting Standard 34 (IAS) Interim Financial Reporting.
Basis of preparation
After making enquiries, including an assessment of the Group’s funding arrangements, the directors have a reasonable expectation that the Company and the Group have adequate resources to continue in operational existence for the foreseeable future. Accordingly, they continue to adopt the going concern basis in preparing the condensed consolidated financial statements. Fiberweb plc was acquired by Polymer Group Inc. (“PGI”) on 15 November 2013 (see Note 21).
The preparation of the condensed consolidated financial statements requires management to make estimates and assumptions that affect the reported amounts of assets and liabilities and disclosure of contingent assets and liabilities at the end of the reporting period, and the reported amounts of revenue and expenses during the reporting period. Actual results could vary from these estimates. The estimates and underlying assumptions are reviewed on an ongoing basis. Revisions to accounting estimates are recognised in the period in which the estimate is revised if the revision affects only that period or in the period of the revision and future periods if the revision affects both current and future periods.
IAS 19 Revised Employee Benefits (effective 1 January 2013) has been adopted retrospectively. Comparative periods have been restated in accordance with IAS 19 (see Note 20).
During the period, the following new and Standards have been adopted but have no significant effect on the consolidated results or financial position in these Financial Statements.
| • | IFRS 10 Consolidated Financial Statements |
| • | IFRS 11 Joint Arrangements |
| • | IFRS 12 Disclosure of Interest in Other Entities |
| • | IFRS 13 Fair Value Measurement |
3. Segmental information
The Group’s reportable segments are Technical Fabrics and Geosynthetics. Management review trading results of the divisions before allocation of global Research and Development costs (R&D) and Health and Safety expenses (HSE)—shown in the tables below as trading profit.
With effect from 1 January 2013, commercial responsibility for the Group’s European construction activity transferred to the Geosynthetics Division. Accordingly, the sales and operating results of this segment have been
F-221
Table of Contents
reclassified from the Technical Fabrics Division to the Geosynthetics Division. The prior period comparatives in the segmental revenues and results note (Note 3a) have therefore been restated. This has had no effect on the segmental assets and liabilities (Note 3b).
3a. Segmental revenues and results
Nine months ended 30 September 2013
| Technical Fabrics £’m |
Geosynthetics £’m |
Total £’m |
||||||||||
| External sales by origin |
151.9 | 68.4 | 220.3 | |||||||||
| Trading (loss) |
(4.9 | ) | (1.4 | ) | (6.3 | ) | ||||||
| Unallocated corporate costs |
(10.9 | ) | ||||||||||
|
|
|
|
|
|
|
|||||||
| Operating profit from continuing operations |
(17.2 | ) | ||||||||||
| Finance costs (net) |
(0.7 | ) | ||||||||||
|
|
|
|||||||||||
| Loss before tax |
(17.9 | ) | ||||||||||
Unallocated corporate costs primarily include the central costs for central functions that are not allocated to the reporting segments together with global R&D and health and safety costs.
Other information
| Technical Fabrics £’m |
Geosynthetics £’m |
Unallocated Corporate £’m |
Total £’m |
|||||||||||||
| Operating profit margin % |
(5.6 | )% | (3.5 | )% | — | (7.8 | )% | |||||||||
| Capital additions |
6.8 | 0.9 | 3.7 | 11.4 | ||||||||||||
| Depreciation and amortisation |
8.9 | 1.2 | 0.1 | 10.2 | ||||||||||||
| Impairment |
23.6 | — | — | 23.6 | ||||||||||||
Nine months ended 30 September 2012
| Technical Fabrics £’m |
Geosynthetics £’m |
Total £’m |
||||||||||
| External sales by origin |
154.9 | 74.4 | 229.3 | |||||||||
| Trading profit/(loss) |
16.6 | (2.7 | ) | 13.9 | ||||||||
| Unallocated corporate costs |
(8.1 | ) | ||||||||||
|
|
|
|
|
|
|
|||||||
| Operating profit from continuing operations |
5.8 | |||||||||||
| Finance costs (net) |
(1.2 | ) | ||||||||||
|
|
|
|||||||||||
| Profit before tax |
4.6 | |||||||||||
Unallocated corporate costs primarily include the central costs for central functions that are not allocated to the reporting segments together with global R&D and health and safety costs.
F-222
Table of Contents
Other information
| Technical Fabrics £’m |
Geosynthetics £’m |
Unallocated Corporate £’m |
Total £’m |
|||||||||||||
| Operating profit margin % |
9.4 | % | (5.4 | )% | — | 2.5 | % | |||||||||
| Capital additions |
5.5 | 6.8 | 0.2 | 12.5 | ||||||||||||
| Depreciation and amortisation |
8.7 | 0.6 | 0.2 | 9.5 | ||||||||||||
| Impairment |
1.5 | — | — | 1.5 | ||||||||||||
3b. Segment assets and liabilities
| 30 September 2013 £’m |
31 December 2012* £’m |
|||||||
| Assets: |
||||||||
| Technical Fabrics |
150.0 | 165.5 | ||||||
| Geosynthetics |
41.5 | 36.3 | ||||||
|
|
|
|
|
|||||
| Segment assets, excluding tax assets and cash |
191.5 | 201.8 | ||||||
| Unallocated corporate assets |
30.7 | 40.9 | ||||||
|
|
|
|
|
|||||
| Consolidated total assets |
222.2 | 242.7 | ||||||
|
|
|
|
|
|||||
| Liabilities: |
||||||||
| Technical Fabrics |
41.5 | 42.5 | ||||||
| Geosynthetics |
7.7 | 8.1 | ||||||
|
|
|
|
|
|||||
| Segment liabilities, excluding tax liabilities and debt |
49.2 | 50.6 | ||||||
| Unallocated corporate liabilities |
22.3 | 18.1 | ||||||
|
|
|
|
|
|||||
| Consolidated total liabilities |
71.5 | 68.7 | ||||||
|
|
|
|
|
|||||
Unallocated corporate assets and liabilities primarily include cash and debt, tax balances and investments
| * | Restated (see Note 20) |
4. Other operating income
Other operating income for the nine months ended 30 September 2013 of £2.3 million (nine months ended 30 September 2012: £2.0 million) comprises government grants, operating lease income, income from transitional services provided to Fitesa following the disposal of the Hygiene businesses and other sundry items. Operating lease income includes £0.5 million income (nine months ended 30 September 2012: £0.5 million) in respect of the medical line which is leased to Fitesa following the disposal of the Hygiene business.
Other operating income of £0.8 million represents the £2.5 million gain on the disposal of the resin bond line in Terno d’Isola to Fitesa. This is offset by the write-off of a £1.7 million receivable balance from the former parent company, BBA Aviation plc, held in respect of indemnities provided for Corporation Tax liabilities, in accordance with the terms of the demerger agreement. This amount has been written off to match the release of a corresponding corporation tax creditor in respect of pre-demerger tax risks which is no longer required.
F-223
Table of Contents
5. Restructuring costs, impairment, and amortisation of acquired intangibles
Restructuring costs, amortisation of acquired intangibles and other items included within profit before tax amounted to £28.4 million (period ended 30 September 2012: £5.2 million). The main items included within this are:
Nine months ended 30 September 2013
Cost of sales include an impairment charge of £1.7 million in respect of Graphic Arts equipment and inventories in Old Hickory in the US.
Administrative expenses include impairment of the goodwill held in respect of Technical Fabrics in Europe of £22.0 million (see Note 11), amortisation of acquired intangible assets of £0.4 million, transaction costs of £1.8 million and a gain of £0.5m on the acquisition accounting for Terram Geosynthetics Private Limited.
Restructuring costs of £3.7 million comprised:
| • | £1.3 million in respect of the cessation of manufacturing at the Ghiaie site in Italy following the disposal the resin bond line; and |
| • | £2.4 million in respect of an operational restructuring programme across the Group including the final closure of the Pontypool Geosynthetics site. |
Nine months ended 30 September 2012
Cost of sales include an impairment charge of £1.6 million primarily in respect of a pilot line in Old Hickory in the US, and the profit on disposal of £0.2 million for previously impaired assets at Terno d’Isola in Italy.
Administrative expenses include the amortisation of acquired intangible assets.
Restructuring costs of £3.4 million comprised:
| • | £2.6 million in respect of the final closure of manufacturing at the Terram site in Pontypool following the successful commissioning of the needlepunch line in Maldon. |
| • | £0.8 million of restructuring costs for the cost reduction programme as a result of the disposal of the Hygiene business reflecting the smaller size of the Group. |
6. Investment income and finance costs
| Nine months ended | ||||||||
| 30 September 2013 £’m |
30 September 2012 £’m |
|||||||
| Interest on the Vendor Loan Note |
— | 0.6 | ||||||
|
|
|
|
|
|||||
| Total investment income |
— | 0.6 | ||||||
|
|
|
|
|
|||||
| Interest on bank loans and overdrafts |
(0.2 | ) | (0.3 | ) | ||||
|
|
|
|
|
|||||
| Total interest expense |
(0.2 | ) | (0.3 | ) | ||||
| Net finance expense from pension schemes |
(0.1 | ) | (0.7 | ) | ||||
| Interest capitalised in the cost of qualifying assets |
— | 0.1 | ||||||
| Other finance costs |
(0.4 | ) | (0.9 | ) | ||||
|
|
|
|
|
|||||
| Total finance costs from continuing operations |
(0.7 | ) | (1.8 | ) | ||||
|
|
|
|
|
|||||
| Net finance expense from continuing operations |
(0.7 | ) | (1.2 | ) | ||||
|
|
|
|
|
|||||
F-224
Table of Contents
Other finance costs of £0.4 million (nine months ended 30 September 2012: £0.9 million) include normal amortisation of prepaid facility fees of £0.2 million (nine months ended 30 September 2012: £0.3 million) and commitment fees on the undrawn RCF of £0.2 million (nine months ended 30 September 2012: £0.6 million).
No finance costs were capitalised in the period. Capitalised finance costs in the prior period related to the construction of the needlepunch line in Maldon and the digital printer in Old Hickory, US (nine months ended 30 September 2012: £0.1 million).
7. Taxation
Nine months ended 30 September 2013
A tax charge of £2.8 million was recorded on the loss before tax of £17.9 million based on the estimated full year effective tax rate of 44.7% applied to the pre-tax income of the nine month period.
The tax charge of £2.8 million includes a deferred tax credit of £1.8 million in respect of the UK. All other tax items relate to overseas operations. In addition to the effective tax rate applied, a number of one-off items have been included in the tax charge. These include the write off of £4.9m of deferred tax assets held in respect of historic tax losses in Italy and Germany as a result of performance in these businesses. This is partially offset by the recognition of a £2.3 million deferred tax asset on US State tax historic losses which had not previously been recognised due to uncertainty over their recoverability and a £2.1 million reduction in a deferred tax liability on property, plant and equipment temporary differences.
The Group has recognised a current tax charge of £0.1 million and a deferred tax credit of £0.8 million in respect of restructuring costs, amortisation of acquired intangibles and other one-off items. There was no tax credit on the £22.0 million goodwill impairment recognised in the period. In addition, a corporation tax credit of £1.7 million has been recognised in respect of the release of a creditor held in respect of pre-demerger tax risks that is no longer required given the passage of time since demerger. This is offset by a corresponding reduction in the other receivable balance held (see Note 4).
Domestic income tax is calculated at 23.25% (nine months ended 30 September 2012: 24.5%) of the estimated assessable profit for the year. Taxation for other jurisdictions is calculated at the rates prevailing in the relevant jurisdictions.
The Finance Act 2012, which provides for a reduction in the main rate of UK corporation tax from 24% to 23% effective from 1 April 2013, was substantively enacted on 3 July 2012. The UK corporation tax rate reduction to 21% from 1 April 2014 and 20% from 1 April 2015 was substantively enacted by the UK Government in July 2013. An adjustment has been recognised in the underlying tax charge to reduce the UK deferred tax asset recognised at 31 December 2012 from £5.5 million to £5.0 million to reflect the rate reduction to 20%.
Nine months ended 30 September 2012
A tax charge of £2.2 million was recorded on the profit before tax of £4.6 million based on the estimated full year effective tax rate of 34% applied to the pre-tax income of the nine month period. Within the tax charge, the Group has recognised a current tax charge of £0.1 million and a deferred tax credit of £1.1 million in respect of restructuring costs and other one-off items.
The tax charge of £2.2 million includes a £1.4 million deferred tax credit in respect of the UK. All other tax items relate to overseas operations.
Domestic income tax is calculated at 24.5% of the estimated assessable profit for the year. Taxation for other jurisdictions is calculated at the rates prevailing in the relevant jurisdictions.
F-225
Table of Contents
8. Dividends
| Nine months ended | ||||||||
| 30 September 2013 £’m |
30 September 2012 £’m |
|||||||
| Amounts recognised as distributions to equity holders in the period: |
||||||||
| Final dividend for the year ended 31 December 2012 of 2.2 pence (2011: 2.0 pence) per share |
3.8 | 3.5 | ||||||
|
|
|
|
|
|||||
| Amounts recognised as a liability as at: |
||||||||
| Interim dividend for the year ending 31 December 2013 of 1.2 pence (2012: 1.0 pence) per share |
2.1 | 1.7 | ||||||
|
|
|
|
|
|||||
| 5.9 | 5.2 | |||||||
|
|
|
|
|
|||||
The proposed interim dividend was approved by the Board on 1 August 2013 and has therefore been included as a liability on the balance sheet at 30 September 2013.
9. (Loss)/Earnings per share
| Nine months ended | ||||||||
| 30 September 2013 £’m |
30 September 2012 £’m |
|||||||
| Earnings |
||||||||
| Continuing operations |
||||||||
| Basic and diluted: |
||||||||
| (Loss)/ profit for the year—attributable to ordinary shareholders |
(20.6 | ) | 2.4 | |||||
| Discontinued operations |
||||||||
| Basic and diluted: |
||||||||
| Loss for the year—attributable to ordinary shareholders |
— | (0.1 | ) | |||||
|
|
|
|
|
|||||
| Total |
||||||||
|
|
|
|
|
|||||
| Basic and diluted: |
||||||||
| (Loss)/ profit for the year—attributable to ordinary shareholders |
(20.6 | ) | 2.3 | |||||
| Number of shares |
||||||||
| Weighted average number of 5p ordinary shares: |
||||||||
| For basic earnings per share |
173,583,551 | 173,583,551 | ||||||
| For diluted earnings per share |
175,991,100 | 175,655,138 | ||||||
| (Loss)/Earnings per share |
||||||||
| Continuing operations |
||||||||
| Basic: |
(11.9 | )p | 1.4 | p | ||||
| Diluted: |
(11.9 | )p | 1.4 | p | ||||
| Discontinued operations |
||||||||
| Basic: |
— | (0.1 | )p | |||||
| Diluted: |
— | (0.1 | )p | |||||
|
|
|
|
|
|||||
| Total |
||||||||
|
|
|
|
|
|||||
| Basic: |
(11.9 | )p | 1.3 | p | ||||
| Diluted: |
(11.9 | )p | 1.3 | p | ||||
F-226
Table of Contents
10. Property, plant and equipment and other intangible assets
During the period, the Group capitalised £10.5 million (period ended 30 September 2012: £12.2 million) in respect of new equipment. Additions during the period included £3.5 million in respect of the land purchase and the warehouse transfer project in the US which will enable consolidation of operations at Old Hickory onto one site.
The Group also disposed of a specialist resin bond carded production line at Terno d’Isola in Italy for proceeds of £3.0 million (see Note 4). The equipment was sold, after the exercise of an option provided at the time of the Hygiene disposal.
11. Goodwill
| Goodwill £’m |
||||
| Cost |
||||
| At 1 January 2012 |
100.1 | |||
| Exchange adjustments |
(3.5 | ) | ||
| Assets reclassified as held for sale (Note 14) |
(0.4 | ) | ||
|
|
|
|||
| At 1 January 2013 |
96.2 | |||
| Exchange adjustments |
1.1 | |||
| Goodwill on acquisition (Note 13) |
1.2 | |||
|
|
|
|||
| At 30 September 2013 |
98.5 | |||
|
|
|
|||
| Amortisation and impairment |
||||
| At 1 January 2012 |
(59.9 | ) | ||
| Exchange adjustments |
2.7 | |||
| Charge for the year |
— | |||
|
|
|
|||
| At 1 January 2013 |
(57.2 | ) | ||
| Exchange differences |
0.1 | |||
| Impairment |
(22.0 | ) | ||
|
|
|
|||
| At 30 September 2013 |
(79.1 | ) | ||
|
|
|
|||
| Carrying amount: |
||||
| 30 September 2013 |
19.4 | |||
|
|
|
|||
| 31 December 2012 |
39.0 | |||
|
|
|
|||
During the period ended 30 September 2013, the Company identified circumstances which indicated the goodwill attributable to Technical Fabrics in Europe may not be recoverable, which triggered an impairment test. The carrying value of goodwill of the Group’s operations in Europe were impaired by £22.0 million in the nine months ended 30 September 2013.
The methodology adopted for impairment testing for the nine months ended 30 September 2013 was consistent with that disclosed in Note 11 of the Group’s annual report for the year ended 31 December 2012.
The recoverable amounts of the CGUs are determined from value in use calculations, based on pre-tax cash flows discounted using a pre-tax discount rate. The key assumptions for the value in use calculations are those regarding the discount rates, growth rates and expected changes to selling prices and direct costs during the period. The discount rate applied in the review at September 2013 was 10.6%.
12. Bank loans and overdrafts
During the year ended 31 December 2012, Fiberweb France set up a €5.0 million (£4.1 million) debt factoring arrangement which was increased to €6.0 million (£5 million) in the nine months ended 30 September 2013.
F-227
Table of Contents
€5.2 million (£4.3 million) of the facility was utilised at 30 September 2013 (31 December 2012: €3.1 million (£2.5 million)).
Fiberweb completed the acquisition of an additional 39% of Terram Geosynthetics Private Limited (“TGPL”) on 12 July 2013 for £2.0 million, increasing its stake from 26% to 65%. On completion, Fiberweb consolidated around £2.5 million of debt associated with TGPL consisting of a term loan and working capital facility.
13. Acquisitions
Fiberweb completed the acquisition of an additional 39% of Terram Geosynthetics Private Limited (“TGPL”) on 12 July 2013 for £2.0 million, increasing its stake from 26% to 65%. At acquisition, TGPL had net debt of £2.5 million. TGPL has been integrated into the Group’s Geosynthetics segment.
The consolidated Fiberweb results for the period would not have been significantly different had TGPL been acquired on 1 January 2013.
The formal review of the fair values of the assets acquired and liabilities assumed is still in progress and will be completed within 12 months of the acquisition date. Accordingly the fair values presented are provisional. Adjustments will be made to the assets acquired and liabilities assumed during the allocation period to the extent that further information and knowledge come to light that more accurately reflect conditions at the acquisition date.
The consideration paid in respect of the acquisitions comprises the amount paid on completion. Transaction costs and expenses such as professional fees are charged to the income statement within administrative expenses.
Based on the initial estimate of the fair value of the assets and liabilities for TGPL at the date of acquisition, the Group has recognised provisional goodwill of £1.2 million. The acquisition provides opportunities for further development of the Group’s activities in the geosynthetics markets with focus on the Middle East, Russia and Asia. This provisional goodwill cannot be allocated to identifiable assets and liabilities and reflects:
| • | The assembled workforce, and |
| • | The benefits of synergies and economies of scale resulting from the integration with existing Fiberweb businesses. |
None of the goodwill recognised is expected to be deductible for income tax purposes.
In accordance with IFRS 3 Business Combinations, on completion of the additional investment, the Group recognised a gain of £0.5 million in respect of the fair value of the Group’s existing 26% holding, which had previously been fully written down.
F-228
Table of Contents
A summary of the effect of the acquisitions is detailed below:
| Fair value of assets acquired £’m |
||||
| Property, plant and equipment |
5.4 | |||
| Inventories |
0.9 | |||
| Trade and other receivables |
0.3 | |||
| Trade and other payables |
(1.4 | ) | ||
| Bank loans and overdrafts |
(2.5 | ) | ||
| Provisions for liabilities and charges |
(0.2 | ) | ||
| Tax and deferred tax |
(0.5 | ) | ||
|
|
|
|||
| 2.0 | ||||
| Goodwill |
1.2 | |||
|
|
|
|||
| Consideration |
3.2 | |||
|
|
|
|||
| Satisfied by: |
||||
| Cash consideration |
2.0 | |||
| Gain on fair value of original 26% |
0.5 | |||
| Non-controlling interest |
0.7 | |||
|
|
|
|||
| 3.2 | ||||
|
|
|
|||
| The net cash outflow in the period in respect of acquisition comprised: |
||||
| Cash consideration |
2.0 | |||
| Acquisition related costs |
0.2 | |||
|
|
|
|||
| Total cash outflow in respect of acquisitions |
2.2 | |||
|
|
|
|||
The acquired businesses contributed £Nil to the Group’s sales and decreased the Group’s profit before interest and tax for the period ended 30 September 2013 by £0.1 million.
There were no acquisitions in the nine months ended 30 September 2012, nor were any changes made to the provisional fair values relating to the acquisition accounting for prior year transactions.
14. Disposal of subsidiary
On 27 February 2013, the Group disposed of its interest in Fiberweb Melbourne Pty Ltd to Tapex Pty Ltd.
F-229
Table of Contents
The net assets of Fiberweb Melbourne Pty Ltd at the date of disposal were as follows:
| 27 February 2013 £’m |
||||
| Property, plant and equipment |
— | |||
| Inventories |
0.2 | |||
| Trade and other receivables |
0.4 | |||
| Bank balances and cash |
0.1 | |||
| Deferred tax asset |
0.1 | |||
| Trade and other payables |
(0.2 | ) | ||
|
|
|
|||
| 0.6 | ||||
| Gain on disposal |
— | |||
|
|
|
|||
| Total consideration |
0.6 | |||
| Satisfied by: |
||||
| Cash and cash equivalents |
0.7 | |||
| Less: costs to sell |
(0.1 | ) | ||
|
|
|
|||
| 0.6 | ||||
|
|
|
|||
| Net cash inflow arising on disposal: |
||||
| Consideration received in cash and cash equivalents |
0.7 | |||
| Less: cash and cash equivalents disposed of |
(0.1 | ) | ||
|
|
|
|||
| 0.6 | ||||
|
|
|
|||
The results of the Australian operations have not been disclosed as discontinued operations as they do not meet the criteria of a discontinued operation under IFRS 5 Non-current assets held for sale and discontinued operations.
There were no disposals of subsidiaries in the period ended 30 September 2012.
15. Discontinued operations
Disposal of the Hygiene business
On 30 December 2011, the Group disposed of the Hygiene business following the transfer of control to Petropar SA. The business disposed differed from the previously disclosed Hygiene segment as the disposal excluded the Dryer Sheet business in the US, the Terno d’Isola plant in Italy, the Biesheim plant in France and the Coronor business in Germany.
A gain of £1.5 million arose on the disposal, being the proceeds of disposal less the carrying amount of the businesses’ net assets plus disposal costs. The proceeds of disposal consisted of US$260 million in cash and a US$26 million one-year Vendor Loan Note.
During the nine months ended 30 September 2012, the amounts included within discontinued operations included:
| • | Additional proceeds of £0.5 million resulting from the finalisation of the Completion Accounts process. |
| • | As part of the proceeds for the disposal of the Hygiene business, the Group issued a one-year Vendor Loan Note to Petropar for US$26 million at a coupon rate of 6% payable on redemption on 30 December 2012. This was repaid early on 2 August 2012 for US$25 million as full and final settlement. The US$1 million (£0.6 million) discount on settlement was recorded within discontinued operations. |
| • | An adjustment to the tax charge arising on the disposal of £1.9 million. |
F-230
Table of Contents
| • | Finance costs and related foreign exchange losses arising on the final repayment of the RCF drawdowns and related swaps of £1.0 million. |
| • | Additional costs of £0.5 million relating to the disposed operations. |
16. Cash flow from operating activities
| Nine months ended | ||||||||
| 30 September 2013 £’m |
30 September 2012 £’m |
|||||||
| (Loss)/profit for the period before tax from continuing operations |
(17.9 | ) | 4.6 | |||||
| Loss for the period before tax from discontinued operations |
— | (0.5 | ) | |||||
| Net finance expenses |
0.7 | 1.2 | ||||||
| Depreciation of property, plant and equipment |
10.0 | 9.2 | ||||||
| Amortisation of intangible assets |
0.6 | 0.7 | ||||||
| (Profit)/loss on sale of property, plant and equipment |
(2.6 | ) | 0.2 | |||||
| Increase/(decrease) in provisions |
1.9 | (7.1 | ) | |||||
| Pension charge less pension scheme contributions |
0.1 | (2.4 | ) | |||||
| Share-based payments |
0.2 | — | ||||||
| Gain on step-acquisition of business |
(0.5 | ) | — | |||||
| Non-cash impairment and asset write-downs |
23.6 | 1.5 | ||||||
| Profit on sale of previously impaired equipment |
— | (0.2 | ) | |||||
| Other non-cash items |
0.2 | (0.3 | ) | |||||
|
|
|
|
|
|||||
| Operating cash flows before movement in working capital |
16.3 | 6.9 | ||||||
| (Increase)/decrease in inventory |
(6.8 | ) | 4.1 | |||||
| Decrease/(increase) in trade and other receivables |
2.5 | (1.8 | ) | |||||
| (Decrease)/increase in trade and other payables |
(4.2 | ) | 3.3 | |||||
|
|
|
|
|
|||||
| Cash generated by operations |
7.8 | 12.5 | ||||||
| Income taxes paid |
(0.4 | ) | (1.4 | ) | ||||
|
|
|
|
|
|||||
| Net cash flows from operating activities |
7.4 | 11.1 | ||||||
|
|
|
|
|
|||||
17. Contingent liabilities
The Fiberweb business is party to legal proceedings and claims which arise in the normal course of business, including specific product liability and environmental claims in Fiberweb Americas. Any liabilities are likely to be mitigated by legal defences, insurance, reserves and third party indemnities.
The directors do not currently anticipate that the outcome of any such proceedings and claims either individually, or in aggregate, will have a material adverse effect upon Fiberweb’s financial position.
18. Retirement obligations
The defined benefit obligation as at 30 September 2013 is estimated on a year to date basis, based on the latest actuarial valuation as at 31 December 2012.
The defined benefit plan assets have been updated to reflect their market value as at 30 September 2013. Differences between the expected return on assets and the actual return on assets have been recognised as an actuarial loss in the condensed consolidated statement of comprehensive income in accordance with the Group’s accounting policy.
F-231
Table of Contents
19. Related party transactions
On 12 July 2013, Fiberweb completed the acquisition of an additional 39% of TGPL increasing its stake from 26% to 65% (see Note 13). From this date TGPL has been fully consolidated into the Group’s results and thus ceases to be a related party. Fiberweb made purchases of £3.3 million (period ended 30 September 2012: £0.3 million) of geotextiles and received income of £Nil million (period ended 30 September 2012: £Nil) in respect of cross charges TGPL in the period. The amount due from TGPL at 12 July 2013 was £1.0 million (31 December 2012: £0.1 million).
20. Prior year restatement
Fiberweb Limited has applied the amended version of IAS 19 Employee Benefits from 1 January 2013 retrospectively. Under the revised standard past service costs are required to be recognised immediately. Previously Fiberweb had been amortising the past service costs arising on the changes made to the post-retirement medical benefits scheme in the US with a balance of £1.0 million remaining at 31 December 2012. This has been recognised in full on transition as a prior year adjustment as at 1 January 2010. In addition, the prior period income statement and balance sheet has been amended retrospectively. In addition to the changes made to the post service costs, the prior period has been restated to reflect the impact of the change in the return on assets to be calculated using the discount rate. For the financial year ended 31 December 2012, the IAS 19 liability recognised in the balance sheet has reduced by £1.0m and the IAS 19 amounts recognised in the income statement have increased by £0.5 million after tax.
21. Post balance sheet events
On 15 November 2013, Fiberweb plc was acquired by PGI Acquisition Limited, a subsidiary of Polymer Group, Inc (“PGI”). Fiberweb plc subsequently re-registered as Fiberweb Limited. This transaction impacts a number of the amounts shown in the financial statements. In particular:
| • | Awards made under the Long Term Incentive Plan vested as a result of the change of control. The assumptions in these financial statements were based on normal assumptions with vesting over a three year period. As a result of the early vesting on the change of control, an additional IFRS 2 Share-based payment charge of £0.9 million was incurred. |
| • | 2,999,236 shares were issued on 14 November 2013 to satisfy the awards vesting under the Long Term Incentive Plan as a result of the change of control. |
| • | As a result of the change of control, the Revolving Credit Facility was cancelled and repaid on 29 November 2013. |
| • | A number of adviser fees that were contingent on a successful transaction completion vested resulting in additional deal related costs of £2.5 which are not reflected in these financial statements. |
| • | The change of control will impact the amount of tax losses carried forward in a number of jurisdictions. The change of control may restrict the ability to utilise some of the UK tax losses. As this will depend on future actions, the impact on the deferred tax asset recognised on UK losses in these financial statements cannot yet be quantified. |
| • | A post transaction integration programme has commenced. The actions and financial impact of this programme are not yet known although the closure of the Richmond office has been announced. It is too early to quantify the costs related to this integration programme. |
F-232
Table of Contents
Through and including , 2015 (the 25th day after the date of this prospectus), all dealers effecting transactions in these securities, whether or not participating in this offering, may be required to deliver a prospectus. This is in addition to a dealer’s obligation to deliver a prospectus when acting as an underwriter and with respect to an unsold allotment or subscription.
Shares

PGI Specialty Materials, Inc.
Common Stock
PROSPECTUS
| BofA Merrill Lynch | Citigroup | |||
| Goldman, Sachs & Co. | Jefferies | RBC Capital Markets |
, 2015
Table of Contents
PART II
INFORMATION NOT REQUIRED IN PROSPECTUS
| ITEM 13. | OTHER EXPENSES OF ISSUANCE AND DISTRIBUTION. |
The following table sets forth the expenses payable by the Registrant expected to be incurred in connection with the issuance and distribution of common stock being registered hereby (other than underwriting discounts and commissions). All of such expenses are estimates, except for the Securities and Exchange Commission (the “SEC”) registration fee, the Financial Industry Regulatory Authority Inc. (“FINRA”) filing fee and the filing fee and listing fee.
| SEC registration fee |
$ | 11,620 | ||
| FINRA filing fee |
$ | 15,500 | ||
| filing fee and listing fee |
* | |||
| Printing fees and expenses |
* | |||
| Legal fees and expenses |
* | |||
| Registrar and transfer agent fees |
* | |||
| Accounting fees and expenses |
* | |||
| Miscellaneous expenses |
* | |||
|
|
|
|||
| Total |
* | |||
|
|
|
| * | To be provided by amendment. |
| ITEM 14. | INDEMNIFICATION OF DIRECTORS AND OFFICERS. |
Section 102(b)(7) of the Delaware General Corporation Law (the “DGCL”) allows a corporation to provide in its certificate of incorporation that a director of the corporation will not be personally liable to the corporation or its stockholders for monetary damages for breach of fiduciary duty as a director, except where the director breached the duty of loyalty, failed to act in good faith, engaged in intentional misconduct or knowingly violated a law, authorized the payment of a dividend or approved a stock repurchase in violation of Delaware corporate law or obtained an improper personal benefit. Our amended and restated certificate of incorporation will provide for this limitation of liability.
Section 145 of the DGCL (“Section 145”), provides, among other things, that a Delaware corporation may indemnify any person who was, is or is threatened to be made, party to any threatened, pending or completed action, suit or proceeding, whether civil, criminal, administrative or investigative (other than an action by or in the right of such corporation), by reason of the fact that such person is or was an officer, director, employee or agent of such corporation or is or was serving at the request of such corporation as a director, officer, employee or agent of another corporation or enterprise. The indemnity may include expenses (including attorneys’ fees), judgments, fines and amounts paid in settlement actually and reasonably incurred by such person in connection with such action, suit or proceeding, provided such person acted in good faith and in a manner he or she reasonably believed to be in or not opposed to the corporation’s best interests and, with respect to any criminal action or proceeding, had no reasonable cause to believe that his or her conduct was unlawful. A Delaware corporation may indemnify any persons who were or are a party to any threatened, pending or completed action or suit by or in the right of the corporation by reason of the fact that such person is or was a director, officer, employee or agent of another corporation or enterprise. The indemnity may include expenses (including attorneys’ fees) actually and reasonably incurred by such person in connection with the defense or settlement of such action or suit, provided such person acted in good faith and in a manner he or she reasonably believed to be in or not opposed to the corporation’s best interests, provided further that no indemnification is permitted without judicial approval if the officer, director, employee or agent is adjudged to be liable to the corporation. Where an officer or director is successful on the merits or otherwise in the defense of any action referred to above, the corporation must indemnify him or her against the expenses (including attorneys’ fees) which such officer or director has actually and reasonably incurred.
II-1
Table of Contents
Section 145 further authorizes a corporation to purchase and maintain insurance on behalf of any person who is or was a director, officer, employee or agent of the corporation or is or was serving at the request of the corporation as a director, officer, employee or agent of another corporation or enterprise, against any liability asserted against such person and incurred by such person in any such capacity, or arising out of his or her status as such, whether or not the corporation would otherwise have the power to indemnify such person under Section 145.
Our amended and restated bylaws will provide that we must indemnify and advance expenses to our directors and officers to the full extent authorized by the DGCL.
The indemnification rights set forth above shall not be exclusive of any other right which an indemnified person may have or hereafter acquire under any statute, any provision of our amended and restated certificate of incorporation, our amended and restated bylaws, agreement, vote of stockholders or disinterested directors or otherwise. Notwithstanding the foregoing, we shall not be obligated to indemnify a director or officer in respect of a proceeding (or part thereof) instituted by such director or officer, unless such proceeding (or part thereof) has been authorized by the Board of Directors pursuant to the applicable procedure outlined in the amended and restated bylaws.
Section 174 of the DGCL provides, among other things, that a director, who willfully or negligently approves of an unlawful payment of dividends or an unlawful stock purchase or redemption, may be held jointly and severally liable for such actions. A director who was either absent when the unlawful actions were approved or dissented at the time may avoid liability by causing his or her dissent to such actions to be entered in the books containing the minutes of the meetings of the Board of Directors at the time such action occurred or immediately after such absent director receives notice of the unlawful acts.
We expect to maintain standard policies of insurance that provide coverage (1) to our directors and officers against loss rising from claims made by reason of breach of duty or other wrongful act and (2) to us with respect to indemnification payments that we may make to such directors and officers.
The underwriting agreement provides for indemnification by the underwriters of us and our officers and directors, and by us of the underwriters, for certain liabilities arising under the Securities Act or otherwise in connection with this offering.
| ITEM 15. | RECENT SALES OF UNREGISTERED SECURITIES. |
During the fiscal year ended December 29, 2012, we issued (i) 750 shares of our common stock and (ii) 4,582 stock options to members of our management under our equity incentive plans.
During the fiscal year ended December 28, 2013, we issued (i) 468.8 shares of our common stock, (ii) 6,816.8 stock options and (iii) 3,000 RSUs to members of our management under our equity incentive plans.
During the fiscal year ended December 28, 2013, we also issued 30,726 shares of our common stock to affiliates of the Sponsor in exchange for $30.7 million, the proceeds of which were used in connection with the Fiberweb Refinancing.
During the fiscal year ended December 31, 2014, we issued (i) 500 shares of our common stock and (ii) 3,761.1 stock options to members of our management under our equity incentive plans.
All of these shares were issued without registration in reliance on the exemptions afforded by Section 4(a)(2) of the Securities Act and/or Rule 701 promulgated thereunder.
| ITEM 16. | EXHIBITS AND FINANCIAL STATEMENT SCHEDULES. |
(a) Exhibits. See the Exhibit Index immediately following the signature page hereto, which is incorporated by reference as if fully set forth herein.
II-2
Table of Contents
(b) Financial Statement Schedules. Schedule II—Valuation and Qualifying Accounts (“Schedule II”).
PGI SPECIALTY MATERIALS, INC.
SCHEDULE II — VALUATION AND QUALIFYING ACCOUNTS
| Balance at Beginning of Period |
Additions | Balance at End of Period |
||||||||||||||||||||||||
| In thousands |
Charged to Expenses |
Charged to Other |
Deductions | |||||||||||||||||||||||
| Fiscal Year ended December 31, 2014 |
||||||||||||||||||||||||||
| Allowance for Doubtful Accounts |
808 | 3,208 | (387 | ) | (f) | 759 | (e) | 2,870 | ||||||||||||||||||
| Valuation allowance for deferred tax assets |
193,442 | 70,831 | (16,049 | ) | 20,749 | 227,475 | ||||||||||||||||||||
| Plant realignment |
8,460 | 8,634 | (119 | ) | 8,343 | 8,460 | ||||||||||||||||||||
| Fiscal Year ended December 28, 2013 |
||||||||||||||||||||||||||
| Allowance for Doubtful Accounts |
$ | 1,179 | 483 | (98 | ) | (f) | 756 | (e) | $ | 808 | ||||||||||||||||
| Valuation allowance for deferred tax assets |
203,837 | 17,224 | 37,011 | 64,630 | 193,442 | |||||||||||||||||||||
| Plant realignment |
1,100 | (g) | 15,074 | 34 | 9,930 | (d) | 6,278 | |||||||||||||||||||
| Fiscal Year ended December 29, 2012 |
||||||||||||||||||||||||||
| Allowance for Doubtful Accounts |
$ | 1,059 | 5 | 221 | (f) | 106 | (e) | $ | 1,179 | |||||||||||||||||
| Valuation allowance for deferred tax assets |
178,161 | 41,307 | 4,737 | (b) | 20,368 | (c) | 203,837 | |||||||||||||||||||
| Plant realignment |
1,100 | 15,074 | 34 | 9,930 | (d) | 6,278 | ||||||||||||||||||||
| (a) | Beginning balance reflects opening balance sheet purchase accounting adjustments. |
| (b) | Foreign currency translation adjustments and/or valuation allowance related to temporary differences not impacting the Consolidated Statement of Operations. |
| (c) | Net adjustments due to realizations of deferred tax assets and valuation allowance related to temporary differences. |
| (d) | Cash payments. |
| (e) | Primarily recoveries. |
| (f) | Foreign currency translation and revaluation adjustments. |
| (g) | Includes $2.0 million of charges associated with the Fiberweb Acquisition. |
| ITEM 17. | UNDERTAKINGS |
(1) Insofar as indemnification for liabilities arising under the Securities Act of 1933 may be permitted to directors, officers and controlling persons of the registrant pursuant to the foregoing provisions, or otherwise, the registrant has been advised that in the opinion of the Securities and Exchange Commission such indemnification is against public policy as expressed in the Securities Act of 1933 and is, therefore, unenforceable. In the event that a claim for indemnification against such liabilities (other than the payment by the registrant of expenses incurred or paid by a director, officer or controlling person of the registrant in the successful defense of any action, suit or proceeding) is asserted by such director, officer or controlling person in connection with the securities being registered, the registrant will, unless in the opinion of its counsel the matter has been settled by controlling precedent, submit to a court of appropriate jurisdiction the question of whether such indemnification by it is against public policy as expressed in the Securities Act of 1933 and will be governed by the final adjudication of such issue.
(2) The undersigned Registrant hereby undertakes that:
| (A) | For purposes of determining any liability under the Securities Act of 1933, the information omitted from the form of prospectus filed as part of this registration statement in reliance upon Rule 430A and |
II-3
Table of Contents
| contained in a form of prospectus filed by the Registrant pursuant to Rule 424(b) (1) or (4) or 497(h) under the Securities Act shall be deemed to be part of this registration statement as of the time it was declared effective. |
| (B) | For the purpose of determining any liability under the Securities Act of 1933, each post-effective amendment that contains a form of prospectus shall be deemed to be a new registration statement relating to the securities offered therein, and the offering of such securities at that time shall be deemed to be the initial bona fide offering thereof. |
II-4
Table of Contents
SIGNATURES
Pursuant to the requirements of the Securities Act of 1933, as amended, the Registrant has duly caused this Registration Statement to be signed on its behalf by the undersigned, thereunto duly authorized, in Charlotte, North Carolina, on the 27th day of April, 2015.
| PGI Specialty Materials, Inc. | ||||
| By: | /s/ J. Joel Hackney Jr. | |||
| Name: | J. Joel Hackney Jr. | |||
| Title: | President and Chief Executive Officer | |||
POWER OF ATTORNEY
Know all men by these presents, that each person whose signature appears below hereby constitutes and appoints Dennis E. Norman, James L. Anderson and April Miller Boise, and each of them, any of whom may act without joinder of the other, the individual’s true and lawful attorneys-in-fact and agents, with full power of substitution and resubstitution, for the person and in his or her name, place and stead, in any and all capacities, to sign this registration statement and any or all amendments, including post-effective amendments to the registration statement, including a prospectus or an amended prospectus therein and any registration statement for the same offering that is to be effective upon filing pursuant to Rule 462(b) under the Securities Act, and all other documents in connection therewith to be filed with the Securities and Exchange Commission, granting unto said attorneys-in-fact and agents, and each of them, full power and authority to do and perform each and every act and thing requisite and necessary to be done in and about the premises, as fully to all intents and purposes as he or she might or could do in person, hereby ratifying and confirming all that said attorneys-in-fact as agents or any of them, or their substitute or substitutes, may lawfully do or cause to be done by virtue hereof.
Pursuant to the requirements of the Securities Act of 1933, as amended, this Registration Statement and Power of Attorney have been signed by the following persons in the capacities indicated on the 27th day of April, 2015.
| Signature |
Title | |
| /s/ J. Joel Hackney Jr. J. Joel Hackney Jr. |
President and Chief Executive Officer and Director (Principal Executive Officer) | |
| /s/ Dennis E. Norman Dennis E. Norman |
Executive Vice President, Chief Financial Officer and Treasurer (Principal Financial Officer) | |
| /s/ James L. Anderson James L. Anderson |
Vice President & Chief Accounting Officer (Principal Accounting Officer) | |
| /s/ James S. Alder James S. Alder |
Director | |
| /s/ Peter N. Foss Peter N. Foss |
Director | |
| /s/ Jason Giordano Jason Giordano |
Director | |
| /s/ Veronica M. Hagen Veronica M. Hagen |
Director | |
| /s/ Christine St.Clare Christine St.Clare |
Director | |
| /s/ Mike S. Zafirovski Mike S. Zafirovski |
Director | |
II-5
Table of Contents
EXHIBIT INDEX
| Exhibit No. |
Description | |
| 1.1* | Form of Underwriting Agreement | |
| 2.1 | Stock Purchase Agreement, dated as of January 27, 2014, among Polymer Group, Inc., PGI Polímeros do Brasil S.A., Companhia Providência Indústria e Comércio, and the shareholders named therein (incorporated by reference to Exhibit 2.1 to the Polymer Group, Inc.’s Quarterly Report on Form 10-Q filed on May 7, 2014) | |
| 3.1** | Form of Amended and Restated Certificate of Incorporation of the Registrant | |
| 3.2** | Form of Amended and Restated Bylaws of the Registrant | |
| 4.1 | Indenture, dated as of January 28, 2011, among Polymer Group, Inc., the guarantors named therein and Wilmington Trust Company as trustee (incorporated by reference to Exhibit 4.1 to Polymer Group, Inc.’s Registration Statement on Form S-4 (Registration No. 333-177497) filed on October 25, 2011 (the “S-4 Registration Statement”)) | |
| 4.2 | Supplemental Indenture, dated as of December 20, 2013, among the subsidiaries of Polymer Group, Inc. party thereto and Wilmington Trust Company, as trustee, to the Indenture, dated as of January 28, 2011, among Polymer Group, Inc., the guarantors party thereto and Wilmington Trust Company, as trustee (incorporated by reference to Exhibit 10.1 to Polymer Group, Inc.’s Current Report on Form 8-K filed on December 20, 2013) | |
| 4.3 | Form of Senior Secured Note (attached as an exhibit to Exhibit 4.1) | |
| 4.4 | Indenture, dated as of June 11, 2014, among Polymer Group, Inc., the guarantors named therein and Wilmington Trust, National Association, as trustee (incorporated by reference to Exhibit 4.1 to Polymer Group, Inc.’s Current Report on Form 8-K filed June 11, 2014) | |
| 4.5 | Form of Senior Unsecured Note (attached as an exhibit to Exhibit 4.3) | |
| 4.6 | Registration Rights Agreement, dated as of June 11, 2014, among Polymer Group, Inc., the guarantors named therein and Citigroup Global Markets Inc., Barclays Capital Inc., RBC Capital Markets, LLC and HSBC Securities (USA) Inc. (incorporated by reference to Exhibit 4.2 to Polymer Group, Inc.’s Current Report on Form 8-K filed June 11, 2014) | |
| 5.1* | Opinion of Simpson Thacher & Bartlett LLP | |
| 10.1 | Credit Agreement, dated as of January 28, 2011, among Scorpio Acquisition Corporation, Polymer Group, Inc., as lead borrower, the lenders from time to time party thereto, Citibank, N.A., as administrative agent and collateral agent, Morgan Stanley Senior Funding, Inc. as syndication agent, Barclays Bank PLC and RBC Capital Markets as co-documentation agents, and Citigroup Global Markets Inc., Morgan Stanley Senior Funding, Inc., Barclays Capital and RBC Capital Markets, as joint lead arrangers and joint book runners (incorporated by reference to Exhibit 10.1 to Polymer Group, Inc.’s S-4 Registration Statement) | |
| 10.2 | Amended and Restated Credit Agreement dated October 5, 2012 among Scorpio Acquisition Corporation, Polymer Group, Inc. as lead borrower, the lenders from time to time party thereto, Citibank, N.A., as administrative agent and collateral agent, Morgan Stanley Senior Funding, Inc. as syndication agent, Barclays Bank PLC and RBC Capital Markets as co-documentation agents, and Citigroup Global Markets Inc., Morgan Stanley Senior Funding, Inc., Barclays Capital, and RBC Capital Markets, as joint lead arrangers and joint book runners (incorporated by reference to Exhibit 10.2 to Polymer Group, Inc.’s Annual Report on Form 10-K filed on March 28, 2013) | |
II-6
Table of Contents
| Exhibit No. |
Description | |
| 10.3 | Security Agreement, dated as of January 28, 2011, among Polymer Group, Inc., Scorpio Acquisition Corporation, certain other subsidiaries of Scorpio Acquisition Corporation named therein and Wilmington Trust Company as collateral agent (incorporated by reference to Exhibit 10.2 to Polymer Group, Inc.’s S-4 Registration Statement) | |
| 10.4 | Security Agreement, dated as of January 28, 2011, among Scorpio Merger Sub Corporation, Scorpio Acquisition Corporation, certain other subsidiaries of Scorpio Acquisition Corporation named therein and Citibank, N.A., as collateral agent (incorporated by reference to Exhibit 10.3 to Polymer Group, Inc.’s S-4 Registration Statement) | |
| 10.5 | Lien Subordination and Intercreditor Agreement, dated as of January 28, 2011, among Citibank, N.A., Wilmington Trust Company as noteholder collateral agent, Scorpio Acquisition Corporation, Polymer Group, Inc. and the subsidiaries of Polymer Group, Inc. named therein (incorporated by reference to Exhibit 10.4 Polymer Group, Inc.’s S-4 Registration Statement) | |
| 10.6 | Intercreditor Agreement and Collateral Agency Agreement, dated as of January 28, 2011, among Scorpio Acquisition Corporation, Polymer Group, Inc., the subsidiaries of Polymer Group, Inc. named therein, Citibank, N.A., as Tranche 2 representative and Wilmington Trust Company as collateral agent and trustee (incorporated by reference to Exhibit 10.5 to Polymer Group, Inc.’s S-4 Registration Statement) | |
| 10.7 | Guaranty Agreement, dated as of January 28, 2011, among Scorpio Acquisition Corporation, certain other subsidiaries of Scorpio Acquisition Corporation named therein and Citibank, N.A., as administrative agent and collateral agent (incorporated by reference to Exhibit 10.6 to Polymer Group, Inc.’s S-4 Registration Statement) | |
| 10.8 | Senior Secured Credit Agreement, dated as of December 19, 2013, among Polymer Group, Inc., Scorpio Acquisition Corporation, the lenders from time to time party thereto, Citicorp North America, Inc. as administrative agent, Barclays Bank PLC as syndication agent, RBC Capital Markets and HSBC Bank USA, N.A. as co-documentation agents, Citigroup Global Markets Inc. and Barclays Bank PLC as joint lead arrangers and Citigroup Global Markets Inc., Barclays Bank PLC, RBC Capital Markets and HSBC Securities (USA) Inc. as joint bookrunners (incorporated by reference to Exhibit 10.1 to Polymer Group, Inc.’s Current Report on Form 8-K filed on December 20, 2013) | |
| 10.9 | Guaranty, dated as of December 19, 2013 among Scorpio Acquisition Corporation, the subsidiaries of Scorpio Acquisition Corporation party thereto and Citicorp North America, Inc., as administrative agent (incorporated by reference to Exhibit 10.1 to Polymer Group, Inc.’s Current Report on Form 8-K filed on December 20, 2013) | |
| 10.10 | Joinder Agreement, dated as of December 20, 2013, among the subsidiaries of Polymer Group, Inc. party thereto and Citibank, N.A., as administrative agent and collateral agent, to the Amended and Restated Credit Agreement, dated as of October 5, 2012, among Scorpio Acquisition Corporation, Polymer Group, Inc., the other borrowers party thereto, the institutions from time to time party thereto as lenders, Citibank, N.A., as administrative agent and collateral agent, and the other parties named therein (incorporated by reference to Exhibit 10.1 to Polymer Group, Inc.’s Current Report on Form 8-K filed on December 20, 2013) | |
| 10.11 | Supplement No. 1, dated as of December 20, 2013, among the subsidiaries of Polymer Group, Inc. party thereto and Citibank, N.A. as administrative agent and collateral agent, to the Guaranty, dated as of January 28, 2011 among Scorpio Acquisition Corporation, certain subsidiaries of Scorpio Acquisition Corporation party thereto and Citibank, N.A., as administrative agent and collateral agent (incorporated by reference to Exhibit 10.1 to Polymer Group, Inc.’s Current Report on Form 8-K filed on December 20, 2013) | |
II-7
Table of Contents
| Exhibit No. |
Description | |
| 10.12 | Supplement No. 1, dated as of December 20, 2013, among the subsidiaries of Polymer Group, Inc. party thereto and Citicorp North America, Inc. as administrative agent, to the Guaranty, dated as of December 19, 2013, among Scorpio Acquisition Corporation, the subsidiaries of Scorpio Acquisition Corporation party thereto and Citicorp North America, Inc., as administrative agent (incorporated by reference to Exhibit 10.1 Polymer Group Inc.’s Current Report on Form 8-K filed on December 20, 2013) | |
| 10.13 | Incremental Amendment No.1, dated as of June 10, 2014, to Senior Secured Credit Agreement, dated as of December 19, 2013, among Polymer Group, Inc., Scorpio Acquisition Corporation, the lenders from time to time party thereto, Citicorp North America, Inc. as administrative agent, Barclays Bank PLC as syndication agent, RBC Capital Markets and HSBC Bank USA, N.A. as co-documentation agents, Citigroup Global Markets Inc. and Barclays Bank PLC as joint lead arrangers and Citigroup Global Markets Inc., Barclays Bank PLC, RBC Capital Markets and HSBC Securities (USA) Inc. as joint bookrunners (incorporated by reference to Exhibit 10.1 to Polymer Group, Inc.’s Current Report on Form 8-K filed June 11, 2014) | |
| 10.14 | Incremental Amendment No. 2 and Limited Waiver, dated as of April 17, 2015, to the Senior Secured Credit Agreement dated as of December 19, 2013, among Polymer Group, Inc., Scorpio Acquisition Corporation, Citicorp North America, Inc., as administrative agent, the other agents listed therein and each lender from time to time party thereto (incorporated by reference to Exhibit 10.1 to Polymer Group, Inc.’s Current Report on Form 8-K filed on April 17, 2015) | |
| 10.15 | Amendment No. 2 and Limited Waiver, dated as of April 17, 2015, to the Amended and Restated Credit Agreement dated as of October 5, 2012, among Polymer Group, Inc., Scorpio Acquisition Corporation, Citibank, N.A., as administrative agent and collateral agent, the other agents listed therein and each lender from time to time party thereto (incorporated by reference to Exhibit 10.1 to Polymer Group, Inc.’s Current Report on Form 8-K filed on April 17, 2015) | |
| 10.16 | Equipment Lease Agreement, dated as of June 24, 2010, between Gossamer Holdings, LLC, as Lessor, and Chicopee, Inc., as Lessee (incorporated by reference to Exhibit 10.1 to Polymer Group, Inc.’s Quarterly Report on Form 10-Q filed on August 17, 2010) | |
| 10.17 | Amendment and Waiver to Equipment Lease Agreement, dated as of January 19, 2011, between Chicopee, Inc., as Lessee and Gossamer Holdings, LLC, as Lessor (incorporated by reference to Exhibit 10.16 to Polymer Group, Inc.’s S-4 Registration Statement) | |
| 10.18 | Second Amendment to Equipment Lease Agreement, dated as of October 7, 2011, between Chicopee, Inc., as Lessee and Gossamer Holdings, LLC, as Lessor (incorporated by reference to Exhibit 10.17 to Polymer Group, Inc.’s S-4 Registration Statement) | |
| 10.19 | Third Amendment to Equipment Lease Agreement, dated as of February 28, 2012, between Chicopee, Inc., as Lessee and Gossamer Holdings, LLC, as Lessor (incorporated by reference to Exhibit 10.1 to Polymer Group, Inc.’s Quarterly Report on Form 10-Q filed on May 15, 2012) | |
| 10.20 | Fourth Amendment to Equipment Lease Agreement, dated as of March 22, 2013, between Chicopee, Inc., as Lessee and Gossamer Holdings, LLC, as Lessor (incorporated by reference to Exhibit 10.1 to Polymer Group, Inc.’s Quarterly Report on Form 10-Q filed May 9, 2013) | |
| 10.21 | Transaction and Advisory Fee Agreement, dated as of January 28, 2011, between Scorpio Merger Sub-Corporation (merged with and into Polymer Group, Inc.) and Blackstone Management Partners V L.L.C (incorporated by reference to Exhibit 10.18 to Polymer Group, Inc.’s Amendment No. 1 to the Registration Statement on Form S-4/A (Registration No. 333-177497) filed on December 5, 2011) | |
| 10.22* | Form of Amended and Restated Shareholders’ Agreement | |
II-8
Table of Contents
| Exhibit No. |
Description | |
| 10.23* | Form of Registration Rights Agreement | |
| 10.24† | Executive Employment Agreement, dated June 12, 2013, between Joel Hackney and Polymer Group, Inc. (incorporated by reference to Exhibit 10.1 to Polymer Group, Inc.’s Quarterly Report on Form 10-Q filed August 7, 2013) | |
| 10.25† | Assignment and Assumption Agreement, dated as of January 28, 2011, between Scorpio Acquisition Corporation and Polymer Group, Inc. with respect to the Hagen Employment Agreement (incorporated by reference to Exhibit 10.8 to Polymer Group, Inc.’s S-4 Registration Statement) | |
| 10.26† | Executive Employment Agreement, dated June 12, 2013, between Joel Hackney and Polymer Group, Inc. (incorporated by reference to Exhibit 10.1 to the Company’s Quarterly Report on Form 10-Q filed August 7, 2013) | |
| 10.27† | Executive Employment Agreement, dated January 28, 2011, between Michael Hale and Polymer Group, Inc. (incorporated by reference to Exhibit 10.9 to Polymer Group, Inc.’s S-4 Registration Statement) | |
| 10.28† | Amendment No.1, dated June 14, 2012, to Executive Employment Agreement, dated January 28, 2011, between Michael Hale and Polymer Group, Inc. (incorporated by reference to Exhibit 10.2 to Polymer Group, Inc.’s Quarterly Report on Form 10-Q filed on August 13, 2012) | |
| 10.29† | Executive Employment Agreement, dated January 28, 2011, between Dennis Norman and Polymer Group, Inc. (incorporated by reference to Exhibit 10.10 to Polymer Group, Inc.’s S-4 Registration Statement) | |
| 10.30†** | Severance Protection Agreement, dated as of October 18, 2012, between Michael D. Modak and Polymer Group, Inc. | |
| 10.31†** | Letter Agreement, dated as of February 5, 2014, between Michael D. Modak and PGI Specialty Materials, Inc. | |
| 10.32†** | Separation Agreement and General Release, dated February 10, 2014, between Michael D. Modak and Polymer Group, Inc. | |
| 10.33† | 2011 Scorpio Holdings Corporation Stock Incentive Plan (incorporated by reference to Exhibit 10.11 to Polymer Group, Inc.’s S-4 Registration Statement) | |
| 10.34† | Form of Management Equity Subscription Agreement under the 2011 Scorpio Holdings Corporation Stock Incentive Plan (incorporated by reference to Exhibit 10.12 to Polymer Group, Inc.’s S-4 Registration Statement) | |
| 10.35† | Form of Nonqualified Stock Option Agreement under the 2011 Scorpio Holdings Corporation Stock Incentive Plan (incorporated by reference to Exhibit 10.13 to Polymer Group, Inc.’s S-4 Registration Statement) | |
| 10.36† | Form of Restricted Stock Unit Agreement under the 2011 Scorpio Holdings Corporation Stock Incentive Plan (incorporated by reference to Exhibit 10.1 to Polymer Group, Inc.’s Quarterly Report on Form 10-Q filed August 7, 2013) | |
| 10.37† | Amended and Restated Polymer Group, Inc. Short-Term Incentive Compensation Plan (incorporated by reference to Exhibit 99.1 to Polymer Group, Inc.’s Current Report on Form 8-K filed on May 15, 2012) | |
| 10.38† | 2014 Integration Incentive Compensation Plan (incorporated by reference to Exhibit 10.1 to Polymer Group, Inc.’s Quarterly Report on Form 10-Q filed on May 7, 2014) | |
II-9
Table of Contents
| Exhibit No. |
Description | |
| 10.39†* | 2015 Omnibus Incentive Plan | |
| 10.40†** | Letter Agreement, dated as of January 8, 2015, between Daniel L. Rikard and Polymer Group, Inc. | |
| 21.1** | Subsidiaries of PGI Specialty Materials, Inc. | |
| 23.1 | Consent of Ernst & Young LLP | |
| 23.2 | Consent of Deloitte LLP | |
| 23.3 | Consent of Deloitte Touche Tohmatsu Auditores Independentes | |
| 23.4* | Consent of Simpson Thacher & Bartlett LLP (included in Exhibit 5.1 hereto) | |
| 24.1 | Powers of Attorney (contained on signature pages to the Registration Statement on Form S-1) | |
| * | To be filed by amendment. |
| ** | Previously Filed |
| † | Identifies exhibits that consist of a management contract or compensatory plan or arrangement. |
II-10