Attached files
| file | filename |
|---|---|
| EX-99.1 - EXHIBIT 99.1 - JONES LANG LASALLE INC | exhibit991firstquarter2015.htm |
| 8-K - 8-K - JONES LANG LASALLE INC | q12015earningrelease-form8k.htm |

Supplemental Information Earnings Call First-Quarter 2015

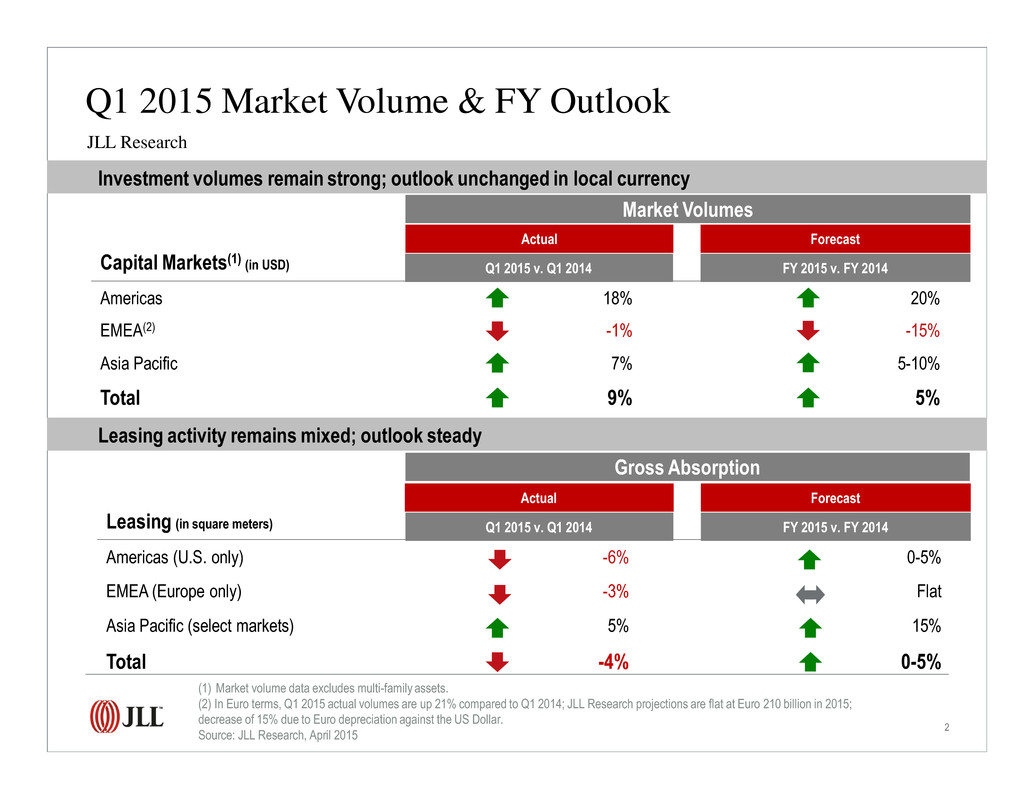
2 Capital Markets(1) (in USD) Americas 18% 20% EMEA(2) -1% -15% Asia Pacific 7% 5-10% Total 9% 5% Leasing activity remains mixed; outlook steady Leasing (in square meters) Americas (U.S. only) -6% 0-5% EMEA (Europe only) -3% Flat Asia Pacific (select markets) 5% 15% Total -4% 0-5% ForecastActual Gross Absorption Investment volumes remain strong; outlook unchanged in local currency Q1 2015 Market Volume & FY Outlook Q1 2015 v. Q1 2014 FY 2015 v. FY 2014 Market Volumes (1) Market volume data excludes multi-family assets. (2) In Euro terms, Q1 2015 actual volumes are up 21% compared to Q1 2014; JLL Research projections are flat at Euro 210 billion in 2015; decrease of 15% due to Euro depreciation against the US Dollar. Source: JLL Research, April 2015 JLL Research ForecastActual Q1 2015 v. Q1 2014 FY 2015 v. FY 2014

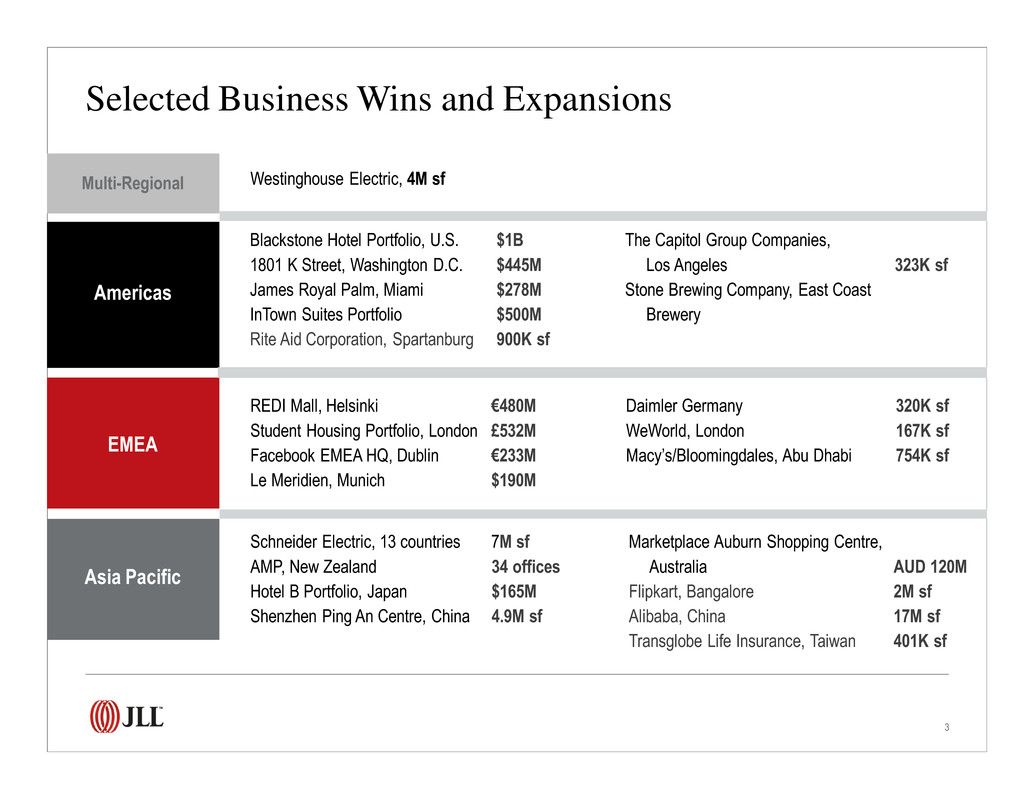
3 Multi-Regional Americas EMEA Asia Pacific Westinghouse Electric, 4M sf Blackstone Hotel Portfolio, U.S. $1B 1801 K Street, Washington D.C. $445M James Royal Palm, Miami $278M InTown Suites Portfolio $500M Rite Aid Corporation, Spartanburg 900K sf REDI Mall, Helsinki €480M Student Housing Portfolio, London £532M Facebook EMEA HQ, Dublin €233M Le Meridien, Munich $190M Schneider Electric, 13 countries 7M sf AMP, New Zealand 34 offices Hotel B Portfolio, Japan $165M Shenzhen Ping An Centre, China 4.9M sf The Capitol Group Companies, Los Angeles 323K sf Stone Brewing Company, East Coast Brewery Daimler Germany 320K sf WeWorld, London 167K sf Macy’s/Bloomingdales, Abu Dhabi 754K sf Marketplace Auburn Shopping Centre, Australia AUD 120M Flipkart, Bangalore 2M sf Alibaba, China 17M sf Transglobe Life Insurance, Taiwan 401K sf Selected Business Wins and Expansions

4 + 10-20% + 5-10% + 0-5% - 0-5% - 5-10% Prime Offices – 2015 Projected Changes in Values NOTES: *New York – Midtown, London – West End, Paris - CBD. Nominal rates in local currency. Source: JLL Research, April 2015 Tokyo San Francisco, Boston, Sydney London*, Chicago, Los Angeles New York*, Madrid, Beijing Hong Kong, Shanghai, Dubai, Toronto Washington DC, Mexico City, Stockholm, Seoul, Paris*, Brussels, Frankfurt Singapore, Mumbai, Sao Paulo Moscow Tokyo, Madrid Boston, San Francisco, London* Sydney, Chicago, Los Angeles New York*, Seoul, Beijing Toronto, Paris*, Shanghai, Frankfurt Dubai, Washington DC, Mexico City Stockholm, Brussels, Hong Kong Sao Paulo Rental Values Capital Values Singapore, Mumbai - 10-20% Moscow

5 Note: Equity earnings of $11.4M in Q1 2015, are included in segment results, however, excluded from Consolidated totals. Year-over-year increases shown fee-based have been calculated using fee revenue, which excludes gross contract vendor and subcontractor costs. YOY % Growth, Fee Revenue Basis Q1 2015 Segment LC USD Americas 25% 23% EMEA 25% 8% Asia Pacific 16% 8% LaSalle 43% 34% Consolidated 25% 17% Consolidated Gross Revenue 24% 16% Consolidated Fee - $1,029 Gross - $1,204 LaSalle $97 Asia Pac Fee - $188 Gross - $238 Americas Fee - $502 Gross - $555 EMEA Fee - $254 Gross - $325 Q1 2015 Revenue Q1 2015 Revenue Performance ($ in millions)

6 Note: Segment and Consolidated Real Estate Services (“RES”) operating revenue exclude Equity earnings (losses). Fee revenue presentation of Property & Facility Management, Project & Development Services and Total RES Operating Revenue excludes gross contract vendor and subcontractor costs. Leasing $229.3 n7up 23% $48.4 n7up 4% $28.4 n7up 9% $306.1 n7up 17% Capital Markets & Hotels $74.8 n7up 83% $75.2 n7up 59% $27.4 n7up 38% $177.4 n7up 64% Property & Facility Management - Fee $114.2 n7up 10% $51.6 n7up 14% $94.0 n7up 13% $259.8 n7up 12% Gross Revenue $166.4 n7up 18% $74.8 n7up 11% $131.5 n7up 14% $372.7 n7up 15% Project & Development Services - Fee $52.7 n7up 21% $31.2 n7up 27% $17.3 n7up 31% $101.2 n7up 24% Gross Revenue $53.4 n7up 20% $79.9 n7up 17% $29.4 n7up 42% $162.7 n7up 22% Advisory, Consulting & Other $30.3 n7up 14% $47.5 n7up 20% $21.1 n7up 5% $98.9 n7up 15% Total RES Operating Fee Revenue $501.3 n7up 25% $253.9 n7up 25% $188.2 n7up 16% $943.4 n7up 23% Total Gross Revenue $554.2 n7up 26% $325.8 n7up 21% $237.8 n7up 18% $1,117.8 n7up 23% Americas EMEA Asia Pacific Total RES Q1 2015 Real Estate Services Revenue ($ in millions; % change in local currency over Q1 2014)

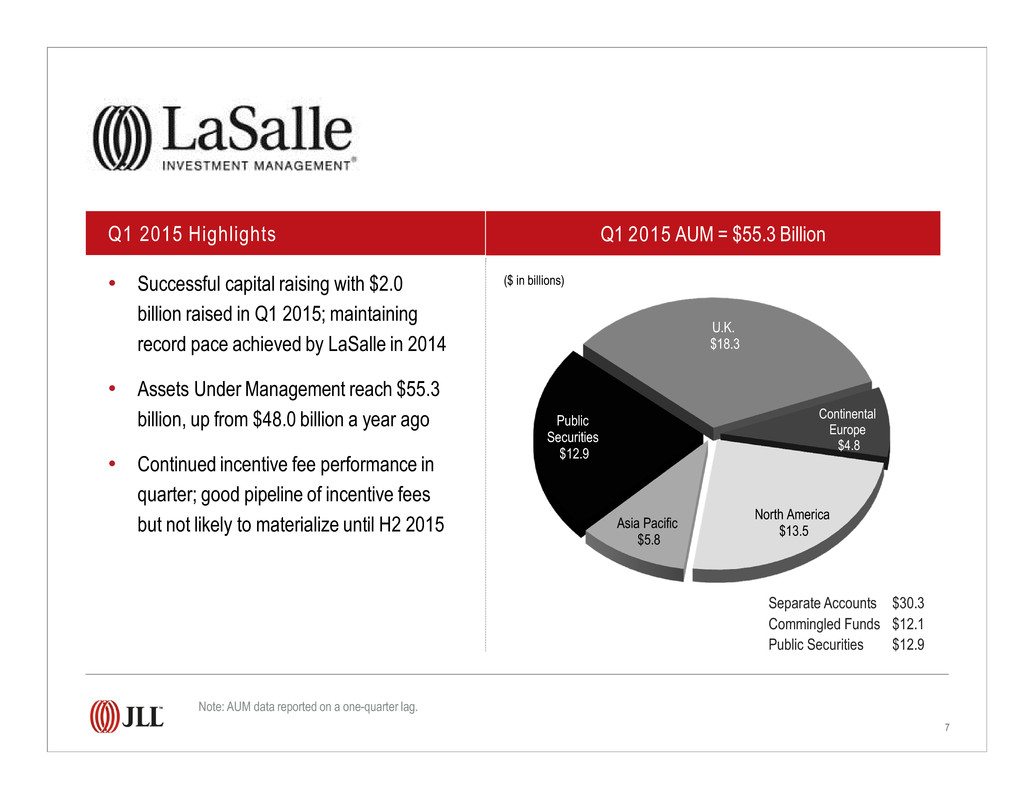
7 • Successful capital raising with $2.0 billion raised in Q1 2015; maintaining record pace achieved by LaSalle in 2014 • Assets Under Management reach $55.3 billion, up from $48.0 billion a year ago • Continued incentive fee performance in quarter; good pipeline of incentive fees but not likely to materialize until H2 2015 Separate Accounts $30.3 Commingled Funds $12.1 Public Securities $12.9 Q1 2015 Highlights Q1 2015 AUM = $55.3 Billion ($ in billions) Note: AUM data reported on a one-quarter lag. U.K. $18.3 Continental Europe $4.8 North America $13.5 Asia Pacific$5.8 Public Securities $12.9

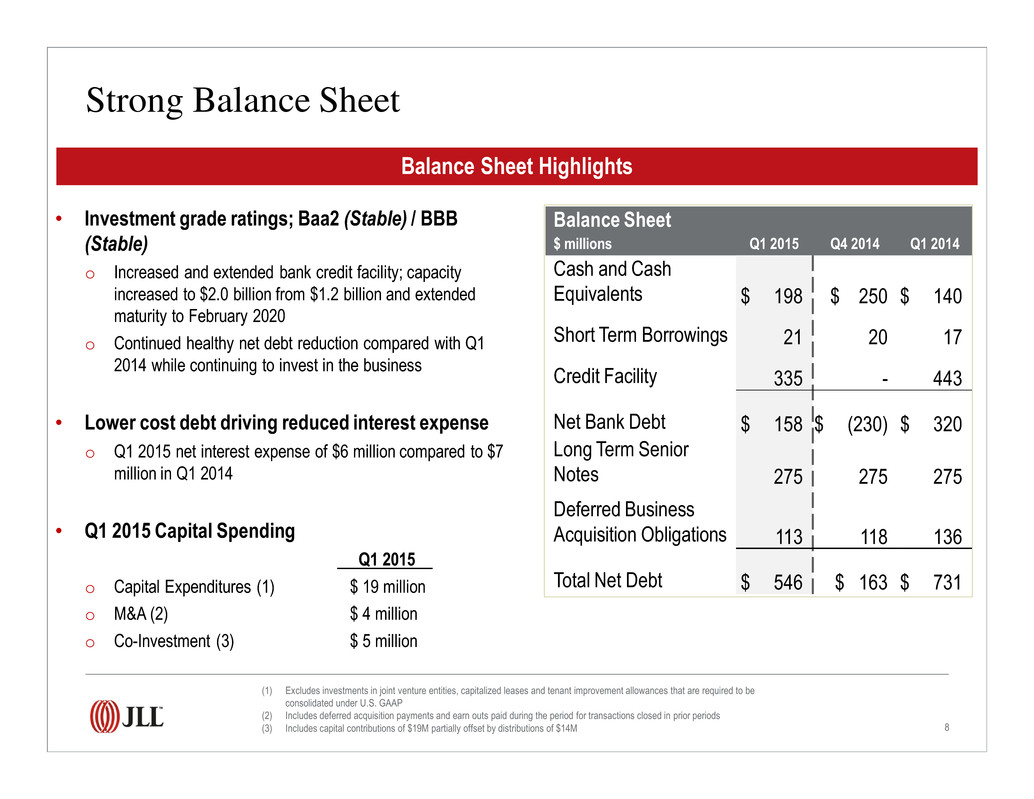
8 • Investment grade ratings; Baa2 (Stable) / BBB (Stable) o Increased and extended bank credit facility; capacity increased to $2.0 billion from $1.2 billion and extended maturity to February 2020 o Continued healthy net debt reduction compared with Q1 2014 while continuing to invest in the business • Lower cost debt driving reduced interest expense o Q1 2015 net interest expense of $6 million compared to $7 million in Q1 2014 • Q1 2015 Capital Spending Q1 2015 . o Capital Expenditures (1) $ 19 million o M&A (2) $ 4 million o Co-Investment (3) $ 5 million Balance Sheet $ millions Q1 2015 Q4 2014 Q1 2014 Cash and Cash Equivalents $ 198 $ 250 $ 140 Short Term Borrowings 21 20 17 Credit Facility 335 - 443 Net Bank Debt $ 158 $ (230) $ 320 Long Term Senior Notes 275 275 275 Deferred Business Acquisition Obligations 113 118 136 Total Net Debt $ 546 $ 163 $ 731 Balance Sheet Highlights Strong Balance Sheet (1) Excludes investments in joint venture entities, capitalized leases and tenant improvement allowances that are required to be consolidated under U.S. GAAP (2) Includes deferred acquisition payments and earn outs paid during the period for transactions closed in prior periods (3) Includes capital contributions of $19M partially offset by distributions of $14M

9 Appendix

10 Prime Offices – Capital Value Clock, Q1 2014 v Q1 2015 Based on notional capital values for Grade A space in CBD or equivalent. US positions relate to the overall market Source: JLL Research, April 2015 Americas EMEA Asia Pacific The Jones Lang LaSalle Property Clocks SM Capital Value growth slowing Capital Value growth accelerating Capital Values bottoming out Capital Values falling Hong Kong, Houston, Toronto Singapore, Mexico City, Washington DC Shanghai London, Paris Beijing, Seoul Amsterdam Brussels, Milan Madrid Berlin, New York Chicago, Los Angeles Sydney, Dallas Sao Paulo Moscow Mumbai Sao Paulo Stockholm Capital Value growth slowing Capital Value growth accelerating Capital Values bottoming out Capital Values falling Amsterdam, Madrid Brussels London Milan Paris Mexico City, Moscow Stockholm Tokyo Beijing Dallas, Seoul Singapore Washington DC Toronto Hong Kong Mumbai New York, Chicago Boston, Los Angeles Frankfurt, Boston, San Francisco Tokyo Q1 2015Q1 2014 Berlin, Sydney, Shanghai San Francisco Houston, Frankfurt

11 Prime Offices – Rental Clock, Q1 2014 v Q1 2015 Based on rents for Grade A space in CBD or equivalent. US positions relate to the overall market Source: JLL Research, April 2015 Americas EMEA Asia Pacific The Jones Lang LaSalle Property Clocks SM Q1 2015 Rental Value growth slowing Rental Value growth accelerating Rental Values bottoming out Rental Values falling Q1 2014 Sao Paulo New York Stockholm Hong Kong, Beijing Berlin Dubai, Milan Chicago Johannesburg Shanghai, Houston San Francisco Dallas London, Los Angeles Tokyo, Boston Rental Value growth slowing Rental Value growth accelerating Rental Values bottoming out Rental Values falling Brussels, Paris, Madrid, Beijing, Hong Kong, Sydney Singapore Seoul Boston, Los Angeles Istanbul Shanghai Amsterdam Johannesburg London Milan Moscow Chicago, Dubai Washington DC Houston Toronto Mexico City Sao Paulo Dallas San Francisco Berlin, Frankfurt New York Stockholm, Tokyo Amsterdam Frankfurt Madrid, Sydney Singapore Toronto Mexico City Mumbai Mumbai Paris, Brussels, Istanbul Washington DC Seoul Moscow

12 Refer to page 16 for Reconciliation of GAAP Net Income to Adjusted EBITDA for the three months ended March 31, 2015, for details relative to these Adjusted EBITDA calculations. Segment Adjusted EBITDA is calculated by adding the segment’s depreciation and amortization to its reported operating income, which excludes restructuring and acquisition charges. Consolidated Adjusted EBITDA is the sum of the Adjusted EBITDA of the four segments. Consolidated $90 Q1 2015 Adjusted EBITDA Q1 2015 Adjusted EBITDA Performance Asia Pac $8 LaSalle $29 Americas $51 EMEA $2 ($ in millions) Adj. EBITDA Margin Fee Q1 2015 Segment LC USD Americas 10.0% 10.2% EMEA 1.8% 0.9% Asia Pacific 4.7% 4.3% LaSalle 29.0% 29.2% Consolidated 8.7% 8.7%

13 Note: Segment and Consolidated Real Estate Services (“RES”) operating revenue exclude Equity earnings (losses). Fee revenue presentation of Property & Facility Management, Project & Development Services and Total RES Operating Revenue excludes gross contract costs. Q1 2015 Real Estate Services Revenue ($ in millions; % change in USD over Q1 2014) Leasing $229.3 n7up 22% $48.4 n7down (11%) $28.4 n7up 4% $306.1 n7up 14% Capital Markets & Hotels $74.8 n7up 82% $75.2 n7up 38% $27.4 n7up 26% $177.4 n7up 51% Property & Facility Management - Fee $114.2 n7up 8% $51.6 n7down (1%) $94.0 n7up 6% $259.8 n7up 5% Gross Revenue $166.4 n7up 14% $74.8 n7down (2%) $131.5 n7up 8% $372.7 n7up 8% Project & Development Services - Fee $52.7 n7up 18% $31.2 n7up 9% $17.3 n7up 23% $101.2 n7up 16% Gross Revenue $53.4 n7up 18% $79.9 n7down (3%) $29.4 n7up 34% $162.7 n7up 9% Advisory, Consulting & Other $30.3 n7up 13% $47.5 n7up 7% $21.1 n7down (2%) $98.9 n7up 7% Total RES Operating Fee Revenue $501.3 n7up 23% $253.9 n7up 8% $188.2 n7up 8% $943.4 n7up 16% Total Gross Revenue $554.2 n7up 24% $325.8 n7up 4% $237.8 n7up 11% $1,117.8 n7up 15% Americas EMEA Asia Pacific Total RES

14 • Reimbursable vendor, subcontractor and out-of-pocket costs reported as revenue and expense in JLL financial statements have been increasing steadily • Gross accounting requirements increase revenue and costs without corresponding profit • Business managed on a fee revenue basis to focus on margin expansion in the base business Revenue Gross contract costs Fee revenue Operating expenses Gross contract costs Fee-based operating expenses Operating income (loss) Restructuring and acquisition charges Adjusted operating income Adjusted operating income margin Fee Revenue / Expense Reconciliation ($ in millions) $1,203.5 (174.4) $1,029.1 $1,150.9 (174.4) $976.5 $52.6 0.8 $53.4 5.2% $1,037.4 (159.6) $877.8 $1,052.7 (159.6) $893.1 ($15.3) 36.0 $20.7 2.4% Note: Consolidated revenue and fee revenue exclude equity earnings (losses). Restructuring and acquisition charges are excluded from adjusted operating income margin. Three Months Ended March 31 2015 2014

15 Three Months Ended March 31 2015 2014 Reconciliation of GAAP Net Income to Adjusted Net Income and Earnings per Share ($ in millions, except per share data) $41.9 45,374 $0.92 $41.9 0.6 $42.5 45,374 $0.94 $15.9 45,202 $0.35 $15.9 1.1 $17.0 45,202 $0.38 GAAP net income attributable to common shareholders Shares (in 000s) GAAP diluted earnings per share GAAP net income attributable to common shareholders Restructuring and acquisition charges, net Adjusted net income Shares (in 000s) Adjusted diluted earnings per share

16 Three Months Ended March 31 2015 2014 $43.3 6.0 14.7 24.9 $88.9 0.8 $89.7 $16.1 6.6 (29.1) 22.4 $16.0 36.0 $52.0 Reconciliation of GAAP Net Income to Adjusted EBITDA ($ in millions) GAAP net income Interest expense, net of interest income Provision for (benefit from) income taxes Depreciation and amortization EBITDA Restructuring and acquisition charges Adjusted EBITDA JLL is the brand name, and a registered trademark, of Jones Lang LaSalle Incorporated.
