Attached files
| file | filename |
|---|---|
| 8-K - 8-K - Federal Home Loan Bank of Boston | a15-9672_18k.htm |
| EX-99.1 - EX-99.1 - Federal Home Loan Bank of Boston | a15-9672_1ex99d1.htm |
Exhibit 99.2
|
|
82nd Annual Shareholders Meeting April 24, 2015 |

|
|
Andy Calamare: Welcome and Introduction Ed Hjerpe: State of the Bank The New Face of Bipartisanship: John Avlon & Margaret Hoover, moderated by Neil Levesque Today’s Agenda For your convenience, a copy of this presentation is available at fhlbboston.com 1 |

|
|
82nd Annual Shareholders Meeting April 24, 2015 |
|
|
Cautionary Statements Regarding Forward-Looking Statements, Data, and Adjusted Information Forward-looking statements: This presentation, including the preliminary and unaudited first quarter 2014 highlights herein, uses forward-looking statements within the meaning of the "safe harbor" provisions of the Private Securities Litigation Reform Act of 1995 and are based on our expectations as of the date hereof. The words “preliminary,” “will,” “may,” “expect,” “anticipate,” “outlook,” “appear,” and similar statements and their plural, negative, past, and progressive forms as well as statements about expected developments for housing GSE reform, economic changes, housing sector projections, advances balances, and investment risk are used in this presentation to identify some, but not all, of such forward-looking statements. We caution that, by their nature, forward-looking statements involve risks and uncertainties, including, but not limited to, the application of accounting standards relating to, among other things, the amortization of discounts and premiums on financial assets, financial liabilities, and certain fair-value gains and losses; hedge accounting of derivatives and underlying financial instruments; the fair values of financial instruments, including investment securities and derivatives; and other-than-temporary impairment of investment securities, in addition to instability in the credit and debt markets, economic conditions (including effects on, among other things, mortgage-backed securities), changes in interest rates, and prepayment spreads on mortgage assets. We do not undertake to update any forward-looking statement herein or that may be made from time to time on our behalf. Data: Some data set forth herein is unaudited. Data identified herein with a third-party source is provided to you without any independent verification by the Bank, and the Bank expressly disclaims any responsibility for, its accuracy, completeness or whether any additional information is necessary to make such data not materially misleading. Accordingly, you are cautioned against placing any undue reliance on such data. Non-GAAP financial information: This presentation uses non-GAAP financial information. Specifically, the Bank adjusts GAAP net income for the impact of Affordable Housing Program (AHP) and other-than-temporary impairment (OTTI) charges. Management believes this information may be informative to investors in gauging the Bank’s financial performance, identifying trends, and providing meaningful period-to-period comparisons. Annual Report: You are encouraged to read our Annual Report on Form 10-K to better understand the information in this presentation. A link to that report is available on the Security and Exchange Commission’s web site, www.sec.gov. 3 |
|
|
Our Dedicated Staff Recent Financial Results Regulatory and Legislative Update Affordable Housing Program 25th Anniversary Making the Most of Your Membership 4 State of the Bank |
|
|
Our Dedicated Staff |

|
|
Carol Hempfling Pratt General Counsel Timothy J. Barrett Treasurer Barry F. Gale Executive Director of HR George H. Collins Chief Risk Officer M. Susan Elliott Chief Business Officer Frank Nitkiewicz Chief Financial Officer Sean McRae Chief Information Officer 6 Our Management Committee |

|
|
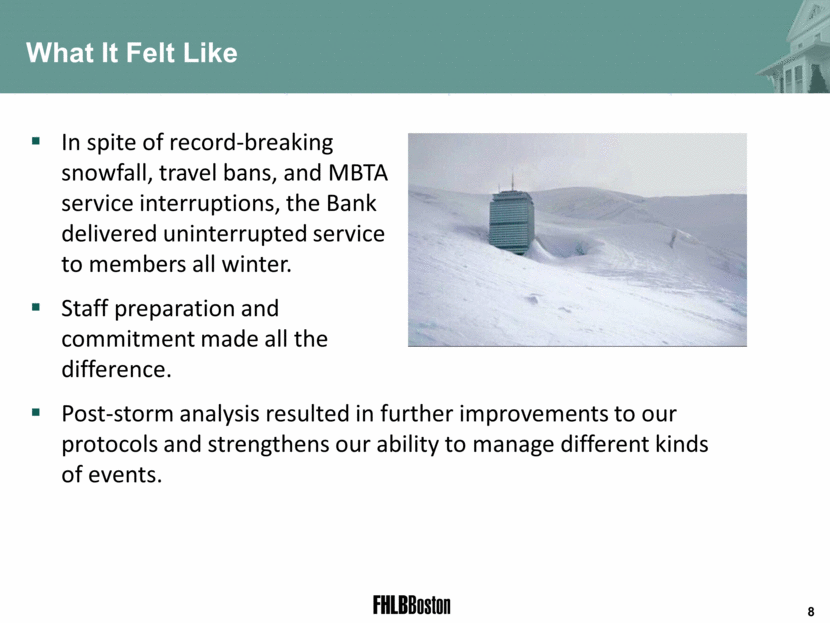
The Winter of 2015: What It Looked Like . 7 |

|
|
In spite of record-breaking snowfall, travel bans, and MBTA service interruptions, the Bank delivered uninterrupted service to members all winter. Staff preparation and commitment made all the difference. Post-storm analysis resulted in further improvements to our protocols and strengthens our ability to manage different kinds of events. What It Felt Like 8 |
|
|
Membership Information and Research Manager VP / Collateral Relationship Manager Senior Analyst Membership Applications Manager Bank Operations Specialist Community Development Advance Manager 9 Thank You for 30 Years of Service Beth Nadeau |

|
|
Recent Financial Results |

|
|
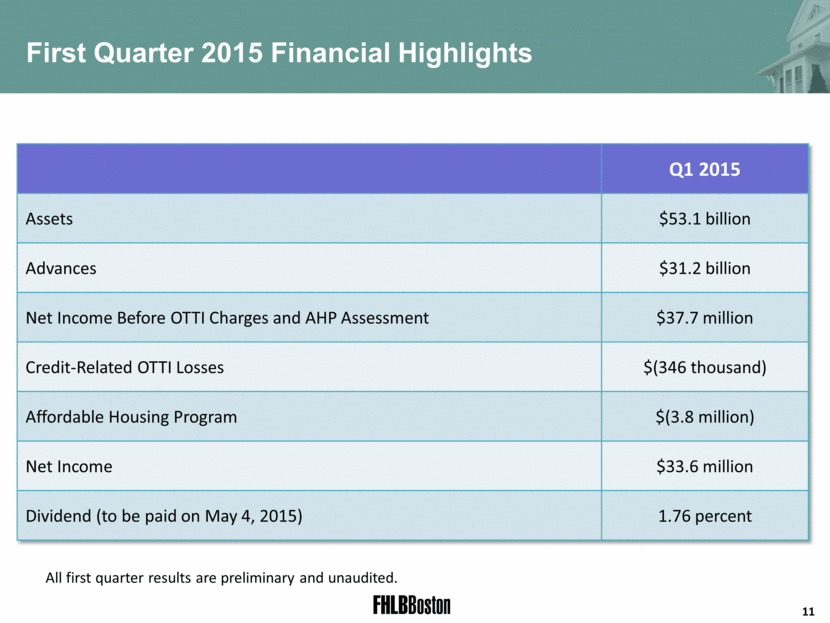
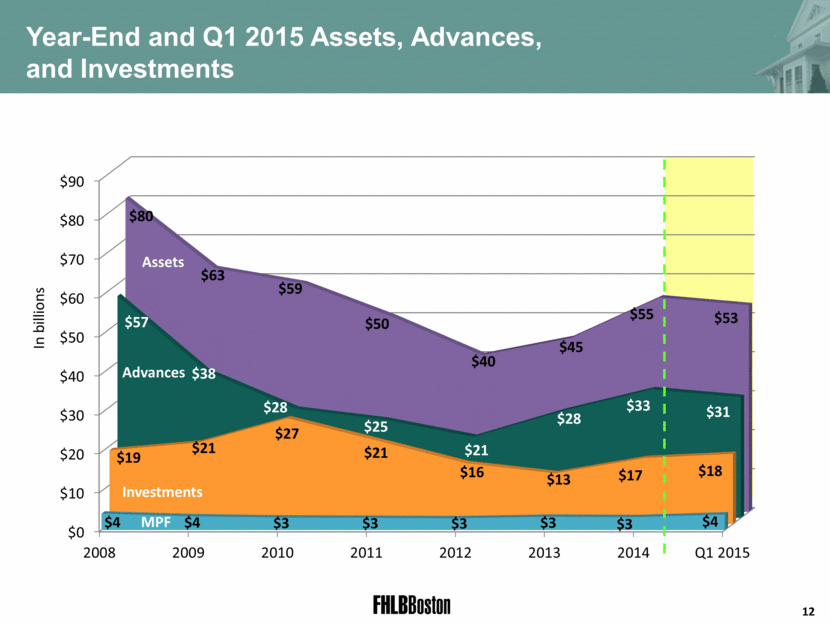
Q1 2015 Assets $53.1 billion Advances $31.2 billion Net Income Before OTTI Charges and AHP Assessment $37.7 million Credit-Related OTTI Losses $(346 thousand) Affordable Housing Program $(3.8 million) Net Income $33.6 million Dividend (to be paid on May 4, 2015) 1.76 percent 11 First Quarter 2015 Financial Highlights All first quarter results are preliminary and unaudited. |
|
|
12 Year-End and Q1 2015 Assets, Advances, and Investments In billions MPF Advances Assets Investments MPF |
|
vn |
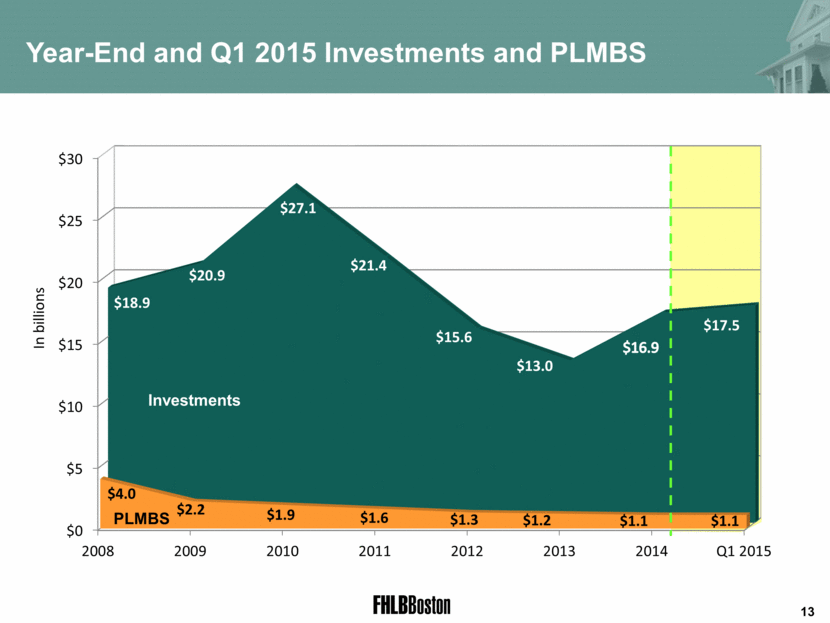
Year-End and Q1 2015 Investments and PLMBS In billions 13 |
|
|
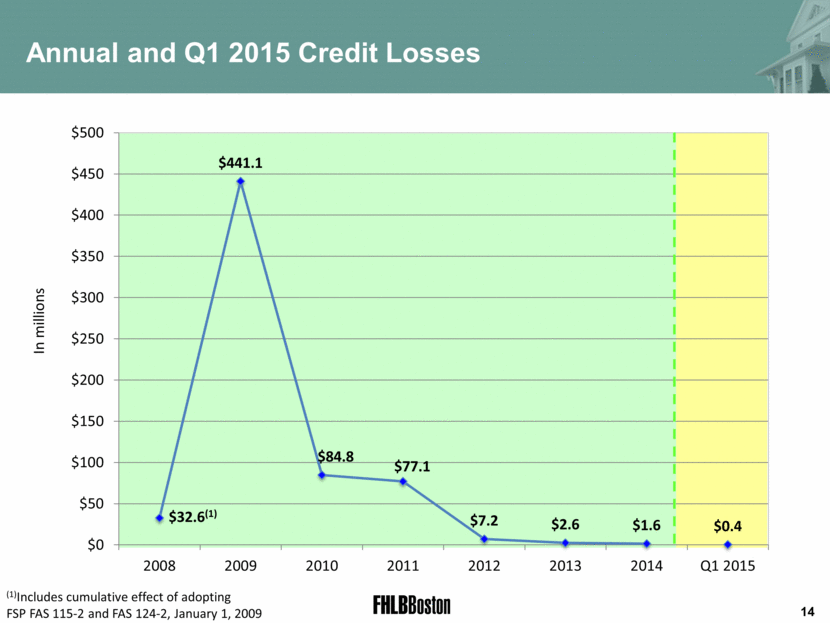
Annual and Q1 2015 Credit Losses (1)Includes cumulative effect of adopting FSP FAS 115-2 and FAS 124-2, January 1, 2009 In millions 14 |
|
|
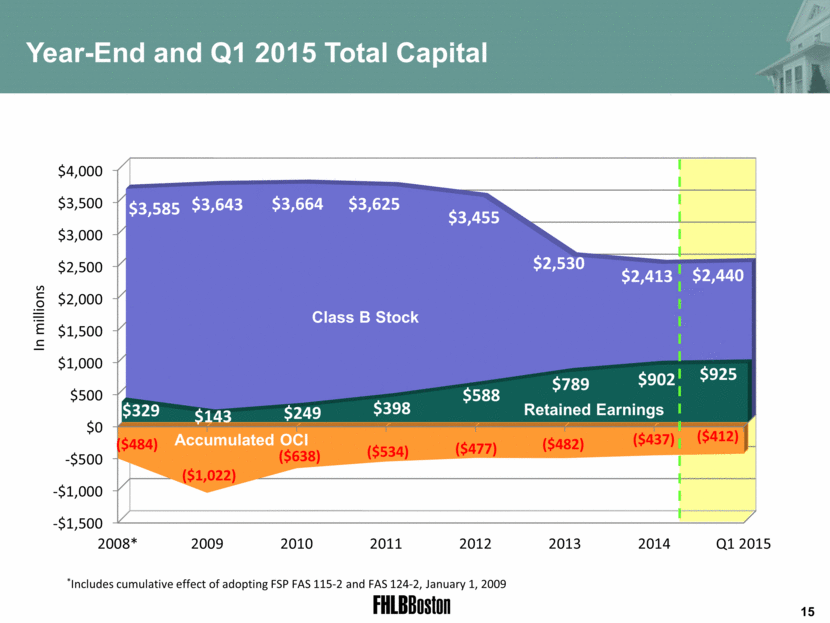
Year-End and Q1 2015 Total Capital In millions 15 |
|
|
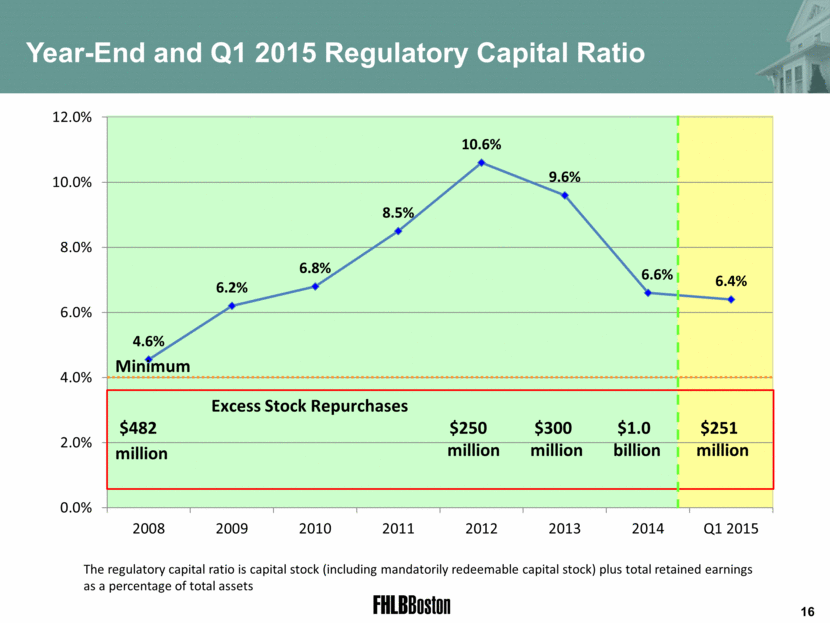
The regulatory capital ratio is capital stock (including mandatorily redeemable capital stock) plus total retained earnings as a percentage of total assets Year-End and Q1 2015 Regulatory Capital Ratio Minimum 16 |
|
|
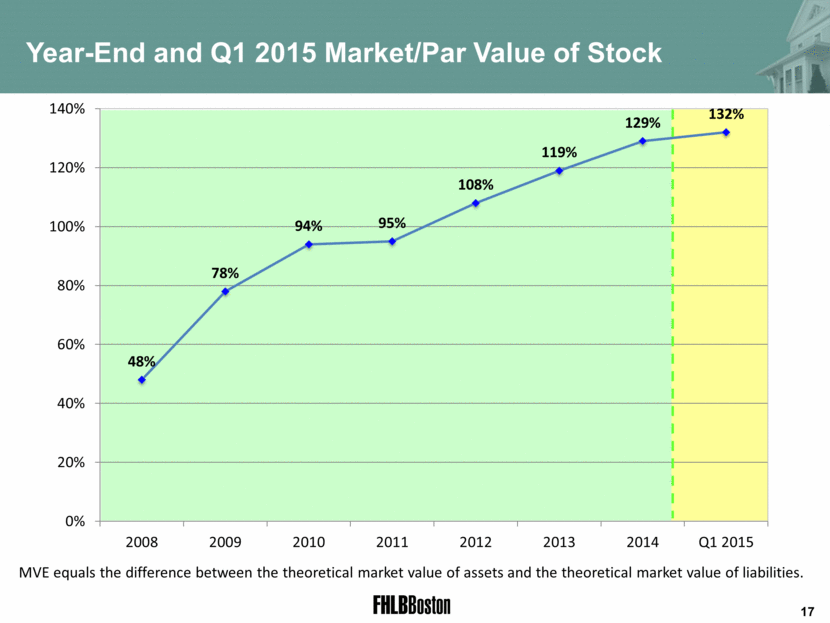
Year-End and Q1 2015 Market/Par Value of Stock MVE equals the difference between the theoretical market value of assets and the theoretical market value of liabilities. 17 |
|
|
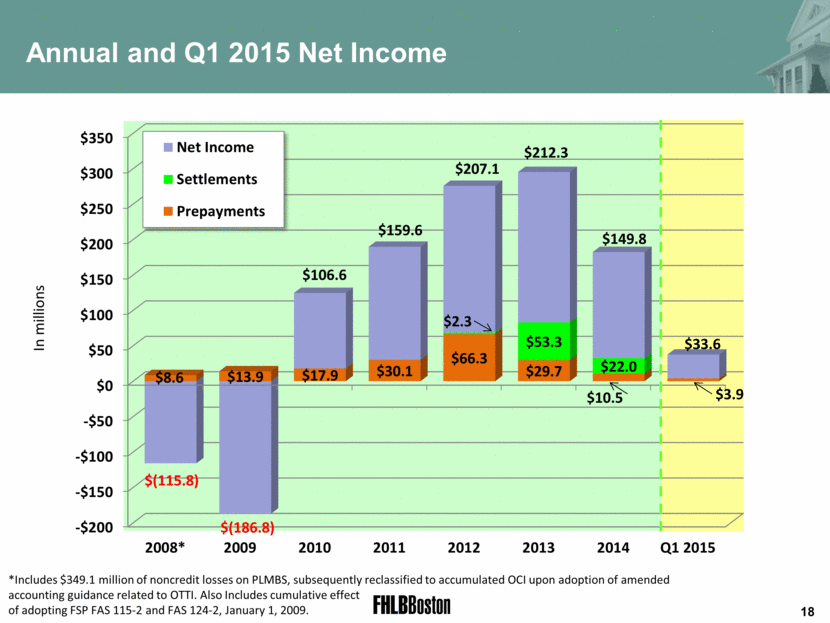
Annual and Q1 2015 Net Income *Includes $349.1 million of noncredit losses on PLMBS, subsequently reclassified to accumulated OCI upon adoption of amended accounting guidance related to OTTI. Also Includes cumulative effect of adopting FSP FAS 115-2 and FAS 124-2, January 1, 2009. In millions 18 -$200 -$150 -$100 -$50 $0 $50 $100 $150 $200 $250 $300 $350 2008* 2009 2010 2011 2012 2013 2014 Q1 2015 $8.6 $13.9 $17.9 $30.1 $66.3 $29.7 $10.5 $3.9 $2.3 $53.3 $22.0 $(115.8 ) $( 186.8) $106.6 $159.6 $207.1 $212.3 $149.8 $33.6 Net Income Settlements Prepayments |
|
|
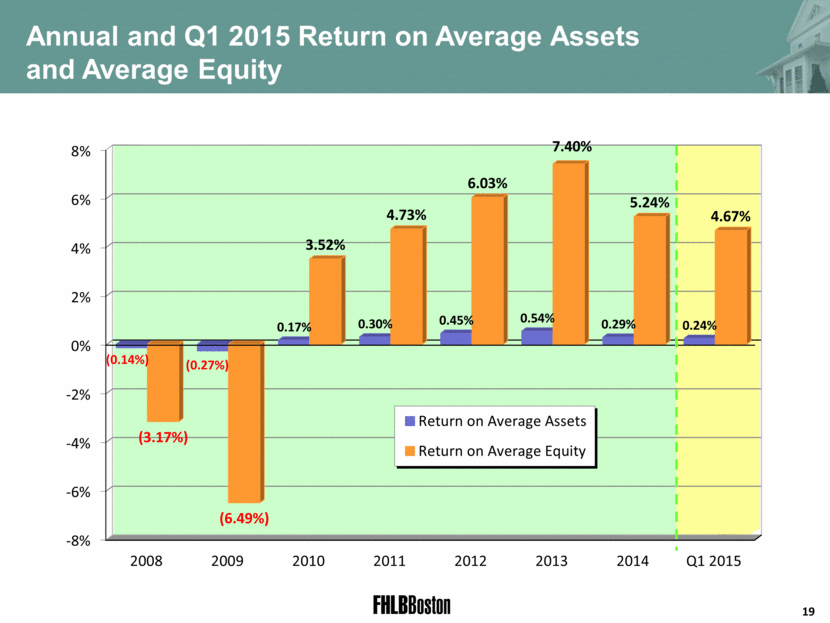
19 Annual and Q1 2015 Return on Average Assets and Average Equity -8% -6% -4% -2% 0% 2% 4% 6% 8% 2008 2009 2010 2011 2012 2013 2014 Q1 2015 (0.14%) (0.27%) 0.17% 0.30% 0.45% 0.54% 0.29% 0.24% (3.17%) (6.49%) 3.52% 4.73% 6.03% 7.40% 5.24% 4.67% Return on Average Assets Return on Average Equity |
|
|
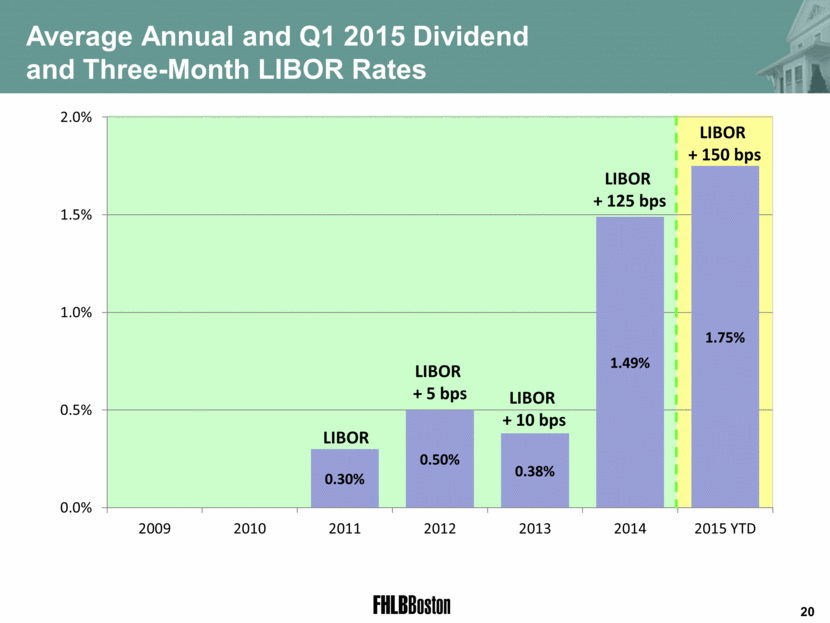
20 Average Annual and Q1 2015 Dividend and Three-Month LIBOR Rates LIBOR LIBOR + 5 bps LIBOR + 10 bps LIBOR + 125 bps LIBOR + 150 bps |
|
|
Regulatory and Legislative Update |
|
|
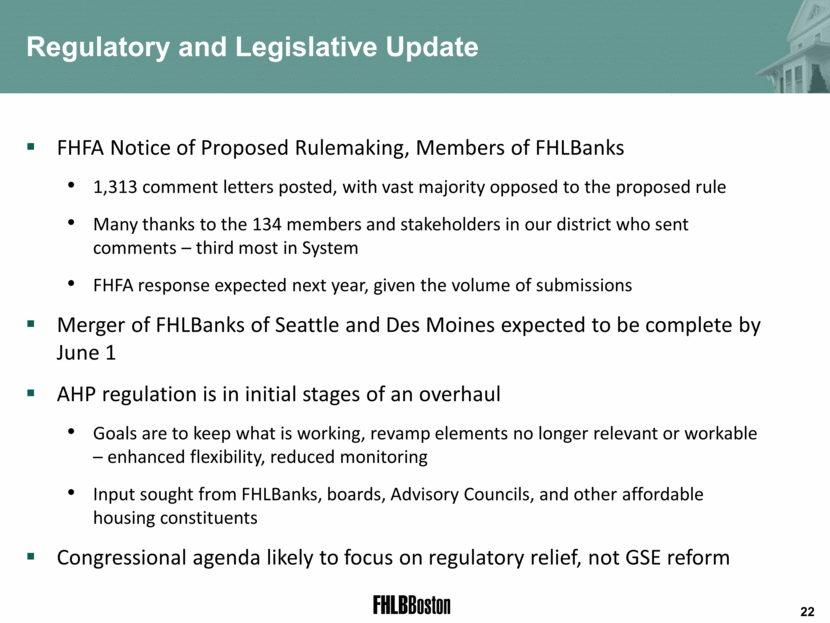
FHFA Notice of Proposed Rulemaking, Members of FHLBanks 1,313 comment letters posted, with vast majority opposed to the proposed rule Many thanks to the 134 members and stakeholders in our district who sent comments – third most in System FHFA response expected next year, given the volume of submissions Merger of FHLBanks of Seattle and Des Moines expected to be complete by June 1 AHP regulation is in initial stages of an overhaul Goals are to keep what is working, revamp elements no longer relevant or workable – enhanced flexibility, reduced monitoring Input sought from FHLBanks, boards, Advisory Councils, and other affordable housing constituents Congressional agenda likely to focus on regulatory relief, not GSE reform 22 Regulatory and Legislative Update |
|
|
Affordable Housing Program 25th Anniversary |
|
|
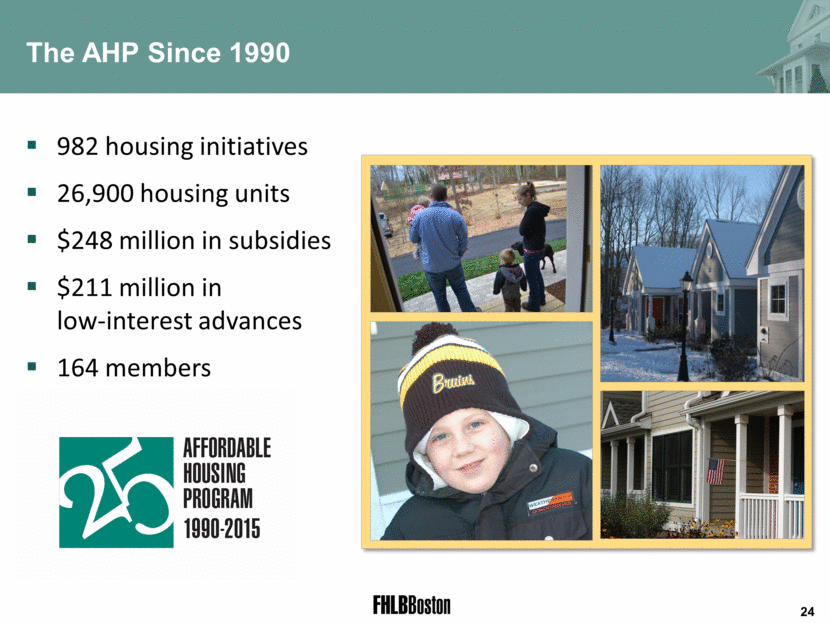
982 housing initiatives 26,900 housing units $248 million in subsidies $211 million in low-interest advances 164 members 24 The AHP Since 1990 |
|
|
Making the Most of Your Membership |

|
|
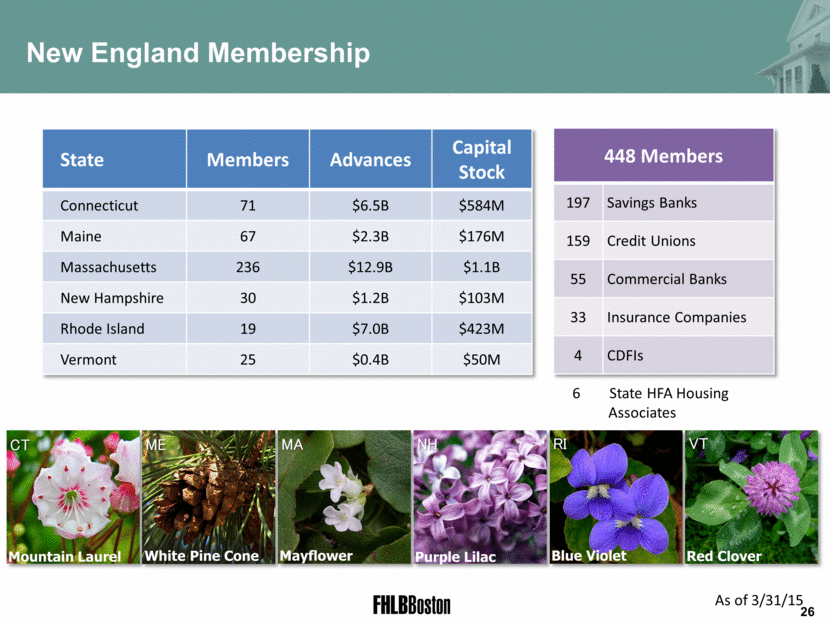
State Members Advances Capital Stock Connecticut 71 $6.5B $584M Maine 67 $2.3B $176M Massachusetts 236 $12.9B $1.1B New Hampshire 30 $1.2B $103M Rhode Island 19 $7.0B $423M Vermont 25 $0.4B $50M New England Membership 448 Members 197 Savings Banks 159 Credit Unions 55 Commercial Banks 33 Insurance Companies 4 CDFIs Mountain Laurel White Pine Cone Mayflower Purple Lilac Blue Violet Red Clover CT ME MA NH RI VT As of 3/31/15 6 State HFA Housing Associates 26 |
|
|
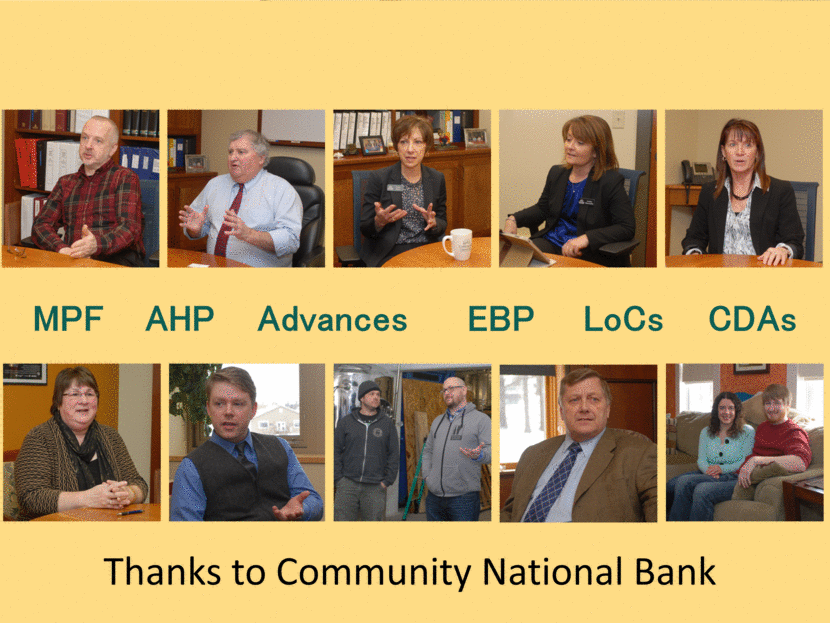
Advances LoCs MPF AHP EBP CDAs Thanks to Community National Bank |
|
|
Online initiation of Daily Cash Manager through Direct+ Expanded collateral options and valuation More flexibility for prepaying short-term and floating-rate advances Long-term advance specials to help you optimize liability extension Enhanced variable letter of credit MPF Direct™ unveiled for high-balance fixed-rate mortgage loan purchases Also reinitiated our outreach to New England HFAs and exploring ways to expand our involvement in the region’s community and economic development 28 Recent Initiatives to Enhance Membership |
|
|
Let us know what new solutions you need to succeed We value the input of our depository and insurance Member Advisory Panels – MAPs – whose ideas often become new products and services Member meetings – CEO/CFO roundtable discussion, FHLB On the Road sessions, information exchanges, webinars, trainings Upcoming opportunities for dialog and education May 29: Member Information Exchange June 15: Member Outreach/Golf at Rhode Island CC, Barrington, Rhode Island September 28: Member Outreach/Golf at Brae Burn CC, Newton, Massachusetts November 18: FHLB on the Road, Augusta, Maine 29 We Encourage Your Participation |

|
|
We continue to be your reliable business partner that provides the liquidity, term funding, and business solutions you need in all economic environments. We continue to provide a stable and growing return on your investment. We encourage you to take advantage of our many resources to help you manage your balance sheet and help the communities you serve prosper and grow. 30 What Can Your Cooperative Do for You? |

|
|
82nd Annual Shareholders Meeting April 24, 2015 |