Attached files
| file | filename |
|---|---|
| 8-K - FORM 8-K - IBERIABANK CORP | d914559d8k.htm |
| EX-99.1 - EXHIBIT 99.1 - IBERIABANK CORP | d914559dex991.htm |
 MAKING
THE MOST OF IT 1Q15 Earnings Conference Call
Supplemental Presentation
Exhibit 99.2
April 22, 2015 |
| Safe
Harbor And Legend 2
To the extent that statements in this press release and the accompanying PowerPoint presentation
relate to future plans, objectives, financial results or performance of IBERIABANK Corporation, these
statements are deemed to be forward-looking statements within the meaning of the Private
Securities Litigation Reform Act of 1995. Such statements, which are based on management’s
current information, estimates and assumptions and the current economic environment, are
generally identified by the use of the words “plan”, “believe”, “expect”,
“intend”, “anticipate”, “estimate”, “project” or similar
expressions. The Company’s actual strategies, results and financial condition in future
periods may differ materially from those currently expected due to various risks and
uncertainties. Forward-looking statements are subject to numerous assumptions, risks and
uncertainties that change over time and could cause actual results or financial condition to
differ materially from those expressed in or implied by such statements. Consequently, no
forward-looking statement can be guaranteed. In connection with the proposed merger with Georgia Commerce Bancshares, Inc., IBERIABANK
Corporation has filed a Registration Statement on Form S-4 that contains a proxy
statement/prospectus. INVESTORS AND SECURITY HOLDERS ARE URGED TO CAREFULLY READ THE PROXY
STATEMENT/ PROSPECTUS REGARDING THE PROPOSED TRANSACTION BECAUSE SUCH DOCUMENTS WILL
CONTAIN IMPORTANT INFORMATION. Investors and security holders may obtain a free copy of the proxy
statement/prospectus and other documents containing information about the pending transaction
with Georgia Commerce Bancshares, Inc., without charge, at the SEC’s website at
http://www.sec.gov. Copies of the proxy statement /prospectus and the SEC filing that is
incorporated by reference in the proxy statement/prospectus may also be obtained for free from
the IBERIABANK Corporation website, www.iberiabank.com, under the heading “Investor
Information”. This communication is not a solicitation of any vote or approval, is not an offer to purchase shares
of common stock of Georgia Commerce Bancshares, Inc., nor is it an offer to sell shares of
IBERIABANK Corporation common stock which may be issued in the proposed merger. The
issuance of IBERIABANK Corporation common stock in any proposed merger would have to be
registered under the Securities Act of 1933, as amended, and such IBERIABANK Corporation common
stock would be offered only by means of a prospectus complying with the Securities Act of 1933,
as amended. |
 •
Reported EPS of $0.75 (down $0.32 from 4Q14) and non-GAAP operating EPS of $0.95
(down $0.10 from 4Q14) •
Tax
equivalent
net
interest
income
increased
$1.1
million,
or
1%
from
4Q14,
while
average
earning
assets
increased $312 million, or 2%
•
Completed
the
acquisitions
of
Florida
Bank
Group
and
Old
Florida
during
the
quarter.
Converted
Florida
Bank
Group
over
the
weekend
of
March
13th.
Anticipate
conversions
of
Old
Florida
Bank
and
New
Traditions
Bank
during 2Q15
•
Pending shareholder approval, anticipate closing of Georgia Commerce Bancshares,
Inc. acquisition on May 31, 2015 and converting and integrating within the
next 70 days •
Legacy loan growth:
•
Legacy deposit growth:
•
Net
interest
margin
increased
one
basis
point
to
3.54%,
slightly
above
management’s
expectations
•
Significant operating influences:
•
Seasonality
•
Timing
•
Non-recurring expense
•
Energy-related provisions
Overview
Introductory Comments –
First Quarter 2015
$181
million
since
December
31,
2014
(+7%
annualized),
including
$69
million
of
commercial and $112 million of small business and consumer
Energy-related
loans
down
$61
million
or
7%
and
indirect
loans
down
$30
million
or
8%
Growth in the legacy loan portfolio was commercial 38%, small business 22%,
consumer 25%, and mortgage 14%
$351 million since December 31, 2014 (+11% annualized)
$212 million increase in legacy non-interest bearing deposits (+27%
annualized) 3 |
 Overview
Energy Update
Our overall outlook on our energy portfolio is generally consistent with
views
expressed
at
our
February
27,
2015
Analyst-Investor
Day
•
What we are seeing now:
•
Access to the capital markets has
recently increased for many E&P
companies
•
Oil prices have increased
significantly
•
Total outstandings down $61 million or
6.7%
•
We are approximately 40% of the way
through spring redeterminations. All
clients are within their borrowing
bases.
•
In the portfolio at quarter-end:
•
One $40,000 loan on non-
accrual; no others classified or
worse
•
Only one loan, with less than $4
million outstanding, was rated
Special Mention
4 |
 Overview
Non-Performing Assets Trends
$ in millions
NPA determination based on regulatory guidance for Acquired portfolios
1Q15 includes $14 million of bank-related properties reclassified to OREO
Energy loans
classified as non-
performing assets at
March 31, 2015
totaled only $40,000
Legacy includes
Increase due to
two legacy
credits (not
energy-related)
Prior Period NPAs
Acquired during 1Q15
Transfer from Covered
Components of 1Q15 Non-Covered Acquired
5 |
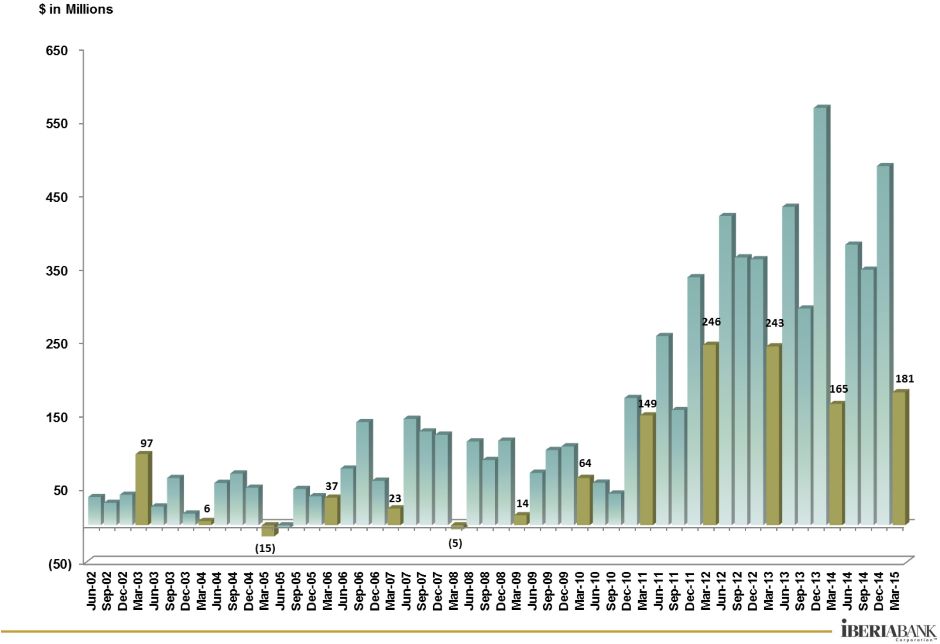 6
Seasonal Influences
Quarterly Organic Loan Growth
•
The first quarter of each year tends to exhibit slower loan
growth than other quarters due to seasonal factors
•
1Q15 net organic loan growth of $181 million, or +7%
annualized growth; includes $61 million decline in energy
loans and $30 million decline in indirect auto loans
•
1Q15 organic growth consistent with historical seasonal
trends
•
Anticipated run-rate decline of indirect auto portfolio is
approximately $45 million per quarter |
 Excludes acquired deposits
Seasonal Influences
Deposit Growth
$ in millions
•
Increase of $2.1
billion, or 17%, in
1Q15
•
Deposits acquired
from Florida Bank
Group and Old
Florida acquisitions
equated to $1.8
billion
•
$669 million (+21%)
growth in total non-
interest bearing
deposits for 1Q15,
including $457
million of acquired
non-interest bearing
deposits
Total Deposit Growth
Very strong
transaction account
growth in 4Q12
7 |
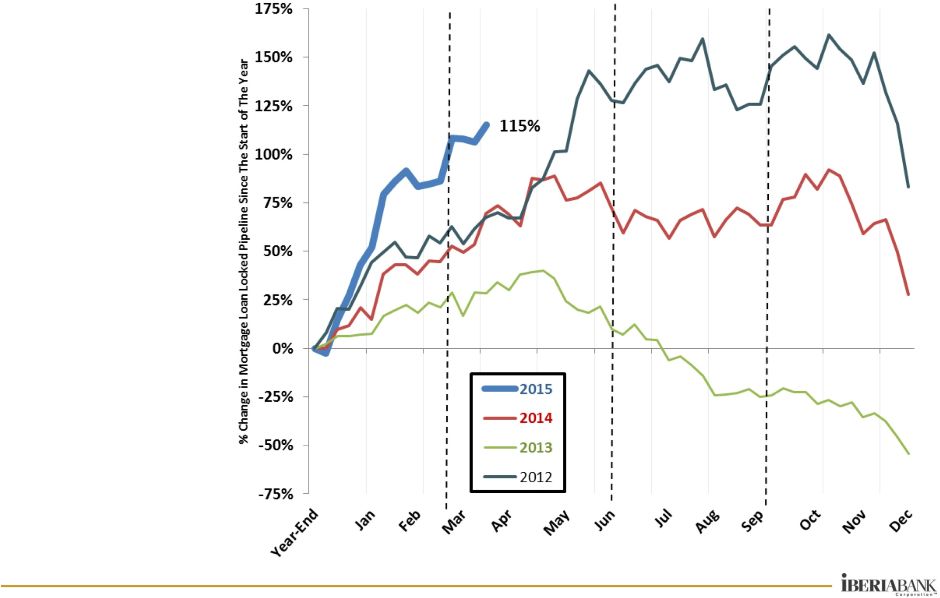 Financial Results
Weekly Locked Mortgage Pipeline Trends
•
Seasonal rebound
commences at the
start of each year
through spring
months into early
summer
•
Increased
production due to a
combination of
favorable rate
environment and
improved recruiting
in key markets
•
Weekly locked
pipeline was $317
million at April 17,
2015, up 9% since
March 31, 2015
and over two times
the level at
December 31,
2014
8 |
 9
Acquisitions
Update
•
HQ:
Tampa, Florida
•
Offices:
13 in Florida
•
Assets:
$571 million
•
Loans:
$319 million
•
Deposits:
$404 million
•
Collars:
$56.79 & $76.83
•
% Pro Forma IBKC: 3%
•
Announced: 10/3/14
•
Days to Fed Approval
Total Days
•
HQ:
Orlando, Florida
•
Offices:
14 in Florida
•
Assets:
$1.4 billion
•
Loans:
$1.1 billion
•
Deposits:
$1.2 billion
•
Collars:
$57.31 & $70.05
•
% Pro Forma IBKC: 7%
•
Announced: 10/27/14
•
Days to Fed Approval
Total Days
•
HQ:
Atlanta, Georgia
•
Offices:
9 in Georgia
•
Assets:
$1.0 billion
•
Loans:
$746 million
•
Deposits:
$858 million
•
Collars:
$58.69 & $71.73
•
% Pro Forma IBKC: 5%
•
Announced: 12/8/14
•
Days to Fed Approval
Total Days
Old Florida
Georgia Commerce
Florida Bank Group.
Unaudited Balance Sheet Information as of December 31, 2014
15
13
161
121
34
46
201
95
26
200
+ Days to Close
+ Days to Convert
+ Days to Close
+ Days to Convert
+ Days to Close
+ Days to Convert
133
79 |
 Financial Results
Influences to 1Q15 EPS
•
Seasonal influences impact first quarter results and tend to significantly diminish
over the remainder of the year
•
Timing influences impact current results and should be recouped over next two
years •
The Company considers the non-recurring influences to be one-time in
nature •
Aggregate pre-tax impact equal to $9.0 million
•
Aggregate after-tax EPS impact equal to $0.18 per share
$ in Millions
Fewer Business Days
$2.2
FDIC Recovery
$1.5
Benefits Payment
$0.6
Payroll Taxes
$2.1
Service Charges
$0.9
Title Income
$0.9
Card Income
$0.8
Pre-Tax Impact
$6.9
$1.5
$0.6
EPS (After-Tax)
0.14
$
0.03
$
0.01
$
Seasonality
Timing
Non-Recurring
10 |
 Financial Results
Non-Interest Income –
1Q15 Components
•
Operating non-
interest income
increased $1.8
million, or 4%, on
a linked quarter
basis
•
Non-operating
income of $0.4
million mainly
from gains on
sales of
investments
11 |
 •
Mortgage non-interest income of $18.0 million
was $4.4 million higher than 4Q14 driven by:
•
$6.4 million higher market value
adjustment (positive $5.2 million
recognized in 1Q15 versus negative $1.2
million in 4Q14)
•
$1.7 million lower gains on lower sales
volume (-12%) and lower margins
•
$0.1 million lower servicing income.
Financial Results
Mortgage Income
12 |
 •
Operating non-
interest expense
increased $6.8
million, or 6%, on
a linked-quarter
basis
•
Non-operating
expense of $10.4
million includes:
•
$9.3 million of
merger-related
expense
•
$0.6 million in
impairment of
long-lived
assets
•
$0.4 million of
professional
fees
Financial Results
Non-Interest Expense –
1Q15 Components
13 |
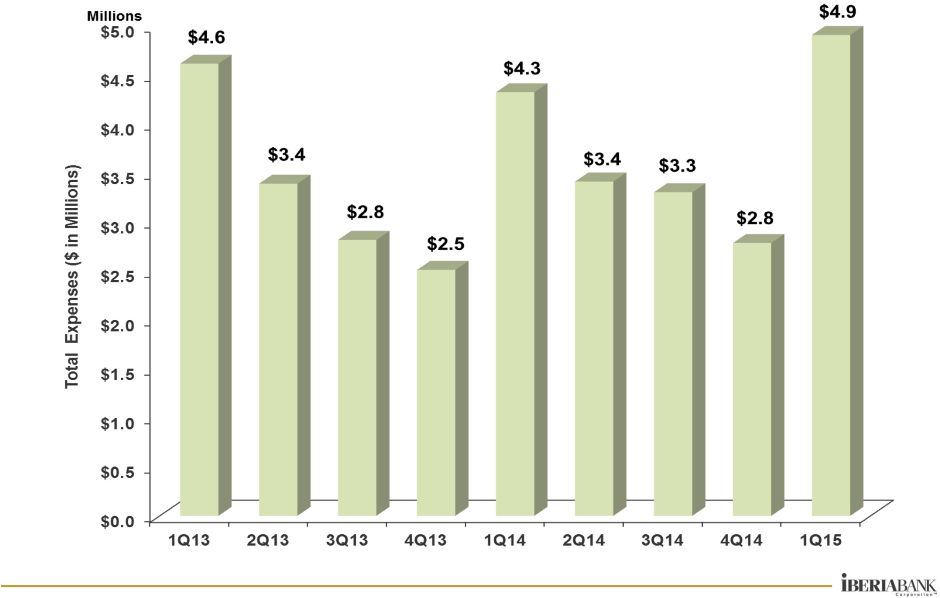
 Seasonal Influences
Checking NSF Related Charges
Influenced by impact of
Teche acquisition completed
in May 2014
1Q15 results include one month operating results from Florida Bank Group
acquisition 14 |
 Seasonal Influences
Payroll Taxes
2Q14 results influenced by impact of Teche Holding Company acquisition completed
in May 2014 and First Private Holdings, Inc. acquisition completed in June 2014
1Q15 results include one month operating results from Florida Bank Group
acquisition 15 |
 Seasonal Influences
Retirement Contributions
1Q15 results include one month operating results from Florida Bank Group
acquisition 16 |
   17
Capital
Preliminary Results and Anticipated Changes
•
1Q15 Capital ratios fully
reflect BASEL III
presentation
•
50% phase-out of trust
preferred securities is
reflected in updated
ratios
•
Change in risk-weighted
assets mainly driven by
change in risk-weighting
for commercial real-
estate, past due and
non-accrual loans and
addition of off-balance
sheet loan commitments
to risk-weighted asset
calculation
•
Net risk weighted assets increased approximately $509 million, or 4%,
between calculations
BASEL III
Prior
Common Equity Tier 1 (CET1) ratio
9.79%
N/A
N/A
bps
N/A
Tier 1 Leverage
9.04%
9.42%
(38)
bps
N/A
Tier 1 Risk Based
10.19%
11.02%
(83)
bps
N/A
Total Risk Based
11.62%
12.09%
(47)
bps
N/A
BASEL III
Prior
Change
Common Equity Tier 1 (CET1) ratio
9.55%
N/A
N/A
bps
6.50%
Tier 1 Leverage
8.48%
8.54%
(6)
bps
5.00%
Tier 1 Risk Based
9.55%
9.99%
(44)
bps
8.00%
Total Risk Based
10.59%
11.07%
(48)
bps
10.00%
IBERIABANK Corporation Capital Ratios
Well
Capitalized
Minimum
IBERIABANK and Subsidiaries Capital Ratios
Change
March 31, 2015
March 31, 2015
Well
Capitalized
Minimum |
 Appendix
18 |
 19
Appendix
Performance Metrics –
Quarterly Trends
3/31/2014
6/30/2014
9/30/2014
12/31/2014
3/31/2015
Net Income ($ in thousands)
22,336
$
16,217
$
30,893
$
35,936
$
25,126
$
-30%
Per Share Data:
Fully Diluted Earnings
0.75
$
0.53
$
0.92
$
1.07
$
0.75
$
-31%
Operating Earnings (Non-GAAP)
0.73
0.89
1.04
1.05
0.95
-10%
Pre-provision Operating Earnings (Non-GAAP)
0.78
0.99
1.15
1.17
1.05
-11%
Tangible Book Value
37.56
37.28
37.81
39.08
39.26
0%
Key Ratios:
Return on Average Assets
0.68%
0.46%
0.79%
0.91%
0.64%
(27)
bps
Return on Average Common Equity
5.82%
3.99%
6.79%
7.79%
5.40%
(239)
bps
Return on Average Tangible Common Equity (Non-GAAP)
8.35%
5.88%
10.10%
11.46%
7.93%
(353)
bps
Net Interest Margin (TE)
(1)
3.54%
3.49%
3.49%
3.53%
3.54%
1
bps
Tangible Operating Efficiency Ratio (TE)
(1)
(Non-GAAP)
73.5%
69.8%
65.1%
65.7%
68.5%
282
bps
Tangible Common Equity Ratio (Non-GAAP)
8.60%
8.43%
8.45%
8.59%
8.62%
3
bps
Tier 1 Leverage Ratio
(2)
9.61%
10.00%
9.21%
9.36%
9.04%
(32)
bps
Common Equity Tier 1 (CET1) Ratio
(2)
9.79%
Total Risk Based Capital Ratio
(2)
12.68%
12.40%
12.40%
12.30%
11.62%
(68)
bps
Net Charge-Offs to Average Loans
(3)
0.05%
0.04%
0.09%
0.06%
0.06%
0
bps
Non-performing Assets to Total Assets
(3)
0.49%
0.53%
0.46%
0.41%
0.55%
14
bps
(1)
Fully taxable equivalent basis.
(2)
March 31, 2015 Captial Ratios reflect full implementation of Basel III capital
requirements, excluding the impact of the (3)
Excluding FDIC Covered Assets and Acquired Assets.
Linked Quarter
%/Basis Point
Change
For Quarter Ended:
•
Average earning
assets up $0.3
billion (+2%)
•
T/E net interest
income up $1
million (+1%)
•
Provision for loan
losses of $5 million:
•
Legacy net charge-
offs: $1.6 million
(annualized 0.06%
of average loans)
•
Covered and
acquired net
charge-offs: $0.2
million (annualized
0.04% of average
loans)
•
Legacy provision
for loan losses:
$4.2 million
Old Florida Bancshares, Inc. acquisition. Prior periods have not been restated to
reflect BASEL III implementation. |
 20
Appendix
Performance Metrics –
Yields and Costs
12/31/2014
3/31/2015
Investment Securities
2.24%
2.22%
(2)
bps
Covered Loans, net of loss share receivable
3.57%
3.82%
25
bps
Legacy Loans, net
3.94%
3.90%
(4)
bps
Non-Covered Acquired Loans, net
6.94%
6.91%
(3)
bps
Loans & Loss Share Receivable
4.32%
4.33%
1
bps
Mortgage Loans Held For Sale
3.95%
4.55%
60
bps
Other Earning Assets
0.80%
0.81%
1
bps
Total Earning Assets
3.88%
3.90%
2
bps
Interest-bearing Deposits
0.41%
0.40%
(1)
bps
Short-Term Borrowings
0.19%
0.19%
(0)
bps
Long-Term Borrowings
2.73%
2.91%
18
bps
Total Interest-bearing Liabilities
0.48%
0.49%
1
bps
Net Interest Spread
3.41%
3.41%
0
bps
Net Interest Margin
3.53%
3.54%
1
bps
(1)
Earning asset yields are shown on a fully taxable-equivalent basis.
For Quarter Ended:
Linked Quarter
Basis Point
Change |
 Appendix
Non-GAAP Cash Margin
•
Adjustments represent accounting
impacts of purchase discounts on
acquired loans and related accretion
as well as the indemnification asset
and related amortization on the
covered portfolio
Balances, as
Reported
Adjustments
As Adjusted
1Q14
Average Balance
$12,088,186
$16,847
$12,105,029
Income
104,408
(2,517)
101,890
Rate
3.54%
-0.09%
3.45%
2Q14
Average Balance
12,687,971
30,318
12,718,289
Income
109,273
392
109,665
Rate
3.49%
0.01%
3.50%
3Q14
Average Balance
13,990,358
44,149
14,034,507
Income
121,751
(4,170)
117,581
Rate
3.49%
-0.13%
3.36%
4Q14
Average Balance
14,144,762
54,669
14,199,431
Income
124,680
(6,076)
118,603
Rate
3.53%
-0.18%
3.35%
1Q15
Average Balance
14,456,891
67,056
14,523,947
Income
125,804
(8,969)
116,835
Rate
3.54%
-0.30%
3.28%
$ in millions
21 |
 22
Appendix
Non-Interest Income Trends
•
Mortgage income increased $4.4 million, or +32%
•
Title income decreased $0.9 million, or -16%
•
Service charges decreased $0.9 million, or -9% due to
seasonal influences
•
Credit card fee income decreased $0.8 million, or -24%
1Q15 compared to 4Q14:
1Q15 includes one-month of Florida Bank Group results
Non-interest Income ($000s)
1Q14
2Q14
3Q14
4Q14
1Q15
$ Change
%
Change
Service Charges on Deposit Accounts
7,012
$
8,203
$
10,205
$
10,153
$
9,262
$
(891)
$
-9%
ATM / Debit Card Fee Income
2,467
2,937
3,287
3,331
3,275
(56)
-2%
BOLI Proceeds and CSV Income
934
934
1,047
1,050
1,092
42
4%
Mortgage Income
10,133
13,755
14,263
13,646
18,023
4,377
32%
Title Revenue
4,167
5,262
5,577
5,486
4,629
(857)
-16%
Broker Commissions
4,048
5,479
5,297
3,960
4,162
202
5%
Other Noninterest Income
5,129
7,182
6,854
9,071
8,067
(1,005)
-11%
Noninterest income excluding non-operating income
33,890
43,752
46,530
46,697
48,510
1,812
4%
Gain (Loss) on Sale of Investments, Net
19
8
582
164
389
225
138%
Other Non-operating income
1,772
1
-
211
-
(211)
-100%
Total Non-interest Income
35,681
$
43,761
$
47,112
$
47,072
$
48,899
$
1,827
$
4%
1Q15 vs. 4Q14
Originations up 8%
Sale volume decreased 5%
Refinancings declined from 36% to 24% of
production
Margins 10% lower in 1Q15
Pipeline of $278 million at quarter-end,
double the pipeline level at December 31,
2014. At April 17, 2015, the locked
pipeline was $317 million, or +9%, over
March 31, 2015 |
 23
Appendix
Non-Interest Expense Trends
•
Non-interest expenses excluding non-operating items up
$6.8 million, or 6%, as compared to 4Q14
•
Total expenses up $14.0 million, or 12%, in 1Q15
•
Severance expense down $0.1 million
•
Impairment of long-lived assets down $0.5 million
•
Merger-related expense increased $7.3 million, related
primarily to Florida Bank Group and Old Florida
transactions
•
Tangible Operating Efficiency Ratio of 68.5%, up from
65.7% in 4Q14
Linked quarter changes in operating expense:
1Q15 includes one-month of Florida Bank Group results
2.1
0.9
(0.9)
(0.7)
$0.7 mil
Non-interest Expense ($000s)
1Q14
2Q14
3Q14
4Q14
1Q15
$ Change
% Change
Mortgage Commissions
2,215
$
3,481
$
3,912
$
4,045
$
4,085
$
40
$
1%
Hospitalization Expense
3,944
3,661
4,611
4,606
5,181
575
12%
Other Salaries and Benefits
53,582
55,921
54,898
56,784
62,091
5,307
9%
Salaries and Employee Benefits
59,741
$
63,063
$
63,421
$
65,435
$
71,357
$
5,922
$
9%
Credit/Loan Related
3,560
3,093
4,569
2,483
4,183
1,700
68%
Occupancy and Equipment
13,775
13,918
14,580
14,526
16,055
1,529
11%
Amortization of Acquisition Intangibles
1,218
1,347
1,623
1,618
1,525
(93)
-6%
All Other Non-interest Expense
27,134
28,567
29,523
31,899
29,667
(2,232)
-7%
Nonint. Exp. (Ex-Non-Operating Exp.)
105,428
$
109,988
$
113,717
$
115,961
$
122,787
$
6,826
$
6%
Severance
119
5,466
1,226
139
41
(98)
-71%
Occupancy and Branch Closure Costs
17
14
-
-
-
-
100%
Storm-related expenses
184
4
1
2
20
18
760%
Impairment of Long-lived Assets, net of gains on sales
541
1,241
4,213
1,078
579
(499)
-46%
Provision for FDIC clawback liability
-
-
(797)
-
-
-
0%
Termination of Debit Card Rewards Program
(22)
-
-
-
-
-
0%
Consulting and Professional
-
-
-
-
430
430
100%
Merger-Related Expenses
967
10,419
1,752
1,955
9,296
7,341
376%
Total Non-interest Expense
107,234
$
127,132
$
120,112
$
119,135
$
133,153
$
14,017
$
12%
Tangible Efficiency Ratio -
excl Nonop-Exp
73.5%
69.8%
65.1%
65.7%
68.5%
1Q15 vs. 4Q14
1.4
1.3
0.7
Total Florida Bank Group expenses
Payroll taxes
Occupancy and equipment expense
Provision for unfunded commitment
Marketing and business development
Benefits expense
Professional services
OREO costs, net |
 24
Appendix
Non-Operating Items (Non-GAAP)
Non-operating expenses equal to $10.4 million pre-tax, or $0.21 EPS after-tax:
•
1Q15 Merger related expense of $9.3 million pre-tax, or $0.18 EPS after-tax
•
Net impairment expense of $0.6 million pre-tax or $0.01, EPS after-tax
•
Other non-operating items expense of $0.5 million pre-tax, or $0.01 after-tax
Pre-tax
After-tax
(2)
Per share
Pre-tax
After-tax
(2)
Per share
Pre-tax
After-tax
(2)
Per share
Net Income (Loss) (GAAP)
30,752
$
22,336
$
0.75
$
46,122
$
35,936
$
1.07
$
36,205
$
25,126
$
0.75
$
Non-interest income adjustments
Gain on sale of investments and other non-interest income
(1,791)
(1,692)
(0.06)
(374)
(243)
(0.01)
(389)
(252)
(0.01)
Non-interest expense adjustments
Merger-related expenses
967
629
0.02
1,955
1,496
0.04
9,296
6,139
0.18
Severance expenses
119
78
0.00
139
91
0.00
41
27
0.00
(Gain) Loss on sale of long-lived assets, net of impairment
541
352
0.01
1,078
701
0.02
579
376
0.01
Other non-operating non-interest expense
179
116
0.00
2
1
(0.00)
450
292
0.01
Total non-interest expense adjustments
1,806
1,175
0.03
3,174
2,289
0.07
10,366
6,834
0.21
Income tax benefits
-
-
-
-
(2,959)
(0.09)
-
-
-
Operating earnings (Non-GAAP)
(3)
30,767
21,819
0.73
48,922
35,023
1.05
46,182
31,708
0.95
Covered and acquired impaired (reversal of) provision for loan losses
108
70
0.00
1,497
973
0.03
1,169
760
0.02
Other (reversal of) provision for loan losses
1,995
1,297
0.04
4,998
3,249
0.08
4,176
2,715
0.08
Pre-provision operating earnings (Non-GAAP)
(3)
32,870
$
23,186
$
0.78
$
55,417
$
39,245
$
1.17
$
51,527
$
35,183
$
1.05
$
(1) Per share amounts may not appear to foot due to rounding.
(2) After-tax amounts estimated based on a 35% marginal tax rate.
RECONCILIATION
OF
NON-GAAP
FINANCIAL
MEASURES
(1)
(dollars in thousands)
For The Quarter Ended
March 31, 2014
December 31, 2014
March 31, 2015
Dollar Amount
Dollar Amount
Dollar Amount |
| 25
Appendix
Market Highlights For 1Q15
•
Competitive pressure remains strong for high quality commercial and
business banking clients in terms of both pricing and structure
•
Birmingham, Houston, New Orleans, Memphis and Baton Rouge
showed strong commercial loan originations
•
Total commitments originated during 1Q15 of $960 million with 37%
fixed rate and 63% floating rate
•
Commercial loans originated and funded in 1Q15 totaled $405 million
with a mix of 20% fixed and 80% floating ($584 million in commercial
loan commitments during the quarter)
•
Strong commercial pipeline in excess of $800 million at quarter-end
•
Legacy period-end core deposit increase of $338 million, with non-
interest bearing deposits up $212 million |
| 26
Overview
Small Business and Retail –
1Q15 Progress
•
Small Business legacy loan growth of $39 million, or +5%, on a linked-quarter
basis •
Consumer Direct & Mortgage legacy loan growth of $105 million, or +5%, on a
linked quarter basis
•
Credit Card legacy loan growth of ($0.6 million), or -1%, on a linked quarter
basis •
Expected seasonal decline. Experienced a similar decline during 1Q14
•
Checking account growth:
•
Small Business checking accounts increased 10% year-over-year and an
annualized 11% on a linked quarter basis
•
Consumer checking accounts decreased 3% year-over-year but increased an
annualized 1% on a linked quarter basis, primarily due to the expected
attrition from the Teche Holding Company portfolio that we converted last
year •
Continued
focus
on
productivity
and
efficiency
of
the
delivery
network
–
opened
one
branch in 1Q15, did not close any branches in 1Q15, converted 12
branches and
consolidated one branch into an existing IBKC branch related to the Florida Bank
Group acquisition and 15 branches related to the Old Florida
acquisition. •
Acceptance and usage of digital delivery continues to increase among our client
base: •
Released Online Appointment Setting |
 27
Appendix
Loan Growth
$ in millions
1st Quarter 2015:
•
Since YE 2009:
•
•
$181 million legacy
loan growth, or
+2% (+7%
annualized)
$5.7 billion legacy
loan growth, or
+139% (+27%
annualized)
The FDIC
covered loan
portfolio declined
85%, or $1.4
billion (16%
annualized rate) |
 28
Appendix
Loan Growth and Originations 1Q15 –Top Markets
$ in millions
Loan commitments and originations include renewals
$ in millions
•
$181 million in legacy loan growth for 1Q15
•
Top 5 markets represent 88% of legacy growth
•
$1.0 billion in total funded and unfunded
loan commitments |
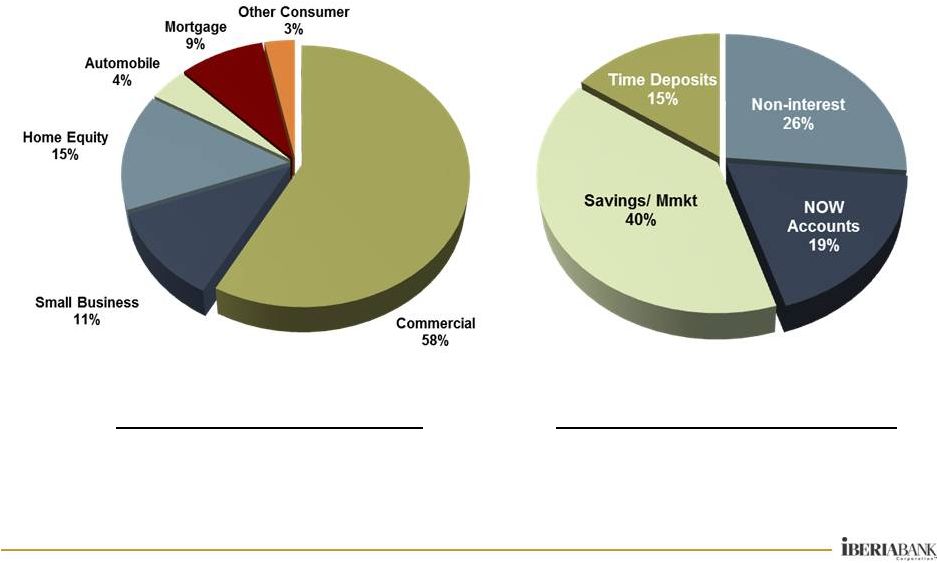 Appendix
Loan And Deposit Mix
Deposits at March 31, 2015
$14.7 Billion
Loans at March 31, 2015
$12.9 Billion
29 |
 Appendix
Non-Interest Bearing Deposits
% of Total
Deposits
Non-interest-bearing deposits at period-end
$ in billions
30
•
Houston
•
Lafayette
•
Sarasota
•
Naples
•
NE Arkansas
•
$669 million of
incremental non-
interest-bearing
deposit growth, or
+21%, in 1Q15
•
$457 million increase
related to acquired
deposits from Florida
Bank Group and Old
Florida
•
Top 1Q15 legacy
non-interest-bearing
deposit growth
markets include: |
 Appendix
Deposits Costs
•
Our deposit
costs declined
greater than
peers
•
A portion of the
lower costs were
due to improved
mix of deposits
•
Non-interest-
bearing deposits
grew from 11%
of total deposits
in 2010 to 26%
of total deposits
in 1Q15
31 |
 32
Appendix
Legacy Portfolio
Asset Quality Summary
(Excludes FDIC covered assets and all acquired loans)
•
NPAs equated to
0.55% of total assets,
up 14 bps compared to
4Q14. Includes $14
million of bank-related
properties
•
$91 million in classified
loans (up $12 million
from 4Q14)
•
Legacy net charge-offs
of $1.6 million, or an
annualized rate of
0.06% of average
loans
($ thousands)
3/31/2014
12/31/2014
3/31/2015
Non-accrual Loans
32,983
$
34,970
$
60,064
$
82%
72%
OREO
26,204
21,243
21,654
-17%
2%
Accruing Loans 90+ Days Past Due
269
754
239
-11%
-68%
Non-performing Assets
59,456
56,967
81,957
38%
44%
Note: NPAs excluding Former Bank Properties
50,453
45,411
68,353
35%
51%
Past Due Loans (excluding non-accrual loans)
11,453
30,321
17,845
56%
-41%
Classified Loans
64,476
78,890
91,248
42%
16%
Non-performing Assets/Assets
0.49%
0.41%
0.55%
6
bps
14
bps
NPAs/(Loans + OREO)
0.70%
0.59%
0.83%
13
bps
24
bps
Classified Assets/Total Assets
0.53%
0.57%
0.61%
8
bps
4
bps
Past Dues Loans/Loans
0.14%
0.31%
0.18%
4
bps
(13)
bps
Provision For Loan Losses
1,995
$
4,998
$
4,176
$
109%
-16%
Net Charge-Offs/(Recoveries)
1,014
1,538
1,578
56%
3%
Provision Less Net Charge-Offs
981
$
3,460
$
2,598
$
165%
-25%
Net Charge-Offs/Average Loans
0.05%
0.06%
0.06%
1
bps
0
bps
Allowance For Loan Losses/Loans
0.81%
0.79%
0.80%
(1)
bps
1
bps
Allowance For Credit Losses/Loans
0.94%
0.91%
0.93%
(1)
bps
2
bps
For Quarter Ended:
% or Basis Point Change
Year/Year
Qtr/Qtr |
 33
Appendix
Asset Quality Portfolio Trends
($thousands)
Non-accruals
229,962
$
169,686
$
195,371
$
-15%
15%
OREO & Foreclosed
93,165
53,947
53,194
-43%
-1%
90+ Days Past Due
981
1,708
5,642
475%
230%
Non-performing Assets
324,108
$
225,341
$
254,207
$
-22%
13%
NPAs/Assets
2.39%
1.43%
1.41%
(98)
bps
(2)
bps
NPAs/(Loans + OREO)
3.33%
1.96%
1.97%
(136)
bps
1
bps
LLR/Loans
1.40%
1.14%
1.00%
(40)
bps
(14)
bps
ACL/Loans
1.52%
1.24%
1.10%
(42)
bps
(14)
bps
Net Charge-Offs/Loans
0.03%
0.06%
0.06%
3
bps
(0)
bps
Past Dues:
30-89 Days Past Due
43,905
$
51,141
$
32,835
$
-25%
-36%
90+ days Past Due
981
1,708
5,642
475%
230%
Total 30+ Past Dues
44,886
$
52,849
$
38,477
$
-14%
-27%
% Loans
0.47%
0.46%
0.30%
(17)
bps
(16)
bps
Total Portfolio
% or Basis Point Change
1Q14
4Q14
1Q15
Year/Year
Qtr/Qtr |
 Appendix
Capital Markets and Wealth Management
•
ICP revenues +6%
compared to 4Q14
•
IWA revenues +5%
compared to 4Q14
•
IFS revenues +4%
compared to 4Q14
•
IWA assets under
management
increased $75 million
(+6%) to $1.4 billion
on March 31, 2015
34 |
 35
Appendix
Expected Quarterly Re-pricing Schedule
$ in millions
Note: Amounts exclude re-pricing of assets and liabilities from prior
quarters Excludes FDIC loans and receivable, non-accrual loans and market value
adjustments 2Q15
3Q15
4Q15
1Q16
2Q16
Cash Equivalents
Balance
763.5
$
-
$
-
$
-
$
-
$
Rate
0.52%
0.00%
0.00%
0.00%
0.00%
Investments
Balance
159.9
$
76.2
$
76.1
$
58.9
$
63.1
$
Rate
1.70%
3.05%
3.14%
2.96%
2.97%
Fixed Rate Loans
Balance
472.0
$
413.9
$
379.8
$
353.3
$
351.2
$
Rate
5.12%
4.99%
4.97%
4.94%
4.90%
Variable Rate Loans
Balance
5,847.9
$
98.0
$
61.4
$
48.2
$
37.7
$
Rate
3.30%
3.18%
3.58%
3.49%
3.95%
Time Deposits
Balance
731.9
$
400.9
$
328.3
$
259.2
$
189.7
$
Rate
0.49%
0.74%
0.75%
0.89%
1.00%
Repos/ST Debt
Balance
544.1
$
49.3
$
10.0
$
-
$
-
$
Rate
0.19%
0.23%
0.29%
0.00%
0.00%
Borrowed Funds
Balance
127.0
$
3.4
$
1.9
$
1.9
$
12.0
$
Rate
3.27%
4.30%
4.40%
4.40%
4.11% |
 36
Appendix
Interest Rate Risk Simulation
Source: Bancware model, as of March 31, 2015
* Assumes instantaneous and parallel shift in interest rates based on static
balance sheet •
Asset sensitive from an interest rate risk position
•
The degree of asset sensitivity is a function of the reaction of
competitors to changes in deposit pricing
•
Forward curve has a positive impact over 12 months
Base
Blue
Forward
Change In:
-200 bp*
-100 bp*
Case
+100 bp*
+200 bp*
Chip
Curve
Net Interest
Income
-3.6%
-2.1%
0.0%
4.8%
9.5%
1.7%
1.0%
Economic
Value of
Equity
-5.3%
-9.8%
0.0%
12.9%
23.3%
-0.3%
-0.2% |
 Georgia Commerce
Bancshares, Inc.
•
Announced December 8, 2014
•
New market acquisition of a Georgia-based commercial
bank headquartered in Atlanta, Georgia
•
Adds
nine
branches
in
Georgia
–
all
offices
are
in
the
Atlanta, MSA
As of December 31, 2014:
•
Total Loans:
$746 million
•
Total Assets:
$1,020 million
•
Total Deposits:
$858 million
•
Total Equity:
$104 million common stock
•
Tax-free, stock-for-stock exchange
•
Fixed exchange ratio of 0.6134 share of IBKC common
stock for each Georgia Commerce Bancshares, Inc. share
within collars and floating exchange ratios outside of
collars
(1)
$189
million
for
total
equity
(2)
outstanding based on IBKC’s
closing price of $65.21 on December 5, 2014
$40.00 per Georgia Commerce common share
outstanding
(2)
Estimated $5 million in cash liquidation value of all options
outstanding
(3)
Approximately 1.6% accretive to EPS in 2016 and 5%
accretive in 2017
TBVS dilution of approximately 1.8% at consummation
TBVS breakeven in approximately three and one-half years
IRR in excess of 20%
Equity
(2)
Including Options
(3)
•
•
(1)
The agreement provides for a fixed exchange ratio with pricing collars that fix the
value received by Georgia Commerce’s shareholders if the weighted average
trading price of IBERIABANK Corporation’s common stock were to decline
below $58.69 per share, or exceed $71.73 per share, over a specified period.
(2)
Includes exercise of outstanding warrants and no exercise of stock options currently
outstanding. (3)
Assumes all stock options outstanding are cashed out at consummation.
37
Appendix
181%
196%
186%
202%
Shareholders’
Aggregate Value
Price / Total Book:
Price / Tangible Book:
•
•
•
•
•
•
• |
 |