Attached files
| file | filename |
|---|---|
| 8-K - 1ST QTR 2015 EARNINGS SLIDES - FIRST MERCHANTS CORP | a8k1stquarter2015earningsc.htm |

First Merchants Corporation 1st QUARTER 2015 Earnings Highlights April 23, 2015 ® Michael C. Rechin Mark K. Hardwick John J. Martin President Executive Vice President Executive Vice President Chief Executive Officer Chief Financial Officer Chief Credit Officer NASDAQ: FRME
THE STRENGTH OF BIG. THE SERVICE OF SMALL. www.firstmerchants.com Forward-Looking Statement 2 ® The Corporation may make forward-looking statements about its relative business outlook. These forward- looking statements and all other statements made during this meeting that do not concern historical facts are subject to risks and uncertainties that may materially affect actual results. Specific forward-looking statements include, but are not limited to, any indications regarding the financial services industry, the economy and future growth of the balance sheet or income statement. Please refer to our press releases, Form 10-Qs and 10-Ks concerning factors that could cause actual results to differ materially from any forward-looking statements. Non-GAAP Financial Measures These slides contain non-GAAP financial measures. For purposes of Regulation G, a non-GAAP financial measure is a numerical measure of the registrant’s historical or future financial performance, financial position or cash flows that excludes amounts, or is subject to adjustments that have the effect of excluding amounts, that are included in the most directly comparable measure calculated and presented in accordance with GAAP in the statement of income, balance sheet or statement of cash flows (or equivalent statements) of the issuer; or includes amounts, or is subject to adjustments that have the effect of including amounts, that are excluded from the most directly comparable measure so calculated and presented. In this regard, GAAP refers to generally accepted accounting principles in the United States. Pursuant to the requirements of Regulation G, First Merchants Corporation has provided reconciliations within the slides, as necessary, of the non-GAAP financial measure to the most directly comparable GAAP financial measure.

THE STRENGTH OF BIG. THE SERVICE OF SMALL. www.firstmerchants.com 3 ® 1st Quarter 2015 Highlights 1st Quarter Highlights • Earnings Per Share of $ .43, a 13% increase over 1Q2014 • $16.2 Million of Net Income, a 19% increase over 1Q2014 • $16.2 Million of Non-Interest Income, a 5% increase over 1Q2014 • Non-Interest Expense of $41.2 Million, a 4% decrease from 1Q2014 • 1.11% Return on Average Assets Additional Items of Note • Completed acquisition of Cooper State Bank in Columbus, Ohio – April 17, 2015 • 1st quarter results include acquisition expenses of $549,000 • Community Bank of Noblesville integration plan on target • Asset quality improvement preserves credit leverage

THE STRENGTH OF BIG. THE SERVICE OF SMALL. www.firstmerchants.com 4 ® Mark K. Hardwick Executive Vice President and Chief Financial Officer

THE STRENGTH OF BIG. THE SERVICE OF SMALL. ® www.firstmerchants.com 5 Total Assets 2013 2014 Q1-’14 Q1-’15 1. Investments $ 1,096 $1,181 $1,150 $1,189 2. Loans Held for Sale 5 7 7 6 3. Loans 3,633 3,925 3,617 3,966 4. Allowance (68) (64) (70) (63) 5. CD&I & Goodwill 203 219 202 218 6. BOLI 165 169 165 170 7. Other 403 387 382 392 8. Total Assets $5,437 $5,824 $5,453 $5,878 ($ in Millions)

Commercial & Industrial 23.6% Commercial Real Estate Owner- Occupied 13.5% Commercial Real Estate Non-Owner Occupied 24.2%Construction, Land & Land Development 6.0% Agricultural Land 3.8% Agricultural Production 2.4% Other Non-Consumer 1.3% Residential Mortgage 16.3% Home Equity 7.2% Other Consumer 1.7% THE STRENGTH OF BIG. THE SERVICE OF SMALL. www.firstmerchants.com 6 Loan and Yield Detail (as of 3/31/2015) ® YTD Yield = 4.48% Total Loans = $4.0 Billion
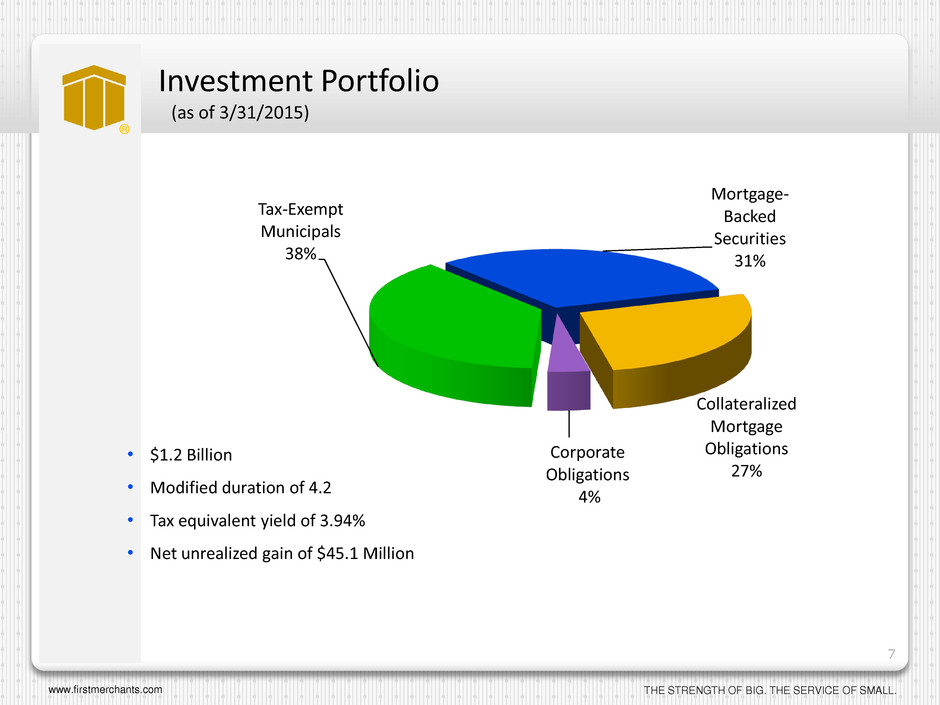
THE STRENGTH OF BIG. THE SERVICE OF SMALL. www.firstmerchants.com 7 ® Mortgage- Backed Securities 31% Collateralized Mortgage Obligations 27% Corporate Obligations 4% Tax-Exempt Municipals 38% Investment Portfolio (as of 3/31/2015) • $1.2 Billion • Modified duration of 4.2 • Tax equivalent yield of 3.94% • Net unrealized gain of $45.1 Million

® THE STRENGTH OF BIG. THE SERVICE OF SMALL. www.firstmerchants.com 8 Total Liabilities and Capital 2013 2014 Q1-’14 Q1-’15 1. Customer Non-Maturity Deposits $3,276 $3,523 $3,249 $3,518 2. Customer Time Deposits 868 784 834 800 3. Brokered Deposits 87 334 200 330 4. Borrowings 401 290 362 305 5. Other Liabilities 48 44 34 63 6. Hybrid Capital 122 122 122 122 7. Common Equity 635 727 652 740 8. Total Liabilities and Capital $5,437 $5,824 $5,453 $5,878 9. Tangible Book Value Per Share $12.17 $13.65 $12.63 $13.96 Percentage Change 12.2% 10.5% ($ in Millions)

Demand Deposits 46% Savings Deposits 30% Certificates & Time Deposits of >$100,000 6% Certificates & Time Deposits of <$100,000 11% Brokered Deposits 7% THE STRENGTH OF BIG. THE SERVICE OF SMALL. www.firstmerchants.com 9 ® Deposits and Cost of Funds Detail (as of 03/31/2015) YTD Cost = .40% Total = $4.6 Billion

Total Risk-Based Capital Ratio (Target = 14.50%) Common Equity Tier 1 Capital Ratio (Target = 10.00%) Tangible Common Equity/Tangible Assets (TCE) (Target = 8.00%) THE STRENGTH OF BIG. THE SERVICE OF SMALL. www.firstmerchants.com 10 ® 10.20% 10.13% 10.42% 10.37% 10.86% 11.00% 11.16% 11.40% 11.37% 7.88% 7.74% 7.97% 8.34% 8.65% 8.74% 9.05% 9.16% 9.31% 15.91% 15.69% 14.96% 14.54% 15.04% 15.11% 15.21% 15.34% 15.12% 6.00% 7.00% 8.00% 9.00% 10.00% 11.00% 12.00% 13.00% 14.00% 15.00% 16.00% 17.00% 18.00% 1Q13 2Q13 3Q13 4Q13 1Q14 2Q14 3Q14 4Q14 1Q15 Capital Ratios (Target) (Target) (Target)

THE STRENGTH OF BIG. THE SERVICE OF SMALL. www.firstmerchants.com 11 Net Interest Margin ® Q1 - '13 Q2 - '13 Q3 - '13 Q4 - '13 Q1 - '14 Q2 - '14 Q3 - '14 Q4 - '14 Q1 - '15 Net Interest Income - FTE ($millions) $ 40.8 $ 38.1 $ 38.6 $ 42.8 $ 47.8 $ 48.1 $ 49.9 $ 49.2 $ 49.2 Fair Value Accretion $ 0.8 $ 0.4 $ 0.4 $ 0.6 $ 1.8 $ 2.2 $ 3.5 $ 1.4 $ 2.2 Tax Equivalent Yield on Earning Assets 4.70% 4.29% 4.35% 4.30% 4.40% 4.33% 4.41% 4.26% 4.24% Cost of Supporting Liabilities 0.45% 0.41% 0.38% 0.41% 0.43% 0.44% 0.43% 0.46% 0.46% Net Interest Margin 4.25% 3.88% 3.97% 3.89% 3.97% 3.89% 3.98% 3.80% 3.78% 4.17% 3.84% 3.93% 3.83% 3.83% 3.71% 3.71% 3.69% 3.61% 3.50% 3.60% 3.70% 3.80% 3.90% 4.00% 4.10% 4.20% 4.30% $37 $39 $41 $43 $45 $47 $49 $51 Q1 - '13 Q2 - '13 Q3 - '13 Q4 - '13 Q1 - '14 Q2 - '14 Q3 - '14 Q4 - '14 Q1 - '15 Net Interest Income - FTE ($millions) Net Interest Margin Net Interest Margin - Adjusted for Fair Value Accretion

THE STRENGTH OF BIG. THE SERVICE OF SMALL. www.firstmerchants.com 12 ® Non-Interest Income 1Adjusted for Bond Gains & Losses ($ in Millions) 2013 2014 Q1-’14 Q1-’15 1. Service Charges on Deposit Accounts $12.4 $15.7 $ 3.6 $ 3.5 2. Trust Fees 8.6 9.0 2.2 2.5 3. Insurance Commission Income 7.1 7.4 2.3 2.3 4. Electronic Card Fees 7.5 9.7 2.3 2.5 5. Cash Surrender Value of Life Ins 2.6 3.7 0.7 0.7 6. Gains on Sales Mortgage Loans 7.5 4.9 0.7 1.5 7. Securities Gains/Losses 0.5 3.6 0.6 1.0 8. OREO Gains/Rental Income 4.1 4.6 1.4 0.8 9. Other 5.7 7.8 1.6 1.4 10. Total $56.0 $66.4 $15.4 $16.2 11. Adjusted Non-Interest Income1 $55.5 $62.8 $14.8 $15.2

THE STRENGTH OF BIG. THE SERVICE OF SMALL. www.firstmerchants.com 13 ® Non-Interest Expense 2013 2014 Q1-’14 Q1-’15 1. Salary & Benefits $ 85.4 $ 96.5 $ 25.3 $ 24.5 2. Premises & Equipment 18.0 23.2 6.6 6.4 3. Core Deposit Intangible 1.6 2.4 0.6 0.7 4. Professional & Other Outside Services 8.3 8.1 1.4 1.5 5. OREO/Credit-Related Expense 6.7 8.0 1.8 1.2 6. FDIC Expense 2.9 3.7 1.1 0.9 7. Outside Data Processing 5.6 7.3 1.8 1.7 8. Marketing 2.2 3.5 0.8 0.8 9. Other 12.5 15.8 3.7 3.5 10. Non-Interest Expense $143.2 $168.5 $ 43.1 $ 41.2 ($ in Millions)
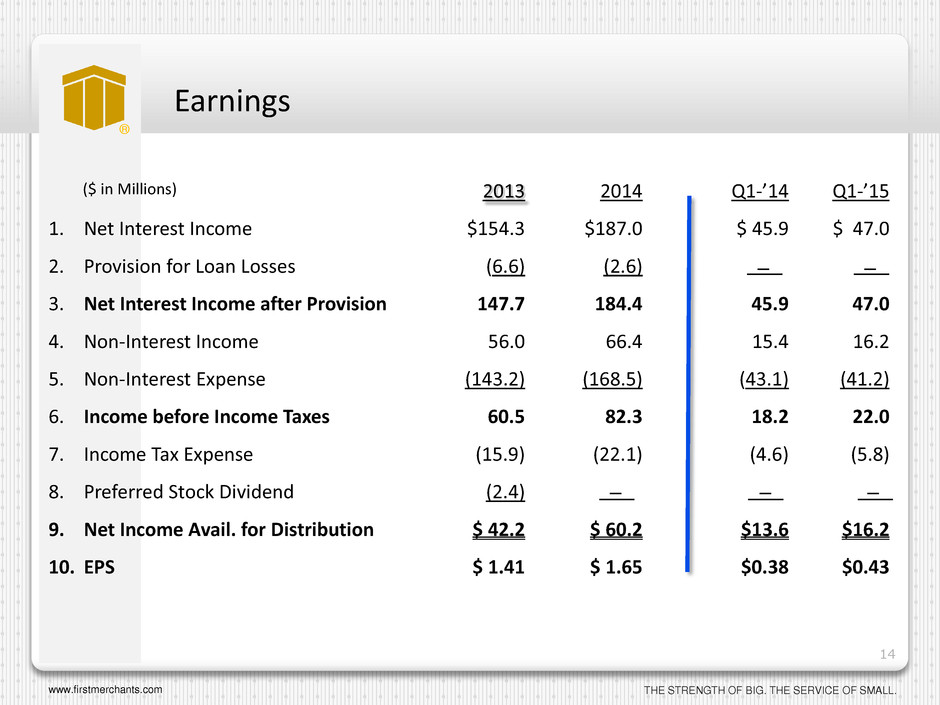
THE STRENGTH OF BIG. THE SERVICE OF SMALL. www.firstmerchants.com 14 ® 2013 2014 Q1-’14 Q1-’15 1. Net Interest Income $154.3 $187.0 $ 45.9 $ 47.0 2. Provision for Loan Losses (6.6) (2.6) 3. Net Interest Income after Provision 147.7 184.4 45.9 47.0 4. Non-Interest Income 56.0 66.4 15.4 16.2 5. Non-Interest Expense (143.2) (168.5) (43.1) (41.2) 6. Income before Income Taxes 60.5 82.3 18.2 22.0 7. Income Tax Expense (15.9) (22.1) (4.6) (5.8) 8. Preferred Stock Dividend (2.4) 9. Net Income Avail. for Distribution $ 42.2 $ 60.2 $13.6 $16.2 10. EPS $ 1.41 $ 1.65 $0.38 $0.43 Earnings – – – – – ($ in Millions)

THE STRENGTH OF BIG. THE SERVICE OF SMALL. www.firstmerchants.com 15 ® 2014 Q1 Q2 Q3 Q4 Total 1. Reported $ .38 $ .41 $ .45 $ .41 $ 1.65 2. FV Accretion EPS Impact $ .03 $ .04 $ .06 $ .03 $ .16 2015 Q1 Q2 Q3 Q4 Total 1. Reported $ .43 – – – $ .43 2. FV Accretion EPS Impact $ .04 – – – $ .04 Earnings Per Share

THE STRENGTH OF BIG. THE SERVICE OF SMALL. www.firstmerchants.com 16 ® John J. Martin Executive Vice President and Chief Credit Officer

THE STRENGTH OF BIG. THE SERVICE OF SMALL. www.firstmerchants.com 17 Loan Portfolio Trends ® ($ in Millions) 2013 2014 Q1-'14 Q1-'15 $ % $ %186.1 1. Commercial & Industrial 761.7$ 896.7$ 787.4$ 938.9$ 42.2$ 4.7% 151.5$ 19.2% 2. Construction, Land and Land Development 177.1 207.3 155.1 237.0 29.7 14.3% 81.9 52.8% 3. CRE Non-Owner Occupied 963.4 975.7 954.9 960.2 (15.5) (1.6%) 5.3 0.6% 4. CRE Owner Occupied 501.1 534.7 503.0 537.2 2.5 0.5% 34.2 6.8% 5. Agricultural Production 114.3 104.9 99.2 95.7 (9.2) (8.8%) (3.5) (3.5%) 6. Agricultural Land 147.3 162.3 148.9 149.0 (13.3) (8.2%) 0.1 0.1% 7. Residential Mortgage 616.4 647.3 626.2 640.5 (6.8) (1.1%) 14.3 2.3% 8. Home Equity 255.2 286.5 256.8 286.9 0.4 0.1% 30.1 11.7% 9. Other Commercial 26.1 36.1 23.4 49.9 13.8 38.2% 26.5 113.2% 10. Other Consumer 69.8 73.4 61.7 70.2 (3.2) (4.4%) 8.5 13.8% 11. Loans 3,632.4$ 3,924.9$ 3,616.6$ 3,965.5$ 40.6$ 1.0% 348.9$ 9.6% Year Over YearLinked Quarter Change

THE STRENGTH OF BIG. THE SERVICE OF SMALL. www.firstmerchants.com 18 Asset Quality Summary ® ($ in Millions) 2013 2014 Q1-'14 Q1-'15 $ % $ % 1. Non-Accrual Loans 56.4$ 48.8$ 55.7$ 44.3$ (4.5)$ (9.2%) (11.4)$ (20.5%) 2. Other Real Estate 22.2 19.3 21.1 19.1 (0.2) (1.0%) (2.0) (9.5%) 3. Renegotiated Loans 3.0 2.0 0.4 1.3 (0.7) (35.0%) 0.9 225.0% 4. 90+ Days Delinquent Loans 1.4 4.6 1.7 1.7 (2.9) (63.0%) - 0.0% 5. Total NPA's & 90+ Days Delinquent 83.0$ 74.7$ 78.9$ 66.4$ (8.3)$ (11.1%) (12.5)$ (15.8%) 6. NPA's & 90+ Days/Loans & ORE 2.3% 1.9% 2.2% 1.7% 7. Classified Assets 191.9$ 191.8$ 217.0$ 166.4$ (25.4)$ (13.2%) (50.6)$ (23.3%) 8. Criticized Assets (includes Classified) 263.5$ 253.6$ 281.4$ 249.1$ (4.5)$ (1.8%) (32.3)$ (11.5%) Year over Year Linked Quarter Change

THE STRENGTH OF BIG. THE SERVICE OF SMALL. www.firstmerchants.com 19 ® Non-Performing Asset Reconciliation ($ in Millions) Q2-'14 Q3-'14 Q4-'14 Q1-'15 1. Beginning Balance NPA's & 90+ Days Delinquent 78.9$ 72.4$ 65.6$ 74.7$ Non-Accrual 2. Add: New Non-Accruals 8.3 18.3 11.1 7.8 3. Less: To Accrual/Payoff/Renegotiated (8.5) (11.3) (5.7) (8.0) 4. Less: To OREO (1.8) (1.1) (0.7) (2.1) 5. Less: Charge-offs (2.4) (8.1) (5.0) (2.2) 6. Increase / (Decrease): Non-Accrual Loans (4.4) (2.2) (0.3) (4.5) Other Real Estate Owned (ORE) 7. Add: New ORE Properties 1.8 1.1 7.4 2.1 8. Less: ORE Sold (2.7) (3.7) (2.3) (2.1) 9. Less: ORE Losses (write-downs) (1.6) (1.5) (0.3) (0.2) 10. Increase / (Decrease): ORE (2.5) (4.1) 4.8 (0.2) 11. Increase / (Decrease): 90+ Days Delinquent (0.6) (0.3) 3.8 (2.9) 12. Increase / (Decrease): Restructured Loans 1.0 (0.2) 0.8 (0.7) 13. Total NPA's & 90+ Days Delinquent Change (6.5) (6.8) 9.1 (8.3) 14. Ending Balance NPA's & 90+ Days Delinquent 72.4$ 65.6$ 74.7$ 66.4$

THE STRENGTH OF BIG. THE SERVICE OF SMALL. www.firstmerchants.com 20 ® ALLL and Fair Value Summary 14.7% 27.7% 57.6% ($ in Millions) Q1-'14 Q2-'14 Q3-'14 Q4-'14 Q1-'15 1. Allowance for Loan Losses (ALLL) 69.6$ 68.4$ 65.6$ 64.0$ 62.8$ 2. Fair Value Adjustment (FVA) 47.2 43.9 35.5 43.2 40.6 3. Total ALLL plus FVA 116.8 112.3 101.1 107.2 103.4 4. Specific Reserves 1.8 1.7 3.4 2.8 4.6 5. Purchased Loans plus FVA 663.9 638.0 596.3 701.7 655.4 6. ALLL/Non-Accrual Loans 125.0% 133.3% 133.6% 131.1% 141.7% 7. ALLL/Non-purchased Loans 2.31% 2.18% 2.04% 1.95% 1.87% 8. ALLL/Loans 1.92% 1.83% 1.74% 1.63% 1.58% 9. ALLL & FVA/Total Loan Balances plus FVA 1 3.19% 2.98% 2.65% 2.70% 2.58% 1 Management uses this Non-GAAP measure to demonstrate coverage and credit risk

THE STRENGTH OF BIG. THE SERVICE OF SMALL. www.firstmerchants.com 21 ® Portfolio Perspective • Continued strong demand in the construction portfolio • Opportunities in the Public Finance sector • Consumer lending demand improving following lower regional unemployment • Cooper State Bank portfolio has no impact on overall credit profile

THE STRENGTH OF BIG. THE SERVICE OF SMALL. www.firstmerchants.com 22 ® Michael C. Rechin President and Chief Executive Officer
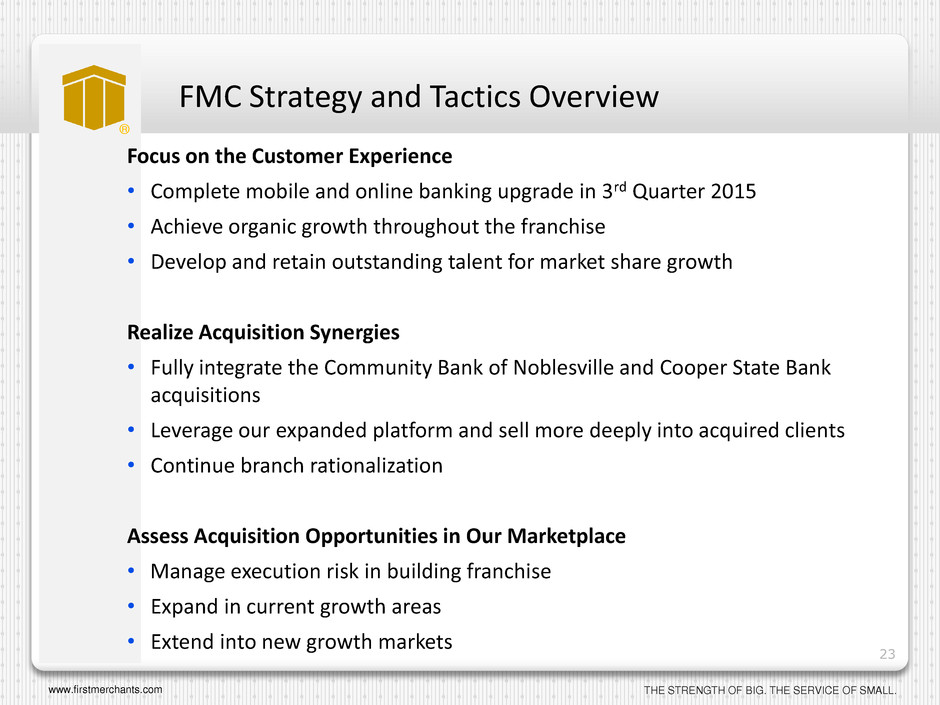
THE STRENGTH OF BIG. THE SERVICE OF SMALL. www.firstmerchants.com 23 ® FMC Strategy and Tactics Overview Focus on the Customer Experience • Complete mobile and online banking upgrade in 3rd Quarter 2015 • Achieve organic growth throughout the franchise • Develop and retain outstanding talent for market share growth Realize Acquisition Synergies • Fully integrate the Community Bank of Noblesville and Cooper State Bank acquisitions • Leverage our expanded platform and sell more deeply into acquired clients • Continue branch rationalization Assess Acquisition Opportunities in Our Marketplace • Manage execution risk in building franchise • Expand in current growth areas • Extend into new growth markets
THE STRENGTH OF BIG. THE SERVICE OF SMALL. www.firstmerchants.com 24 Contact Information ® First Merchants Corporation common stock is traded on the NASDAQ Global Select Market under the symbol FRME. Additional information can be found at www.firstmerchants.com Investor inquiries: David L. Ortega Investor Relations Telephone: 765.378.8937 dortega@firstmerchants.com
THE STRENGTH OF BIG. THE SERVICE OF SMALL. www.firstmerchants.com 25 ® Appendix
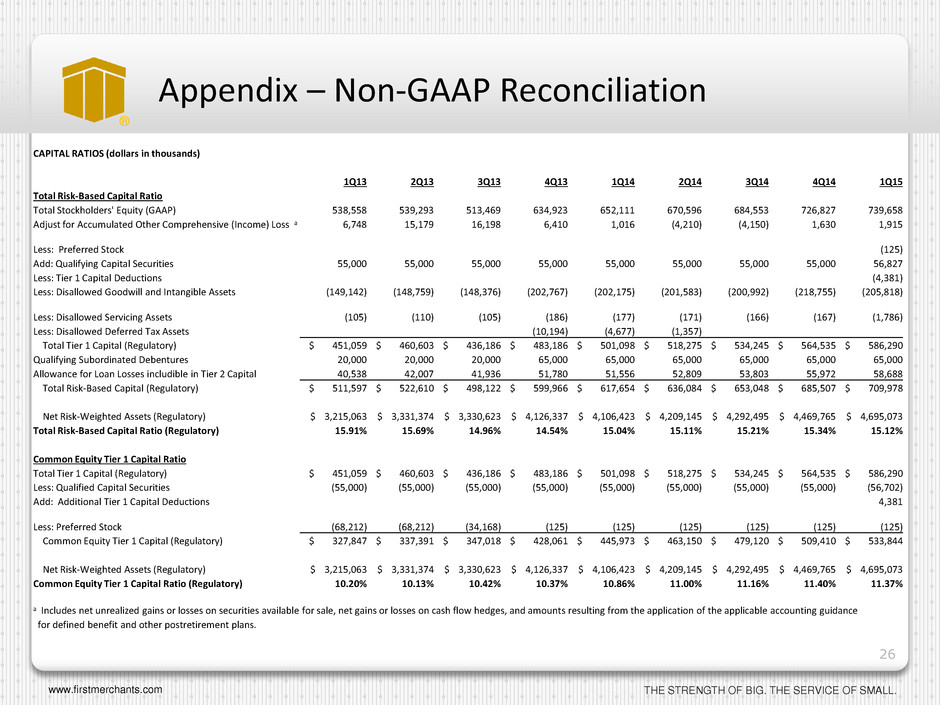
THE STRENGTH OF BIG. THE SERVICE OF SMALL. www.firstmerchants.com 26 Appendix – Non-GAAP Reconciliation CAPITAL RATIOS (dollars in thousands) 1Q13 2Q13 3Q13 4Q13 1Q14 2Q14 3Q14 4Q14 1Q15 Total Risk-Based Capital Ratio Total Stockholders' Equity (GAAP) 538,558 539,293 513,469 634,923 652,111 670,596 684,553 726,827 739,658 Adjust for Accumulated Other Comprehensive (Income) Loss a 6,748 15,179 16,198 6,410 1,016 (4,210) (4,150) 1,630 1,915 Less: Preferred Stock (125) Add: Qualifying Capital Securities 55,000 55,000 55,000 55,000 55,000 55,000 55,000 55,000 56,827 Less: Tier 1 Capital Deductions (4,381) Less: Disallowed Goodwill and Intangible Assets (149,142) (148,759) (148,376) (202,767) (202,175) (201,583) (200,992) (218,755) (205,818) Less: Disallowed Servicing Assets (105) (110) (105) (186) (177) (171) (166) (167) (1,786) Less: Disallowed Deferred Tax Assets (10,194) (4,677) (1,357) Total Tier 1 Capital (Regulatory) $ 451,059 $ 460,603 $ 436,186 $ 483,186 $ 501,098 $ 518,275 $ 534,245 $ 564,535 $ 586,290 Qualifying Subordinated Debentures 20,000 20,000 20,000 65,000 65,000 65,000 65,000 65,000 65,000 Allowance for Loan Losses includible in Tier 2 Capital 40,538 42,007 41,936 51,780 51,556 52,809 53,803 55,972 58,688 Total Risk-Based Capital (Regulatory) $ 511,597 $ 522,610 $ 498,122 $ 599,966 $ 617,654 $ 636,084 $ 653,048 $ 685,507 $ 709,978 Net Risk-Weighted Assets (Regulatory) $ 3,215,063 $ 3,331,374 $ 3,330,623 $ 4,126,337 $ 4,106,423 $ 4,209,145 $ 4,292,495 $ 4,469,765 $ 4,695,073 Total Risk-Based Capital Ratio (Regulatory) 15.91% 15.69% 14.96% 14.54% 15.04% 15.11% 15.21% 15.34% 15.12% Common Equity Tier 1 Capital Ratio Total Tier 1 Capital (Regulatory) $ 451,059 $ 460,603 $ 436,186 $ 483,186 $ 501,098 $ 518,275 $ 534,245 $ 564,535 $ 586,290 Less: Qualified Capital Securities (55,000) (55,000) (55,000) (55,000) (55,000) (55,000) (55,000) (55,000) (56,702) Add: Additional Tier 1 Capital Deductions 4,381 Less: Preferred Stock (68,212) (68,212) (34,168) (125) (125) (125) (125) (125) (125) Common Equity Tier 1 Capital (Regulatory) $ 327,847 $ 337,391 $ 347,018 $ 428,061 $ 445,973 $ 463,150 $ 479,120 $ 509,410 $ 533,844 Net Risk-Weighted Assets (Regulatory) $ 3,215,063 $ 3,331,374 $ 3,330,623 $ 4,126,337 $ 4,106,423 $ 4,209,145 $ 4,292,495 $ 4,469,765 $ 4,695,073 Common Equity Tier 1 Capital Ratio (Regulatory) 10.20% 10.13% 10.42% 10.37% 10.86% 11.00% 11.16% 11.40% 11.37% a Includes net unrealized gains or losses on securities available for sale, net gains or losses on cash flow hedges, and amounts resulting from the application of the applicable accounting guidance for defined benefit and other postretirement plans. ®

THE STRENGTH OF BIG. THE SERVICE OF SMALL. www.firstmerchants.com 27 ® Appendix – Non-GAAP Reconciliation TANGIBLE EQUITY AND TANGIBLE RATIOS (dollars in thousands) Tangible Common Equity/Tangible Assets (non-GAAP) 1Q13 2Q13 3Q13 4Q13 1Q14 2Q14 3Q14 4Q14 1Q15 Total Stockholders' Equity (GAAP) $ 538,557 $ 539,293 $ 513,469 $ 634,923 $ 652,111 $ 670,596 $ 684,553 $ 726,827 $ 739,658 Less: Preferred Stock (68,212) (68,212) (34,168) (125) (125) (125) (125) (125) (125) Less: Intangible Assets, net of tax (146,872) (146,467) (145,984) (197,794) (197,293) (196,781) (196,315) (212,669) (212,184) Tangible Common Equity (non-GAAP) $ 323,473 $ 324,614 $ 333,317 $ 437,004 $ 454,693 $ 473,690 $ 488,113 $ 514,033 $ 527,349 Total Assets (GAAP) $ 4,252,829 $ 4,338,264 $ 4,325,911 $ 5,437,262 $ 5,452,936 $ 5,615,120 $ 5,591,383 $ 5,824,127 $ 5,877,521 Less: Intangibles, net of tax (146,872) (146,467) (145,984) (197,794) (197,293) (196,781) (196,315) (212,669) (212,184) Tangible Assets (non-GAAP) $ 4,105,957 $ 4,191,797 $ 4,179,927 $ 5,239,468 $ 5,255,643 $ 5,418,339 $ 5,395,068 $ 5,611,458 $ 5,665,337 Tangible Common Equity/Tangible Assets (non-GAAP) 7.88% 7.74% 7.97% 8.34% 8.65% 8.74% 9.05% 9.16% 9.31% Shares Outstanding 28,780,609 28,801,848 28,825,465 35,921,761 36,014,083 36,052,209 36,074,246 37,669,948 37,781,488 Tangible Common Book Value per Share (non-GAAP) $ 11.24 $ 11.27 $ 11.56 $ 12.17 $ 12.63 $ 13.14 $ 13.53 $ 13.65 $ 13.96

THE STRENGTH OF BIG. THE SERVICE OF SMALL. www.firstmerchants.com 28 ® Appendix – Non-GAAP Reconciliation ALLOWANCE RATIOS (dollars in thousands) 1Q14 2Q14 3Q14 4Q14 1Q15 Allowance as a Percentage of Non-Purchased Loans Loans Held for Sale (GAAP) $ 6,586 $ 7,370 $ 6,423 $ 7,235 $ 6,392 Loans (GAAP) 3,616,627 3,722,733 3,772,467 3,924,865 3,965,532 Total Loans 3,623,213 3,730,103 3,778,890 3,932,100 3,971,924 Less: Purchased Loans (616,739) (593,996) (560,806) (658,471) (614,843) Non-Purchased Loans (non-GAAP) $ 3,006,474 $ 3,136,107 $ 3,218,084 $ 3,273,629 $ 3,357,081 Allowance for Loan Losses $ 69,583 $ 68,367 $ 65,596 $ 63,964 $ 62,801 Allowance as a Percentage of Non-Purchased Loans 2.31% 2.18% 2.04% 1.95% 1.87%
