Attached files
| file | filename |
|---|---|
| 8-K - FORM 8-K - Ameris Bancorp | v408070_8k.htm |
| EX-99.1 - EXHIBIT 99.1 - Ameris Bancorp | v408070_ex99-1.htm |
Exhibit 99.2
Ameris Bancorp 1 st Quarter 2015 Earnings Presentation Edwin W. Hortman, Jr. – President & CEO Dennis J. Zember, Jr. – EVP & CFO
This presentation contains certain performance measures determined by methods other than in accordance with accounting principles generally accepted in the United States of America (“GAAP”) . Management of Ameris Bancorp (the “Company”) uses these non - GAAP measures in its analysis of the Company’s performance . These measures are useful when evaluating the underlying performance and efficiency of the Company’s operations and balance sheet . The Company’s management believes that these non - GAAP measures provide a greater understanding of ongoing operations, enhance comparability of results with prior periods and demonstrate the effects of significant gains and charges in the current period . The Company’s management believes that investors may use these non - GAAP financial measures to evaluate the Company’s financial performance without the impact of unusual items that may obscure trends in the Company’s underlying performance . These disclosures should not be viewed as a substitute for financial measures determined in accordance with GAAP, nor are they necessarily comparable to non - GAAP performance measures that may be presented by other companies . Tangible common equity and Tier 1 capital ratios are non - GAAP measures . The Company calculates the Tier 1 capital using current call report instructions . The Company’s management uses these measures to assess the quality of capital and believes that investors may find them useful in their evaluation of the Company . These capital measures may, or may not be necessarily comparable to similar capital measures that may be presented by other companies . This presentation may contain statements that constitute “forward - looking statements” within the meaning of Section 27 A of the Securities Act of 1933 , as amended, and Section 21 E of the Securities Exchange Act of 1934 , as amended . The words “believe”, “estimate”, “expect”, “intend”, “anticipate” and similar expressions and variations thereof identify certain of such forward - looking statements, which speak only as of the dates which they were made . The Company undertakes no obligation to publicly update or revise any forward - looking statements, whether as a result of new information, future events or otherwise . Readers are cautioned that any such forward - looking statements are not guarantees of future performance and involve risks and uncertainties and that actual results may differ materially from those indicated in the forward - looking statements as a result of various factors . Readers are cautioned not to place undue reliance on these forward - looking statements and are referred to the Company’s periodic filings with the Securities and Exchange Commission for a summary of certain factors that may impact the Company’s results of operations and financial condition . Cautionary Statements

• Announced acquisition covering $ 866 . 9 million in deposits • Virtually no runoff - Most recent update shows $ 864 . 4 million in total deposits (down 0 . 2 % ) vs . management estimate of 10 % • Build out of Ameris Bank customer care center and information technology systems underway ( 21 staff in call centers, 10 staff on I/T side) • Very confident in incremental revenues from investing the excess funds • Expected closure and conversion date of June 12 , 2015 assuming timely receipt of regulatory approvals Pending Acquisition Updates Bank of America Branches • $ 400 million acquisition in Gainesville, FL • Regulatory approvals received, Anticipated closure date of May 22 , 2015 • Currently recruiting for Treasury, SBA and Mortgage sales staff • Estimated conversion date in September, 2015 Merchants & Southern Bank Expected Impacts to ABCB • More than 15 % accretive to 2016 EPS with conservative assumptions and low execution risk • Along with supporting capital raise, accretive to TBV by approximately 4 . 5 % • Increases total assets by approximately $ 1 . 25 billion • Increases the Company’s concentration in low or no cost deposits
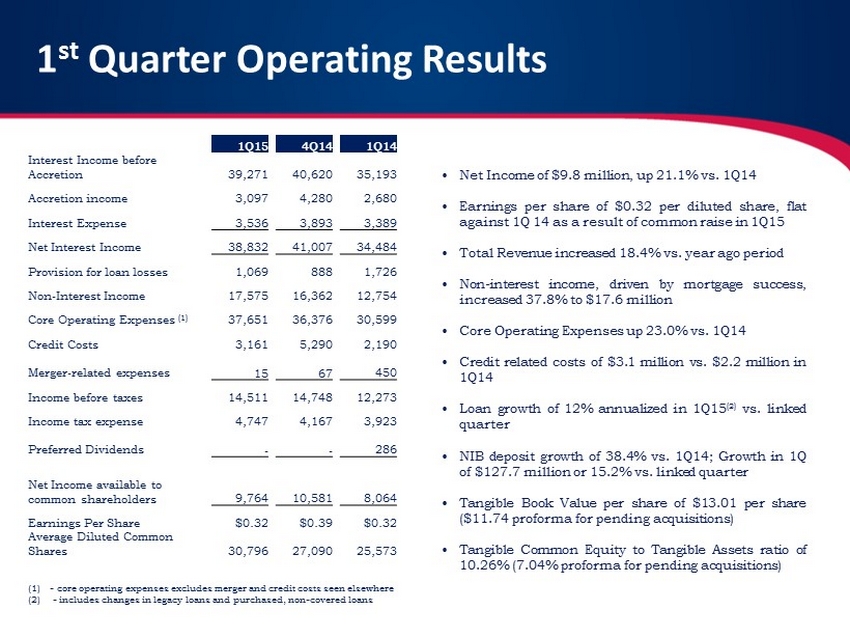
1 st Quarter Operating Results 1Q15 4Q14 1Q14 Interest Income before Accretion 39,271 40,620 35,193 Accretion income 3,097 4,280 2,680 Interest Expense 3,536 3,893 3,389 Net Interest Income 38,832 41,007 34,484 Provision for loan losses 1,069 888 1,726 Non - Interest Income 17,575 16,362 12,754 Core Operating Expenses (1) 37,651 36,376 30,599 Credit Costs 3,161 5,290 2,190 Merger - related expenses 15 67 450 Income before taxes 14,511 14,748 12,273 Income tax expense 4,747 4,167 3,923 Preferred Dividends - - 286 Net Income available to common shareholders 9,764 10,581 8,064 Earnings Per Share $0.32 $0.39 $0.32 Average Diluted Common Shares 30,796 27,090 25,573 (1) - core operating expenses excludes merger and credit costs seen elsewhere (2) - includes changes in legacy loans and purchased, non - covered loans • Net Income of $ 9 . 8 million, up 21 . 1 % vs . 1 Q 14 • Earnings per share of $ 0 . 32 per diluted share, flat against 1 Q 14 as a result of common raise in 1 Q 15 • Total Revenue increased 18 . 4 % vs . year ago period • Non - interest income, driven by mortgage success, increased 37 . 8 % to $ 17 . 6 million • Core Operating Expenses up 23 . 0 % vs . 1 Q 14 • Credit related costs of $ 3 . 1 million vs . $ 2 . 2 million in 1 Q 14 • Loan growth of 12 % annualized in 1 Q 15 ( 2 ) vs . linked quarter • NIB deposit growth of 38 . 4 % vs . 1 Q 14 ; Growth in 1 Q of $ 127 . 7 million or 15 . 2 % vs . linked quarter • Tangible Book Value per share of $ 13 . 01 per share ( $ 11 . 74 proforma for pending acquisitions) • Tangible Common Equity to Tangible Assets ratio of 10 . 26 % ( 7 . 04 % proforma for pending acquisitions)
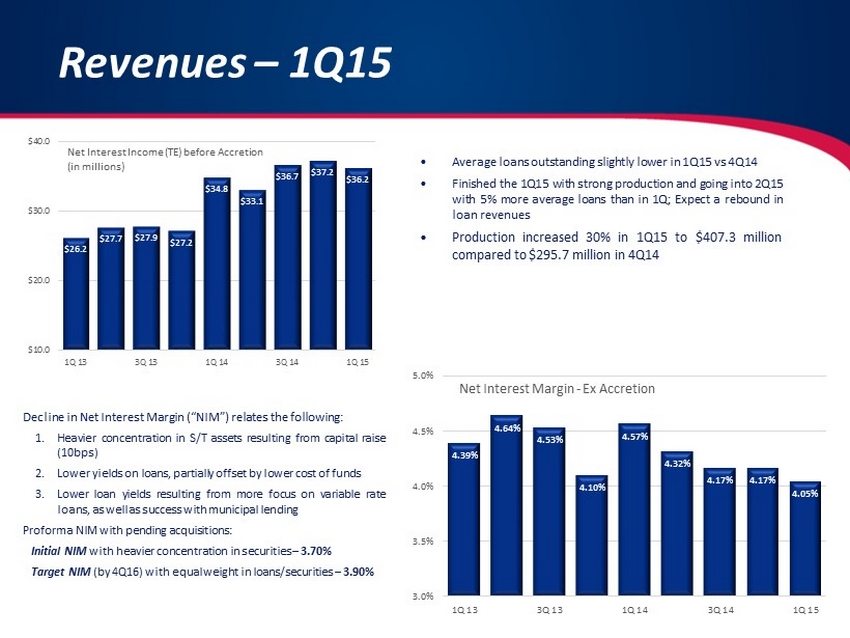
Revenues – 1Q15 $26.2 $27.7 $27.9 $27.2 $34.8 $33.1 $36.7 $37.2 $36.2 $10.0 $20.0 $30.0 $40.0 1Q 13 3Q 13 1Q 14 3Q 14 1Q 15 Net Interest Income (TE) before Accretion (in millions) • Average loans outstanding slightly lower in 1 Q 15 vs 4 Q 14 • Finished the 1 Q 15 with strong production and going into 2 Q 15 with 5 % more average loans than in 1 Q ; Expect a rebound in loan revenues • Production increased 30 % in 1 Q 15 to $ 407 . 3 million compared to $ 295 . 7 million in 4 Q 14 4.39% 4.64% 4.53% 4.10% 4.57% 4.32% 4.17% 4.17% 4.05% 3.0% 3.5% 4.0% 4.5% 5.0% 1Q 13 3Q 13 1Q 14 3Q 14 1Q 15 Net Interest Margin - Ex Accretion Decline in Net Interest Margin (“NIM”) relates the following : 1. Heavier concentration in S/T assets resulting from capital raise ( 10 bps) 2. Lower yields on loans, partially offset by lower cost of funds 3. Lower loan yields resulting from more focus on variable rate loans, as well as success with municipal lending Proforma NIM with pending acquisitions : Initial NIM with heavier concentration in securities – 3 . 70 % Target NIM (by 4 Q 16 ) with equal weight in loans/securities – 3 . 90 %

Non - Interest Income – 1Q15 $6.9 $6.4 $5.9 $5.6 $6.9 $10.3 $12.0 $10.7 $11.8 $2.0 $5.0 $8.0 $11.0 $14.0 1Q 13 3Q 13 1Q 14 3Q 14 1Q 15 Mortgage and SBA Revenues (in millions) • Mortgage and SBA net income totaled $ 3 . 1 million in 1 Q 15 vs . $ 2 . 3 million in 4 Q 14 and $ 1 . 1 million 1 Q 14 ; Net income increasing more than 2 x the growth rate in revenue ; Highly profitable divisions focused on more than just revenue growth 1Q15 4Q14 1Q14 Mortgage production (000's) 188,296 197,227 130,934 Mortgage GOS (1) - retail 4.04% 4.19% 3.82% Open Pipeline 110,856 57,005 75,201 SBA Production: 17,100 12,300 6,800 SBA sold loans 9,100 13,900 1,600 SBA GOS % 12% 12% 11% SBA Pipeline 67,000 57,900 18,200 1.58% 1.61% 1.75% 1.57% 1.45% 1.81% 1.80% 1.63% 1.72% 1.0% 1.5% 2.0% 1Q 13 3Q 13 1Q 14 3Q 14 1Q 15 Net Interest Income as a % of Average Assets • Service charges in 1 Q 15 up 15 . 1 % over 1 Q 14 • Mortgage non - interest income in 1 Q 15 up 59 . 5 % over 1 Q 14 • SBA non - interest income in 1 Q 15 up 300 % over 1 Q 14 • Pending acquisitions had approximately 1 . 60 % non - interest income to average assets in 2014 but had very little in Mortgage or SBA income 1 – GOS – “gain on sale” of loans

Expenses – 1Q15 $24.0 $24.3 $25.4 $28.0 $30.6 $31.6 $34.8 $36.4 $37.7 $0.0 $10.0 $20.0 $30.0 $40.0 1Q 13 3Q 13 1Q 14 3Q 14 1Q 15 Core Operating Expenses (1) (in millions) • 1 Q 15 includes approximately $ 1 . 4 million that we do not believe will be recurring in 2 Q 15 (detailed on following slide) • Core Opex in 1 Q 15 as a percentage of Assets is about flat compared to 1 Q 14 ; Rapid growth in assets (approximately 25 % per year over last 5 years including pending acquisitions) has been challenging to manage efficiently • Confident that our systems are adequate to allow for meaningful efficiency improvements with BofA and M&S acquisitions $4.8 $2.3 $3.0 $5.3 $2.2 $2.8 $3.2 $5.3 $3.2 $0.0 $1.0 $2.0 $3.0 $4.0 $5.0 $6.0 1Q 13 3Q 13 1Q 14 3Q 14 1Q 15 Problem loan & OREO Expense (in millions) • Improvement in credit costs against the 4 Q 14 but negative when compared to 1 Q 14 • NPAs down 5 . 0 % in 1 Q 15 compared to 4 Q 14 • Net charge - offs of 0 . 08 % in 1 Q 15 vs . 0 . 31 % in YTD 14 • Elevated costs in the 1 Q 15 driven by legal fees and related costs associated with bankruptcies on several larger problem assets • Current efforts center on a pool of assets totaling approximately $ 25 million that we believe we can move with little to no cumulative loss 1 – Core operating expenses exclude Problem loan and OREO costs as well as merger - related charges

Expenses – 1Q15 Change compared to: Expense 1Q15 4Q14 1Q14 Salaries total $14,013 $440 $1,759 Coastal Salaries are approximately $1.37 million, remainder is build - out in I/T and customer care centers Incentive & FICA 3,242 1,158 1,431 Includes $900k of FICA on 2015 bonuses; Not recurring in 2Q15; Increase over 1Q14 relates also to higher incentive accrual by $1.25 million Mortgage Expense 6,249 292 1,442 Growth against 4Q14 and 1Q14 relates to growth in revenue and profitability in the Mortgage division; Earnings up 166%, expenses up only 30% SBA Expenses 705 (335) 305 Growth relates to continued recruiting and build out of this division and higher commissions tied to higher levels of production DP & IT 4,260 31 806 Relates to Coastal acquisition and quicker adoption of E - banking services offset by fee income; Renegotiated contract in 1Q, expect $400k in 2Q15 of savings FDIC Insurance 783 (133) 220 Growth relates to Coastal acquisition Occupancy 4,554 (163) 490 Partially the result of Coastal acquisition but also includes $90,000 of equipment write - off related to upgraded I/T Printing & Postage $1,060 ($3) $267 Higher due to preparation for pending acquisitions (forms, notices, etc .)
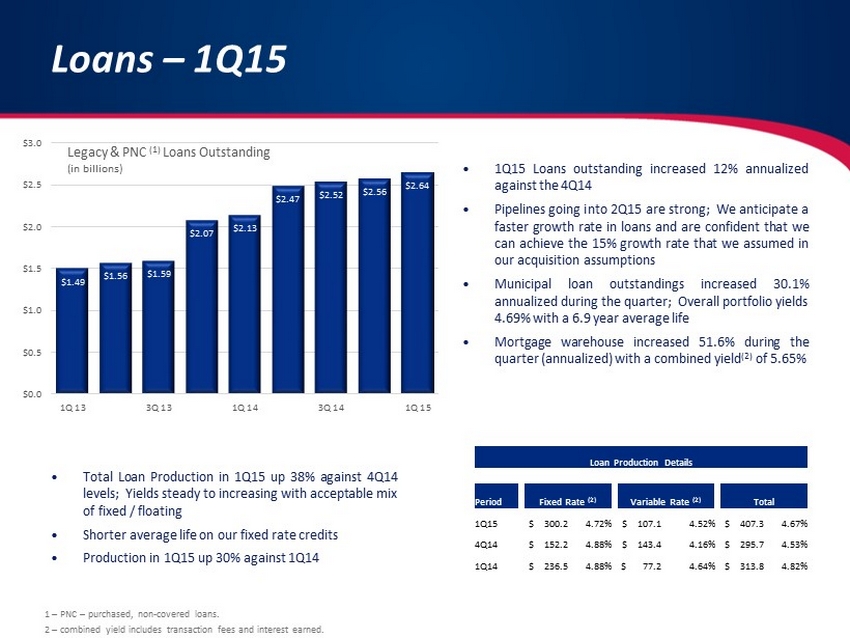
Loans – 1Q15 $1.49 $1.56 $1.59 $2.07 $2.13 $2.47 $2.52 $2.56 $2.64 $0.0 $0.5 $1.0 $1.5 $2.0 $2.5 $3.0 1Q 13 3Q 13 1Q 14 3Q 14 1Q 15 Legacy & PNC (1) Loans Outstanding (in billions) • 1 Q 15 Loans outstanding increased 12 % annualized against the 4 Q 14 • Pipelines going into 2 Q 15 are strong ; We anticipate a faster growth rate in loans and are confident that we can achieve the 15 % growth rate that we assumed in our acquisition assumptions • Municipal loan outstandings increased 30 . 1 % annualized during the quarter ; Overall portfolio yields 4 . 69 % with a 6 . 9 year average life • Mortgage warehouse increased 51 . 6 % during the quarter (annualized) with a combined yield ( 2 ) of 5 . 65 % 1 – PNC – purchased, non - covered loans. 2 – combined yield includes transaction fees and interest earned. Loan Production Details Period Fixed Rate (2) Variable Rate (2) Total 1Q15 $ 300.2 4.72% $ 107.1 4.52% $ 407.3 4.67% 4Q14 $ 152.2 4.88% $ 143.4 4.16% $ 295.7 4.53% 1Q14 $ 236.5 4.88% $ 77.2 4.64% $ 313.8 4.82% • Total Loan Production in 1 Q 15 up 38 % against 4 Q 14 levels ; Yields steady to increasing with acceptable mix of fixed / floating • Shorter average life on our fixed rate credits • Production in 1 Q 15 up 30 % against 1 Q 14

Deposits – 1Q15 $491 $475 $476 $669 $699 $791 $817 $839 $967 $0 $400 $800 $1,200 1Q 13 3Q 13 1Q 14 3Q 14 1Q 15 NIB Demand Deposits (in millions) $1,217 $1,163 $1,146 $1,241 $1,485 $1,517 $1,706 $1,794 $1,818 $0 $400 $800 $1,200 $1,600 $2,000 1Q 13 3Q 13 1Q 14 3Q 14 1Q 15 Non - Rate Sensitive Deposits (in millions) • Growth rate in NIB deposits continues to be strong ; 1 Q 15 growth in NIB deposits totaled $ 268 million or 38 . 3 % over 1 Q 14 • 26 % of the growth from the Coastal Bank acquisition • 74 % of the growth from internal sales efforts on consumer and commercial sales • Proforma NIB deposits after the pending acquisitions are $ 1 . 25 billion or 27 . 2 % of total proforma deposits • Non - rate sensitive deposits continue to climb, now at 53 . 1 % • Continued aggressive effort to grow non - rate sensitive balances ahead of a potential rate movement • Proforma non - rate sensitive deposits with the two acquisitions increase to $ 2 . 44 billion and 52 . 9 % of total deposits

Capital and TBV – 1Q15 9.15% 9.22% 6.83% 7.53% 7.04% 7.27% 7.42% 10.26% 7.07% 4.0% 6.0% 8.0% 10.0% 12.0% 2Q 13 4Q 13 2Q 14 4Q 14 Proforma Tangible Book Value • Steady capital levels ( proforma ) despite having a balance sheet much more centered in cash and securities • TCE at 1 Q 15 includes effect of the capital raise but not the incremental assets • Confident in our TCE build over the coming quarters and anticipate surpassing 8 . 0 % before 4 Q 16 $10.29 $10.23 $10.39 $10.31 $10.26 $10.68 $10.99 $13.01 $11.77 $4.0 $6.5 $9.0 $11.5 $14.0 2Q 13 4Q 13 2Q 14 4Q 14 Proforma Tangible Book Value • Breakout on TBV growth in the last few quarters • Proforma TBV for 1 Q 15 of $ 11 . 77 per share is 14 . 2 % higher than 1 Q 14 Proforma data shown here assumes $39.9 million of combined intangible assets on pending acquisitions and $1.25 billion of incremental assets.