Attached files
| file | filename |
|---|---|
| 8-K - 8-K - ARCH RESOURCES, INC. | a15-9641_18k.htm |
Exhibit 99.1
|
|
Annual Meeting of Shareholders Saint Louis April 23, 2015 John W. Eaves, President & CEO Powering the Working World. |
|
|
Slide 2 Forward-Looking Information This presentation contains “forward-looking statements” – that is, statements related to future, not past, events. In this context, forward-looking statements often address our expected future business and financial performance, and often contain words such as “expects,” “anticipates,” “intends,” “plans,” “believes,” “seeks,” or “will.” Forward-looking statements by their nature address matters that are, to different degrees, uncertain. For us, particular uncertainties arise from changes in the demand for our coal by the domestic electric generation industry; from legislation and regulations relating to the Clean Air Act and other environmental initiatives; from operational, geological, permit, labor and weather-related factors; from fluctuations in the amount of cash we generate from operations; from future integration of acquired businesses; and from numerous other matters of national, regional and global scale, including those of a political, economic, business, competitive or regulatory nature. These uncertainties may cause our actual future results to be materially different than those expressed in our forward-looking statements. We do not undertake to update our forward-looking statements, whether as a result of new information, future events or otherwise, except as may be required by law. For a description of some of the risks and uncertainties that may affect our future results, you should see the risk factors described from time to time in the reports we file with the Securities and Exchange Commission. This presentation includes certain non-GAAP financial measures, including Adjusted EBITDA and cash costs per ton. These non-GAAP financial measures are not measures of financial performance in accordance with generally accepted accounting principles and may exclude items that are significant in understanding and assessing our financial results. Therefore, these measures should not be considered in isolation or as an alternative to net income from operations, cash flows from operations, earnings per fully-diluted share or other measures of profitability, liquidity or performance under generally accepted accounting principles. You should be aware that our presentation of these measures may not be comparable to similarly-titled measures used by other companies. A reconciliation of these financial measures to the most comparable measures presented in accordance with generally accepted accounting principles has been included at the end of this presentation. |
|
|
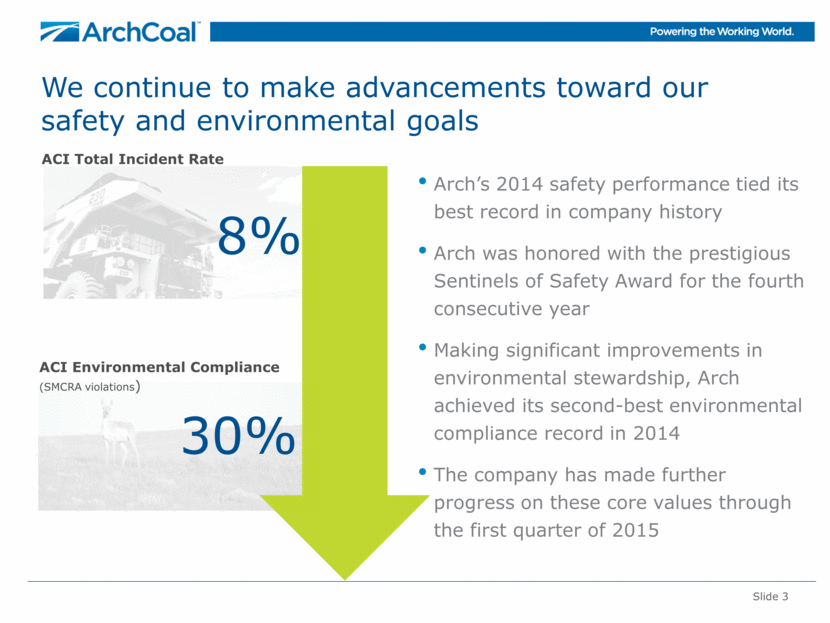
We continue to make advancements toward our safety and environmental goals Slide 3 ACI Environmental Compliance (SMCRA violations) ACI Total Incident Rate 8% 30% Arch’s 2014 safety performance tied its best record in company history Arch was honored with the prestigious Sentinels of Safety Award for the fourth consecutive year Making significant improvements in environmental stewardship, Arch achieved its second-best environmental compliance record in 2014 The company has made further progress on these core values through the first quarter of 2015 |
|
|
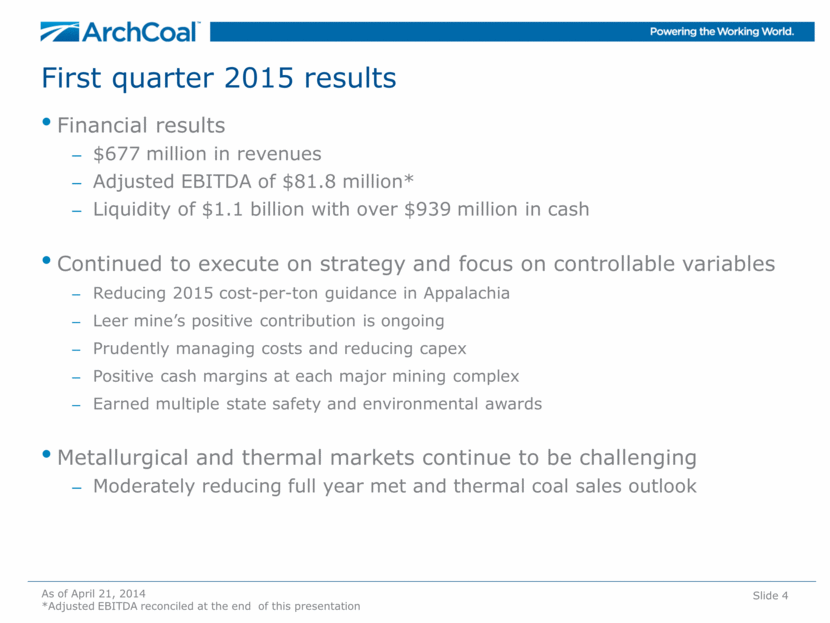
First quarter 2015 results Financial results $677 million in revenues Adjusted EBITDA of $81.8 million* Liquidity of $1.1 billion with over $939 million in cash Continued to execute on strategy and focus on controllable variables Reducing 2015 cost-per-ton guidance in Appalachia Leer mine’s positive contribution is ongoing Prudently managing costs and reducing capex Positive cash margins at each major mining complex Earned multiple state safety and environmental awards Metallurgical and thermal markets continue to be challenging Moderately reducing full year met and thermal coal sales outlook Slide 4 As of April 21, 2014 *Adjusted EBITDA reconciled at the end of this presentation |
|
|
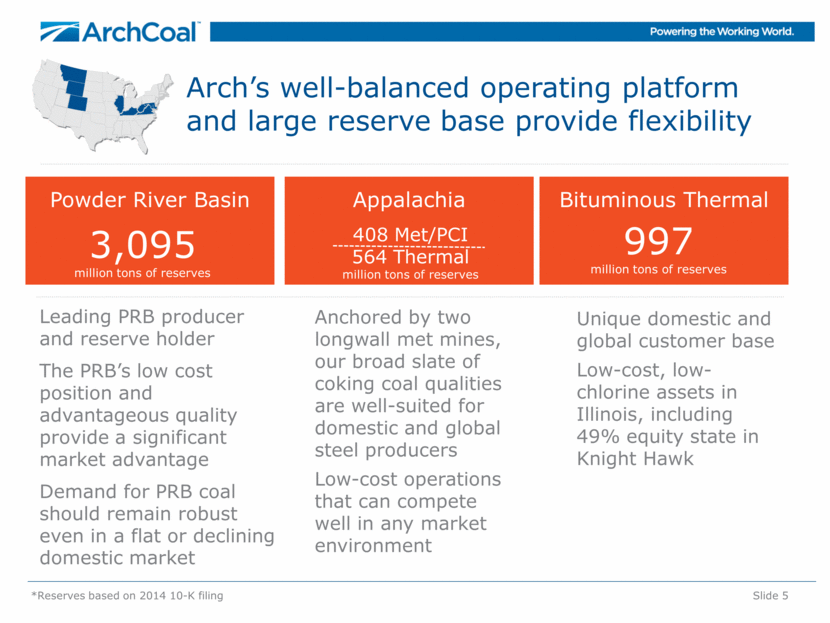
*Reserves based on 2014 10-K filing Bituminous Thermal Appalachia Arch’s well-balanced operating platform and large reserve base provide flexibility Powder River Basin 3,095 million tons of reserves 408 Met/PCI 564 Thermal million tons of reserves 997 million tons of reserves Leading PRB producer and reserve holder The PRB’s low cost position and advantageous quality provide a significant market advantage Demand for PRB coal should remain robust even in a flat or declining domestic market Anchored by two longwall met mines, our broad slate of coking coal qualities are well-suited for domestic and global steel producers Low-cost operations that can compete well in any market environment Unique domestic and global customer base Low-cost, low-chlorine assets in Illinois, including 49% equity state in Knight Hawk Slide 5 |
|
|
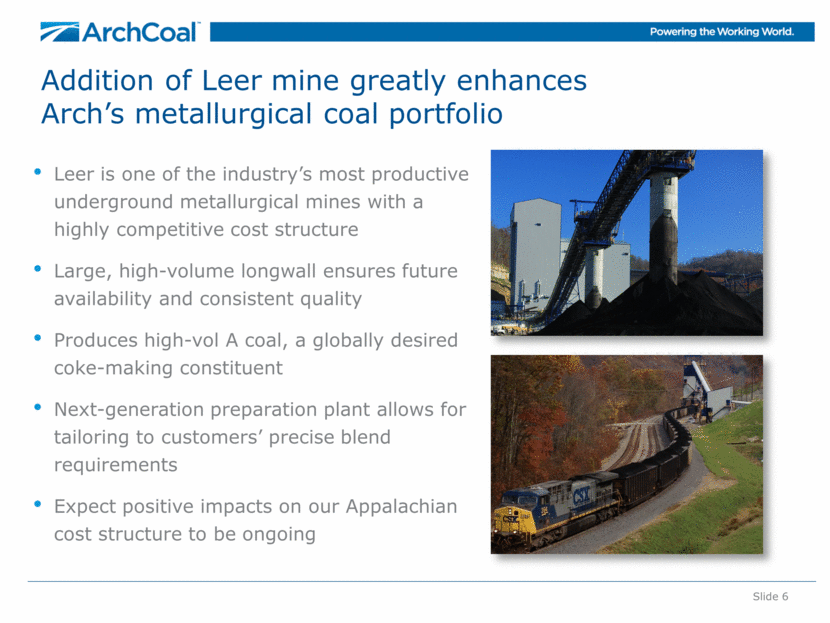
Slide 6 Addition of Leer mine greatly enhances Arch’s metallurgical coal portfolio Leer is one of the industry’s most productive underground metallurgical mines with a highly competitive cost structure Large, high-volume longwall ensures future availability and consistent quality Produces high-vol A coal, a globally desired coke-making constituent Next-generation preparation plant allows for tailoring to customers’ precise blend requirements Expect positive impacts on our Appalachian cost structure to be ongoing |
|
|
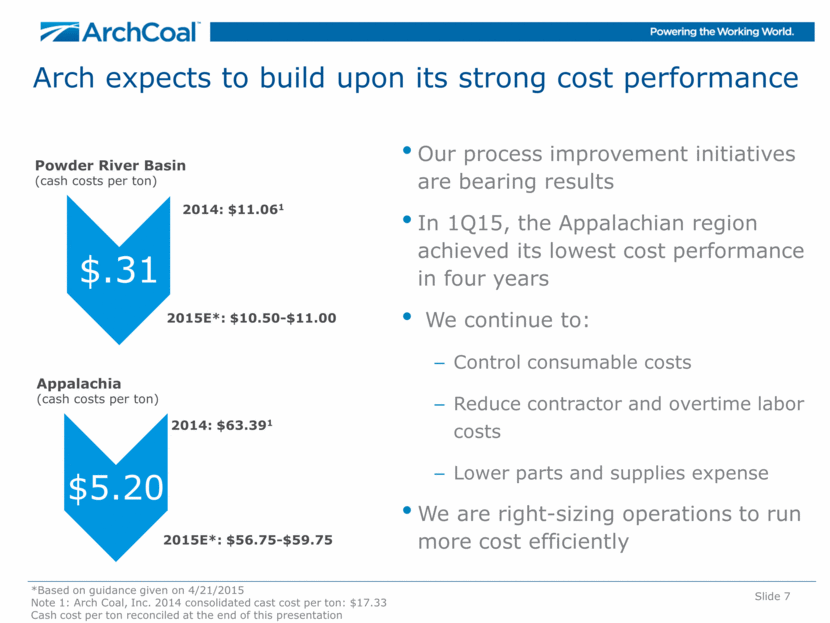
Arch expects to build upon its strong cost performance Slide 7 $11.45 $10.96 $65.48 Powder River Basin (cash costs per ton) Appalachia (cash costs per ton) Our process improvement initiatives are bearing results In 1Q15, the Appalachian region achieved its lowest cost performance in four years We continue to: Control consumable costs Reduce contractor and overtime labor costs Lower parts and supplies expense We are right-sizing operations to run more cost efficiently $11.45 2014: $11.061 2015E*: $10.50-$11.00 2014: $63.391 2015E*: $56.75-$59.75 *Based on guidance given on 4/21/2015 Note 1: Arch Coal, Inc. 2014 consolidated cast cost per ton: $17.33 Cash cost per ton reconciled at the end of this presentation $.31 $5.20 |
|
|
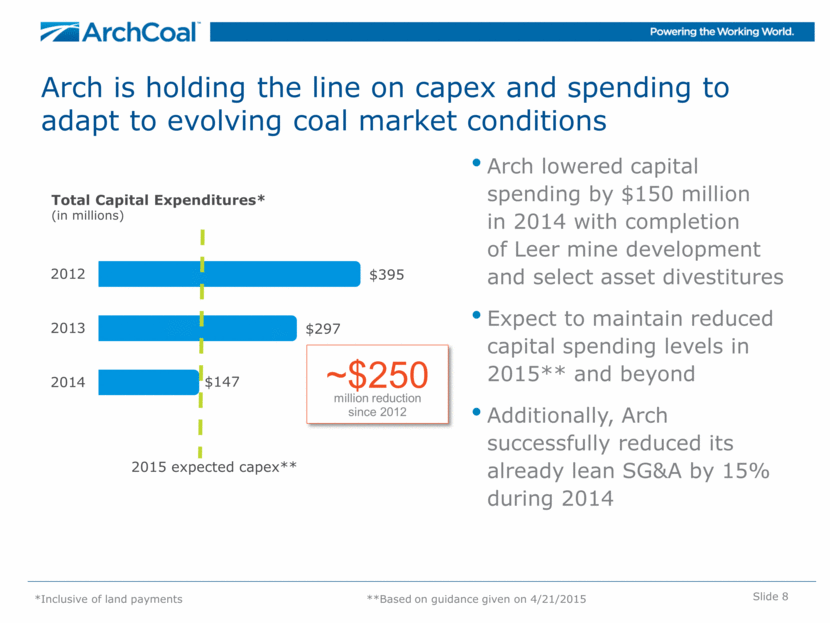
Slide 8 Arch is holding the line on capex and spending to adapt to evolving coal market conditions Total Capital Expenditures* (in millions) *Inclusive of land payments **Based on guidance given on 4/21/2015 ~$250 million reduction since 2012 Arch lowered capital spending by $150 million in 2014 with completion of Leer mine development and select asset divestitures Expect to maintain reduced capital spending levels in 2015** and beyond Additionally, Arch successfully reduced its already lean SG&A by 15% during 2014 2015 expected capex** $147 $297 $395 2014 2013 2012 |
|
|
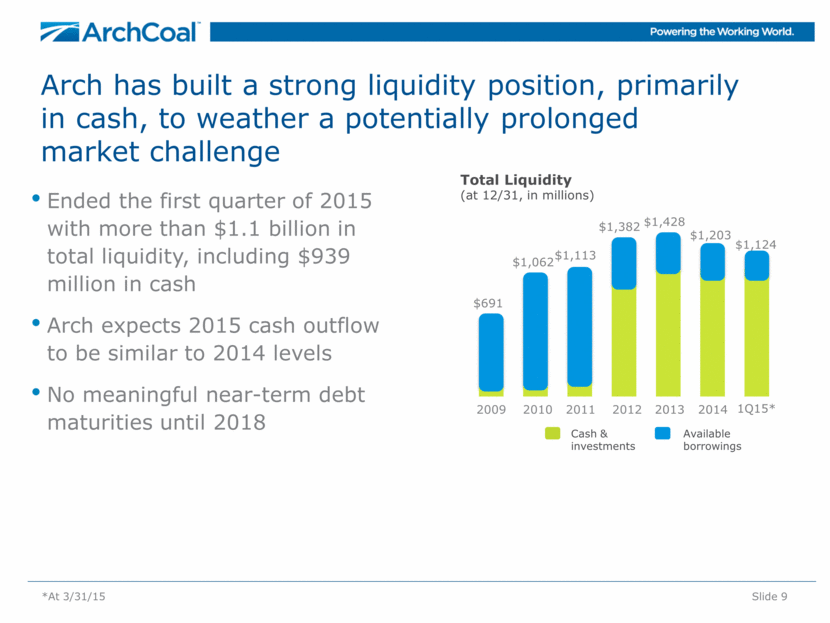
Ended the first quarter of 2015 with more than $1.1 billion in total liquidity, including $939 million in cash Arch expects 2015 cash outflow to be similar to 2014 levels No meaningful near-term debt maturities until 2018 Slide 9 Arch has built a strong liquidity position, primarily in cash, to weather a potentially prolonged market challenge Available borrowings Cash & investments 2009 2010 2011 2012 Total Liquidity (at 12/31, in millions) $1,428 2013 $691 $1,062 $1,113 $1,382 $1,203 2014 1Q15* *At 3/31/15 $1,124 |
|
|
Coal Market Update |
|
|
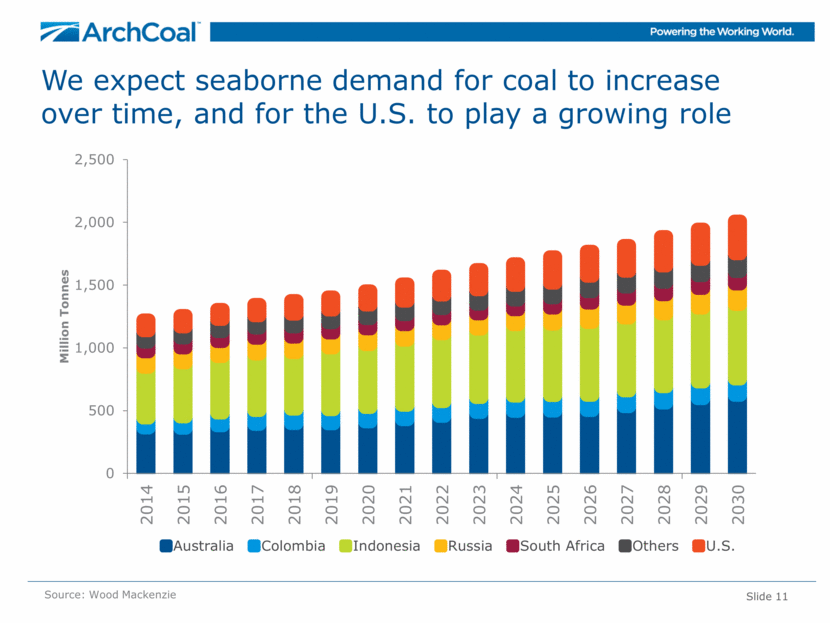
Slide 11 We expect seaborne demand for coal to increase over time, and for the U.S. to play a growing role Source: Wood Mackenzie 0 500 1,000 1,500 2,000 2,500 2014 2015 2016 2017 2018 2019 2020 2021 2022 2023 2024 2025 2026 2027 2028 2029 2030 Million Tonnes Australia Colombia Indonesia Russia South Africa Others U.S. |
|
|
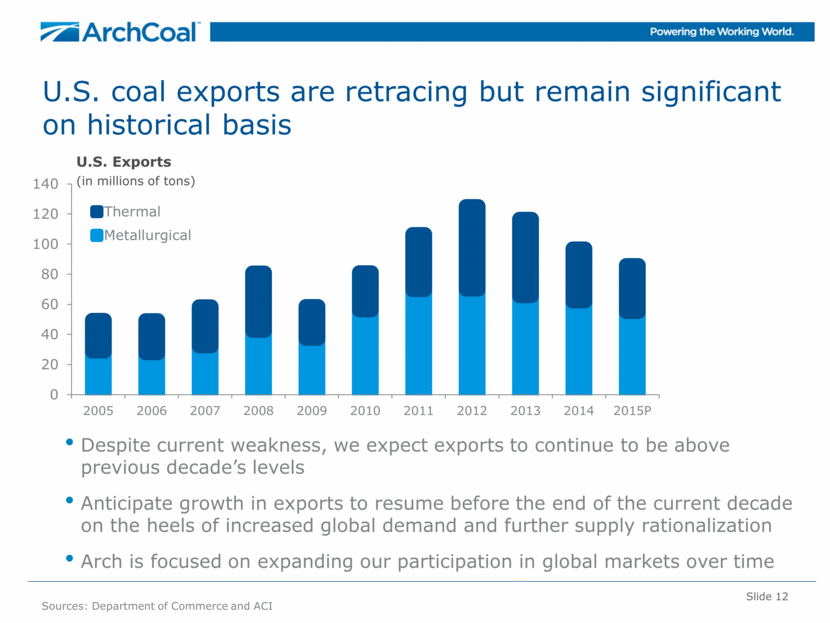
Slide 12 Sources: Department of Commerce and ACI U.S. coal exports are retracing but remain significant on historical basis U.S. Exports (in millions of tons) Despite current weakness, we expect exports to continue to be above previous decade’s levels Anticipate growth in exports to resume before the end of the current decade on the heels of increased global demand and further supply rationalization Arch is focused on expanding our participation in global markets over time 0 20 40 60 80 100 120 140 2005 2006 2007 2008 2009 2010 2011 2012 2013 2014 2015P Thermal Metallurgical |
|
|
The U.S. coal industry and Arch should play an expanding role in seaborne coal markets over time The strong U.S. dollar has reduced competitiveness of U.S. coal in global coal markets but rising global cost curve should render U.S. increasingly competitive over time Large coal reserves, totaling 27% of global inventory Modest annual coal utilization in comparison to overall size of reserves Relatively low CAPEX and stable OPEX Highly reliable, geopolitically stable supplier Cornerstone for Atlantic Basin market – particularly met Compelling source of diversification for Pacific Rim Slide 13 Source: BP Statistical Review of World Energy, June 2014 |
|
|
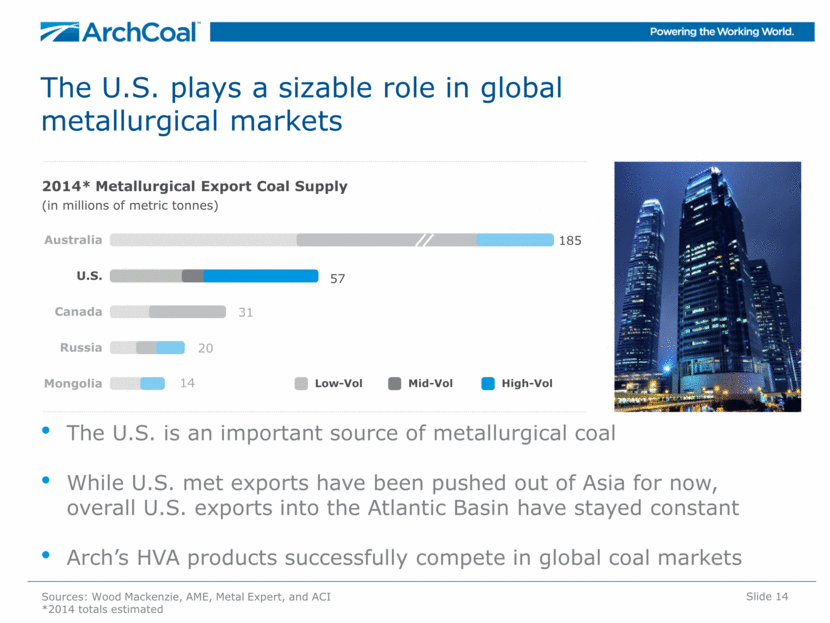
The U.S. plays a sizable role in global metallurgical markets Slide 14 The U.S. is an important source of metallurgical coal While U.S. met exports have been pushed out of Asia for now, overall U.S. exports into the Atlantic Basin have stayed constant Arch’s HVA products successfully compete in global coal markets 2014* Metallurgical Export Coal Supply (in millions of metric tonnes) Low-Vol Mid-Vol High-Vol Sources: Wood Mackenzie, AME, Metal Expert, and ACI *2014 totals estimated 185 57 31 20 14 Australia U.S. Canada Russia Mongolia |
|
|
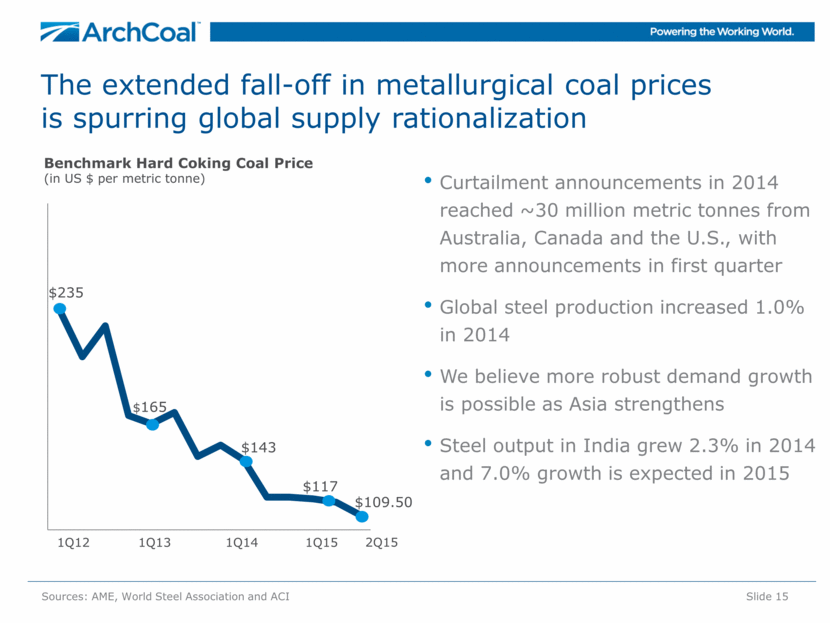
Slide 15 The extended fall-off in metallurgical coal prices is spurring global supply rationalization Benchmark Hard Coking Coal Price (in US $ per metric tonne) Sources: AME, World Steel Association and ACI Curtailment announcements in 2014 reached ~30 million metric tonnes from Australia, Canada and the U.S., with more announcements in first quarter Global steel production increased 1.0% in 2014 We believe more robust demand growth is possible as Asia strengthens Steel output in India grew 2.3% in 2014 and 7.0% growth is expected in 2015 1Q13 1Q12 1Q14 1Q15 $235 $165 $143 $117 $109.50 2Q15 |
|
|
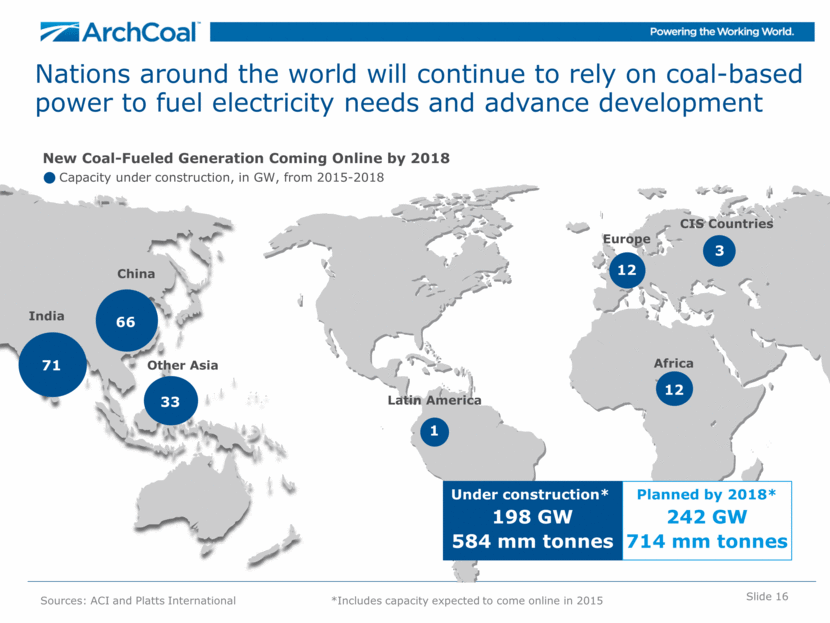
Slide 16 Nations around the world will continue to rely on coal-based power to fuel electricity needs and advance development Africa Europe CIS Countries Other Asia 33 Latin America 1 China 66 71 India 12 12 3 Under construction* 198 GW 584 mm tonnes Planned by 2018* 242 GW 714 mm tonnes New Coal-Fueled Generation Coming Online by 2018 Capacity under construction, in GW, from 2015-2018 Sources: ACI and Platts International *Includes capacity expected to come online in 2015 |
|
|
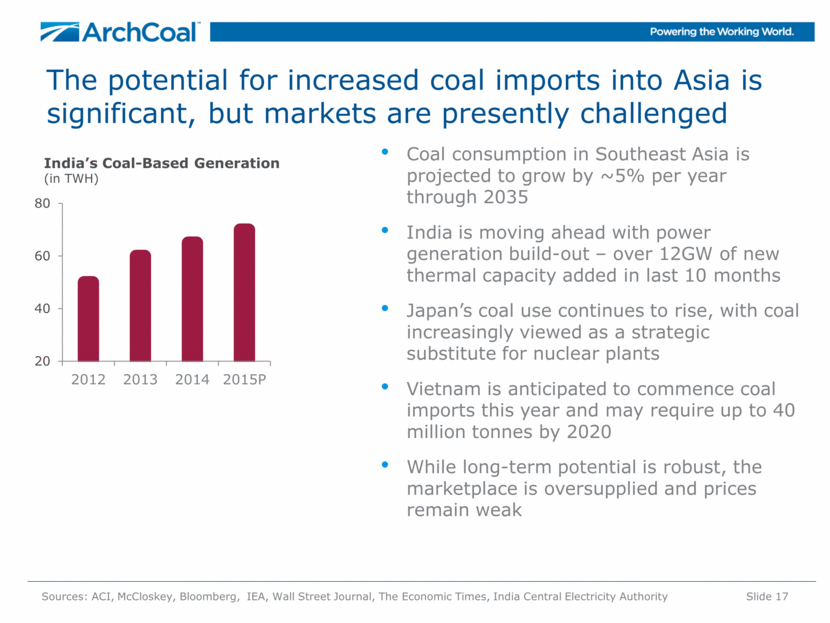
Slide 17 The potential for increased coal imports into Asia is significant, but markets are presently challenged Coal consumption in Southeast Asia is projected to grow by ~5% per year through 2035 India is moving ahead with power generation build-out – over 12GW of new thermal capacity added in last 10 months Japan’s coal use continues to rise, with coal increasingly viewed as a strategic substitute for nuclear plants Vietnam is anticipated to commence coal imports this year and may require up to 40 million tonnes by 2020 While long-term potential is robust, the marketplace is oversupplied and prices remain weak Sources: ACI, McCloskey, Bloomberg, IEA, Wall Street Journal, The Economic Times, India Central Electricity Authority India’s Coal-Based Generation (in TWH) 20 40 60 80 2012 2013 2014 2015P |
|
|
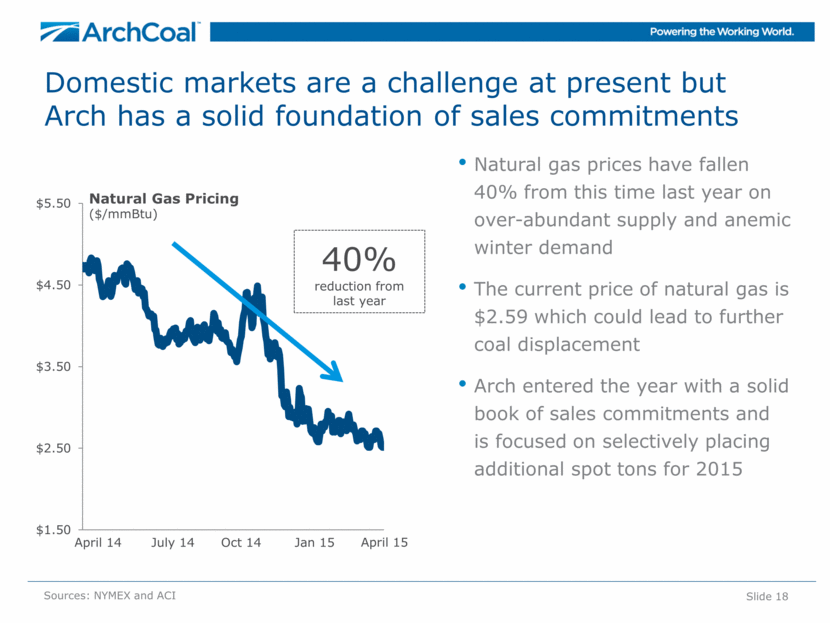
Slide 18 Natural Gas Pricing ($/mmBtu) Sources: NYMEX and ACI Natural gas prices have fallen 40% from this time last year on over-abundant supply and anemic winter demand The current price of natural gas is $2.59 which could lead to further coal displacement Arch entered the year with a solid book of sales commitments and is focused on selectively placing additional spot tons for 2015 July 14 April 14 Oct 14 Jan 15 Domestic markets are a challenge at present but Arch has a solid foundation of sales commitments April 15 40% reduction from last year $1.50 $2.50 $3.50 $4.50 $5.50 |
|
|
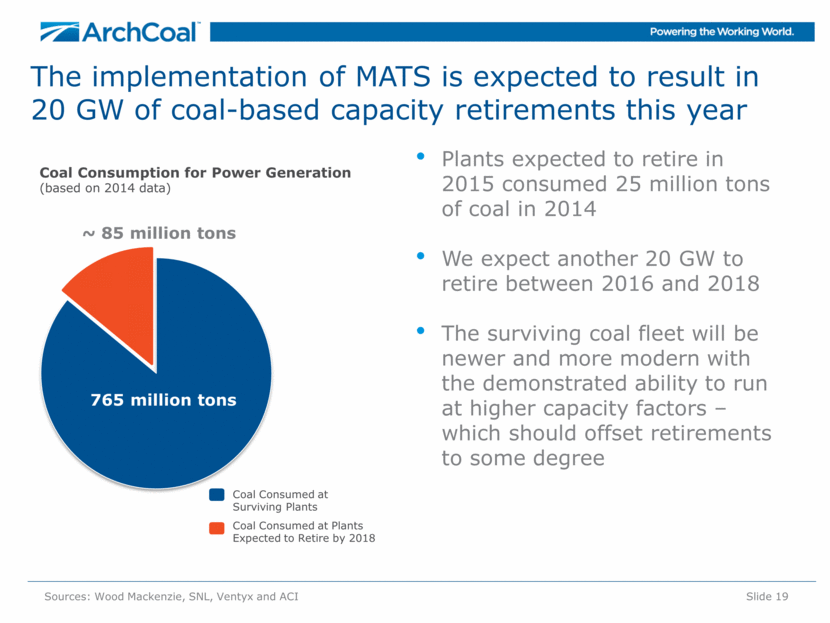
Slide 19 The implementation of MATS is expected to result in 20 GW of coal-based capacity retirements this year Sources: Wood Mackenzie, SNL, Ventyx and ACI Coal Consumption for Power Generation (based on 2014 data) ~ 85 million tons Coal Consumed at Surviving Plants Coal Consumed at Plants Expected to Retire by 2018 ~63% ~37% Plants expected to retire in 2015 consumed 25 million tons of coal in 2014 We expect another 20 GW to retire between 2016 and 2018 The surviving coal fleet will be newer and more modern with the demonstrated ability to run at higher capacity factors – which should offset retirements to some degree 765 million tons |
|
|
Despite headwinds there will still be a significant market for domestic thermal coal Slide 20 Sources: EIA and ACI 40% 37% 60% We expect U.S. coal consumption to decline 80 million tons this year Longer term, coal is expected to remain the largest major fuel source for power generation in the U.S. through 2030 Arch’s low-cost mines – particularly in the PRB – serve us well Potential prolonged weakness should stimulate further U.S. supply rationalization and will help balance domestic markets over time |
|
|
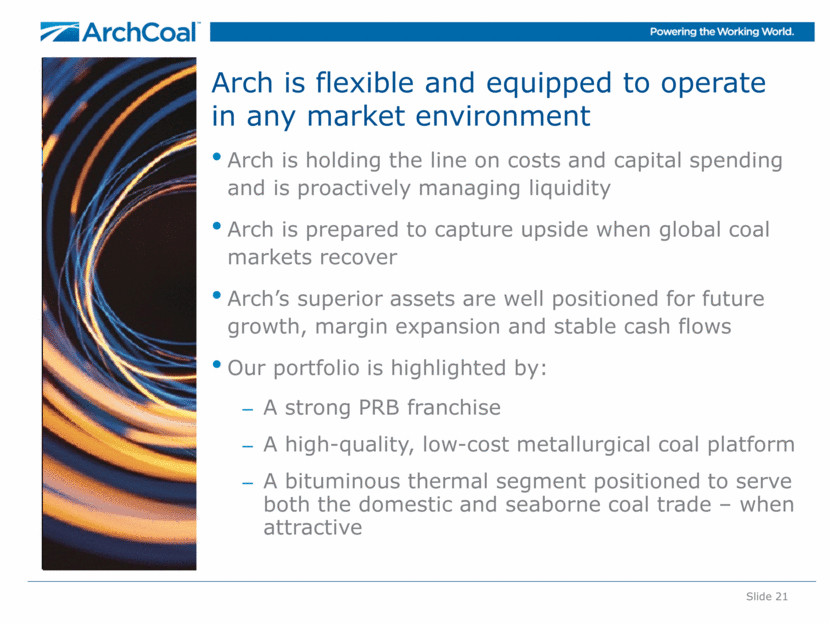
Arch is flexible and equipped to operate in any market environment Slide 21 Arch is holding the line on costs and capital spending and is proactively managing liquidity Arch is prepared to capture upside when global coal markets recover Arch’s superior assets are well positioned for future growth, margin expansion and stable cash flows Our portfolio is highlighted by: A strong PRB franchise A high-quality, low-cost metallurgical coal platform A bituminous thermal segment positioned to serve both the domestic and seaborne coal trade – when attractive |
|
|
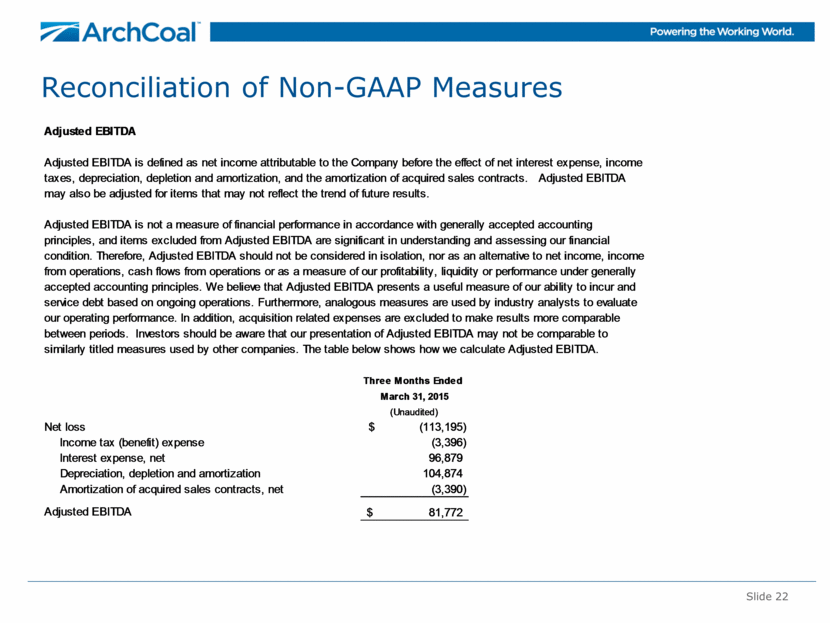
Slide 22 Reconciliation of Non-GAAP Measures Adjusted EBITDA Three Months Ended March 31, 2015 (Unaudited) Net loss (113,195) $ Income tax (benefit) expense (3,396) Interest expense, net 96,879 Depreciation, depletion and amortization 104,874 Amortization of acquired sales contracts, net (3,390) Adjusted EBITDA 81,772 $ condition. Therefore, Adjusted EBITDA should not be considered in isolation, nor as an alternative to net income, income Adjusted EBITDA is defined as net income attributable to the Company before the effect of net interest expense, income taxes, depreciation, depletion and amortization, and the amortization of acquired sales contracts. Adjusted EBITDA may also be adjusted for items that may not reflect the trend of future results. Adjusted EBITDA is not a measure of financial performance in accordance with generally accepted accounting principles, and items excluded from Adjusted EBITDA are significant in understanding and assessing our financial similarly titled measures used by other companies. The table below shows how we calculate Adjusted EBITDA. from operations, cash flows from operations or as a measure of our profitability, liquidity or performance under generally accepted accounting principles. We believe that Adjusted EBITDA presents a useful measure of our ability to incur and service debt based on ongoing operations. Furthermore, analogous measures are used by industry analysts to evaluate our operating performance. In addition, acquisition related expenses are excluded to make results more comparable between periods. Investors should be aware that our presentation of Adjusted EBITDA may not be comparable to |
|
|
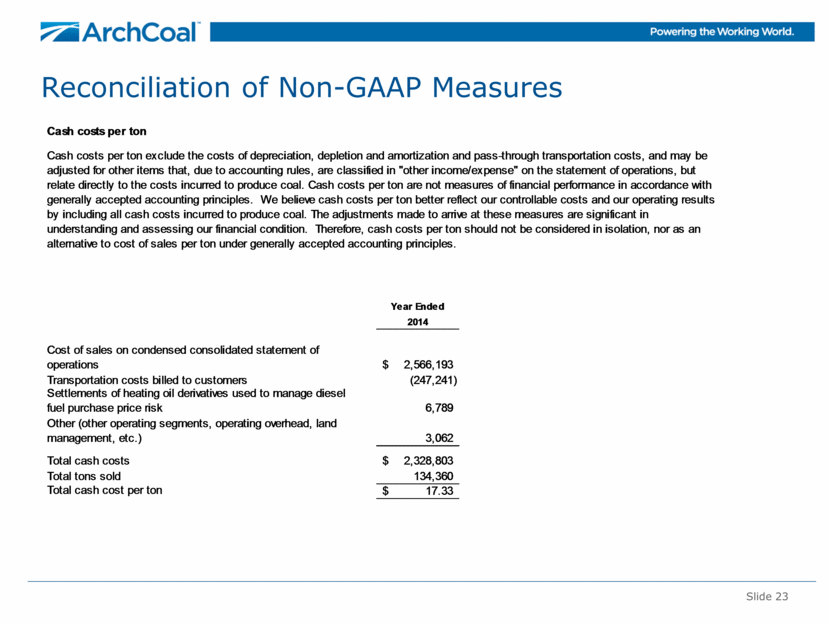
Slide 23 Reconciliation of Non-GAAP Measures Cash costs per ton Year Ended 2014 Cost of sales on condensed consolidated statement of operations 2,566,193 $ Transportation costs billed to customers (247,241) Settlements of heating oil derivatives used to manage diesel fuel purchase price risk 6,789 Other (other operating segments, operating overhead, land management, etc.) 3,062 Total cash costs 2,328,803 $ Total tons sold 134,360 Total cash cost per ton 17.33 $ Cash costs per ton exclude the costs of depreciation, depletion and amortization and pass-through transportation costs, and may be adjusted for other items that, due to accounting rules, are classified in "other income/expense" on the statement of operations, but relate directly to the costs incurred to produce coal. Cash costs per ton are not measures of financial performance in accordance with generally accepted accounting principles. We believe cash costs per ton better reflect our controllable costs and our operating results by including all cash costs incurred to produce coal. The adjustments made to arrive at these measures are significant in understanding and assessing our financial condition. Therefore, cash costs per ton should not be considered in isolation, nor as an alternative to cost of sales per ton under generally accepted accounting principles. |
|
|
Annual Meeting of Shareholders John W. Eaves, President & CEO Saint Louis April 23, 2015 |