Attached files
| file | filename |
|---|---|
| 8-K - FORM 8-K - UNITED COMMUNITY BANKS INC | t82102_8k.htm |
| EX-99.1 - EXHIBIT 99.1 - UNITED COMMUNITY BANKS INC | t82102_ex99-1.htm |
Exhibit 99.2
ucbi.com | 1

ucbi.com | 2 Disclosures common equity to tangible assets, tangible equity to tangible assets and tangible common equity to risk - weighted assets. The most comparable GAAP measures to these measures are: fee revenue, operating expense, net income (loss), and equity to assets. Management uses these non-GAAP financial measures because we believe they are useful for evaluating our operations and performance over periods of time, as well as in managing and evaluating our business and in discussions about our operations and performance. Management believes these non -GAAP financial measures provide users of our financial information with a meaningful measure for assessing our financial results and credit trends, as well as for comparison to financial results for prior periods. These non -GAAP financial measures should not be considered as a substitute for financial measures determined in accordance with GAAP and may not be comparable to other similarly titled financial measures used by other companies. For a reconciliation of the differences between our non -GAAP financial measures and the most comparable GAAP measures, please refer to the ‘Non-GAAP Reconcilement Tables’at the end of the Appendix to this presentation. CAUTIONARY STATEMENT This investor presentation may contain forward -looking statements, as defined by federal securities laws, including statements about United’s financial outlook and business environment. These statements are based on current expectations and are provided to assist in the understanding of future financial performance. Such performance involves risks and uncertainties that may cause actual results to differ materially from those expressed or implied in any such statements. For a discussion of some of the risks and other factors that may cause such forward -looking statements to differ materially from actual results, please refer to United Community Banks, Inc.’s filings with the Securities and Exchange Commission, including its 2014 Annual Report on Form 10-K and its most recent quarterly report on Form 10-Q under the sections entitled “Forward-Looking Statements”. Forward-looking statements speak only as of the date they are made, and we undertake no obligation to update or revise forward -looking statements. NON-GAAP MEASURES This presentation also contains financial measures determined by methods other than in accordance with generally accepted accounting principles ( “GAAP”). Such non-GAAP financial measures include: core fee revenue, core operating expense, core earnings, tangible ucbi.com | 2

ucbi.com | 3 Highlights First Quarter 2015 (in millions) 1Q15 4Q14 1Q14 Net Income ($ in millions) + $17.7 $18.2 $15.4 EPS + $.29 $.30 $.25 ROA + .94% .96% .85% ROCE + 9.34% 9.60% 8.64% ucbi.com | 3 IMPROVING QUARTERLY RESULTS Net Interest Revenue ► $57.6 Million vs. $58.3 Million in 4Q14 and $54.2 Million in 1Q15 ● Loan growth of $116 million in 1Q15, up $432 million, or 10%, from 1Q14 ● Driven by community bank loan production of $314 million and specialized lending production of $108 million ● Margin of 3.31% vs. 3.31% in 4Q14 and 3.21% in 1Q14 o Balance sheet restructured late 2Q14 o Loan yield of 4.28%, down 9 bps from 4Q14; investment sec’s yield of 2.21%, down 4 bps from 4Q14 Core Fee Revenue ► $ 15.1 Million -Up $3.2 million from 1Q14 ● Gain on sales of SBA loans of $1.14 million vs. $.926 million in4Q14 and $0 in 1Q14 ● Mortgage revenue of $2.76 million, up $1.40 million from 4Q14

ucbi.com | 4 Highlights First Quarter 2015 ucbi.com | 4 IMPROVING QUARTERLY RESULTS Loan Growth ► Growth in Many Sectors ● Loan growth of $116 million, or 10% annualized ● Loan Production of $423 million vs. $401 million 4Q14 and $288 million year ago Core Transaction Deposits ► Up $206 Million from Fourth Quarter, or 22% Annualized ● Up $324 million from 1Q14, or 9% ● Represents 65.6% of total customer deposits Credit Quality ► Solid Improvement ● Provision of $1.8 million vs. $2.5 million 1Q14 ● Net charge-offs decline to .22% of total loans vs. .38% in 1Q14 ● NPAs were .26% of total assets vs. .26% in 4Q14 and .42% in 1Q14 ● Allowance 1.46% of total loans vs. 1.53% at 4Q14 and 1.73% at 1Q14 Capital Ratios ► Solid and Well-Capitalized ● Quarterly dividend of 5 cents per share ● Redeemed $15.5 million of Trust Preferred Securities ● Tier I Common to Risk Weighted Assets of 11.5%; Tangible Common to RWAs of 13.5% ● Tier I Risk Based Capital of 11.5% and Tier I Leverage of 8.7% Acquisition ► Executing Growth Strategy ● Announced merger with MoneyTree Corporation (First National Bank); regulatory approvals received; planned closing May 1 ● Announced merger with Palmetto Bancshares (The Palmetto Bank) onApril 22; expect closing in fourth quarter

ucbi.com | 5 1Q15 4Q14 1Q14 Salaries & Employee Benefits 26,362$ 185$ 2,151$ Communications & Equipment 3,271 118 32 Occupancy 3,278 (170) (100) FDIC Assessment 1,209 326 (144) Advertising & Public Relations 750 (52) 124 Postage, Printing & Supplies 938 (148) 162 Professional Fees 1,919 (115) 492 Other Expense 4,464 (34) 725 Core Operating Expenses 42,191 110 3,442 Non-Core (1) 870 1,032 569 Reported GAAP 43,061$ 1,142$ 4,011$ 1Q15 4Q14 1Q14 Efficiency Ratio 59.15 % 57.47 % 59.05 % Variance - Incr/(Decr) 1Q15 4Q14 1Q14 Overdraft Fees 2,598$ (338)$ (322)$ Interchange Fees 3,638 (339) 107 Other Service Charges 1,379 (154) (68) Total Service Charges and Fees 7,615 (831) (283) Mortgage Loan & Related Fees 2,755 644 1,401 Brokerage Fees 1,551 375 374 Gains from SBA Loan Sales 1,141 215 1,141 Other 2,058 164 557 Total Fee Revenue - Core 15,120 567 3,190 Non-Core (1) 562 292 316 Reported - GAAP 15,682$ 859$ 3,506$ Variance - 1Q15 4Q14 1Q14 Net Interest Revenue 57,617$ (715)$ 3,448$ Fee Revenue 15,120 505 3,190 Gross Revenue 72,737 (210) 6,638 Operating Expense (Excl OREO) 42,191 (48) 3,442 Pre-Tax, Pre-Credit (Core) 30,546$ (258)$ 3,196$ Net Interest Margin 3.31 % - % .10 % Variance - Incr/(Decr) Trends –Core Earnings, Fee Revenue, and Expenses $ in Thousands $ in Thousands (1) Includes securities gains / losses, charges on prepayment of borrowings, and gains / losses on deferred compensation plan assets (2) Includes foreclosed property costs, severance costs, reversal of previously established litigation reserve, reimbursement of claimed interest for the initial period of the loss sharing agreements, charge for settlement of loss sharing agreements and gains / losses on deferred compensation plan liabilities. $ in Thousands Core Earnings $30.5 Million Up $3.2 million from 1Q14 and Down $258 K from 4Q14 Core Operating Expenses Millions Core Earnings Core Fee Revenue ucbi.com | 5

ucbi.com | 6 Key Drivers of Net Interest Revenue / Margin KEY DRIVERS OF NIR NET INTEREST REVENUE & MARGIN Loan / Securities Pricing Deposit Pricing (excl. brokered) Loan Yields Securities Yields Avg Rate on Int Bearing Dep’s • CD pricing reflects the quarter-average new and renewed yield • MMDA / NOW pricing reflects the deposit yield for each quarter • CD pricing reflects the quarter-average new and renewed yield • MMDA / NOW pricing reflects the deposit yield for each quarter CDs MMDA NOW Millions ucbi.com | 6

ucbi.com | 7 Balance Sheet Growth – New Loans Funded and Advances (1) CATEGORY CATEGORY 1Q15 4Q14 1Q14 Banks: 1Q15 4Q14 1Q14 Commercial C & I 107.5$ 115.9$ 74.7$ Atlanta 98.0$ 91.6$ 86.1$ Owner Occupied CRE 54.2 56.0 48.9 Coastal Georgia 43.4 34.0 31.1 Income Producing CRE 68.3 45.9 41.1 N. Georgia 47.0 54.9 41.3 Commercial Constr. 9.5 6.0 1.9 North Carolina 19.6 33.2 16.9 Total Commercial 239.5 223.8 166.6 Tennessee 15.0 24.1 9.6 Residential Mortgage 25.5 32.7 15.2 Gainesville 12.3 14.3 8.9 Residential HELOC 29.4 37.0 30.1 South Carolina (2) 112.0 96.6 60.3 Residential Construction 37.8 40.8 29.6 Other (Indirect Auto) 75.5 52.4 33.3 Consumer 90.6 66.8 46.0 Total Markets 422.8$ 401.1$ 287.5$ Total Categories 422.8$ 401.1$ 287.5$ 1Q15 4Q14 1Q14 Asset-based Lending 8.9$ 1.4$ -$ Commercial RE 36.0 17.1 25.0 Healthcare 39.5 53.7 19.8 Middle Market 16.7 11.0 13.0 SBA 7.3 4.8 - Total Special'd Lending 108.4$ 88.0$ 57.8$ (1) Represents new loans funded and net loan advances (net of payments on lines of credit) (2) Includes Specialized Lending New Loans Funded and Advances Specialized Lending (Included in South Carolina) $ in Millions MARKET MARKET ucbi.com | 7

ucbi.com | 8 Loan Growth 2011 2012 2013 2014 1Q15 LOANS - BUSINESS MIX BY CATEGORY Commercial: Comm & Indus 428$ 458$ 472$ 710$ 716$ Owner Occ'd 1,112 1,131 1,134 1,163 1,167 Total C & I 1,540 1,589 1,606 1,873 1,883 Income Prod CRE 710 682 623 599 636 Comm Constr 164 155 149 196 230 Total Comm 2,414 2,426 2,378 2,668 2,749 Resi Mortgage 835 829 875 866 864 HELOC 300 385 441 466 465 Resi Constr 448 382 328 299 291 Consum / Install 113 115 111 104 103 Indirect Auto - 38 196 269 316 Total Loans 4,110$ 4,175$ 4,329$ 4,672$ 4,788$ 2011 2012 2013 2014 1Q15 LOANS - BY REGION North Georgia 1,426$ 1,364$ 1,240$ 1,163$ 1,150$ Atlanta MSA 1,220 1,250 1,275 1,282 1,296 North Carolina 597 579 572 553 539 Coastal Georgia 346 400 423 456 476 Gainesville MSA 265 261 255 257 255 East Tennessee 256 283 280 280 281 So Carolina/Specialized - - 88 412 475 Indirect Auto - 38 196 269 316 Total Loans 4,110$ 4,175$ 4,329$ 4,672$ 4,788$ Millions Millions ucbi.com | 8
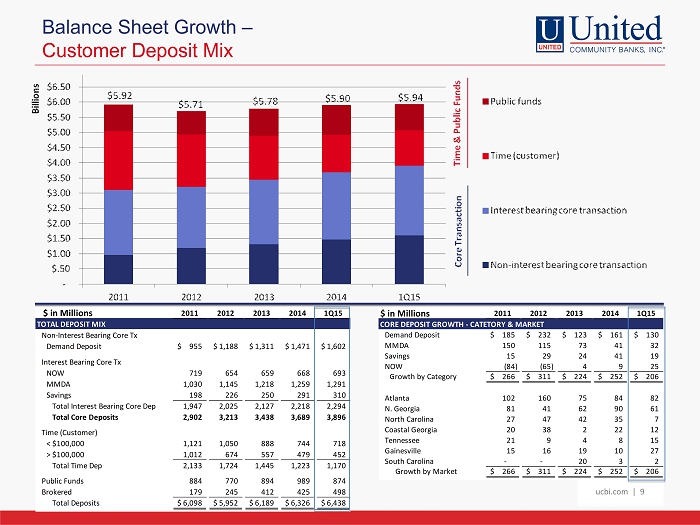
ucbi.com | 9 Balance Sheet Growth – Customer Deposit Mix 2011 2012 2013 2014 1Q15 TOTAL DEPOSIT MIX Non-Interest Bearing Core Tx Demand Deposit 955$ 1,188$ 1,311$ 1,471$ 1,602$ Interest Bearing Core Tx NOW 719 654 659 668 693 MMDA 1,030 1,145 1,218 1,259 1,291 Savings 198 226 250 291 310 Total Interest Bearing Core Dep 1,947 2,025 2,127 2,218 2,294 Total Core Deposits 2,902 3,213 3,438 3,689 3,896 Time (Customer) < $100,000 1,121 1,050 888 744 718 > $100,000 1,012 674 557 479 452 Total Time Dep 2,133 1,724 1,445 1,223 1,170 Public Funds 884 770 894 989 874 Brokered 179 245 412 425 498 Total Deposits 6,098$ 5,952$ 6,189$ 6,326$ 6,438$ 2011 2012 2013 2014 1Q15 CORE DEPOSIT GROWTH - CATETORY & MARKET Demand Deposit 185$ 232$ 123$ 161$ 130$ MMDA 150 115 73 41 32 Savings 15 29 24 41 19 NOW (84) (65) 4 9 25 Growth by Category 266$ 311$ 224$ 252$ 206$ Atlanta 102 160 75 84 82 N. Georgia 81 41 62 90 61 North Carolina 27 47 42 35 7 Coastal Georgia 20 38 2 22 12 Tennessee 21 9 4 8 15 Gainesville 15 16 19 10 27 South Carolina - - 20 3 2 Growth by Market 266$ 311$ 224$ 252$ 206$ $ in Millions $ in Millions ucbi.com | 9

ucbi.com | 10 Earnings per Share to Return on Assets EARNINGS PER SHARE RETURN ON ASSETS ucbi.com | 10

ucbi.com | 11 Capital Ratios (1) ucbi.com | 11 HOLDING COMPANY Well-Cap 1Q15 4Q14 3Q14 2Q14 1Q14 Tier I RBC 6% 11.5% 12.1% 12.1% 11.8% 11.1% Total RBC 10 12.8 13.3 13.3 13.0 12.4 Leverage 5 8.7 8.7 8.7 8.3 8.0 Tier I Common RBC 11.5 11.1 11.0 10.7 10.1 Tangible Comm to Assets 9.8 9.7 9.8 9.6 9.2 Tangible Equity to Assets 9.8 9.7 9.8 9.6 9.5 BANK Well-Cap 1Q15 4Q14 3Q14 2Q14 1Q14 Tier I RBC 6% 11.8% 12.9% 12.6% 13.4% 12.6% Total RBC 10 13.1 14.1 13.8 14.6 13.9 Leverage 5 8.9 9.3 9.1 9.4 9.1 (1) March 31, 2015 calculated under Basel III rules, which became effective January 1, 2015.

ucbi.com | 12 1Q15 4Q14 3Q14 2Q14 1Q14 CORE FEE REVENUE Core fee revenue 15,120$ 14,553$ 14,419$ 13,938$ 11,930$ Securities gains, net 1,539 208 11 4,435 217 Losses on prepayment of borrowings (1,038) - - (4,446) Mark to market on deferred compensation plan assets 61 62 (18) 216 29 Fee revenue (GAAP) 15,682$ 14,823$ 14,412$ 14,143$ 12,176$ CORE OPERATING EXPENSE Core operating expense 42,191$ 42,081$ 41,097$ 40,131$ 38,749$ Foreclosed property expense 96 131 285 102 116 Severance 23 353 - 83 156 Reversal of litigation reserve - (1,200) - - - Loss share settlements 690 492 - - - Mark to market on deferred compensation plan liability 61 62 (18) 216 29 Operating expense (GAAP) 43,061$ 41,919$ 41,364$ 40,532$ 39,050$ TANGIBLE COMMON EQUITY AND TANGIBLE EQUITY TO TANGIBLE ASSETS Tangible common equity to tangible assets 9.82 % 9.72 % 9.83 % 9.58 % 9.22 % Effect of preferred equity - - - - .28 Tangible equity to tangible assets 9.82 9.72 9.83 9.58 9.50 Effect of goodwill and other intangibles .04 .04 .02 .03 .02 Equity to assets (GAAP) 9.86 % 9.76 % 9.85 % 9.61 % 9.52 % TANGIBLE COMMON EQUITY TO RISK-WEIGHTED ASSETS (1) Tangible common equity to risk-weighted assets 13.53 % 13.82 % 14.10 % 13.92 % 13.63 % Effect of preferred equity - - - - - Tangible equity to risk weighted assets 13.53 13.82 14.10 13.92 13.63 Effect of deferred tax limitation (2.86) (3.11) (3.39) (3.74) (3.92) Effect of other comprehensive income .19 .35 .34 .53 .36 Effect of trust preferred .67 1.00 1.02 1.04 1.03 Tier I capital ratio (Regulatory) 11.53 % 12.06 % 12.07 % 11.75 % 11.10 % Operating Earnings to GAAP Earnings Reconciliation Non-GAAP Reconciliation Tables $ in Thousands ucbi.com | 12 (1) March 31, 2015 calculated under Basel III rules, which became effective January 1, 2015.