Attached files
| file | filename |
|---|---|
| 8-K - FORM 8-K - TTM TECHNOLOGIES INC | d910896d8k.htm |
| Exhibit 99.1
|
Lenders’ Presentation
April 2015
|
|
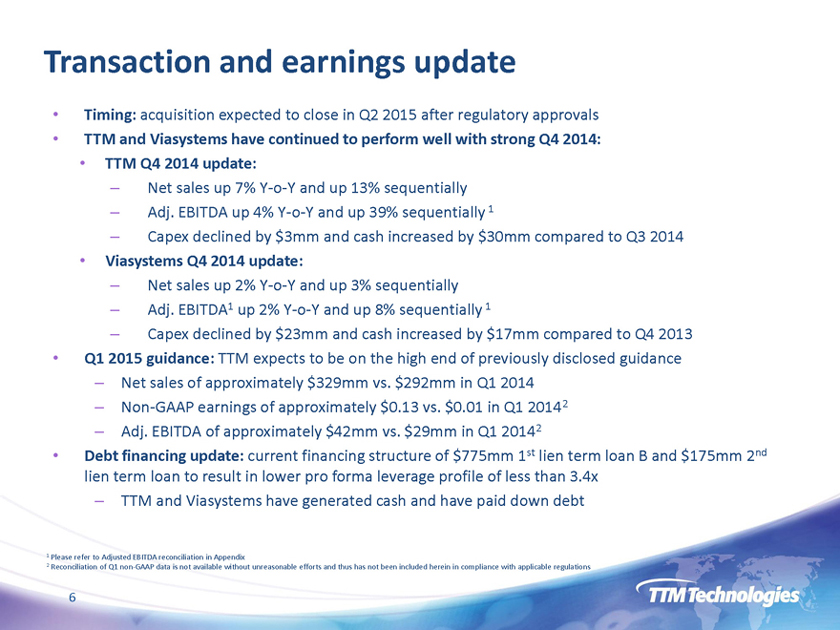
Transaction and earnings update
• Timing: acquisition expected to close in Q2 2015 after regulatory approvals
• TTM and Viasystems have continued to perform well with strong Q4 2014:
• TTM Q4 2014 update:
– Net sales up 7% Y-o-Y and up 13% sequentially
– Adj. EBITDA up 4% Y-o-Y and up 39% sequentially 1
– Capex declined by $3mm and cash increased by $30mm compared to Q3 2014
• Viasystems Q4 2014 update:
– Net sales up 2% Y-o-Y and up 3% sequentially
– Adj. EBITDA1 up 2% Y-o-Y and up 8% sequentially 1
– Capex declined by $23mm and cash increased by $17mm compared to Q4 2013
• Q1 2015 guidance: TTM expects to be on the high end of previously disclosed guidance
– Net sales of approximately $329mm vs. $292mm in Q1 2014
– Non-GAAP earnings of approximately $0.13 vs. $0.01 in Q1 20142
– Adj. EBITDA of approximately $42mm vs. $29mm in Q1 20142
• Debt financing update: current financing structure of $775mm 1st lien term loan B and $175mm 2nd lien term loan to result in lower pro forma leverage profile of less than 3.4x
– TTM and Viasystems have generated cash and have paid down debt
1 Please refer to Adjusted EBITDA reconciliation in Appendix
2 Reconciliation of Q1 non-GAAP data is not available without unreasonable efforts and thus has not been included herein in compliance with applicable regulations
6
|
|
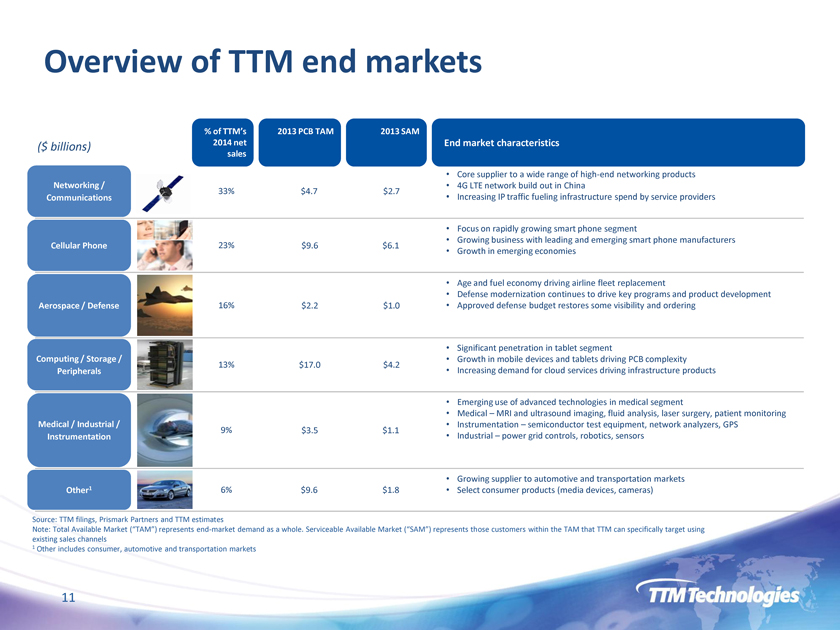
Overview of TTM end markets
Core supplier to a wide range of high-end networking products
4G LTE network build out in China
Increasing IP traffic fueling infrastructure spend by service providers
Focus on rapidly growing smart phone segment
Growing business with leading and emerging smart phone manufacturers
Growth in emerging economies
Age and fuel economy driving airline fleet replacement
Defense modernization continues to drive key programs and product development
Approved defense budget restores some visibility and ordering
Significant penetration in tablet segment
Growth in mobile devices and tablets driving PCB complexity
Increasing demand for cloud services driving infrastructure products
Emerging use of advanced technologies in medical segment
Medical – MRI and ultrasound imaging, fluid analysis, laser surgery, patient monitoring
Instrumentation – semiconductor test equipment, network analyzers, GPS
Industrial – power grid controls, robotics, sensors
Growing supplier to automotive and transportation markets
Select consumer products (media devices, cameras)
Networking / Communications Medical / Industrial / InstrumentationNetworking / Communications
Cellular Phone
Aerospace / Defense
Computing / Storage / Peripherals
Other1
2013 PCB TAM
2013 SAM
$4.7
$3.5 $9.6 $2.7 $1.1 $1.8
($ billions) 33% 9%
6%% of TTM’s 2014 net sales
Aerospace / Defense
Source: TTM filings, Prismark Partners and TTM estimates
Note: Total Available Market (“TAM”) represents end-market demand as a whole. Serviceable Available Market (“SAM”) represents those customers within the TAM that TTM can specifically target using existing sales channels
1 Other includes consumer, automotive and transportation markets
11
|
|
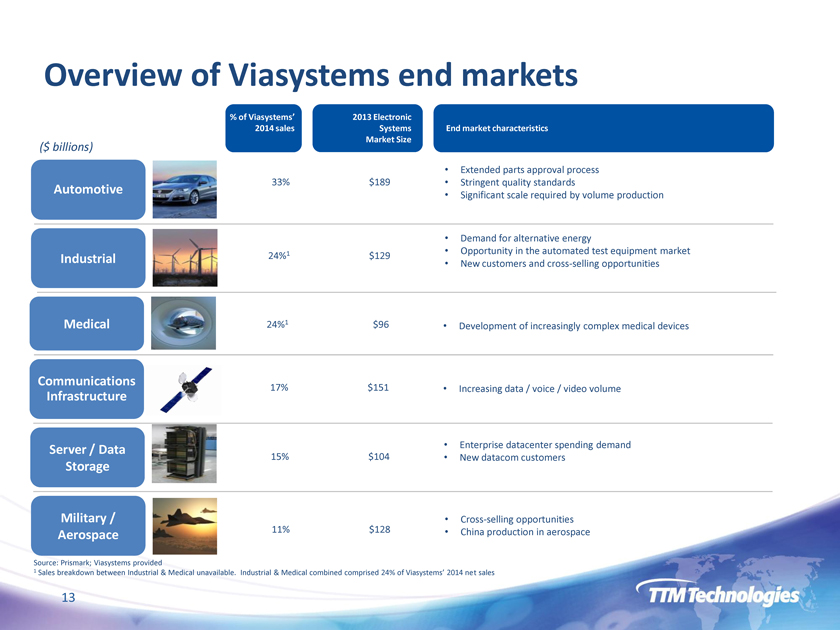
Overview of Viasystems end markets
Extended parts approval process
Stringent quality standards
Significant scale required by volume production
Increasing data / voice / video volume
$189
$151
Source: Prismark; Viasystems provided
1 Sales breakdown between Industrial & Medical unavailable. Industrial & Medical combined comprised 24% of Viasystems’ 2014 net sales ($ billions)
% of Viasystems’ 2014 sales
33%
17%
Server / Data Storage
Enterprise datacenter spending demand
New datacom customers
$104
15%
Industrial
Demand for alternative energy
Opportunity in the automated test equipment market
New customers and cross-selling opportunities
$129
24%1
Medical
Development of increasingly complex medical devices
$96
24%1
Military / Aerospace
Cross-selling opportunities
China production in aerospace
$128
Source: Prismark; Viasystems provided
1 Sales breakdown between Industrial & Medical unavailable. Industrial & Medical combined comprised 24% of Viasystems’ 2014 net sales
13
|
|
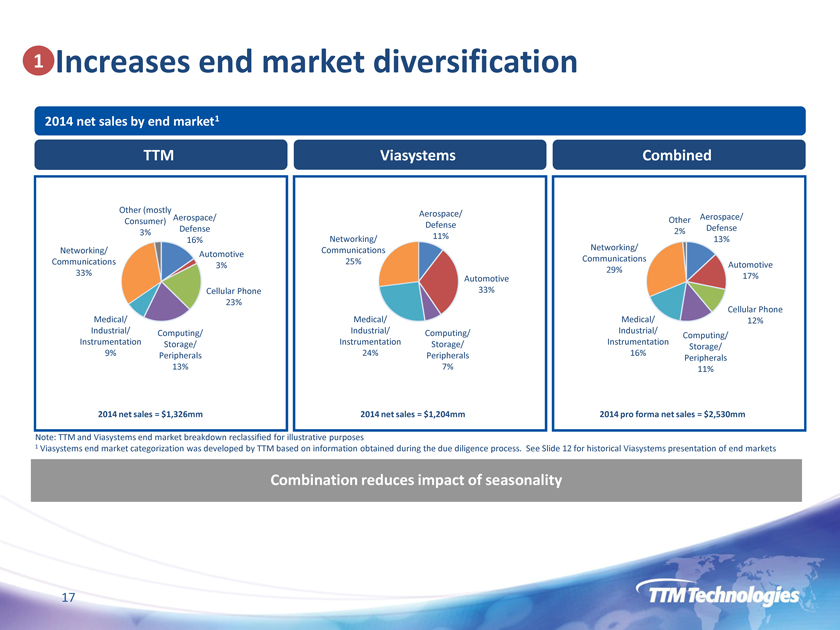
Increases end market diversification
2014 net sales by end market1
17 Aerospace/ Defense 13% Automotive 17% Cellular Phone 12% Computing/ Storage/ Peripherals 11% Medical/ Industrial/ Instrumentation 16%
Networking/
Communications
29% Other 2%
Aerospace/
Defense
11% Automotive 33% Computing/ Storage/ Peripherals 7% Medical/ Industrial/ Instrumentation 24% Networking/ Communications 25%
Aerospace/
Defense
16%
Automotive
3%
Cellular Phone
23%
Computing/
Storage/
Peripherals
13% Medical/ Industrial/ Instrumentation 9% Networking/ Communications 33% Other (mostly Consumer) 3%
Note: TTM and Viasystems end market breakdown reclassified for illustrative purposes
1 Viasystems end market categorization was developed by TTM based on information obtained during the due diligence process. See Slide 12 for historical Viasystems presentation of end markets
Combination reduces impact of seasonality
17
|
|
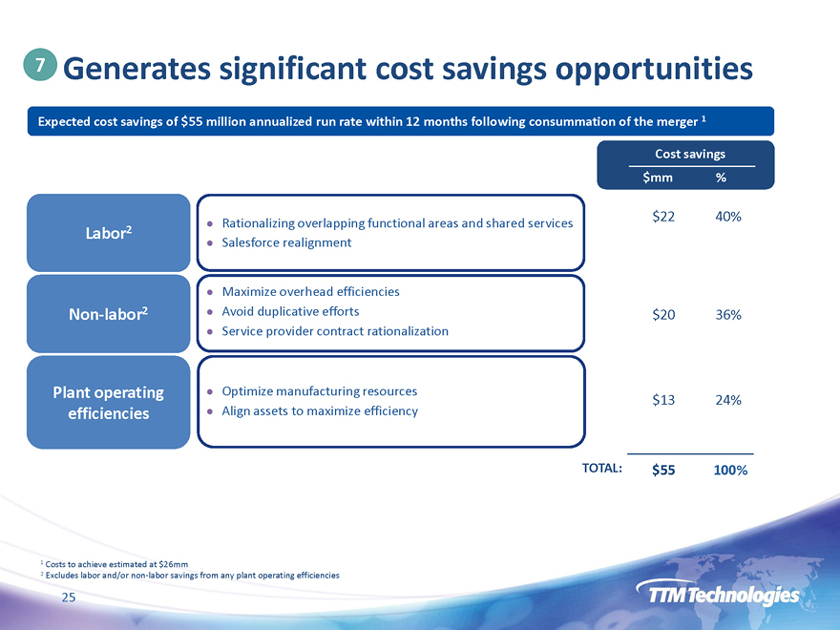
7 Generates significant cost savings opportunities
Expected cost savings of $55 million annualized run rate within 12 months following consummation of the merger 1 Cost savings
$mm %
Labor2
Non-labor2
Plant operating efficiencies
Rationalizing overlapping functional areas and shared services
Salesforce realignment
Maximize overhead efficiencies
Avoid duplicative efforts
Service provider contract rationalization
Optimize manufacturing resources
Align assets to maximize efficiency
$22 40%
$20 36%
$13 24%
$55 100%
TOTAL:
1 Costs to achieve estimated at $26mm
2 Excludes labor and/or non-labor savings from any plant operating efficiencies
25
|
|
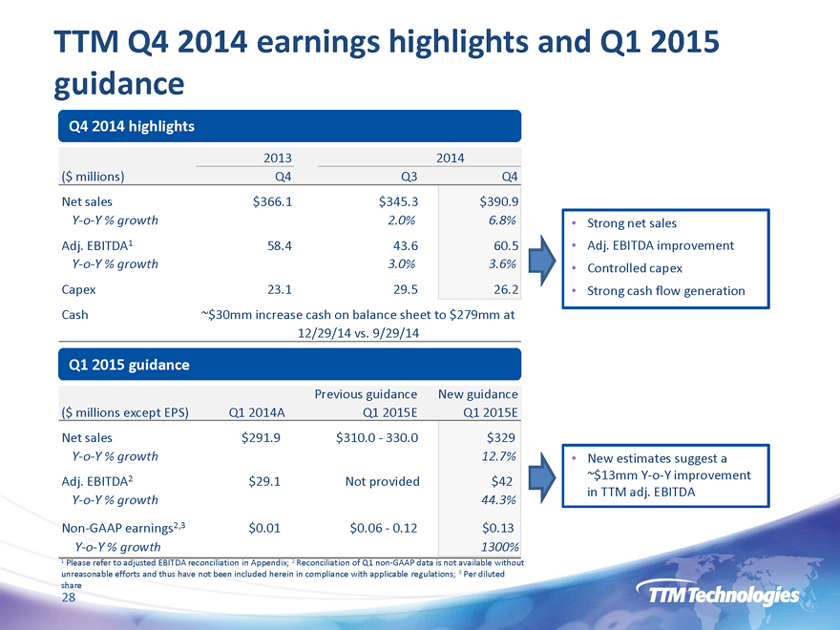
TTM Q4 2014 earnings highlights and Q1 2015 guidance
Q4 2014 highlights
($ millions) Net sales
Y-o-Y % growth
Adj. EBITDA1
Y-o-Y % growth
Capex Cash
Q1 2015 guidance
($ millions except EPS) Net sales
Y-o-Y % growth
Adj. EBITDA2
Y-o-Y % growth
Non-GAAP earnings2,3
Y-o-Y % growth
1
2013 Q4
$366.1 58.4 23.1
Q3 $345.3
2.0%
43.6
3.0%
29.5
2014
Q4 $390.9
6.8%
60.5
3.6%
26.2
• Strong net sales
• Adj. EBITDA improvement
• Controlled capex
• Strong cash flow generation
Q1 2014A $291.9
$29.1
$0.01
Previous guidance Q1 2015E $310.0 - 330.0
Not provided
$0.06 - 0.12
New guidance Q1 2015E $329
12.7% $42
44.3%
$0.13
1300%
• New estimates suggest a
~$13mm Y-o-Y improvement in TTM adj. EBITDA
1 Please refer to adjusted EBITDA reconciliation in Appendix; 2 Reconciliation of Q1 non-GAAP data is not available without unreasonable efforts and thus have not been included herein in compliance with applicable regulations; 3 Per diluted share
28
|
|
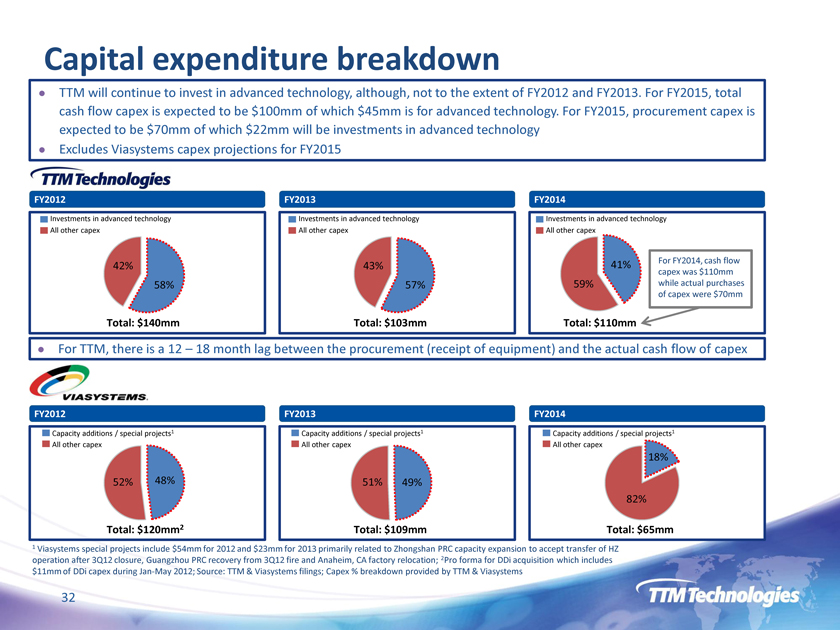
Capital expenditure breakdown
FY2012
FY2013
FY2014
Total: $120mm2 Total: $109mm
Total: $65mm
48%
52% 58%
42%
All other capex
Capacity additions / special projects1 Total: $140mm 57% 43% Total: $103mm
All other capex
Investments in advanced technology 41% 59%
Total: $110mm
All other capex
Investments in advanced technology All other capex
Investments in advanced technology
All other capex Capacity additions / special projects1 All other capex Capacity additions / special projects1 1 Viasystems special projects include $54mm for 2012 and $23mm for 2013 primarily related to Zhongshan PRC capacity expansion to accept transfer of HZ operation after 3Q12 closure, Guangzhou PRC recovery from 3Q12 fire and Anaheim, CA factory relocation; 2Pro forma for DDi acquisition which includes $11mm of DDi capex during Jan-May 2012; Source: TTM & Viasystems filings; Capex % breakdown provided by TTM & Viasystems
49% 51% For FY2014, cash flow capex was $110mm while actual purchases of capex were $70mm
For TTM, there is a 12 – 18 month lag between the procurement (receipt of equipment) and the actual cash flow of capex
TTM will continue to invest in advanced technology, although, not to the extent of FY2012 and FY2013. For FY2015, total cash flow capex is expected to be $100mm of which $45mm is for advanced technology. For FY2015, procurement capex is expected to be $70mm of which $22mm will be investments in advanced technology
Excludes Viasystems capex projections for FY2015
32
|
|
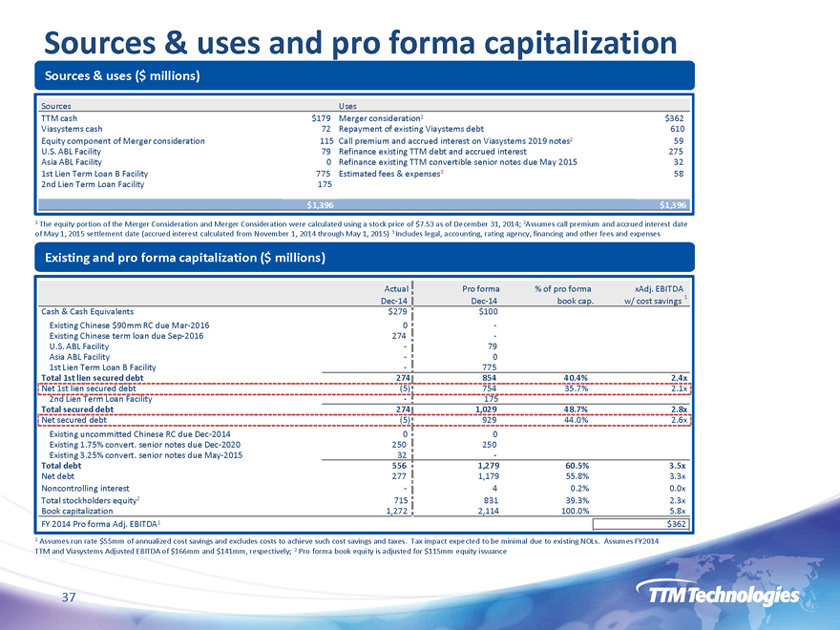
Sources & uses and pro forma capitalization
Sources & uses ($ millions)
Sources TTM cash Viasystems cash
Equity component of Merger consideration U.S. ABL Facility Asia ABL Facility 1st Lien Term Loan B Facility 2nd Lien Term Loan Facility
$179 72 115 79 0 775 175
$1,396
Uses
Merger consideration1 $362 Repayment of existing Viaystems debt 610 Call premium and accrued interest on Viasystems 2019 notes2 59 Refinance existing TTM debt and accrued interest 275 Refinance existing TTM convertible senior notes due May 2015 32 Estimated fees & expenses3 58
$1,396
1 The equity portion of the Merger Consideration and Merger Consideration were calculated using a stock price of $7.53 as of December 31, 2014; 2Assumes call premium and accrued interest date of May 1, 2015 settlement date (accrued interest calculated from November 1, 2014 through May 1, 2015) 3 Includes legal, accounting, rating agency, financing and other fees and expenses
Existing and pro forma capitalization ($ millions)
Cash & Cash Equivalents
Existing Chinese $90mm RC due Mar-2016 Existing Chinese term loan due Sep-2016 U.S. ABL Facility Asia ABL Facility 1st Lien Term Loan B Facility
Total 1st lien secured debt
Net 1st lien secured debt 2nd Lien Term Loan Facility
Total secured debt
Net secured debt
Existing uncommitted Chinese RC due Dec-2014 Existing 1.75% convert. senior notes due Dec-2020 Existing 3.25% convert. senior notes due May-2015
Total debt
Net debt
Noncontrolling interest Total stockholders equity2 Book capitalization FY 2014 Pro forma Adj. EBITDA1
Actual Pro forma % of pro forma xAdj. EBITDA
1
Dec-14 Dec-14 book cap. w/ cost savings $279 $100
0 - 274 -
- 79
- 0
- 775
274 854 40.4% 2.4x
(5) 754 35.7% 2.1x
- 175
274 1,029 48.7% 2.8x
(5) 929 44.0% 2.6x
0 0 250 250
32 -
556 1,279 60.5% 3.5x
277 1,179 55.8% 3.3x
- 4 0.2% 0.0x 715 831 39.3% 2.3x 1,272 2,114 100.0% 5.8x $362
1 Assumes run rate $55mm of annualized cost savings and excludes costs to achieve such cost savings and taxes. Tax impact expected to be minimal due to existing NOLs. Assumes FY2014 TTM and Viasystems Adjusted EBITDA of $166mm and $141mm, respectively; 2 Pro forma book equity is adjusted for $115mm equity issuance
37