Attached files
| file | filename |
|---|---|
| 8-K - FORM 8-K - American Finance Trust, Inc | v407681_8k.htm |
| EX-99.2 - EXHIBIT 99.2 - American Finance Trust, Inc | v407681_ex99-2.htm |
| EX-99.3 - EXHIBIT 99.3 - American Finance Trust, Inc | v407681_ex99-3.htm |
Exhibit 99.1

0 Anticipated NYSE listing under the symbol: AFIN

1 We have Applied to List on the NYSE and Intend to Expand our Investment Strategy to Include Commercial Mortgages x Applied to List on the NYSE x Expand Investment Strategy April 2013: Commenced IPO and Acquired First Assets Assembled High - Quality, Income - Producing Real Estate Portfolio May 2014: Initial Capital Raised Fully Invested October 2013: Closed Non - Traded Equity Offering, Raising $1.5bn of Gross Proceeds Portfolio Positioned for Income and Value Creation
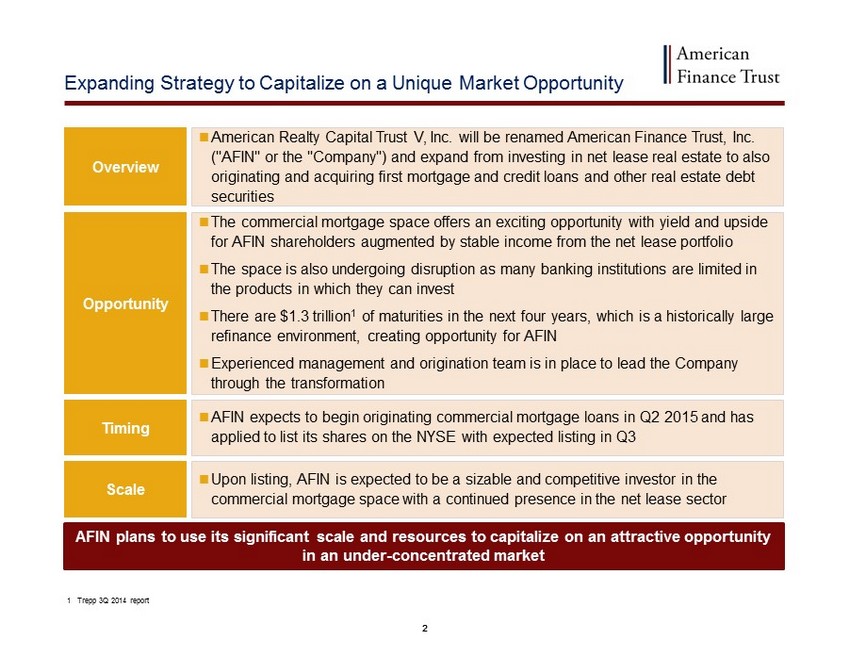
2 Opportunity ; The commercial mortgage space offers an exciting opportunity with yield and upside for AFIN shareholders augmented by stable income from the net lease portfolio ; The space is also undergoing disruption as many banking institutions are limited in the products in which they can invest ; There are $1.3 trillion 1 of maturities in the next four years, which is a historically large refinance environment, creating opportunity for AFIN ; Experienced management and origination team is in place to lead the Company through the transformation Expanding Strategy to Capitalize on a Unique Market Opportunity Overview ; American Realty Capital Trust V, Inc. will be renamed American Finance Trust, Inc. ("AFIN" or the "Company") and expand from investing in net lease real estate to also originating and acquiring first mortgage and credit loans and other real estate debt securities Timing ; AFIN expects to begin originating commercial mortgage loans in Q2 2015 and has applied to list its shares on the NYSE with expected listing in Q3 AFIN plans to use its significant scale and resources to capitalize on an attractive opportunity in an under - concentrated market Scale ; Upon listing, AFIN is expected to be a sizable and competitive investor in the commercial mortgage space with a continued presence in the net lease sector 1 Trepp 3Q 2014 report

3 Listing Summary and Key Takeaways Company American Finance Trust, Inc. Ticker NYSE: AFIN Expansion of Strategy AFIN will expand its focus from investing in net lease real estate to include originating and acquiring first mortgage and credit loans and other real estate debt securities Listing Date ▪ Anticipated listing to occur during third quarter of 2015 ▪ No lock - up; shares will be freely tradable ▪ Management will not sell shares in connection with listing Anticipated Distribution Increase ▪ Current distribution of $1.65 per share annualized (paid monthly) ▪ Company expects to increase its annualized distribution per share as it grows its earnings and cash flow 1 Tender Offer Upon listing, expect to launch a tender offer of $125 million, at $25.50 per share American Finance Trust, Inc. (“AFIN”) has applied to list on the New York Stock Exchange 1 Based on management's expectations, pro forma for listing, tender offer and execution of mortgage portfolio. Estimates ar e n ot historical fact. See the discussion under "Forward - Looking Statements and Additional Information" and "Projections" in this presentation

4 Key Investment Highlights Differentiated Investment Strategy ; AFIN is expected to be an important player in the commercial mortgage space and to be able to capitalize on opportunities that many financial institutions are prohibited from competing in due to regulatory or risk - profile related reasons ; Diversified REIT offering significant exposure to net lease real estate combined with commercial mortgage investments ; Expanded strategy including Commercial Real Estate ("CRE") debt originations, secondary CRE debt investments and real estate investments ; Debt originations and real estate investments generating attractive current yield and capital appreciation potential High Quality, Diversified Net Lease Portfolio ; Stable cash flows from established net lease portfolio (13.1mm sq. ft., 43 tenants) ; Fully leased and well - diversified institutional net lease portfolio (37 states, 22 industries) ; Long term leases (9.7 WAL 1 ) with contractual annual rent escalators ; 68.4% of NOI 2 from investment grade tenants 3 ; 463 properties with 100% occupancy Experienced Management ; Experience across a variety of investment products including CRE loan originations, secondary CRE debt investments and net lease real estate ; Long standing relationships with brokers and financial institutions within the real estate sector Members of AFIN’s mortgage finance team have closed over $50 billion of commercial real estate debt transactions in the past 20 years Data as of 12/31/2014 1 WAL references "Weighted Average Lease Term" and is defined as the weighted average lease term to expiration across the subject portfolio 2 NOI is a non - GAAP metric; for a more detailed explanation, see the discussion under "Definitions" 3 Per Q4 2014 data and credit ratings
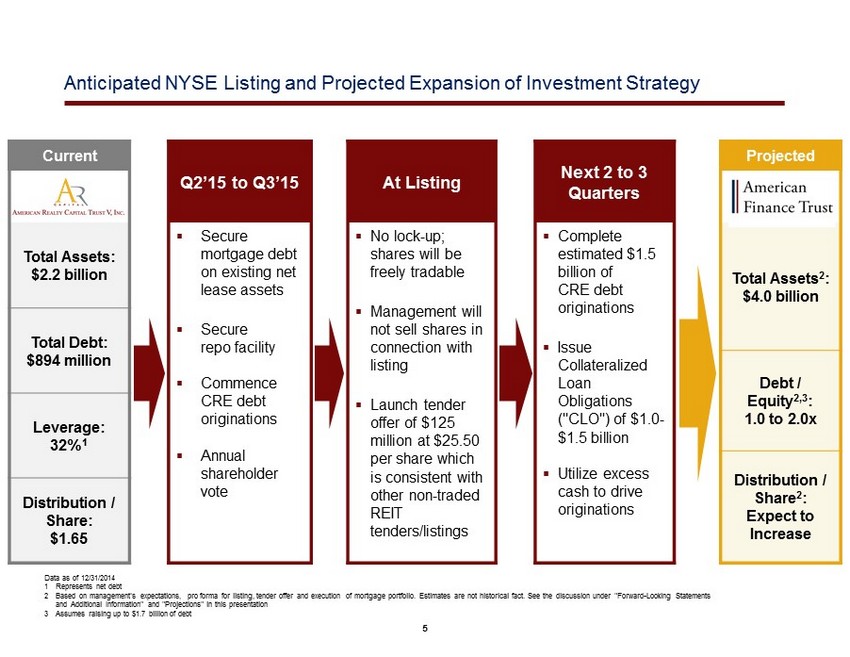
5 Anticipated NYSE Listing and Projected Expansion of Investment Strategy Current AFIN Q2’15 to Q3’15 At Listing Next 2 to 3 Quarters Total Assets: $2.2 billion ▪ Secure mortgage debt on existing net lease assets ▪ Secure r epo facility ▪ Commence CRE debt originations ▪ Annual shareholder vote ▪ No lock - up; shares will be freely tradable ▪ Management will not sell shares in connection with listing ▪ Launch tender offer of $125 million at $25.50 per share which is consistent with other non - traded REIT tenders/listings ▪ Complete estimated $1.5 billion of CRE debt o riginations ▪ Issue Collateralized Loan Obligations ("CLO") of $1.0 - $1.5 billion ▪ Utilize excess cash to drive originations Total Assets 2 : $4.0 billion Total Debt: $894 million Debt / Equity 2,3 : 1.0 to 2.0x Leverage: 32% 1 Distribution / Share 2 : Expect to Increase Distribution / Share: $1.65 Projected Data as of 12/31/2014 1 Represents net debt 2 Based on management's expectations, pro forma for listing, tender offer and execution of mortgage portfolio. Estimates are not historical fact. See the discussion under "Forward - Looking Statements and Additional Information" and "Projections" in this presentation 3 Assumes raising up to $1.7 billion of debt Current

6 Meaningful Participant in the Comparable REIT Universe Total Assets Total Shareholders' Equity Data based on public filings as of 4/15/2015 1 Total assets excludes consolidated variable interest entity assets 2 'AFIN PF' represents the Company at its estimated pro forma debt and equity levels after the transformation 1 2 2 89% Real Estate as a % of Assets Ticker Information: STWD Starwood Property Trust, Inc. CLNY Colony Capital, Inc. BXMT Blackstone Mortgage Trust, Inc. AFIN American Finance Trust, Inc. STAR iStar Financial, Inc. ARI Apollo Commercial Real Estate Finance, Inc. ABR Arbor Realty Trust, Inc. ACRE Ares Commercial Real Estate Corporation O Realty Income Corporation NNN National Retail Properties SRC Spirit Realty Capital STOR STORE Capital Corporation 0% 91% 24% 5 4% 96% 0% 53% 9 3% 9 5 % 5% 0% 0% 11,013 8,867 8,017 5,872 5,463 4,927 4,589 4,000 2,914 2,213 1,880 1,868 1,845 5,613 3,861 3,318 3,083 2,417 1,583 1,465 1,400 1,270 1,197 855 535 403 Average: 4,882 Average: 2,077
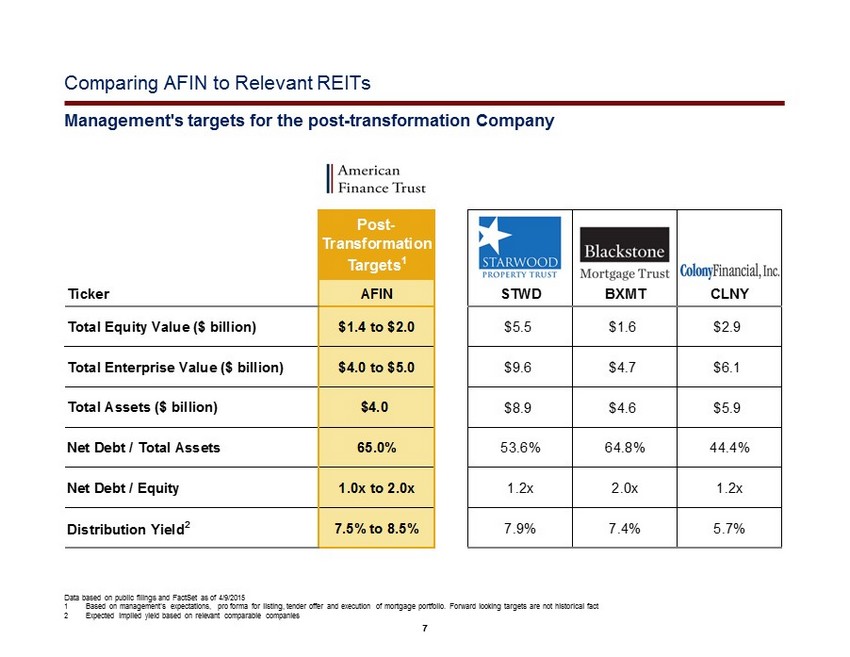
7 Comparing AFIN to Relevant REITs Management's targets for the post - transformation Company Data based on public filings and FactSet as of 4/9/2015 1 Based on management's expectations, pro forma for listing, tender offer and execution of mortgage portfolio. Forward looking t argets are not historical fact 2 Expected implied yield based on relevant comparable companies Post- Transformation Targets 1 Ticker AFIN STWD BXMT CLNY Total Equity Value ($ billion) $1.4 to $2.0 $5.5 $1.6 $2.9 Total Enterprise Value ($ billion) $4.0 to $5.0 $9.6 $4.7 $6.1 Total Assets ($ billion) $4.0 $8.9 $4.6 $5.9 Net Debt / Total Assets 65.0% 53.6% 64.8% 44.4% Net Debt / Equity 1.0x to 2.0x 1.2x 2.0x 1.2x Distribution Yield 2 7.5% to 8.5% 7.9% 7.4% 5.7%

8 Representative Property Capital Structure AFIN Targets First Mortgages 55 – 70% Credit Loans 10 – 20% Equity 20 – 30% Expanded Debt Investment Criteria Credit Loans ; Opportunity to lend alongside traditional first mortgage providers who are constrained by new regulations ; Lend between 50% and 85% LTV ; Interest rates of 7.0% - 13.0% ; Loan terms of two to ten years, both fixed and floating rate ; Managed CDOs often do not contract at these prices, and commercial banks are hampered by regulation ; Credit Loans are higher yielding and include: B - Notes 1 , Mezzanine Financing, and Preferred Equity Opportunity: A large refinancing shortfall projected in 2015 - 2018 creates ample mezzanine debt opportunities First Mortgage Loans ; Opportunity to originate mortgages when there are $ 1.3 trillion of mortgages in the US maturing within 4 years, and traditional sources of debt are constrained due to regulatory issues and new investment constraints ; Attractive opportunities to lend to experienced operators buying, recapitalizing, and repositioning assets ; Equity owners' investment will help absorb potential losses prior to loss of loan principal ; Focus on floating rate loans ; In place cash flow from tenants or revenues helps to provide cash flow coverage ; Anticipates loan terms of two to five years ; As lenders dispose of assets, there is an opportunity to provide interim financing until more permanent financing can be executed Opportunity: Traditional lending sources (e.g., banks and CLO originators) are constrained from lending by new regulation 1 'B - Note' references a subordinate portion of a first mortgage loan

9 Management team has originated more than $50 billion of commercial loans over the last 20 years Experienced External Management Andrew Winer Chief Investment Officer ; 23 years of real estate finance experience ; Previously led teams in Commercial Real Estate Finance at Credit Suisse in CMBS syndication and distribution, loan pricing and hedging and asset management Matt Donnelly Managing Director, Head of Debt Originations ▪ 20 years of real estate finance experience; has been directly involved in over $15 billion in finance transactions ▪ Responsible for the oversight of sourcing and underwriting of commercial real estate debt investments and AFIN's nationwide origination team ▪ Previously Head of real estate finance at Cole Real Estate Investments (5 years) and Managing Director at Bear Stearns (9 years) Don MacKinnon President & Chief Executive Officer ▪ Over 25 years of experience in various areas of real estate finance, including mortgage loan originations, high yield portfolio management, structured credit trading, CMBS advisory and real estate workout services ▪ Previously held Head or Managing Director positions of various real estate finance - related groups at Donaldson Lufkin & Jenrette, Nomura Securities and Cole Real Estate Investments Jason Fruchtman Managing Director, Head of Capital Markets ▪ 15 years of experience in commercial real estate finance ▪ Responsible for all CMBS trading, portfolio analytics, managing financing lines, and implementation of long term financing solutions ▪ Previously held CMBS trading positions at Credit Suisse (10 years) and Guggenheim Securities (5 years) David Layton Managing Director, Head of Asset Management ▪ 20 years of asset management, investment, and valuation experience ▪ Oversees all post - close investment activities, including borrower compliance, loan administration and loan asset management ▪ Previously VP of asset management at Brookfield Asset Management (10 years) and Manager of real estate capital markets and financial advisory group at Deloitte (5 years) Marc Tolchin Senior Vice President and Counsel ▪ Previously served as a real estate attorney at Alston & Bird LLP, where he represented institutional lenders in all aspects of commercial real estate finance transactions and restructuring, with a focus on the origination of loans destined for securitization and sale in the secondary market ▪ Previously a member of the real estate finance practice group at Cadwalader, Wickersham & Taft LLP Jason Slear Senior Vice President of Real Estate Acquisitions/Dispositions ▪ Responsible for sourcing, negotiating, and closing ARC's real estate acquisitions ▪ Formerly east coast territory director for American Financial Realty Trust (AFRT) where he was responsible for the disposition and leasing activity for a portion of AFRT's 37.3 million square foot portfolio Donald Ramon Chief Financial Officer ▪ 15 years of experience in real estate finance accounting and operations ▪ Most recently served as CFO of CMG REIT ▪ From January 2009 until May 2014 served as CFO of Invesco Mortgage Capital Inc. Note: New management team will be in place effective May 2015

10 Experienced External Management: Proven Ability Across Real Estate Asset and Debt Investment Types Team Has Originated $750+ Million Since Q2’14: 42% 20% 16% 15% 7% Office Hospitality Mixed Use Retail Multifamily 61% 30% 9% First Mortgage Credit CMBS Investment Type Asset Type 25+ Employees in 5 Offices Across the U.S. Los Angeles, CA Dallas, TX Chicago, IL Atlanta, GA New York, NY Substantial Activity in Only Nine Months Loans Screened $17 billion Quotes Issued $3.5 billion Term Sheets Signed $1.6 billion Loans Closed $750 million

11 Experienced External Management: Broad Finance Platform and Established Origination Channels ; As the broad platform grows, AFIN’s management and origination team have increased visibility on market opportunities ; Members of our external management team have originated more than $50 billion of mortgages and other commercial real estate debt products through multiple channels over the past 20 years ; Long - standing relationships with various financial institutions should continue to help ensure access to potentially attractive investment opportunities ; AFIN’s lending channels include banks, investment banks, finance companies, and insurance companies Diverse and Growing Capabilities ; AFIN’s management team has extensive experience lending and underwriting credit in connection with the management of real estate debt Management Team ; Led by seasoned professionals who have institutional experience investing through various real estate cycles, both domestically and internationally ; The team is highly focused on originating investments , building out and managing the loan portfolio, and realizing full value from the assets through this listing ; Supported by a proven industry leading team of investment, finance and asset management professionals Investment Team Banks/ Investment Banks/ CMBS Financial Institutions Mortgage Bankers Direct Borrower Relationships Our management team has deep relationships with investment banks, financial lenders, and borrowers

12 0 50 100 150 200 250 300 350 400 450 2005 2006 2007 2008 2009 2010 2011 2012 2013 2014 2015 2016 2017 2018 Favorable Real Estate Lending Market Opportunity Commercial Real Estate Mortgage Debt Maturities 1 Note: □ The commercial mortgage market in the US is $2.5 trillion □ There are $1.3 trillion in mortgages maturing within the next 4 years 1 □ There are more than $ 330 billion in mortgage maturities each year through 2017 □ CRE mortgages have been historically financed by banks and thrifts ($ billions) $ 1.3 Trillion Unprecedented Demand for Mortgage Loans: $1.3 Trillion of Maturities Over Next 4 Years Limited Lender Supply of Mortgage Capital □ Although the CMBS market is functioning, it is downsized compared to historical levels □ Floating rate CMBS market has been volatile and slower to return to previous levels □ Capital requirements, new regulations, and potential risk retention rules may limit overall growth of CMBS issuance 0 50 100 150 200 250 2005 2006 2007 2008 2009 2010 2011 2012 2013 2014 ($ billions) U.S. CMBS Issuance (Data as of 1/5/2015) 2 Note: We believe a smaller CMBS market coupled with $1.3 trillion of mortgages maturing creates a substantial opportunity for AFIN 1 Trepp 3Q 2014 report 2 Commercial Mortgage Alert

13 ; Commercial real estate loan losses have averaged 0.67% over 23 years ; Losses are reduced when lending at the correct time in the cycle Strong Real Estate Lending Market Dynamics Compared to pre - crisis lending practices, CMBS loans are now gradually being underwritten with: ; More equity in the capital structure ; Lower l oan to value ("LTV") ratios ; Higher debt service coverage ratios ; Higher debt yield requirements ; Underwriting based on existing and less speculative cash flow – signed leases, verified and budgeted expenses ; More stringent loan covenants -0.05 0.45 0.95 1.45 1.95 2.45 2.95 1991 1993 1995 1997 1999 2001 2003 2006 2008 2010 2012 2014 Loss rate Charge - off Rates 1 on Commercial Real Estate Loans at Commercial Banks Favorable conditions for entering market Data from the Board of Governors of the Federal Reserve System as of 6/30/14 1 "Charge - off Rates" are the proportion of loans and leases removed from the balance sheet and charged against bank loss reserves. Charge - off rates are annualized, net of recoveries
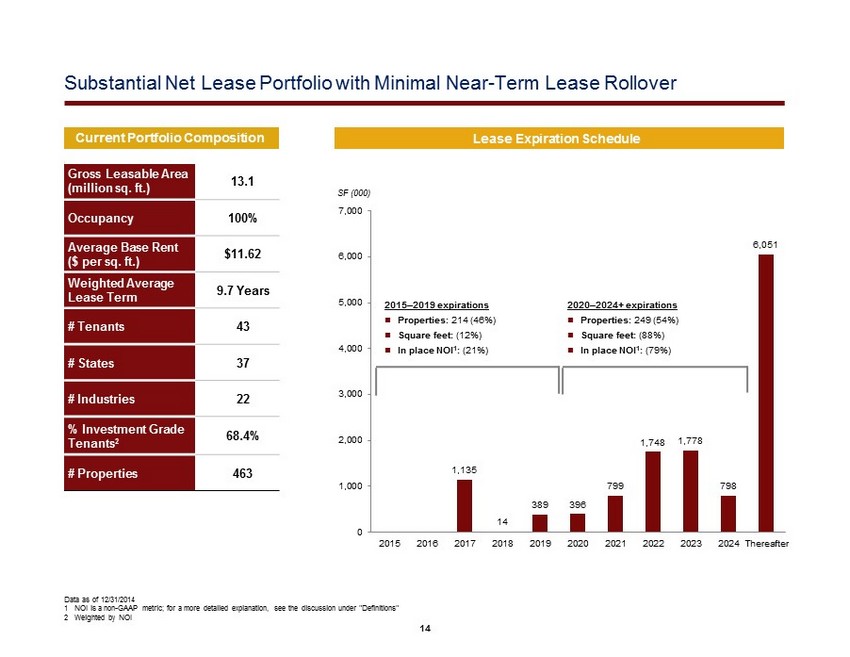
14 Substantial Net Lease Portfolio with Minimal Near - Term Lease Rollover Lease Expiration Schedule 1,135 14 389 396 799 1,748 1,778 798 6,051 0 1,000 2,000 3,000 4,000 5,000 6,000 7,000 2015 2016 2017 2018 2019 2020 2021 2022 2023 2024 Thereafter 2015 – 2019 expirations ; Properties: 214 (46%) ; Square feet: (12%) ; In place NOI 1 : (21%) 2020 – 2024+ expirations ; Properties: 249 (54%) ; Square feet: (88%) ; In place NOI 1 : (79%) Gross Leasable Area (million sq. ft.) 13.1 Occupancy 100% Average Base Rent ($ per sq. ft.) $11.62 Weighted Average Lease Term 9.7 Years # Tenants 43 # States 37 # Industries 22 % Investment Grade Tenants 2 68.4% # Properties 463 Current Portfolio Composition SF (000) Data as of 12/31/2014 1 NOI is a non - GAAP metric; for a more detailed explanation, see the discussion under "Definitions" 2 Weighted by NOI

15 Strong, Diversified Base of Retailers and Investment Grade Tenants Top 20 Tenant B reakdown In Place NOI 1 by Tenant Industry (%) In Place NOI 1 by Asset T ype (%) 68.4 % of AFIN’s in place NOI 1 is from investment grade tenants Tenant # of Properties Total GLA (000s SF) Credit Ratings (S&P/Moody’s) Equity Value ($bn) % of NOI 1 1. 213 1,148 BBB/Baa1 $21.4 18.1% 2. 1 737 AA/A1 136.5 11.7% 3. 5 3,045 BB/ - N/A 10.4% 4. 9 1,407 - / - N/A 7.9% 5. 3 554 A/ - 161.8 7.8% 6. 8 544 BBB/Baa3 17.0 6.1% 7. 2 785 A - / - 100.5 4.6% 8. 2 1,315 A/A2 110.8 3.7% 9. 18 254 BBB/Baa1 70.9 3.3% 10. 1 400 A/A3 80.4 3.3% 11. 41 168 - / - 9.6 3.2% 12. 5 671 A - /A3 48.6 2.5% 13. 20 136 - /B3 N/A 2.3% 14. 38 357 BBB - /Baa3 17.4 1.9% 15. 1 390 B – B2 N/A 1.2% 16. 9 35 A - /A3 0.1 1.1% 17. 19 55 BBB - /Baa2 15.5 1.1% 18. 9 44 - /B2 1.6 1.0% 19. 1 91 - / - 3.3 0.9% 20. 4 154 - / - 48.1 0.8% % of total 88.3% 93.8% 91.4% Top 20 tenants 409 12,289 Total portfolio 463 13,108 Retail 46% Office 30% Distribution 24% Retail Banking 19.3% Financial Services 12.4% Pharmaceut. 11.7% Grocery Distribution 10.4% Refrigerated Warehousing 7.9% Supermarket 6.8% Home Impr. 6.2% Quick Service 4.2% Pharmacy 3.8% Insurance 3.3% Other 13.9% Data as of 12/31/14 except as indicated; t hese companies are neither affiliated with nor have in any way endorsed the merits of this offering 1 NOI is a non - GAAP metric; for a more detailed explanation, see the discussion under "Definitions"

16 ; Certified public accountant with over 40 years in the real estate industry; deep expertise in the auditing of public and private companies ; From September 1967 to June 2003, was with Ernst & Young LLP, the last 25 of which he was a partner; served as Ernst & Young’s national director of real estate accounting, as well as on Ernst & Young’s national accounting and auditing committee. ; From July 2003 to May 2008, served as the director of Internal Audit for Vornado Realty Trust ; From June 2008 to May 2011, served as managing partner of Cornerstone Accounting Group, a public accounting firm specializing in the real estate industry and a consultant to them from June 2011 to March 2012 ; Since May 2012, has provided consulting services to Friedman LLP, a public accounting firm. Mr . Perla is an active member of the National Association of Real Estate Investment Trusts and the National Association of Real Estate Companies. In addition, Mr. Perla has been a fre que nt speaker on real estate accounting issues at numerous real estate conferences ; Earned an M.B.A. in Taxation and a B.B.A. in Accounting from Baruch College ; Over 25 years of experience in global asset management ; From 2003 to 2005, served as the managing director of Ankar Capital Management, a New York based investment advisory firm, managing the firm’s private equity group in the Singapore office ; From 1990 to 2001, served as a senior partner and international portfolio manager at Ardsley Partners, also a New York based investment advisory firm, where he managed several emerging market hedge funds, including the Ardsley Pacific Fund ; From 1981 to 1990, served as equity portfolio manager at T. Rowe Price where he also assisted in the establishment of the firm’s Hong Kong office ; Received a B.A. from the University of California, Berkeley, a J.D. from the University of California, Davis where he earned Order of the Coif honors and an M.B.A. from Stanford University’s Graduate School of Business ; Herb Vederman was appointed as an independent director of AFIN in March 2015 ; Mr. Vederman most recently served as senior consultant in the government and public affairs group of law firm Stradley Ronon Ste vens & Young LLP, from June 2004 until September 2012 and as a director of the Philadelphia Regional Port Authority from April 2004 to Septembe r 2 011 ; Mr. Vederman served as deputy mayor for economic development for the city of Philadelphia, Pennsylvania from January 1992 thr oug h January 2000 Independent Directors Stanley R. Perla David Gong Herb Vederman

17 Conclusion ; Assembled high - quality , diversified, income producing net lease real estate portfolio ; Anticipated listing on the NYSE in Q3 2015 to provide liquidity to shareholders ; Poised to unlock additional revenue potential through an expanded strategy including commercial real estate lending ; Anticipated to be a sizeable and competitive investor in the commercial mortgage space with a continued presence in the net lease sector ; Sophisticated management team with broad real estate and debt origination experience ; Current yield, potential capital appreciation, and steady growth through complimentary real estate investments and commercial real estate lending AFIN has Applied to List on the NYSE and Intends to Expand its Investment Strategy to include Commercial Mortgages

18 Frequently Asked Questions Is there a stockholder lock - up? ▪ No, there is no stockholder lock - up. Investors are free to sell their shares. Management will not sell its shares at the listing What will happen to the existing Dividend Reinvestment Plan? ▪ Existing DRIP will be suspended effective immediately following the payment of the June 2015 monthly distribution Will there be a new Dividend Reinvestment Plan? ▪ Yes, the board of directors intends to implement a new dividend reinvestment plan for the company following completion of the listing and the tender offer When will the share repurchase plan be terminated? ▪ The share repurchase plan has been terminated What is the purpose of the tender offer? ▪ To provide investors an opportunity to sell their shares for cash, allowing for price certainty What are some of the considerations to contemplate when tendering shares? ▪ Potential short - vs. long - term capital gain treatment for tax purposes ▪ Loss of yield ▪ Loss of potential market upside from share price increases ▪ Potential negative tax implications if shares are partially tendered

19 Tender Offer Tender My Shares Hold My Shares Considerations ▪ Price certainty ▪ Number of shares accepted for tender uncertain ▪ Taxable sale of shares ▪ Short - term or long - term gain? ▪ Avoids market volatility (up or down) ▪ Proceeds available for redeployment ▪ Maintain AFIN investment ▪ Continue to collect distribution ▪ May liquidate when desired ▪ Option to watch public trading levels ▪ Defers tax realization event ▪ Price volatility Process ▪ Complete form ▪ Return to company ▪ Wait for results ▪ Paid promptly following expiration of the offer ▪ Do nothing with tender offer ▪ Move shares to brokerage account ▪ Create new brokerage account, if necessary

20 Definitions Net Operating Income ("NOI"): Net operating income ("NOI " ) is a non - GAAP financial measure equal to net income attributable to stockholders, the most directly comparable GAAP financial measure, less discontinued operations, interest, other income and income from preferred equity investments and inve stm ents securities, plus corporate general and administrative expense, acquisition and transaction costs, depreciation and amortization, other non - cash expenses and interest e xpense. NOI is adjusted to include our pro - rata share of NOI from unconsolidated joint ventures. We use NOI internally as a performance measure and believe NOI provides useful inform ati on to investors regarding our financial condition and results of operations because it reflects only those income and expense items that are incurred at the property level. Theref ore , we believe NOI is a useful measure for evaluating the operating performance of our real estate assets and to make decisions about resource allocations. Further, we believe NOI is use ful to investors as a performance measure because, when compared across periods, NOI reflects the impact on operations from trends in occupancy rates, rental rates, operating c ost s and acquisition activity on an unleveraged basis, providing perspective not immediately apparent from net income. NOI excludes certain components from net income in order to p rov ide results that are more closely related to a property's results of operations. For example, interest expense is not necessarily linked to the operating performance of a r eal estate asset and is often incurred at the corporate level as opposed to the property level. In addition, depreciation and amortization, because of historical cost accounting and useful l ife estimates, may distort operating performance at the property level. NOI presented by us may not be comparable to NOI reported by other REITs that define NOI differently. We believe that in order to facilitate a clear understanding of our operating results, NOI should be examined in conjunction with net income as presented in our consolidated financial statements. NOI sho uld not be considered as an alternative to net income as an indication of our performance or to cash flows as a measure of our liquidity or ability to make dividends.
21 Forward - Looking Statements and Additional Information Certain statements made in this presentation are forward - looking statements. These forward - looking statements and information re lating to us that are based on current expectations, estimates, forecasts and projections and our management’s beliefs and assumptions about us, our future performance and our bu sin ess. These statements may include, but are not limited to, statements regarding stockholder liquidity and investment value and returns, as well as statements regarding our pro posed tender offer (the “Offer”) and changes to our Investment Objectives and Acquisition and Investment Policies (our “New Strategy”) that will be implemented in connection wit h t he proposed listing of our shares of common stock on the New York Stock Exchange (“NYSE”) as described in this presentation. In addition, we, or others on our behalf, may make forwar d - l ooking statements in press releases or written statements, or in our communications and discussions with analysts in the normal course of business through meetings, webcast s, phone calls and conference calls. The words “anticipates,” believes,” “expects,” “estimates,” “projects,” “plans,” “intends,” “may,” “will,” “would” and similar expressi ons are intended to identify forward - looking statements, although not all forward - looking statements contain these identifying words. Actual results may differ materially from those contemplated by the forward - looking statements. Further, forward - looking statements speak only as of the date they are made, and we undertake no obligation to update or revise any forward - looking statement to reflect changed assumptions, the occurrence of unanticipated events or changes to future operating results, unless required to do so by law. The following are some of the r isk s and uncertainties, although not all risks and uncertainties, that could cause our actual results to differ materially from those presented in our forward - looking statements: ; We may not be able to complete the listing of our common stock on the NYSE. ; We may not be able to complete the Offer. ; We may not be able to satisfy the conditions required to borrow and fund the tender offer under our existing revolving loan credit facility, which will also be a condition to the Off er. ; The price at which our common stock trades on the NYSE may be higher or lower than the purchase price in the tender offer. ; The number of shares acquired in the Offer may be less than number for which we are making the Offer. ; The cost of any indebtedness incurred to fund the Offer. ; We may not be able to successfully execute our New Strategy. ; We may make additional share repurchases (including in the open market) following completion of the Offer, or offer to purchase shares pursuant to additional tender offers; the number of shares acquired in such repurchases or additional tender offers; and the terms, timing, costs and interest rate on any indebtedness inc urred to fund such repurchases or additional tender offers . ; We have limited experience managing a mix portfolio of net lease assets and commercial real estate investments. This inexperience makes our future performance difficult to predict. Past performance of other real estate investment programs sponsored by affiliates of our Advisor should not be relied upon to pr edict our future results. ; We have limited ability to terminate our Advisor under the Advisory Agreement. ; All of our executive officers are also officers, managers or holders of a direct or indirect controlling interest in our Advi sor and other American Realty Capital affiliated entities. As a result, our executive officers, our Advisor and its affiliates face conflicts of interest, including significant conflicts cr eat ed by our Advisor's compensation arrangements with us and other investment programs advised by American Realty Capital affiliates and conflicts in allocating time among these investme nt programs and us. These conflicts could result in unanticipated actions.
22 Forward - Looking Statements and Additional Information ; We may be unable to pay or maintain cash distributions or increase distributions over time. ; We are obligated to pay fees and distributions, which may be substantial, to our Advisor and its affiliates. ; We depend on tenants for our revenue and, accordingly, our revenue is dependent, and under our New Strategy will be partially de pendent, upon the success and economic viability of our tenants. ; The commercial real estate debt in which we invest may not always be secured by a lien on real property and will be subject t o t he risks typically associated with commercial real estate, including delinquency, foreclosure, loss and bankruptcy of the borrower which could result in losses to us. ; We could experience delays in liquidating defaulted commercial real estate debt investments, reducing our investment returns. ; Increases in interest rates could increase the amount of our debt payments and limit our ability to pay distributions to our sto ckholders. ; Our organizational documents permit us to pay distributions from unlimited amounts of any source. For example, there are no e sta blished limits on the amount of borrowings that we may use to fund such distribution payments. We may not generate cash flows sufficient to pay our distributions to stockholder s, as such, we may be forced to borrow at higher rates or depend on our Advisor to waive reimbursement of certain expenses and fees to fund our operations. There is no assurance that our Advisor will waive reimbursement of expenses or fees. ; We are subject to risks associated with any dislocation or liquidity disruptions that may exist or occur in the credit market s o f the United States of America from time to time. ; We may fail to continue to qualify to be treated as a real estate investment trust for United States federal income tax purpo ses (“REIT”), which would result in higher taxes, may adversely affect our operations and reduce our cash available for distributions. ; We may be deemed to be an investment company under the Investment Company Act of 1940, as amended, and thus subject to regula tio n thereunder. ; There may be changes in general economic, business and political conditions, including the possibility of intensified interna tio nal hostilities, acts of terrorism, and changes in conditions of United States or international lending, capital and financing markets . ; Current credit market conditions and our ability to obtain long - term financing for our property investments in a timely manner and on te rms that are consistent with what we project when we invest in the property. ; The commercial real estate debt we originate and invest in and the commercial real estate loans underlying the commercial real es tat e securities we invest in could be subject to delinquency, foreclosure and loss, which could result in losses to us. ; Delays in liquidating defaulted commercial real estate debt investments could reduce our investment returns. ; Subordinate commercial real estate debt that we acquire or originate could constitute a significant portion of our portfolio and may expo se us to greater losses. ; We may be subject to risks associated with construction lending, such as declining real estate values, cost overruns and delays in completion. ; Our investments in commercial real estate debt and commercial real estate securities are subject to changes in credit spreads. ; Investments in non - conforming or non - investment grade rated loans or securities involve greater risk of loss.

23 Forward - Looking Statements and Additional Information ; Investments in CMBS, which may include subordinate securities, entails certain risks, Including the first risk of loss if any losses are rea lized on the underlying mortgage loans. ; The CMBS in which we may invest are subject to the risks of the mortgage securities market as a whole and risks of the securitiza tio n process. ; We may not control the special servicing of the mortgage loans underlying the CMBS in which we invest and, in such cases, the sp eci al servicer may take actions that could adversely affect our interests. ; With respect to certain mortgage loans included in the CMBS, the properties that secure the mortgage loan backing the CMBS may als o s ecure one or more related mortgage loans that are not in the securitized pool, which may conflict with our interests. ; We may invest in CDO notes and such investments involve significant risks. ; Adjustable - rate commercial real estate loans may entail greater risks of default to us than fixed - rate commercial real estate loans. ; Changes in interest rates could negatively affect the value of our investments, which could result in reduced income or losses and ne gat ively affect the cash available for distribution to you. ; Competition with third parties for originating and acquiring investments may reduce our profitability and the return on your investment. ; We depend on borrowers for a substantial portion of our revenue, and, accordingly, our revenue and our ability to make distribut ion s to you is dependent upon the success and economic viability of such borrowers. ; Real estate debt restructurings may reduce our net interest income. ; We may be unable to restructure loans in a manner that we believe maximizes value, particularly if we are one of multiple credit ors in large capital structures. ; Provision for loan losses are difficult to estimate in a challenging economic environment. ; We may not be able to realize the benefits of any guarantees we may receive which could harm our ability to preserve our capital up on a default. ; We may not be effective managing our commercial real estate debt investments. ; The commercial real estate finance industry has been and may continue to be adversely affected by economic conditions in the Unit ed States and the global financial markets generally. Factors and risks that could cause actual results to differ materially from expectation are disclosed from time to time in greater de tai l in our filings with the Securities and Exchange Commission including, but not limited to, our Annual Report on Form 10 - K, Quarter Reports on Form 10 - Q, as wells our Current Rep orts on Form 8 - K .

24 Projections This presentation includes estimated projections of future operating results. These projections were not prepared in accordan ce with published guidelines of the SEC or the guidelines established by the American Institute of Certified Public Accountants for preparation and presentation of financial projectio ns. This information is not fact and should not be relied upon as being necessarily indicative of future results; the projections were prepared in good faith by management and are based on nu mer ous assumptions that may prove to be wrong. Important factors that may affect actual results and cause the projections to not be achieved include, but are not limited to, risks an d u ncertainties relating to the company and other factors described under “Risk Factors” section of the Company’s Annual Report on Form 10 - K and any subsequent Quarterly Reports on Form 10 - Q or Current Reports on Form 8 - K and “Forward - Looking Statements. Projections also reflect assumptions as to certain business decisions that are subject to change. As a result, actual results may differ materially from those contained in the estimates. Accordingly, there can be no assurance that the estimates will be realized. This presentation also contains estimates and information concerning our industry, including market position, market size, and gro wth rates of the markets in which we participate, that are based on industry publications and reports. This information involves a number of assumptions and limitations, and you ar e c autioned not to give undue weight to these estimates. We have not independently verified the accuracy or completeness of the data contained in these industry publications and repo rts . The industry in which we operate is subject to a high degree of uncertainty and risk due to variety of factors, including those described in the “Risk Factors” section of the Comp any ’s Annual Report on Form 10 - K and any subsequent Quarterly Reports on Form 10 - Q or Current Reports on Form 8 - K. These and other factors could cause results to differ materially from those expressed in these publications and reports.

25 Important Notice This investor presentation is for informational purposes only and is not an offer to buy or the solicitation of an offer to s ell any securities of the Company. The tender offer will be made only pursuant to an offer to purchase, letter of transmittal and related materials the Company intends to distribute to its s toc kholders and file with the SEC. The full details of the tender offer , including complete instructions on how to tender shares, will be included in the offer to purchase, the letter of tra nsm ittal and related materials, which will become available to stockholders promptly following commencement of the tender offer. Stockholders should read carefully the offer to purchase, the letter of transmittal and other related materials if and when t hey are available because they will contain important information. Stockholders may obtain free copies, when of the offer to purchase and other related materials that will be filed by the Comp any by available, visiting EDGAR on the SEC website at www.sec.gov. Stockholders also may obtain a copy of these documents, free of charge, from the Company the materials become av ail able.