Attached files
| file | filename |
|---|---|
| 8-K - FORM 8-K - LEGGETT & PLATT INC | d909927d8k.htm |
Exhibit 99.1
Revised Overview of Segments and
Revised Segment Financial Data
Leggett & Platt manufactures thousands of different items. These products are organized into four segments and further divided into 11 groups and 18 business units. Here we share more information about our four segments.
Residential Furnishings Segment
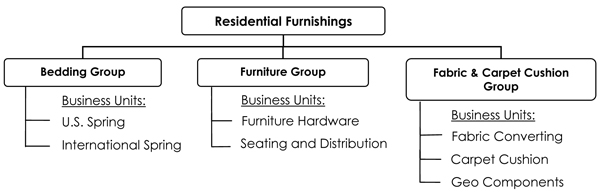
Our Residential Furnishings segment began in 1883 with the manufacture of steel coil bedsprings. Today, we supply a variety of components used by bedding and upholstered furniture manufacturers in the assembly of their finished products. Our range of products offers our customers a single source for many of their component needs.
Efficient manufacturing methods, internal production of key raw materials, and numerous manufacturing and assembly locations allow us to supply many customers with components at a lower cost than they can produce themselves. In addition to cost savings, sourcing components from us allows our customers to focus on designing, merchandising and marketing their products.
Products
Bedding Group
| • | Innersprings (sets of steel coils, bound together, that form the core of a mattress) |
| • | Wire forms for mattress foundations |
| • | Machines that we use to shape wire into various types of springs |
Furniture Group
| • | Steel mechanisms and hardware (enabling furniture to recline, tilt, swivel, rock and elevate) for reclining chairs and sleeper sofas |
| • | Springs and seat suspensions for chairs, sofas and loveseats |
| • | Steel tubular seat frames |
Fabric & Carpet Cushion Group
| • | Structural fabrics for mattresses, residential furniture and industrial uses |
| • | Carpet cushion (made from bonded scrap foam, fiber, rubber and prime foam) |
| • | Geo components (synthetic fabrics and various other products used in ground stabilization, drainage protection, erosion and weed control, as well as silt fencing) |
Customers
| • | Manufacturers of finished bedding (mattresses and foundations) and upholstered furniture |
| • | Retailers and distributors of carpet cushion |
| • | Contractors, landscapers, road construction companies, and government agencies using geo components |
Commercial Products Segment
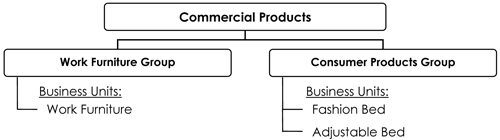
In our Commercial Products segment, we design, manufacture, and distribute a wide range of components and finished products for the office seating and specialty retail markets. We are a major supplier of fashion beds and adjustable beds, with domestic manufacturing and distribution capability as well as established relationships with global sources.
Products
Work Furniture Group
| • | Bases, columns, back rests, casters and frames for office chairs, and control devices that allow chairs to tilt, swivel and elevate |
| • | Select lines of private label finished furniture |
Consumer Products Group
| • | Fashion beds and bed frames |
| • | Adjustable beds |
Customers
| • | Office, institutional, and commercial furniture manufacturers |
| • | Mattress manufactures and retailers |
Industrial Materials Segment
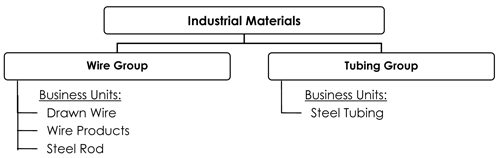
The quality of our products and service, together with low cost, have made Leggett & Platt the leading U.S. supplier of drawn steel wire. Our Wire group operates a steel rod mill with an annual output of approximately 500,000 tons, of which a substantial majority is used by our own wire mills. We have three wire mills that supply virtually all the wire consumed by our other domestic businesses. Our Steel Tubing business unit also supplies a portion of our internal needs for welded steel tubing. In addition to supporting our internal requirements, we supply many external customers with wire and steel tubing products.
2
The Steel Tubing business reached held for sale status in the first quarter of 2015, but did not qualify for discontinued operations treatment.
Products
Wire Group
| • | Steel rod |
| • | Drawn wire |
| • | Steel billets |
| • | Fabricated wire products |
Tubing Group
| • | Welded steel tubing |
| • | Fabricated tube components |
Customers
We use about two-thirds of our wire output and roughly 15-20% of our steel tubing output to manufacture our own products. For example, we use our wire and steel tubing to make:
| • | Bedding and furniture components |
| • | Motion furniture mechanisms |
| • | Automotive seat components. |
The Industrial Materials segment also has a diverse group of external customers, including:
| • | Bedding and furniture makers |
| • | Automotive seating manufacturers |
| • | Mechanical spring makers |
| • | Waste recyclers and waste removal businesses |
Specialized Products Segment
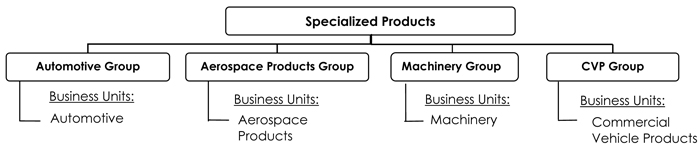
Our Specialized Products segment designs, manufactures and sells products including automotive seating components, specialized machinery and equipment, and service van interiors. Our established design capability and focus on product development have made us a leader in innovation. We also benefit from our broad geographic presence and our internal production of key raw materials and components.
3
In 2012, we formed the Aerospace Products business unit with the acquisition of Western Pneumatic Tube. Western is a leading provider of integral components for critical aircraft systems. The operations produce thin-walled, large diameter, welded tubing and specialty formed products from titanium, nickel, stainless steel, and other specialty materials for leading aerospace suppliers and OEMs. Through additional acquisitions, we have extended our capability in aerospace tube fabrication, and expanded our product offering to include small diameter, high pressure seamless tubing.
Products
Automotive Group
| • | Mechanical and pneumatic lumbar support and massage systems for automotive seating |
| • | Seat suspension systems |
| • | Automotive control cables |
| • | Low voltage motors and actuators |
| • | Formed metal and wire components for seat frames |
Aerospace Products Group
| • | Titanium, nickel, and stainless steel tubing for the aerospace industry |
Machinery Group
| • | Full range of quilting machines for mattress covers |
| • | Industrial sewing/finishing machines |
Commercial Vehicle Products Group
| • | Van interiors (the racks, shelving and cabinets installed in service vans) |
| • | Computer docking stations |
Customers
| • | Automobile seating manufacturers |
| • | Aerospace suppliers and OEMs |
| • | Bedding manufacturers |
| • | Telecom, cable, home service and delivery companies |
4
Revised Segment Financial Data (Unaudited)1
| Full Year | 2012 | 2013 | 2014 | |||||||||||||||||||||||||||||||||||||||||||||||||||||||||||||
| 2011 | 2012 | 2013 | 2014 | 1Q12 | 2Q12 | 3Q12 | 4Q12 | 1Q13 | 2Q13 | 3Q13 | 4Q13 | 1Q14 | 2Q14 | 3Q14 | 4Q14 | |||||||||||||||||||||||||||||||||||||||||||||||||
| Net Trade Sales |
||||||||||||||||||||||||||||||||||||||||||||||||||||||||||||||||
| Residential Furnishings |
1,633.6 | 1,658.6 | 1,715.4 | 1,948.0 | 430.1 | 414.7 | 417.6 | 396.2 | 420.2 | 428.8 | 437.6 | 428.8 | 432.8 | 474.9 | 532.4 | 507.9 | ||||||||||||||||||||||||||||||||||||||||||||||||
| Commercial Products |
433.5 | 462.7 | 454.4 | 471.6 | 118.5 | 113.2 | 118.1 | 112.9 | 115.2 | 111.5 | 119.4 | 108.3 | 111.4 | 112.7 | 123.7 | 123.8 | ||||||||||||||||||||||||||||||||||||||||||||||||
| Industrial Materials |
605.1 | 555.2 | 523.4 | 481.4 | 149.8 | 149.7 | 139.1 | 116.6 | 141.7 | 137.4 | 128.2 | 116.1 | 123.2 | 133.6 | 121.8 | 102.8 | ||||||||||||||||||||||||||||||||||||||||||||||||
| Specialized Products |
631.0 | 738.0 | 784.0 | 881.3 | 177.1 | 189.7 | 188.1 | 183.1 | 183.7 | 201.9 | 192.4 | 206.0 | 208.1 | 234.9 | 219.5 | 218.8 | ||||||||||||||||||||||||||||||||||||||||||||||||
|
|
|
|
|
|
|
|
|
|
|
|
|
|
|
|
|
|
|
|
|
|
|
|
|
|
|
|
|
|
|
|
|
|||||||||||||||||||||||||||||||||
| Sum |
3,303.2 | 3,414.5 | 3,477.2 | 3,782.3 | 875.5 | 867.3 | 862.9 | 808.8 | 860.8 | 879.6 | 877.6 | 859.2 | 875.5 | 956.1 | 997.4 | 953.3 | ||||||||||||||||||||||||||||||||||||||||||||||||
| Sales Growth (Net Trade Sales) |
||||||||||||||||||||||||||||||||||||||||||||||||||||||||||||||||
| Organic |
10.8 | % | 1.1 | % | 0.6 | % | 5.4 | % | na | na | na | na | (2.3 | %) | 0.8 | % | 0.2 | % | 3.9 | % | (0.1 | %) | 6.9 | % | 8.6 | % | 6.2 | % | ||||||||||||||||||||||||||||||||||||
| Acquisition (net) |
0.0 | % | 2.3 | % | 1.2 | % | 3.4 | % | na | na | na | na | 0.6 | % | 0.6 | % | 1.5 | % | 2.3 | % | 1.8 | % | 1.8 | % | 5.1 | % | 4.8 | % | ||||||||||||||||||||||||||||||||||||
| Sum |
10.8 | % | 3.4 | % | 1.8 | % | 8.8 | % | na | na | na | na | (1.7 | %) | 1.4 | % | 1.7 | % | 6.2 | % | 1.7 | % | 8.7 | % | 13.7 | % | 11.0 | % | ||||||||||||||||||||||||||||||||||||
| Net Total Sales |
||||||||||||||||||||||||||||||||||||||||||||||||||||||||||||||||
| Residential Furnishings |
1,656.4 | 1,684.1 | 1,757.1 | 2,014.5 | 436.9 | 421.3 | 424.0 | 401.9 | 426.5 | 437.1 | 450.9 | 442.6 | 448.4 | 491.9 | 549.4 | 524.8 | ||||||||||||||||||||||||||||||||||||||||||||||||
| Commercial Products |
452.0 | 477.1 | 468.8 | 515.4 | 121.9 | 116.9 | 122.1 | 116.2 | 118.9 | 114.8 | 123.4 | 111.7 | 116.6 | 124.3 | 136.2 | 138.3 | ||||||||||||||||||||||||||||||||||||||||||||||||
| Industrial Materials |
847.3 | 804.6 | 754.4 | 741.2 | 220.4 | 215.6 | 197.9 | 170.7 | 205.4 | 198.2 | 183.5 | 167.3 | 180.7 | 190.2 | 194.7 | 175.6 | ||||||||||||||||||||||||||||||||||||||||||||||||
| Specialized Products |
663.1 | 769.3 | 816.6 | 914.2 | 185.5 | 198.1 | 195.3 | 190.4 | 191.6 | 210.2 | 200.6 | 214.2 | 215.9 | 242.5 | 228.4 | 227.4 | ||||||||||||||||||||||||||||||||||||||||||||||||
|
|
|
|
|
|
|
|
|
|
|
|
|
|
|
|
|
|
|
|
|
|
|
|
|
|
|
|
|
|
|
|
|
|||||||||||||||||||||||||||||||||
| Sum |
3,618.8 | 3,735.1 | 3,796.9 | 4,185.3 | 964.7 | 951.9 | 939.3 | 879.2 | 942.4 | 960.3 | 958.4 | 935.8 | 961.6 | 1,048.9 | 1,108.7 | 1,066.1 | ||||||||||||||||||||||||||||||||||||||||||||||||
| Organic Growth (Net Total Sales) |
||||||||||||||||||||||||||||||||||||||||||||||||||||||||||||||||
| Residential Furnishings |
na | 1.4 | % | 4.1 | % | 9.9 | % | na | na | na | na | (2.5 | %) | 3.6 | % | 6.2 | % | 9.8 | % | 4.9 | % | 12.1 | % | 13.0 | % | 9.3 | % | |||||||||||||||||||||||||||||||||||||
| Commercial Products |
na | 5.6 | % | (1.7 | %) | 9.9 | % | na | na | na | na | (2.5 | %) | (1.8 | %) | 1.1 | % | (3.9 | %) | (1.9 | %) | 8.3 | % | 10.4 | % | 23.8 | % | |||||||||||||||||||||||||||||||||||||
| Industrial Materials |
na | (5.4 | %) | (8.4 | %) | (1.7 | %) | na | na | na | na | (9.0 | %) | (10.0 | %) | (9.8 | %) | (3.9 | %) | (12.0 | %) | (4.0 | %) | 6.1 | % | 5.0 | % | |||||||||||||||||||||||||||||||||||||
| Specialized Products |
na | 6.0 | % | 3.2 | % | 8.0 | % | na | na | na | na | 3.3 | % | 5.7 | % | (1.1 | %) | 5.0 | % | 4.9 | % | 9.0 | % | 11.8 | % | 6.2 | % | |||||||||||||||||||||||||||||||||||||
| EBIT |
||||||||||||||||||||||||||||||||||||||||||||||||||||||||||||||||
| Residential Furnishings |
120.1 | 137.0 | 153.3 | 139.3 | 35.1 | 36.7 | 34.9 | 30.3 | 35.6 | 38.4 | 40.3 | 39.0 | 46.8 | 49.6 | 25.4 | 17.5 | ||||||||||||||||||||||||||||||||||||||||||||||||
| Commercial Products |
39.3 | 32.3 | 27.8 | 30.9 | 8.5 | 7.2 | 8.6 | 8.0 | 7.2 | 5.5 | 8.7 | 6.4 | 5.7 | 7.6 | 9.5 | 8.1 | ||||||||||||||||||||||||||||||||||||||||||||||||
| Industrial Materials |
54.0 | 57.6 | 54.8 | 39.6 | 13.2 | 15.4 | 16.1 | 12.9 | 17.4 | 17.0 | 13.2 | 7.2 | 7.7 | 9.0 | 13.6 | 9.3 | ||||||||||||||||||||||||||||||||||||||||||||||||
| Specialized Products |
65.7 | 85.8 | 34.0 | 125.4 | 16.5 | 25.6 | 23.6 | 20.1 | 18.2 | 29.7 | 23.0 | (36.9 | ) | 27.6 | 36.4 | 29.1 | 32.3 | |||||||||||||||||||||||||||||||||||||||||||||||
| Intersegment Eliminations |
(1.3 | ) | (1.1 | ) | 8.6 | (2.8 | ) | (0.8 | ) | (0.8 | ) | 0.4 | 0.1 | (2.2 | ) | (1.1 | ) | 10.3 | 1.6 | (1.8 | ) | (0.2 | ) | (1.0 | ) | 0.2 | ||||||||||||||||||||||||||||||||||||||
| LIFO |
(12.0 | ) | 12.8 | (3.9 | ) | (0.9 | ) | (0.7 | ) | 1.8 | 4.0 | 7.7 | 2.3 | 2.0 | 3.9 | (12.1 | ) | (0.2 | ) | (0.2 | ) | (1.2 | ) | 0.7 | ||||||||||||||||||||||||||||||||||||||||
|
|
|
|
|
|
|
|
|
|
|
|
|
|
|
|
|
|
|
|
|
|
|
|
|
|
|
|
|
|
|
|
|
|||||||||||||||||||||||||||||||||
| Sum |
265.8 | 324.4 | 274.6 | 331.5 | 71.8 | 85.9 | 87.6 | 79.1 | 78.5 | 91.5 | 99.4 | 5.2 | 85.8 | 102.2 | 75.4 | 68.1 | ||||||||||||||||||||||||||||||||||||||||||||||||
| EBIT Margin |
||||||||||||||||||||||||||||||||||||||||||||||||||||||||||||||||
| Residential Furnishings |
7.3 | % | 8.1 | % | 8.7 | % | 6.9 | % | 8.0 | % | 8.7 | % | 8.2 | % | 7.5 | % | 8.3 | % | 8.8 | % | 8.9 | % | 8.8 | % | 10.4 | % | 10.1 | % | 4.6 | % | 3.3 | % | ||||||||||||||||||||||||||||||||
| Commercial Products |
8.7 | % | 6.8 | % | 5.9 | % | 6.0 | % | 7.0 | % | 6.2 | % | 7.0 | % | 6.9 | % | 6.1 | % | 4.8 | % | 7.1 | % | 5.7 | % | 4.9 | % | 6.1 | % | 7.0 | % | 5.9 | % | ||||||||||||||||||||||||||||||||
| Industrial Materials |
6.4 | % | 7.2 | % | 7.3 | % | 5.3 | % | 6.0 | % | 7.1 | % | 8.1 | % | 7.6 | % | 8.5 | % | 8.6 | % | 7.2 | % | 4.3 | % | 4.3 | % | 4.7 | % | 7.0 | % | 5.3 | % | ||||||||||||||||||||||||||||||||
| Specialized Products |
9.9 | % | 11.2 | % | 4.2 | % | 13.7 | % | 8.9 | % | 12.9 | % | 12.1 | % | 10.6 | % | 9.5 | % | 14.1 | % | 11.5 | % | (17.2 | %) | 12.8 | % | 15.0 | % | 12.7 | % | 14.2 | % | ||||||||||||||||||||||||||||||||
| Overall |
8.0 | % | 9.5 | % | 7.9 | % | 8.8 | % | 8.2 | % | 9.9 | % | 10.2 | % | 9.8 | % | 9.1 | % | 10.4 | % | 11.3 | % | 0.6 | % | 9.8 | % | 10.7 | % | 7.6 | % | 7.1 | % | ||||||||||||||||||||||||||||||||
Segment margin = EBIT / Total Sales
Overall margin = EBIT / Trade Sales
| 1 | Historical segment data excludes Store Fixtures since that business has been classified as discontinued operations. |
na = comparative prior year data is not presented.
5