Attached files
| file | filename |
|---|---|
| 8-K - 8-K - KEYCORP /NEW/ | d910142d8k.htm |
| EX-99.3 - EX-99.3 - KEYCORP /NEW/ | d910142dex993.htm |
| EX-99.1 - EX-99.1 - KEYCORP /NEW/ | d910142dex991.htm |
| KeyCorp
First Quarter 2015 Earnings Review
April 16, 2015
Beth E. Mooney
Chairman and
Chief Executive Officer
Don Kimble
Chief Financial Officer
Exhibit 99.2 |
| 2
FORWARD-LOOKING STATEMENTS AND ADDITIONAL
INFORMATION DISCLOSURE
This
presentation
contains
forward-looking
statements
within
the
meaning
of
the
Private
Securities
Litigation
Reform
Act
of
1995.
These
statements
do
not
relate
strictly
to
historical
or
current
facts.
Forward-looking
statements
usually
can
be
identified
by
the
use
of
words
such
as
“goal,”
“objective,”
“plan,”
“expect,”
“assume,”
“anticipate,”
“intend,”
“project,”
“believe,”
“estimate,”
or
other
words
of
similar
meaning.
Forward-looking
statements
provide
management’s
current
expectations
or
forecasts
of
future
events,
circumstances,
results
or
aspirations.
Forward-looking
statements,
by
their
nature,
are
subject
to
assumptions,
risks,
and
uncertainties,
many
of
which
are
outside
of
our
control.
Our
actual
results
may
differ
materially
from
those
set
forth
in
our
forward-looking
statements.
There
is
no
assurance
that
any
list
of
risks
and
uncertainties
or
risk
factors
is
complete.
Factors
that
could
cause
actual
results
to
differ
from
those
described
in
forward-looking
statements
include,
but
are
not
limited
to:
(1)
deterioration
of
commercial
real
estate
market
fundamentals;
(2)
declining
asset
prices;
(3)
adverse
changes
in
credit
quality
trends;
(4)
our
concentrated
credit
exposure
in
commercial,
financial,
and
agricultural
loans;
(5)
defaults
by
our
loan
counterparties
or
clients;
(6)
the
extensive
and
increasing
regulation
of
the
U.S.
financial
services
industry;
(7)
changes
in
accounting
policies,
standards,
and
interpretations;
(8)
increasing
capital
and
liquidity
standards
under
applicable
regulatory
rules;
(9)
unanticipated
changes
in
our
liquidity
position,
including
but
not
limited
to,
changes
in
the
cost
of
liquidity,
our
ability
to
enter
the
financial
markets
and
to
secure
alternative
funding
sources;
(10)
our
ability
to
receive
dividends
from
our
subsidiary,
KeyBank;
(11)
downgrades
in
our
credit
ratings
or
those
of
KeyBank;
(12)
operational
or
risk
management
failures
by
us
or
critical
third-parties;
(13)
breaches
of
security
or
failures
of
our
technology
systems
due
to
technological
or
other
factors
and
cybersecurity
threats;
(14)
negative
outcomes
from
claims
or
litigation;
(15)
the
occurrence
of
natural
or
man-made
disasters
or
conflicts
or
terrorist
attacks;
(16)
a
reversal
of
the
U.S.
economic
recovery
due
to
financial,
political
or
other
shocks;
(17)
our
ability
to
anticipate
interest
rate
changes
and
manage
interest
rate
risk;
(18)
deterioration
of
economic
conditions
in
the
geographic
regions
where
we
operate;
(19)
the
soundness
of
other
financial
institutions;
(20)
our
ability
to
attract
and
retain
talented
executives
and
employees
and
to
manage
our
reputational
risks;
(21)
our
ability
to
timely
and
effectively
implement
our
strategic
initiatives;
(22)
increased
competitive
pressure
due
to
industry
consolidation;
(23)
unanticipated
adverse
effects
of
strategic
partnerships
or
acquisitions
and
dispositions
of
assets
or
businesses;
and
(24)
our
ability
to
develop
and
effectively
use
the
quantitative
models
we
rely
upon
in
our
business
planning.
We provide greater detail regarding these factors in our 2014 Form 10-K and
subsequent filings, which are available online at www.key.com/ir and
www.sec.gov. Any forward-looking statements made by us or on our behalf speak
only as of the date they are made, and Key does not undertake any obligation
to update any forward-looking statement to reflect the impact of subsequent events or circumstances.
This
presentation
also
includes
certain
Non-GAAP
financial
measures
related
to
“tangible
common
equity,”
“Common
Equity
Tier
1,”
“Tier
1
common
equity,”
“pre-provision
net
revenue,”
and
“cash
efficiency
ratio.”
Management
believes
these
ratios
may
assist
investors,
analysts
and
regulators
in
analyzing
Key’s
financials.
Although
Key
has
procedures
in
place
to
ensure
that
these
measures
are
calculated
using
the
appropriate
GAAP
or
regulatory
components,
they
have
limitations
as
analytical
tools
and
should
not
be
considered
in
isolation,
or
as
a
substitute
for
analysis
of
results
under
GAAP.
For
more
information
on
these
calculations
and
to
view
the
reconciliations
to
the
most
comparable
GAAP
measures,
please
refer
to
the
Appendix
to
this
presentation
and
to
page
98
of
our
2014
Form
10-K. |
 3
Revenue benefitted from growth in loans and certain core businesses
-
Total average loans up 5% from prior year; CF&A balances up 12%
Expenses well-managed, reflecting focus on continuous improvement
Reaffirming full-year guidance
Asset quality remains strong
-
NCOs
represented
20
bps
of
average
loans
in
1Q15,
below
targeted
range
-
NPAs remain at a low level: 79 bps of period-end loans, OREO and other
NPAs Higher provision for credit losses exceeded net charge-offs
Remaining disciplined with structure and relationship focus
Strong Risk
Management
Completed 2014 capital plan
-
Repurchased
$208
million
of
common
shares
in
1Q15
(a)
No objection from Federal Reserve on 2015 capital plan
-
Common share repurchases of up to $725 million and, subject to Board approval, a
15% increase in the quarterly common share dividend
-
Total payout estimated to be among the highest in peer group for
third consecutive year
Positive
Operating
Leverage
Investor Highlights –
1Q15
Disciplined
Capital
Management
(a)
Common share repurchase amount includes repurchases to offset issuances of common
shares under our employee compensation plans |
| 4
Financial Review
*
*
*
*
*
*
*
*
*
* |
 5
Financial Highlights
TE = Taxable equivalent, EOP = End of Period
(a)
From continuing operations
(b)
Year-over-year average balance growth
(c)
From consolidated operations
(d)
3-31-15 ratios are estimated
(e)
Non-GAAP measure: see Appendix for reconciliation
EPS –
assuming dilution
$ .26
$ .28
$ .23
$ .27
$ .26
Cash efficiency ratio
(e)
65.1
%
64.4
%
69.7
%
65.6
%
65.1
%
excl. continuous improvement and
efficiency costs
64.4
63.4
66.2
63.2
64.1
Net interest margin (TE)
2.91
2.94
2.96
2.98
3.00
Return on average total assets
1.03
1.12
.92
1.14
1.13
Total loans and leases
5
%
5
%
5
%
6
%
4
%
CF&A loans
12
12
11
13
9
Deposits (excl. foreign deposits)
5
2
4
2
4
Common Equity Tier 1
(d), (e)
10.8
%
-
-
-
-
Tier 1 common equity
(e)
-
11.2
%
11.3
%
11.3
%
11.3
%
Tier 1 risk-based capital
(d)
11.2
11.9
12.0
12.0
12.0
Tangible
common
equity
to
tangible
assets
(e)
9.9
9.9
10.3
10.2
10.1
NCOs to average loans
.20
%
.22
%
.22
%
.22
%
.15
%
NPLs to EOP portfolio loans
.75
.73
.71
.71
.81
Allowance for loan losses to EOP loans
1.37
1.38
1.43
1.46
1.50
Balance
Sheet
Growth
(a),
(b)
Capital
(c)
Asset
Quality
(a)
Financial
Performance
(a)
Metrics
1Q15
4Q14
3Q14
2Q14
1Q14 |
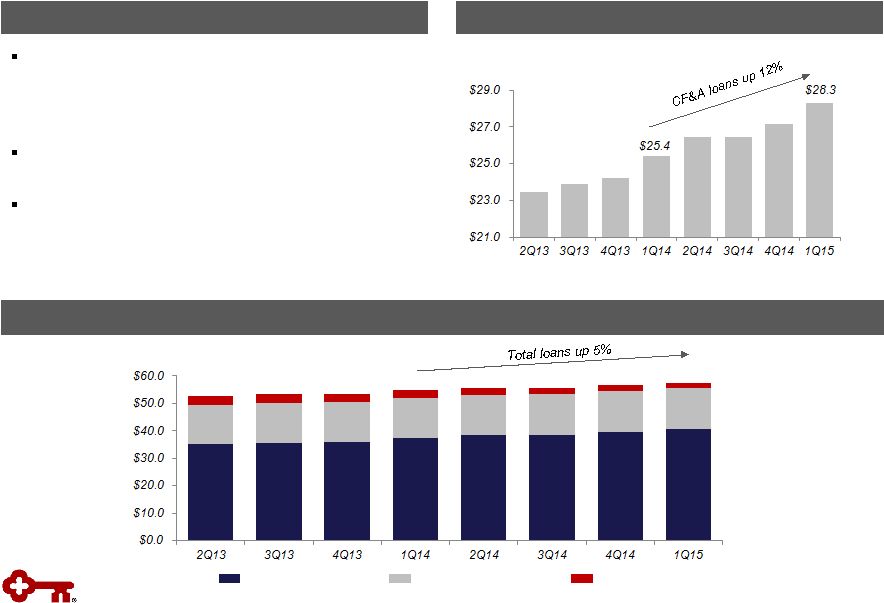 6
Average total loans up 5% in 1Q15 from prior year,
driven by CF&A up 12%
–
Average total loans up for 14 consecutive
quarters; CF&A up for 17
Loan growth from prior quarter driven primarily by
CF&A loans
Total commitments continue to grow with
utilization relatively stable
Loan Growth
$ in billions
Highlights
Average Commercial, Financial & Agricultural Loans
Average Loans
Exit Portfolios
Home Equity & Other
Total Commercial
$ in billions
$57.5
$54.7 |
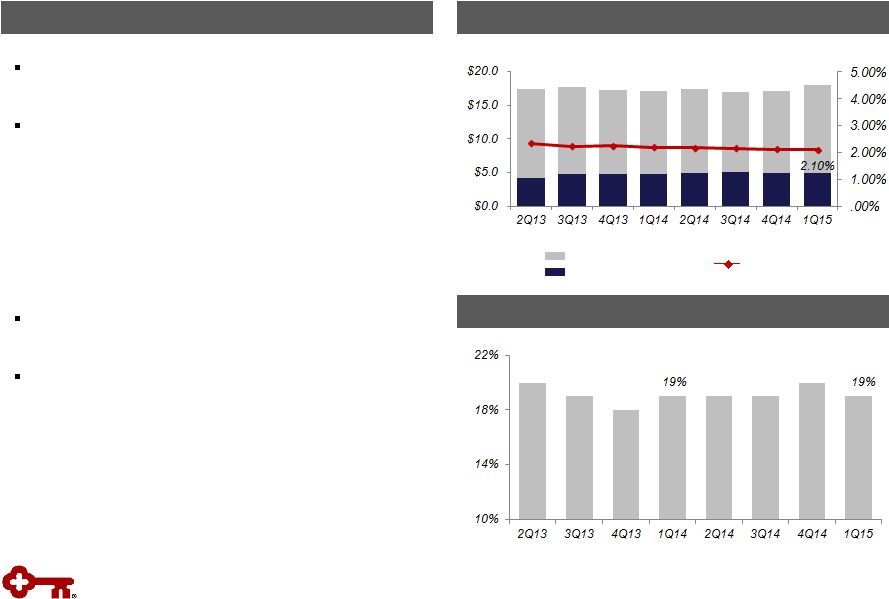
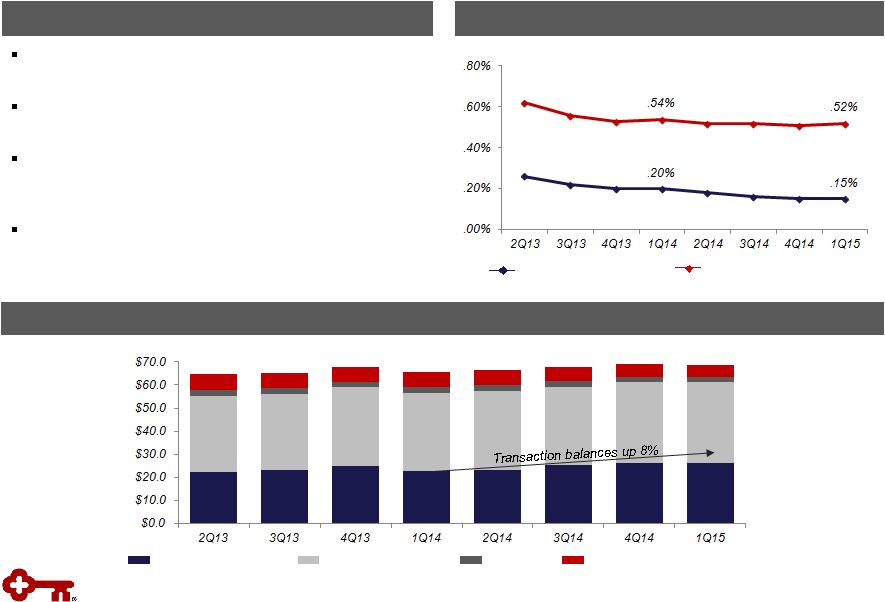 7
Improving Deposit Mix
Highlights
Funding Cost
Funding cost continues to improve compared to
prior year
Transaction deposit balances up 8% from 1Q14,
partially offset by lower CD balances
Deposit growth from prior year reflects strength in
noninterest-bearing balances and inflows from
commercial mortgage servicing
Balances down slightly from 4Q14, primarily due
to lower CD balances
Average
Deposits
(a)
$ in billions
Note: Transaction deposits include noninterest-bearing, as well as NOW and
MMDA (a)
Excludes deposits in foreign office
Cost of total deposits
(a)
Interest-bearing liability cost
CDs and other time deposits
Savings
Noninterest-bearing
NOW and MMDA
$68.8
$65.6 |
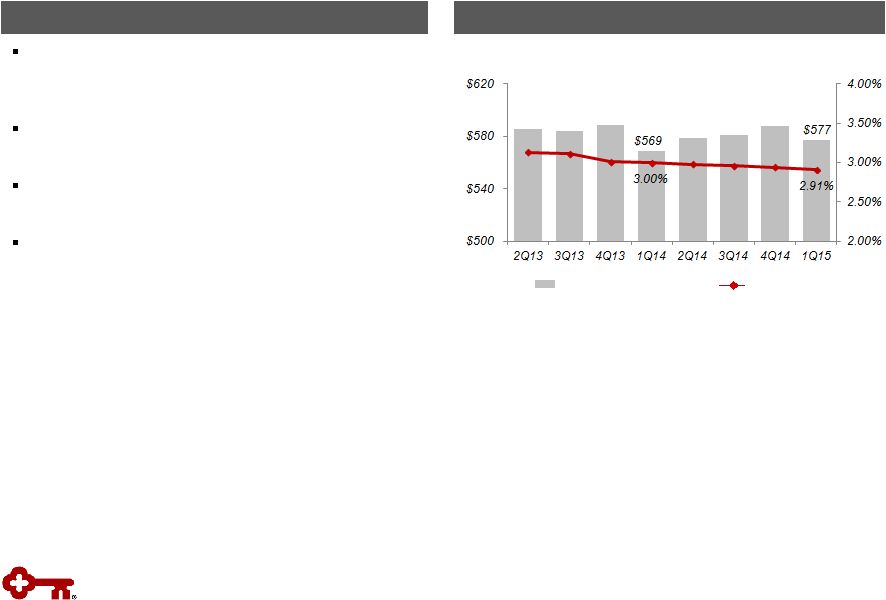 8
Net Interest Income and Margin
TE = Taxable equivalent
Highlights
Net Interest Income & Net Interest Margin Trend (TE)
Net interest income up $8 MM from the prior year,
reflecting higher loan balances offset by lower
earning asset yields
NII down $11 MM from the prior quarter, primarily
due to fewer days in the first quarter of 2015
The 3 basis point decline in net interest margin from
4Q14 reflects lower earning asset yields
Maintaining moderate asset sensitive position
–
Naturally asset sensitive balance sheet flows:
approximately 70% of loans variable rate
–
High quality investment portfolio with average
life of 3.5 years
–
Flexibility to quickly adjust interest rate risk
position
Net interest income (TE)
NIM (TE)
$ in millions; continuing operations |
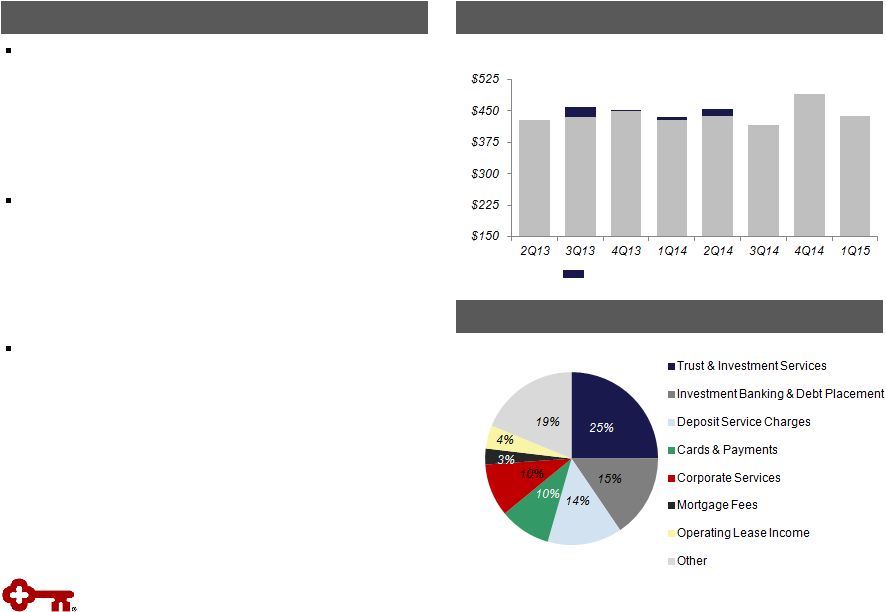 9
Noninterest Income
TE = Taxable equivalent
Highlights
Noninterest Income
Noninterest income up slightly from prior year,
driven by:
–
Trust and investment services 11% higher
–
Cards and payments up 11%
–
Higher principal investing gains and
corporate-owned life insurance
Growth from prior year offset by:
–
Lower investment banking and debt
placement (financial advisory fees)
–
Lower operating lease income and other
leasing gains (leveraged lease termination
in 1Q14)
Comparison to prior quarter reflects seasonality
and variability in business model
–
Investment banking and debt placement:
lower revenue from loan syndications and
financial advisory fees
–
Corporate-owned life insurance: seasonally
higher in 4Q
–
Corporate services: strong activity in 4Q
1Q15 Noninterest Income Diversity
$ in millions; continuing operations
(a)
Other includes corporate-owned life insurance, principal investing, etc.
Leveraged lease termination gains
$437
$435
(a) |
 10
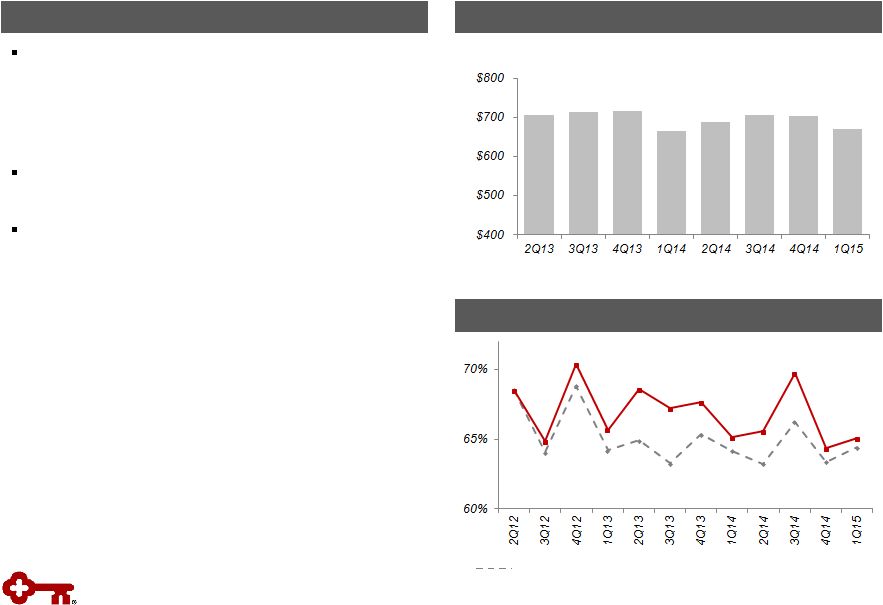
Focused Expense Management
Noninterest Expense
$ in millions
Highlights
$669
$664
Noninterest expense up 1% in 1Q15 from prior year
–
Growth related to the 3Q14 Pacific Crest
acquisition and higher employee benefits cost
more than offset savings from continuous
improvement efforts
1Q15 included $7 MM of costs associated with
continuous improvement and efficiency efforts
Compared to the prior quarter, expenses were
down 5%
–
Incentive compensation down $35 MM
–
Marketing expense $8 MM lower
–
Salaries $6 MM lower
–
Professional fees down by $5 MM
–
Employee benefits cost up $19 MM
(a)
Non-GAAP measure: see Appendix for reconciliation
(b)
3Q12 excludes one-time gains of $54 million related to the redemption of trust
preferred securities Cash Efficiency Ratio
(a), (b)
Cash efficiency ratio, excl. costs for continuous improvement efforts
|
 11
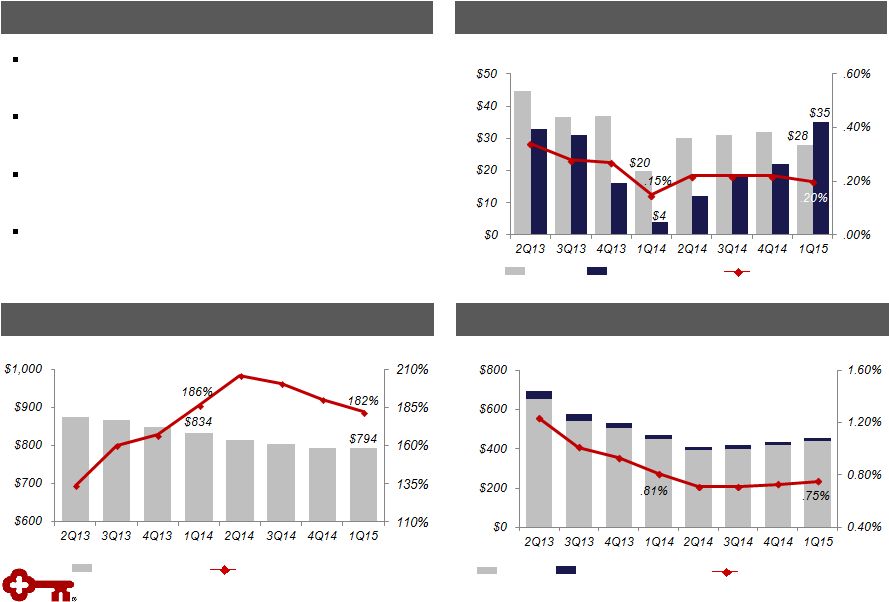
Nonperforming Assets
Net Charge-offs & Provision for Credit Losses
NPLs
NPLs to period-end loans
NCOs
Provision for credit
losses
NCOs to average loans
$ in millions
$ in millions
NPLs held for sale,
OREO & other NPAs
Strong Asset Quality
Highlights
Net loan charge-offs remain below targeted range,
at 20 basis points of average loans
Total gross charge-offs down 18% from the
prior year
Higher provision for credit losses exceeded net
charge-offs
Nonperforming assets represented 79 basis points
of period-end loans, OREO and other NPAs
Allowance for Loan and Lease Losses
Allowance for loan and
lease losses to NPLs
Allowance for loan
and lease losses
$ in millions
$469
$457 |
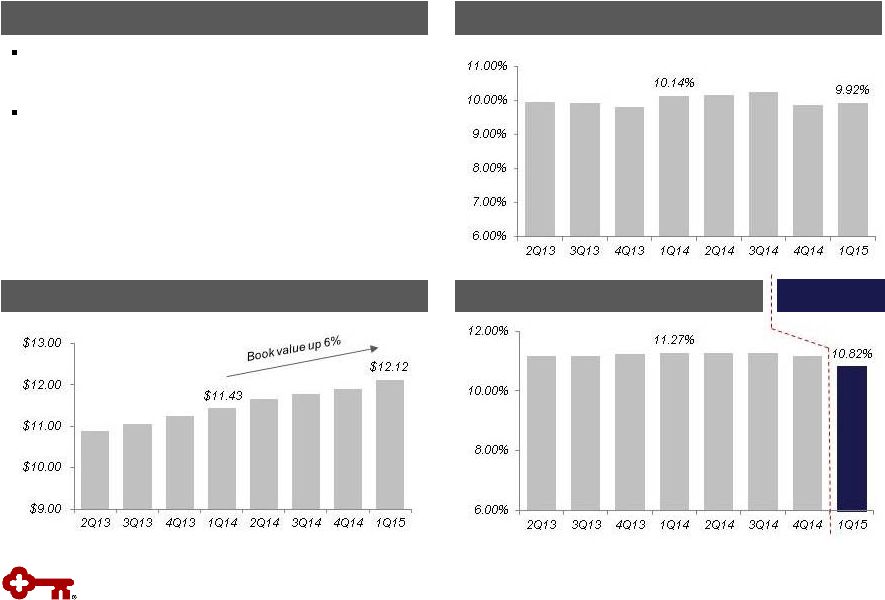 12
Disciplined capital management
–
Repurchased $208 MM of common shares in 1Q15
No objection from Federal Reserve on 2015
capital plan, including:
–
Share repurchase program of up to $725 MM
–
15% increase in quarterly common share dividend
(subject to Board approval)
–
An additional increase in the quarterly common
share dividend in 2016 (subject to Board approval)
Tier 1 Common Equity
(a)
Tangible Common Equity to Tangible Assets
(a)
Strong Capital
Highlights
Book Value per Share
Note: Common share repurchase amounts include repurchases to offset issuances of
common shares under our employee compensation plans (a)
Non-GAAP measure: see Appendix for reconciliations
(b)
3-31-15 ratio is estimated
(c)
The Regulatory Capital Rules, effective January 1, 2015 for Key,
introduced a new capital measure, “Common Equity Tier 1”
Common Equity
Tier 1
(a), (b), (c) |
 Outlook and Expectations
Average Loans
•
Mid-single digit growth vs. FY 2014
Net Interest Income
•
Up
low-to-mid
single
digit
percentage
vs.
FY
2014
(low
single-digits
without
the
benefit
of
higher
rates)
•
NIM
stable-to-slightly
higher
later
in
the
year
Noninterest Income
•
Mid-single
digit
growth
compared
to
2014,
including
full
year
impact
of
Pacific
Crest
Expense
•
Relatively stable with 2014
Efficiency / Productivity
•
Positive operating leverage
Asset Quality
•
Net
charge-offs
to
average
loans
below
targeted
range
of
40
–
60
bps
•
Provision
expected
to
approximate
net
charge-offs
Capital
•
Disciplined
management
of
capital
including
dividends
and
share
repurchases
13
Guidance
ranges:
relatively
stable:
+/-
2%;
low
single-digit:
<5%;
mid-single
digit:
4%
-
6%;
low
double-digit:
10%
-
13%
FY 2015 |
 14
Appendix |
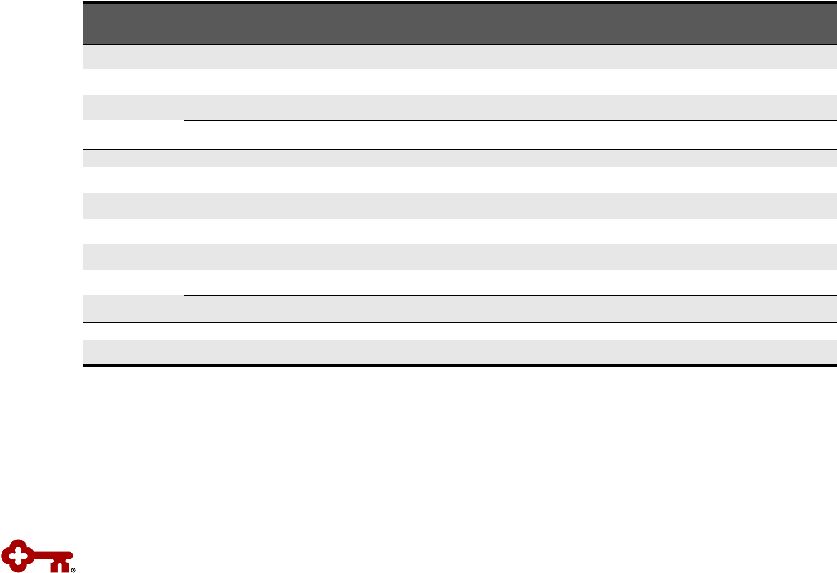
 Progress on Targets for Success
(a)
Continuing operations, unless otherwise noted
(b)
Represents period-end consolidated total loans and loans held for sale divided
by period-end consolidated total deposits (excluding deposits in foreign office)
(c)
Excludes intangible asset amortization; non-GAAP measure: see Appendix for
reconciliation 15
Balance Sheet
Efficiency
Moderate Risk
Profile
High Quality,
Diverse
Revenue Streams
Positive
Operating
Leverage
Disciplined
Capital
Management
Metrics
(a)
1Q15
4Q14
Targets
Loan to deposit ratio
(b)
NCOs to average loans
Provision for credit
losses to
average loans Net interest margin
Noninterest income to total revenue
Cash
efficiency
ratio
(c)
Return on average assets
87%
85%
.20%
.22%
65.1%
64.4%
1.03%
1.12%
.25%
.15%
2.91%
2.94%
43%
45%
90% -100%
40 -
60 bps
LT: >3.50%
LT: <60%
1.00% -1.25%
>40% |
 16
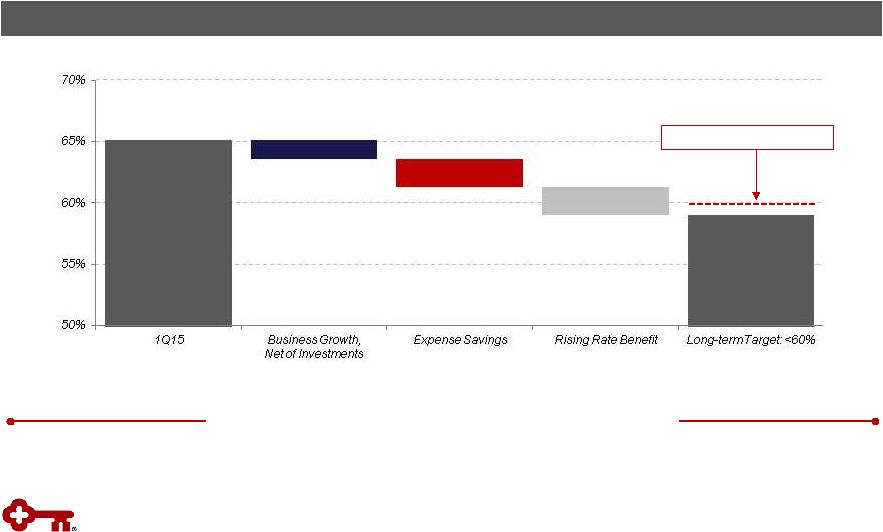
Efficiency Ratio: Driving to 60% and Below
Business plans and macroeconomic environment provide path to an
efficiency ratio below 60%
Cash Efficiency Ratio
(a)
Outlook
(a)
Non-GAAP measure: see Appendix for reconciliation
(b)
Assumes implied forward curve
2-3 year outlook: 60%
Long-term, committed to moving below 60%
(b) |
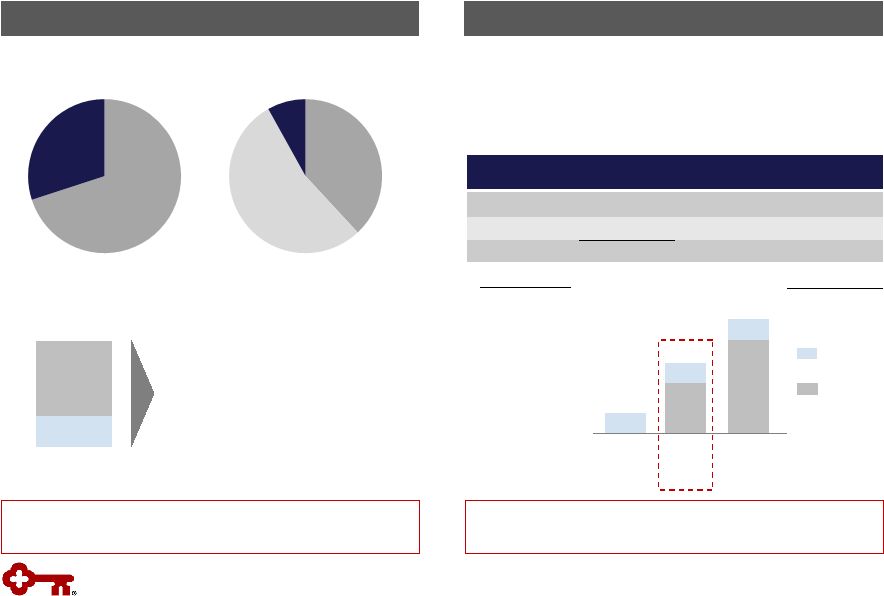
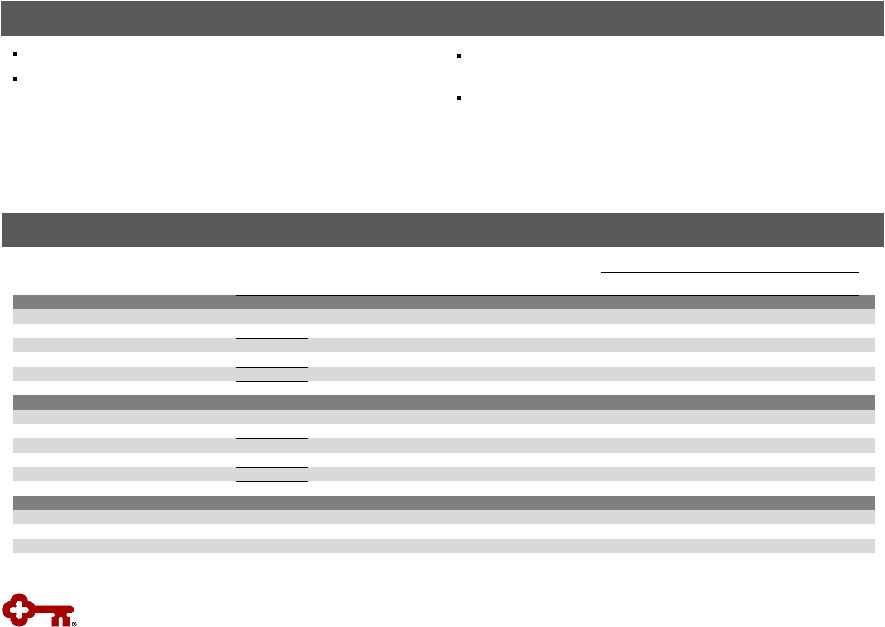
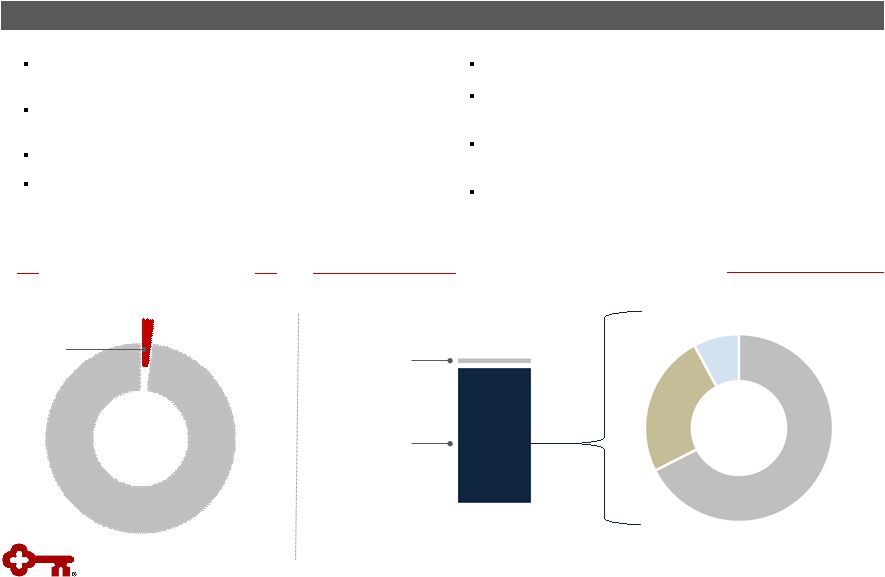 Oil
& Gas Longstanding history, expertise and relationships
17
Strong Portfolio Characteristics
>10 years of experience in energy lending with >20
specialists dedicated to oil & gas
Focused on middle market companies, aligned with our
relationship strategy
Portfolio regularly stress tested
Primarily secured by proven reserves
Total Loans Outstanding, 3/31/15
>40% of clients’
2015 production is hedged
Relationships contribute to noninterest income; ~5% of FY14
investment banking and debt placement fees
Solid credit quality, with net charge-offs lower than overall
portfolio
Allowance reflects estimated impact of current oil prices
Oil & Gas: 2%
Other: 98%
Oil & Gas Outstanding Balances, 3/31/15
Oilfield Services
Upstream: 68%,
$0.7 B
Midstream: 24%,
$0.3 B
Downstream: 8%,
$0.1 B
$0.1 B
Oil & Gas
$1.1 B |
 18
Average Total Investment Securities
Highlights
Average AFS securities
$ in billions
High Quality Investment Portfolio
Portfolio composed primarily of GNMA and GSE-
backed MBS and CMOs
Continue to position portfolio for upcoming
regulatory liquidity requirements:
–
1Q15 average balance growth reflects
actions taken at the end of 4Q14 to
increase liquidity reserves
–
Growth and reinvestment of portfolio cash
flows have been in GNMA securities (44%
of total portfolio was GNMA at 3/31/15)
Securities cash flows of $1.0 billion in 1Q15, up
slightly from $.9 billion in 4Q14
Average portfolio life at 3/31/15 of 3.5 years,
compared to 3.6 years at 12/31/14
Securities to Total Assets
(b)
(a) Yield is calculated on the basis of amortized cost
(b) Includes end of period held-to-maturity and
available-for-sale securities Average yield
(a)
Average HTM securities
$17.1
2.19%
$18.0 |
 Interest Rate Risk Management
Naturally Asset Sensitive Balance Sheet
Actively Managing Rate Risk
•
High quality
•
Fixed rate agency MBS and CMOs
•
Average maturity: 3.5 years
•
GNMAs total 44% of total portfolio
•
Reinvesting cash flows into GNMAs
$11
$18
$6
$6
Size of swap
portfolio
Modeled asset
sensitivity
~3%
0%
~8%
$6
Flexibility to Adjust Rate
Sensitivity with Swaps
Loan Portfolio
Variable:
70%
Fixed:
30%
Deposits
(a)
Flexibility to adjust rate sensitivity for changes in balance
sheet growth/mix as well as interest rate outlook
Debt
hedges
A/LM
hedges
Investment Portfolio
Noninterest-
bearing: 38%
Interest-
bearing, non-
time: 54%
CDs:
8%
•
Maintaining
moderate
asset
sensitive
position
of
~3%
(b)
-
Assumes 200 basis point increase in short-term rates over a
12-month period
•
Utilize swaps for debt hedging and asset liability management
-
Fairly even pace of A/LM swap maturities
1Q15
Swaps
($ in B)
3/31/15
Notional Amt.
Wtd. Avg.
Maturity (Yrs.)
Receive
Rate
Pay
Rate
A/L Management
$ 10.5
2.0
.9%
.2%
Debt
6.1
3.8
2.2
.2
$ 16.6
1.4%
.2%
1Q15
$18 B
AFS: $13 B
HTM: $5 B
Balance sheet has relatively short duration and is
more impacted by the short-end of the curve
$17 B
19
Actively managing a naturally asset sensitive balance sheet
(a)
Excludes deposits in foreign office
(b)
Preliminary estimate
1Q15
1Q15 |
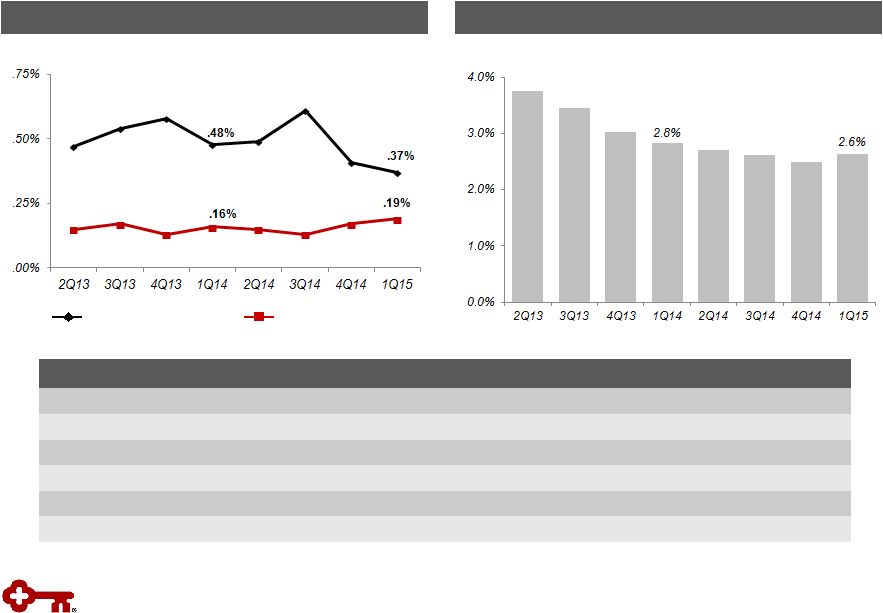 20
Asset Quality Trends
Criticized Outstandings
(a)
to Period-end Total Loans
Delinquencies to Period-end Total Loans
(a)
Loan and lease outstandings
(b)
From continuing operations
30 –
89 days delinquent
90+ days delinquent
Metric
(b)
1Q15
4Q14
3Q14
2Q14
1Q14
Delinquencies to EOP total loans: 30-89 days
.37
%
.41
%
.61
%
.49
%
.48
%
Delinquencies to EOP total loans: 90+ days
.19
.17
.13
.15
.16
NPLs to EOP portfolio loans
.75
.73
.71
.71
.81
NPAs to EOP portfolio loans + OREO + Other NPAs
.79
.76
.74
.74
.85
Allowance for loan losses to period-end loans
1.37
1.38
1.43
1.46
1.50
Allowance for loan losses to NPLs
181.7
190.0
200.5
205.6
185.7
Continuing operations
Continuing operations |
 Period-
end loans
Average
loans
Net loan
charge-offs
Net loan
charge-offs
(b)
/
average loans
(%)
Nonperforming
loans
(c)
Ending
allowance
(d)
Allowance /
period-end
loans
(d)
(%)
Allowance /
NPLs
(%)
3/31/15
1Q15
1Q15
1Q15
3/31/15
3/31/15
3/31/15
3/31/15
Commercial,
financial
and
agricultural
(a)
$ 28,783
$ 28,321
$
7 .10
$
98
$ 406
1.41
414.29
Commercial real estate:
Commercial Mortgage
8,162
8,095
-
-
30
148
1.81
493.33
Construction
1,142
1,139
1
.36
12
28
2.45
233.33
Commercial lease financing
4,064
4,070
(2)
(.20)
20
55
1.35
275.00
Real
estate
–
residential
mortgage
2,231
2,229
2
.36
72
21
.94
29.17
Home equity
10,523
10,576
5
.19
191
62
.59
32.46
Credit cards
727
732
8
4.43
2
32
4.40
N/M
Consumer
other
–
Key
Community
Bank
1,547
1,546
4
1.05
2
21
1.36
N/M
Consumer
other
–
Exit
Portfolio
774
804
3
1.51
10
21
2.71
210.00
Continuing
total
(e)
$ 57,953
$ 57,512
$
28
.20
$
437 $
794
1.37
181.69
Discontinued operations
2,219
2,249
6
4.22
8
25
1.13
312.50
Consolidated total
$ 60,172
$ 59,761
$ 34
.23
$
445
$ 819
1.36
184.04
Credit Quality by Portfolio
Credit Quality
$ in millions
21
(a)
3-31-15
ending
loan
balance
includes
$87
million
of
commercial
credit
card
balances;
3-31-15
average
loan
balance
includes
$87
million
of
assets
from
commercial
credit
cards
(b)
Net
loan
charge-off
amounts
are
annualized
in
calculation
(c)
3-31-15
NPL
amount
excludes
$12
million
of
purchased
credit
impaired
loans
(d)
3-31-15
allowance
by
portfolio
is
estimated
(e)
3-31-15
ending
loan
balance
includes
purchased
loans
of
$130
million,
of
which
$12
million
were
purchased
credit
impaired
N/M = Not meaningful |
 Vintage (% of Loans)
Loan Balances
Average Loan
Size ($)
Average
FICO
Average
LTV
(a)
% of Loans
LTV>90%
2012 and
later
2011
2010
2009
2008 and
prior
Loans and lines
First lien
$
6,159
$
65,830
772
67
%
.5
%
53
%
5%
3%
3%
36
%
Second lien
4,111
53,239
766
76
3.6
35
5
3
3
54
Community Bank
$
10,270
59,765
770
71
1.7
46
5
3
3
43
Exit portfolio
253
17,084
729
80
31.9
-
-
-
-
100
Total home equity portfolio
$
10,523
Nonaccrual loans and lines
First lien
$
105
$
65,713
721
73
%
1.1%
10
%
3%
2%
5%
80
%
Second lien
77
48,942
711
80
2.0
4
2
2
4
88
Community Bank
$
182
57,367
717
77
1.5
7
3
2
5
83
Exit portfolio
9
22,867
699
75
27.0
-
-
-
-
100
Total home equity nonaccruals
$
191
First quarter net charge-offs (NCOs)
Community Bank
$
5
4
%
-
3%
1%
92
%
% of average loans
.19
%
Exit Portfolio
-
-
-
-
-
-
% of average loans
-
(a) Average LTVs are at origination; current average LTVs for Community Bank total
home equity loans and lines is approximately 70%, which is unchanged from
the fourth quarter of 2014 Home Equity Portfolio –
3/31/15
$ in millions, except average loan size
Home Equity Portfolio
Highlights
High quality portfolio
Community bank loans and lines: 98% of total portfolio; branch-
originated
–
60% first lien position
–
Average FICO score of 770
–
Average LTV at origination: 71%
$4.0 billion of the total portfolio are fixed rate loans that require
principal and interest payments; $6.5 billion are lines
$1.4 billion in lines outstanding (13% of the total portfolio)
come to end of draw period in the next four years
–
Proactive communication and client outreach initiated
near end of draw period
22 |
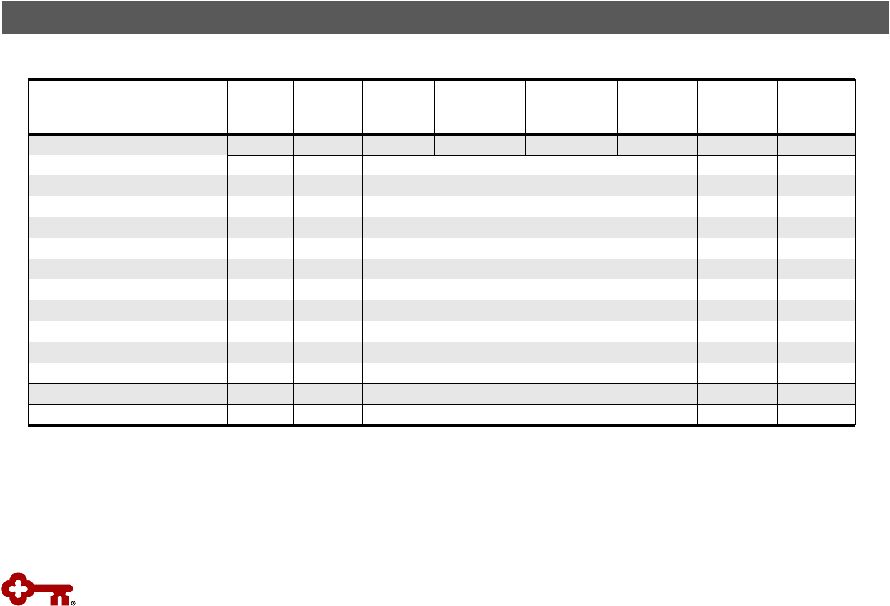
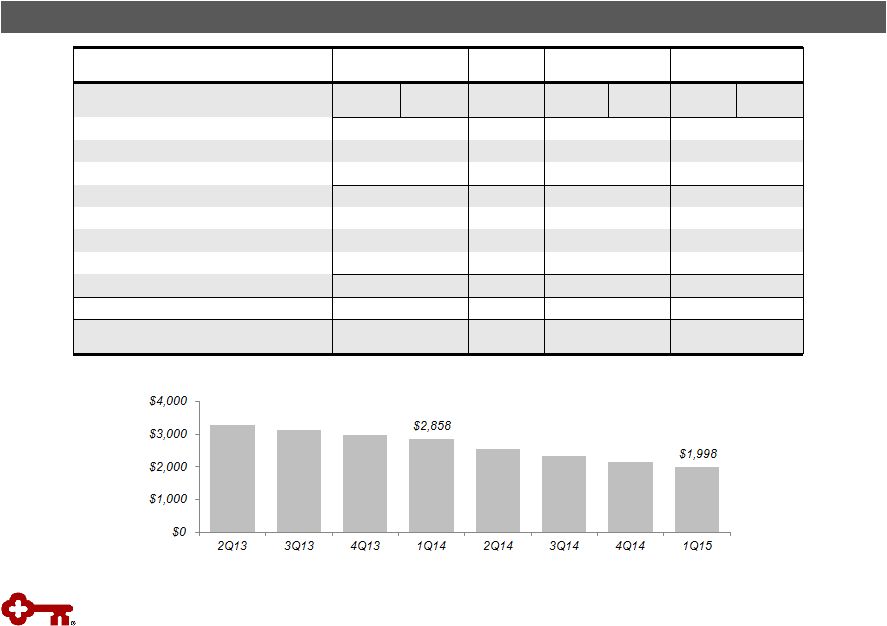 Balance Outstanding
Change
Net Loan Charge-offs
Balance on
Nonperforming Status
3-31-15
12-31-14
3-31-15
vs.
12-31-14
1Q15
(b)
4Q14
(b)
3-31-15
12-31-14
Residential
properties
–
homebuilder
$ 6
$ 10
$ (4)
$ 1
-
$
8 $
9
Marine and RV floor plan
6
7
(1)
-
-
5
5
Commercial lease financing
(a)
877
967
(90)
(1)
$ 3
-
1
Total commercial loans
889
984
(95)
-
3
13
15
Home
equity
–
Other
253
267
(14)
-
-
9
10
Marine
730
779
(49)
2
3
9
15
RV and other consumer
50
54
(4)
1
(1)
1
1
Total consumer loans
1,033
1,100
(67)
3
2
19
26
Total exit loans in loan portfolio
1,922
2,084
$ (162)
$ 3
$ 5
$ 32
$ 41
Discontinued
operations
–
education
lending
business (not included in exit loans above)
$ 2,219
$ 2,295
$ (76)
$ 6
$ 8
$ 8
$ 11
$ in millions; average balances
(a)
Includes
(1)
the
business
aviation,
commercial
vehicle,
office
products,
construction
and
industrial
leases;
(2)
Canadian
lease
financing
portfolios;
(3)
European
lease
financing
portfolios;
and
(4)
all
remaining
balances
related
to
lease
in,
lease
out;
sale
in,
lease
out;
service
contract
leases;
and
qualified
technological
equipment
leases.
(b)
Credit
amounts
indicate
recoveries
exceeded
charge-offs
$ in millions
Exit Loan Portfolio
Exit Loan Portfolio
23 |
 Three
months ended 3-31-15
12-31-14
9-30-14
6-30-14
3-31-14
Tangible common equity to tangible assets at period end
Key shareholders’
equity (GAAP)
$
10,603
$
10,530
$
10,486
$
10,504
$
10,403
Less:
Intangible
assets
(a)
1,088
1,090
1,105
1,008
1,012
Preferred
Stock,
Series
A
(b)
281
282
282
282
282
Tangible common equity (non-GAAP)
$
9,234
$
9,158
$
9,099
$
9,214
$
9,109
Total assets (GAAP)
$
94,206
$
93,821
$
89,784
$
91,798
$
90,802
Less:
Intangible
assets
(a)
1,088
1,090
1,105
1,008
1,012
Tangible assets (non-GAAP)
$
93,118
$
92,731
$
88,679
$
90,790
$
89,790
Tangible common equity to tangible assets ratio (non-GAAP)
9.92
%
9.88
%
10.26
%
10.15
%
10.14
%
Common Equity Tier 1 at period end
Key shareholders’
equity (GAAP)
$
10,603
-
-
-
-
Less:
Preferred
Stock,
Series
A
(b)
281
-
-
-
-
Common Equity Tier 1 capital before adjustments and deductions
10,322
-
-
-
-
Less:
Goodwill
1,057
-
-
-
-
Intangible assets, net of deferred tax liabilities
36
-
-
-
-
Deferred tax assets
12
-
-
-
-
Net unrealized gains (losses) on available-for-sale securities
52
-
-
-
-
Accumulated gain (loss) on cash flow hedges
(8)
-
-
-
-
Amounts recorded in accumulated other comprehensive income (loss)
related to pension and postretirements benefits costs
(364)
-
-
-
-
Total
Common
Equity
Tier
1
capital
(c)
$
9,537
-
-
-
-
Net
risk-weighted
assets
(regulatory)
(c)
$
88,123
-
-
-
-
Common
Equity
Tier
1
ratio
(non-GAAP)
(c)
10.82
%
-
-
-
-
Tier 1 common equity at period end
Key shareholders’
equity (GAAP)
-
$
10,530
$
10,486
$
10,504
$
10,403
Qualifying capital securities
-
339
340
339
339
Less:
Goodwill
-
1,057
1,051
979
979
Accumulated
other
comprehensive
income
(loss)
(d)
-
(395)
(366)
(328)
(367)
Other
assets
(e)
-
83
110
86
84
Total Tier 1 capital (regulatory)
-
10,124
10,031
10,106
10,046
Less:
Qualifying capital securities
-
339
340
339
339
Preferred
Stock,
Series
A
(b)
-
282
282
282
282
Total Tier 1 common equity (non-GAAP)
-
$
9,503
$
9,409
$
9,485
$
9,425
Net risk-weighted assets (regulatory)
-
$
85,100
$
83,547
$
84,287
$
83,637
Tier 1 common equity ratio (non-GAAP)
-
11.17
%
11.26
%
11.25
%
11.27
%
GAAP to Non-GAAP Reconciliation
$ in millions
24
a)
Three months ended 3/31/15, 12/31/14, 9/30/14, 6/30/14, and 3/31/14 exclude $61
million, $68 million, $72 million, $79 million, and $84 million of period-end
purchased credit card receivable intangible assets, respectively
b)
Net of capital surplus
c)
3-31-15 amount is estimated
d)
Includes net unrealized gains or losses on securities available for sale (except
for net unrealized losses on marketable equity securities), net gains or losses on cash
flow hedges, and amounts resulting from the application of the applicable
accounting guidance for defined benefit and other postretirement plans
e)
Other assets deducted from Tier 1 capital and net risk-weighted assets consist
of disallowed intangible assets (excluding goodwill) and deductible portions of
nonfinancial equity investments. There were no disallowed deferred tax
assets at 12/31/14, 9/30/14, 6/30/14, and 3/31/14 |
 Three months ended
3-31-15
12-31-14
9-30-14
6-30-14
3-31-14
Pre-provision net revenue
Net interest income (GAAP)
$
571
$
582
$
575
$
573
$
563
Plus:
Taxable-equivalent adjustment
6
6
6
6
6
Noninterest income (GAAP)
437
490
417
455
435
Less:
Noninterest expense (GAAP)
669
704
706
687
664
Pre-provision net revenue from continuing operations (non-GAAP)
$
345
$
374
$
292
$
343
$
340
Average tangible common equity
Average Key shareholders’
equity (GAAP)
$
10,570
$
10,562
$
10,473
$
10,459
$
10,371
Less:
Intangible assets (average)
(a)
1,089
1,096
1,037
1,010
1,013
Preferred Stock, Series A (average)
290
291
291
291
291
Average tangible common equity (non-GAAP)
$
9,191
$
9,175
$
9,145
$
9,158
$
9,067
Return on average tangible common equity from continuing operations
Net
income
(loss)
from
continuing
operations
attributable
to
Key
common
shareholders (GAAP)
$
222
$
246
$
197
$
242
$
232
Average tangible common equity (non-GAAP)
9,191
9,175
9,145
9,158
9,067
Return on average tangible common equity from continuing operations
(non-GAAP) 9.80
%
10.64
%
8.55
%
10.60
%
10.38
%
Return on average tangible common equity consolidated
Net income (loss) attributable to Key common shareholders (GAAP)
$
227
$
248
$
180
$
214
$
236
Average tangible common equity (non-GAAP)
9,191
9,175
9,145
9,158
9,067
Return on average tangible common equity consolidated (non-GAAP)
10.02
%
10.72
%
7.81
%
9.37
%
10.56
%
Cash efficiency ratio
Noninterest expense (GAAP)
$
669
$
704
$
706
$
687
$
664
Less:
Intangible asset amortization (GAAP)
9
10
10
9
10
Adjusted noninterest expense (non-GAAP)
$
660
$
694
$
696
$
678
$
654
Net interest income (GAAP)
$
571
$
582
$
575
$
573
$
563
Plus:
Taxable-equivalent adjustment
6
6
6
6
6
Noninterest income (GAAP)
437
490
417
455
435
Total taxable-equivalent revenue (non-GAAP)
$
1,014
$
1,078
$
998
$
1,034
$
1,004
Cash efficiency ratio (non-GAAP)
65.1
%
64.4
%
69.7
%
65.6
%
65.1
%
GAAP to Non-GAAP Reconciliation
(continued)
$ in millions
(a)
Three months ended 3/31/15, 12/31/14, 9/30/14, 6/30/14, and 3/31/14 exclude $64
million, $69 million, $76 million, $82 million, and $89 million of average
purchased credit card receivable intangible assets, respectively
25 |
 KeyCorp & Subsidiaries
$ in billions
Quarter ended
March 31, 2015
Common Equity Tier 1 under current regulatory rules
$
9.5 Adjustments from current regulatory rules
to the Regulatory Capital Rules: Deferred
tax
assets
and
other
assets
(b)
(.1)
Common
Equity
Tier
1
anticipated
under
the
Regulatory
Capital
Rules
(c)
$
9.5 Net risk-weighted assets under current
regulatory rules
$
88.1 Adjustments from current regulatory rules to the
Regulatory Capital Rules: Mortgage servicing assets
(d)
.5
Deferred tax assets
(d)
.3
Significant investments
(d)
.5
Total
risk-weighted
assets
anticipated
under
the
Regulatory
Capital
Rules
(c)
$
89.5 Common Equity Tier 1 under the Regulatory Capital
Rules 10.6
%
(a)
Common
Equity
Tier
1
capital
is
a
non-generally
accepted
accounting
principle
(GAAP)
financial
measure
that
is
used
by
investors,
analysts
and
bank
regulatory
agencies
to
assess
the
capital
position
of
financial
services
companies.
Management
reviews
Common
Equity
Tier
1
along
with
other
measures
of
capital
as
part
of
its
financial
analyses
(b)
Includes
the
deferred
tax
asset
subject
to
future
taxable
income
for
realization,
primarily
tax
credit
carryforwards,
as
well
as
the
deductible
portion
of
purchased
credit
card
receivables
(c)
The
anticipated
amount
of
regulatory
capital
and
risk-weighted
assets
is
based
upon
the
federal
banking
agencies’
Regulatory
Capital
Rules
(as
fully
phased-in
on
January
1,
2019);
Key
is
subject
to
the
Regulatory
Capital
Rules
under
the
“standardized
approach”
(d)
Item
is
included
in
the
10%/15%
exceptions
bucket
calculation
and
is
risk-weighted
at
250%
under
the
fully
implemented
final
rule
Table
may
not
foot
due
to
rounding
26
Common Equity Tier 1 Under the Regulatory Capital Rules
(estimated)
(a) |