Attached files
| file | filename |
|---|---|
| EX-1.1 - EX-1.1 - Commercial Credit, Inc. | d809455dex11.htm |
| EX-23.1 - EX-23.1 - Commercial Credit, Inc. | d809455dex231.htm |
| EX-10.25 - EX-10.25 - Commercial Credit, Inc. | d809455dex1025.htm |
Table of Contents
As filed with the Securities and Exchange Commission on April 16, 2015
Registration No. 333-202881
UNITED STATES
SECURITIES AND EXCHANGE COMMISSION
Washington, D.C. 20549
Amendment No. 1 to
FORM S-1
REGISTRATION STATEMENT UNDER THE
SECURITIES ACT OF 1933
Commercial Credit, Inc.
(Exact name of registrant as specified in its charter)
| Delaware | 6199 | 47-1962209 | ||
| (State or other jurisdiction of incorporation or organization) | (Primary Standard Industrial Classification Code Number) |
(I.R.S. Employer Identification No.) |
227 West Trade Street
Suite 1450
Charlotte, North Carolina 28202
(704) 944-2770
(Address, including zip code, and telephone number, including area code, of registrant’s principal executive offices)
Daniel J. McDonough
227 West Trade Street
Suite 1450
Charlotte, North Carolina 28202
(704) 944-2770
(Name, address, including zip code, and telephone number, including area code, of agent for service)
Copies to:
| David S. Bakst John P. Berkery Mayer Brown LLP 1675 Broadway New York, New York 10022 Telephone: (212) 506-2500 Facsimile: (212) 262-1910 |
Richard D. Truesdell, Jr. Byron B. Rooney Davis Polk & Wardwell LLP 450 Lexington Avenue New York, New York 10017 Telephone: (212) 450-4000 Facsimile: (212) 701-5800 |
Approximate date of commencement of proposed sale to the public: As soon as practicable after the effective date of this Registration Statement.
If any of the securities being registered on this Form are to be offered on a delayed or continuous basis pursuant to Rule 415 under the Securities Act of 1933, check the following box. ¨
If this Form is filed to register additional securities for an offering pursuant to Rule 462(b) under the Securities Act, please check the following box and list the Securities Act registration statement number of the earlier effective registration statement for the same offering. ¨
If this Form is a post-effective amendment filed pursuant to Rule 462(c) under the Securities Act, check the following box and list the Securities Act registration statement number of the earlier effective registration statement for the same offering. ¨
If this Form is a post-effective amendment filed pursuant to Rule 462(d) under the Securities Act, check the following box and list the Securities Act registration statement number of the earlier effective registration statement for the same offering. ¨
Indicate by check mark whether the registrant is a large accelerated filer, an accelerated filer, a non-accelerated filer, or a smaller reporting company. See the definitions of “large accelerated filer,” “accelerated filer” and “smaller reporting company” in Rule 12b-2 of the Exchange Act. (Check one):
| Large accelerated filer ¨ |
Accelerated filer ¨ | Non-accelerated filer þ | Smaller reporting company ¨ |
CALCULATION OF REGISTRATION FEE
|
| ||||
| Title of each class of securities to be registered | Proposed maximum aggregate offering price(1)(2) |
Amount of registration fee(3) | ||
| Common Stock, $0.00001 par value per share |
$100,000,000 | $11,620.00 | ||
|
| ||||
|
| ||||
| (1) | Estimated solely for the purpose of calculating the registration fee pursuant to Rule 457(o) under the Securities Act of 1933, as amended. |
| (2) | Includes additional shares of common stock that the underwriters have the option to purchase. |
| (3) | This amount was previously paid in connection with the initial filing of this registration statement. |
The Registrant hereby amends this Registration Statement on such date or dates as may be necessary to delay its effective date until the Registrant shall file a further amendment which specifically states that this Registration Statement shall thereafter become effective in accordance with Section 8(a) of the Securities Act of 1933 or until the Registration Statement shall become effective on such date as the Commission, acting pursuant to said Section 8(a), may determine.
Table of Contents
The information in this prospectus is not complete and may be changed. We may not sell these securities until the registration statement filed with the Securities and Exchange Commission is effective. This prospectus is not an offer to sell these securities and it is not soliciting an offer to buy these securities in any jurisdiction where the offer or sale is not permitted.
Subject to completion, dated April 16, 2015
Preliminary prospectus
shares

Commercial Credit, Inc.
Common stock
$ per share
This is the initial public offering of our common stock. We are selling shares of our common stock and the selling stockholders are selling shares of our common stock. We will not receive any proceeds from the sale of shares to be offered by the selling stockholders. We currently expect the initial public offering price to be between $ and $ per share.
We have granted the underwriters an option for a period of 30 days to purchase up to additional shares of our common stock.
Prior to this offering, there has been no public market for our common stock. We have applied for listing of our common stock on the New York Stock Exchange under the symbol “CCR.”
We are an emerging growth company as that term is used in the Jumpstart Our Business Startups Act of 2012 and, as such, will be subject to certain reduced public company reporting requirements for this prospectus and future filings.
Investing in our common stock involves a high degree of risk. See “Risk factors” beginning on page 13.
Neither the Securities and Exchange Commission nor any state securities commission has approved or disapproved of these securities or passed on the adequacy or accuracy of this prospectus. Any representation to the contrary is a criminal offense.
| Per share | Total | |||||||
| Initial public offering price |
$ | $ | ||||||
| Underwriting discounts and commissions(1) |
$ | $ | ||||||
| Proceeds to us, before expenses |
$ | $ | ||||||
| Proceeds to the selling stockholders, before expenses |
$ | $ | ||||||
| (1) | We have agreed to reimburse the underwriters for certain FINRA-related expenses. See “Underwriting.” |
The underwriters expect to deliver the shares of common stock to purchasers on or about , 2015.
| J.P. Morgan | Keefe, Bruyette & Woods | |
| A Stifel Company | ||
| BMO Capital Markets | SunTrust Robinson Humphrey | Wells Fargo Securities | BB&T Capital Markets |
, 2015
Table of Contents
| ii | ||||
| ii | ||||
| ii | ||||
| 1 | ||||
| 14 | ||||
| 26 | ||||
| 28 | ||||
| 29 | ||||
| 30 | ||||
| 32 | ||||
| 34 | ||||
| Management’s discussion and analysis of financial condition and results of operations |
36 | |||
| 55 | ||||
| 61 | ||||
| 75 | ||||
| 81 | ||||
| 98 | ||||
| 101 | ||||
| 103 | ||||
| 107 | ||||
| Material U.S. federal tax considerations for non-U.S. holders of our common stock |
109 | |||
| 113 | ||||
| 121 | ||||
| 121 | ||||
| 121 | ||||
| 122 | ||||
| Index to condensed consolidated financial statements (Unaudited) |
F-1 | |||
| F-27 | ||||
We have not, the selling stockholders have not and the underwriters have not, authorized anyone to provide you with information that is additional to or different from that contained in this prospectus, any amendment or supplement to this prospectus or any free writing prospectus prepared by us or on our behalf. We, the selling stockholders and the underwriters do not take any responsibility for, and can provide no assurance as to the reliability of, any information other than the information in this prospectus, any
i
Table of Contents
amendment or supplement to this prospectus or any free writing prospectus prepared by us or on our behalf. This document may only be used where it is legal to sell these securities. You should assume that the information contained in this prospectus is accurate only as of the date of this prospectus.
No action is being taken in any jurisdiction outside the United States to permit a public offering of the common stock or possession or distribution of this prospectus, any amendment or supplement to this prospectus or any free writing prospectus in that jurisdiction. Persons who come into possession of this prospectus, any amendment or supplement to this prospectus or any free writing prospectus in jurisdictions outside the United States are required to inform themselves about and to observe any restrictions as to this offering and the distribution of the prospectus applicable to that jurisdiction.
On December 12, 2014, we engaged in a corporate reorganization described under the heading “Prospectus summary—Corporate reorganization,” pursuant to which Commercial Credit Group Inc. became a wholly-owned operating subsidiary of Commercial Credit, Inc., a newly formed holding company, which to date has not conducted any operations and has no material assets or liabilities, including contingent liabilities. Unless otherwise indicated or the context otherwise requires, references in this prospectus to “the company,” “we,” “us” and “our” refer to Commercial Credit, Inc., together with its consolidated subsidiaries, including Commercial Credit Group Inc., and references to “CCG” refer only to Commercial Credit Group Inc., our wholly-owned operating subsidiary. See “Prospectus summary—Corporate reorganization.”
Presentation of financial information
This prospectus contains the historical financial statements and other financial information of Commercial Credit Group Inc., which was recently acquired by and became a wholly-owned subsidiary of Commercial Credit, Inc. Commercial Credit, Inc.’s common shares are being offered hereby. Commercial Credit, Inc. is a newly formed holding company and has engaged to date only in activities incidental to its formation, the corporate reorganization and the initial public offering of our common shares. The consolidated financial statements of Commercial Credit, Inc. for the period ended December 31, 2014 include the financial results of Commercial Credit Group Inc., its wholly-owned subsidiary, as a result of the corporate reorganization that became effective as of December 12, 2014. For periods prior to December 12, 2014, this prospectus only includes consolidated financial statements of Commercial Credit Group Inc. and not Commercial Credit, Inc., as Commercial Credit, Inc. did not have any material assets, liabilities or operations other than nominal organizational expenses until it completed the corporate reorganization. See “Prospectus summary—Corporate reorganization.” We have made rounding adjustments to some of the figures included in this prospectus. Accordingly, numerical figures shown as totals in some tables may not be an arithmetic aggregation of the figures that preceded them.
Market and other industry data
This prospectus includes industry data, forecasts and information that we have prepared based, in part, upon data, forecasts and information obtained from independent industry publications and surveys and other information available to us. Some data is also based on our good faith estimates, which are derived from management’s knowledge of the industry and independent sources. Industry publications and surveys and forecasts generally state that the information contained therein has been obtained from sources believed to be reliable, but we have not independently verified any of the data from third-party sources nor have we ascertained the underlying economic assumptions relied upon therein. Statements as to our market position
ii
Table of Contents
are based on market data currently available to us. While we are not aware of any misstatements regarding the industry data presented herein, our estimates involve risks and uncertainties and are subject to change based on various factors, including those discussed under the heading “Risk factors” in this prospectus. Similarly, we believe our internal research is reliable, even though such research has not been verified by any independent sources.
iii
Table of Contents
This summary highlights information appearing elsewhere in this prospectus. This summary does not contain all of the information that you should consider before investing in our common stock. You should read carefully this entire prospectus, including “Risk factors,” the consolidated financial statements and notes thereto and the financial data and related notes contained herein before deciding whether to invest in shares of our common stock.
Our company
We are an independent financial services company engaged in the financing of commercial equipment. We provide secured loans and, to a lesser extent, leases to businesses that operate in the construction, fleet transportation and waste industries in the United States and Canada. Our target customers are primarily middle-market, family-owned businesses, and the equipment they finance with us is, in many cases, vital to their operations. This equipment includes mobile cranes, earth moving and paving equipment, over-the-road trucks and trailers, waste collection trucks and related equipment that are produced primarily by nationally recognized manufacturers.
Our business is relationship and service oriented. The loans and leases we originate enable our customers to acquire equipment and refinance existing obligations. We have a team of more than 50 experienced sales representatives who work directly with our customers, which we believe, given the size of their businesses, are often underserved by larger financial institutions. We complement our interaction with customers by building and maintaining relationships with equipment vendors and manufacturers and educating them about our financing parameters. However, we do not rely on marketing programs with equipment vendors or manufacturers to source new business. We believe that knowledge of our customers, their industries and the equipment they employ enables us to provide superior customer service and customized financing solutions while maintaining strong credit quality.
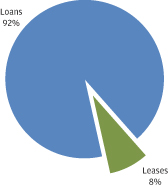
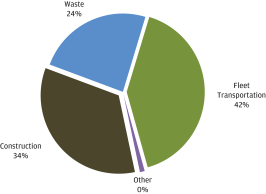
Since our inception in October 2004, our sales force has directly originated $1.9 billion of loans and leases. As of December 31, 2014, we had a finance receivables portfolio of $611.5 million, comprised of over 3,900 loans and leases to more than 1,800 customers. We originate loans and leases that typically range from $50,000 to $2.5 million per transaction. For the nine months ended December 31, 2014, our average new contract was approximately $209,000, had an original term of 46 months and had a yield of 9.8%. We retain all of our originations and hold them to maturity. The composition of our finance receivables portfolio by receivable and industry type as of December 31, 2014 can be seen in the charts below:
| Portfolio by Receivable Type, as of
|
Portfolio by Industry, as of
|
1
Table of Contents
Our finance receivables are secured by a first lien on the specific equipment financed. Additionally, our loans typically have fixed interest rates, are amortizing and include prepayment premium provisions. We also offer lease financing to our customers. As of December 31, 2014, there were $8.9 million of lease residuals retained on our balance sheet representing 1.5% of our finance receivables.
We concentrate on financing equipment that has an economic life longer than the term of the financing provided by us, is unlikely to be subject to rapid technological obsolescence, has applications in a variety of different industries, has a relatively broad resale market and is easily movable. We believe these characteristics of the underlying equipment, coupled with the expertise of our management team in underwriting, structuring and servicing of our finance receivables, have historically enabled us to minimize credit losses. Our annualized net charge-offs as a percentage of average finance receivables were 0.22% for the nine months ended December 31, 2014. For the fiscal year ended March 31, 2014, net charge-offs as a percentage of average finance receivables were 0.31%, and peaked at 0.65% for the fiscal year ended March 31, 2010.
We fund our portfolio through a combination of committed secured bank credit facilities, term and revolving asset-backed securitizations, unsecured subordinated debt and equity. Our funding providers are nationally recognized financial institutions. Our revolving credit facilities are on bilateral terms with staggered debt maturities. As of December 31, 2014, the ratio of our total senior outstanding debt to the sum of our equity plus our outstanding subordinated debt (our “leverage”) was 5.8x or x on a pro forma basis after giving effect to the intended application of net proceeds from this offering. Additionally, our financing strategy seeks to match the duration and interest rate characteristics of our portfolio by utilizing fixed rate term debt and interest rate hedges. As of December 31, 2014, 84% of our debt was either fixed rate debt or floating rate debt that had been swapped to a fixed rate using interest rate swaps.
Our primary source of revenue is finance income earned on our finance receivables portfolio. Finance income includes interest, prepayment premiums and other fees less amortization of capitalized origination costs and was $41.1 million for the nine months ended December 31, 2014. Our portfolio yield is calculated as finance income divided by average finance receivables for a given period, stated as a percentage. For the nine months ended December 31, 2014, our annualized portfolio yield was 9.9%. Our net interest margin is the difference between the finance income and our total cost of funds. For the nine months ended December 31, 2014, our net interest margin was 7.0%. We generate profits to the extent that our net interest margin exceeds our provision for credit losses, salaries and operating expenses. For the nine months ended December 31, 2014, we generated net income of $9.0 million and had an annualized return on average shareholders’ equity of 21.1%. Over the last five fiscal years, finance receivables and net income have grown at a compound annual rate of 18.3% and 48.4%, respectively.
2
Table of Contents
5-Year Historical Growth in Finance Receivables
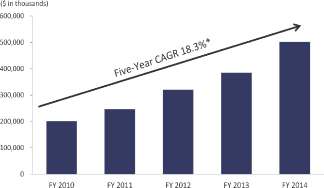
| * | Five-Year CAGR uses the period beginning with the fiscal year ended March 31, 2009. |
5-Year Historical Growth in Net Income

| * | Five-Year CAGR uses the period beginning with the fiscal year ended March 31, 2009. |
Our industry
According to the Equipment Leasing and Finance Association (“ELFA”), U.S. equipment finance loans and leases are projected to exceed $900 billion in 2014. According to the 2014 Monitor 100 (“Monitor”), the top 100 equipment finance entities had $569 billion in aggregate net assets as of December 31, 2013 and together originated $231 billion in loans and leases in calendar year 2013. According to ELFA, new business volume across the equipment finance industry grew 9.3% and 16.4% in 2013 and 2012, respectively. Independent finance companies saw volume grow in 2013 at an even faster rate of 17.7%.
We believe that growth in the equipment finance industry is highly correlated to overall economic growth and is driven by investment in new equipment, together with customers’ propensity to utilize financing for existing and new equipment. Since 2010, Gross Private Domestic Investment as a percentage of U.S. GDP has increased by 23%, which we believe indicates a strengthening business appetite for equipment. We believe growth will continue as the equipment replacement cycle drives additional capital expenditures. In calendar year 2013, total public and private sector equipment and software investment grew by 3.2% and equipment finance volume grew by more than 8%.
3
Table of Contents
Industry participants include national and regional banking institutions, independent finance companies, manufacturer-owned finance companies, as well as smaller finance companies. According to Monitor, independent finance companies have represented as much as 10% of the industry’s net assets in 2007 compared to approximately 5% as of December 31, 2013.
Our business and growth strategies
Our business objectives are to grow our portfolio of finance receivables while seeking to maximize long-term earnings growth and generate attractive risk-adjusted returns through economic cycles. We believe the following strategies will help us meet these objectives:
Continue to focus on serving middle-market companies. Historically, small-and medium-sized businesses have been constrained in their ability to access traditional sources of financing. Our focus on middle-market businesses provides us the opportunity to meet what we believe is significant unfulfilled demand for financing among our target customers.
Maintain and grow our existing customer relationships. Our existing customers have historically been and we expect will continue to be a source of new business. Our service-oriented culture, strong customer relationships and focus on being a reliable financing partner have historically resulted in high levels of repeat business. For the nine months ended December 31, 2014, 68% of our originations were generated from existing customers. We believe our direct sales and customer contact model enhances our customer relationships, enabling us to offer customized financing solutions to meet customers’ individual needs. We will seek to continue to build and enhance customer loyalty, allowing us to increase business volume through our existing customer base.
Further penetrate existing markets. We have customers in all 50 states, as well as in Canada where we commenced operations in April 2014. However, we do not currently maintain marketing employees for each of our targeted industries in every state and province. We believe we can generate additional new business by increasing the number of dedicated sales and marketing employees within our current geographic footprint. By strengthening our industry coverage and further penetrating our existing markets, we expect that we can continue to drive significant growth.
Expand our geographic footprint. We plan to place dedicated sales representatives into additional U.S. states and Canadian provinces and expect that additional representatives in such regions will provide substantial incremental origination and portfolio growth. We have increased and intend to increase the number of representatives in key geographic regions that we believe are underserved. We have a proven track record of successfully entering new markets and hiring sales representatives to cover new territories.
Opportunistically pursue portfolio and business acquisitions. We believe that we possess the capacity to manage a larger finance receivables portfolio without substantially increasing our infrastructure costs. This is due to the scalable and efficient nature of our operating platform and the breadth and experience of our management team. As a result, we believe that we are also well positioned to opportunistically pursue portfolio and business acquisitions to complement our organic growth strategy. Currently, we do not have any agreements, arrangements or understandings to make any acquisitions.
4
Table of Contents
Our competitive strengths
We believe that the following competitive strengths enhance our ability to execute our business and growth strategies, creating long-term value for our shareholders:
Relationship-driven lending model.
We originate finance receivables through our team of more than 50 experienced sales representatives, serving over 1,800 unique customers as of December 31, 2014. We focus on direct relationships with end-users, a commitment to superior customer service, maintaining local presence and frequent in-person contact. We believe these attributes promote customer loyalty and present opportunities for repeat business. For the nine months ended December 31, 2014, 68% of our originations were generated from existing customers.
Rigorous risk management culture and collateral expertise leading to strong credit performance.
We maintain a conservative credit culture with strict underwriting standards. We evaluate each loan or lease based on the obligor’s cash flow, ability to pay, character and the collateral value of the equipment. Our underwriting policies and procedures were developed by our senior management team which possesses an average of over 25 years of experience in equipment finance. Substantially all of the loans and leases in our portfolio are subject to cross-collateralization and cross-default provisions. The useful life of the equipment we finance is typically greater than the amortization period of our loans and leases, which minimizes collateral risk and reduces losses. Our annualized net charge-offs as a percentage of average finance receivables were 0.22% for the nine months ended December 31, 2014. For the fiscal year ended March 31, 2014, net charge-offs as a percentage of average finance receivables were 0.31%, and peaked at 0.65% for the fiscal year ended March 31, 2010. Receivables from our small and medium-sized, privately owned customers may entail heightened risks given our customers’ sensitivity to the effects of, among other factors, poor regional and general economic conditions, rising fuel and financing costs, loss of key personnel and increased competition, any of which could negatively effect our customers’ operations and their ability to meet their obligations.
Diversified and high quality portfolio.
We concentrate on financing equipment that has an economic life longer than the term of the financing provided. Our finance receivables are secured by a first lien on the specific equipment financed. We strive to maintain a diversified portfolio across a number of categories, including customer, industry, equipment type and geography. For example, our largest customer represented 0.82% of our portfolio and our top 10 customers represented 6.5% of our portfolio as of December 31, 2014. Our portfolio is diversified across the fleet transportation (42%), construction (34%) and waste (24%) industries, as of December 31, 2014. We are also geographically diversified with our largest state concentrations in Texas, North Carolina and California constituting 13.0%, 9.7% and 8.8% of our portfolio, respectively, as of December 31, 2014.
Proven organic growth and consistently strong financial performance.
We believe we are well positioned to attract new customers and retain existing customers. Over the five fiscal years ended March 31, 2014, our originations and finance receivables grew at compound annual growth rates of 20.5% and 18.3%, respectively. Our net income has increased in each of our ten full years of operations, including during 2008 and 2009, and our ability to originate new finance receivables and increase our portfolio has helped us continue to grow net finance income and net income. For the five fiscal years ended March 31, 2014, we achieved compound annual growth rates for finance income and net income of 16.1% and 48.4%, respectively. Additionally, for the fiscal year ended March 31, 2014, our net income was $9.3 million, representing a return on average assets of 2.0% and a return on average shareholders’ equity of 19.3%. We
5
Table of Contents
believe that our portfolio size, track record and reputation with our customers, funding providers and employees give us operational scale, diversified and reliable access to funding and reputational advantage over our competitors as we continue to expand our business and attract new talent.
Experienced management team with significant ownership stake.
Members of our management team have worked together for almost two decades dating back to their time together at Financial Federal Corporation, a publicly-traded, independent equipment finance company prior to its acquisition in 2009 by People’s United Financial, Inc., whose portfolio reached a size of $2.0 billion at its peak. Our senior management team averages over 25 years of experience in the equipment finance industry, are major shareholders of the company and will beneficially own % of our common shares after this offering (assuming no exercise of the underwriters’ option to purchase additional shares). We believe this ownership stake aligns their interest with that of our shareholders.
Recent developments
Preliminary results for the year ended March 31, 2015
We are currently in the process of preparing our consolidated financial statements for the year ended March 31, 2015. The following are preliminary estimates of the financial information listed below as of and for the year ended March 31, 2015.
| • | Originations. We expect originations, the aggregate dollar amount of loans and leases booked during a given period, of between approximately $443.0 million to $457.0 million for the year ended March 31, 2015, as compared to $357.3 million for the year ended March 31, 2014. The increase was due to a higher rate of contract originations in this period as a result of the addition of sales and marketing staff in new geographic regions and influenced by a slightly better level of economic activity for our customers. |
| • | Finance receivables. We expect that our finance receivables outstanding at March 31, 2015 will be approximately $641.0 million to $661.0 million, as compared to $501.0 million as of March 31, 2014. The increase was due to the growth in origination volume described above. |
| • | Net income. We expect net income of between approximately $12.0 million to $13.0 million for the year ended March 31, 2015, as compared to $9.3 million for the year ended March 31, 2014. The increase was principally the result of the growth in finance receivables over this period. |
| • | Return on average assets. We expect that our return on average assets for the year ended March 31, 2015 will be between approximately 2.0% and 2.1%, as compared to 2.0% for the year ended March 31, 2014. |
| • | Leverage. We expect our leverage, the ratio of our total senior outstanding debt to the sum of our equity plus our outstanding subordinated debt, will be between approximately 6.0x to 6.1x, as compared to 5.2x as of March 31, 2014. |
| • | Return on average stockholders’ equity. We expect that our return on average stockholders’ equity for the year ended March 31, 2015 will be between approximately 20.6% and 22.2%, as compared to 19.3% for the year ended March 31, 2014. |
The estimates of our consolidated financial information as of and for the year ended March 31, 2015 were prepared by management as described above. These estimates are preliminary and subject to completion of our
6
Table of Contents
financial closing procedures. Our independent registered public accounting firm has not audited, reviewed, compiled or performed any procedures, and does not express an opinion or any other form of assurance, with respect to this preliminary financial information. This summary is not a comprehensive statement of our financial results for this period, and our actual results may differ materially from these estimates due to the completion of our financial closing procedures, final adjustments and other developments, including subsequent events, if any, that may arise between now and the time that the consolidated financial statements for this period are issued. These estimates should not be viewed as a substitute for full annual financial statements prepared in accordance with GAAP. In addition, these estimates for the year ended March 31, 2015 are not necessarily indicative of the results to be achieved for any future period. This summary is qualified by, and should be read together with, “Risk factors,” “Cautionary note regarding forward-looking statements,” “Management’s discussion and analysis of financial condition and results of operations,” the consolidated financial statements and notes thereto and the financial data and related notes contained in this prospectus.
Principal stockholders
The majority of our common stock is held collectively by Lovell Minnick Equity Partners III LP and Lovell Minnick Equity Partners III-A LP, which are investment funds managed by Lovell Minnick Partners LLC. We refer to these stockholders, collectively, as our “Principal Stockholders” or “Lovell Minnick.” Lovell Minnick currently holds 75% of our common shares and will beneficially own % of our common shares after this offering (assuming no exercise of the underwriters’ option to purchase additional shares).
Lovell Minnick Partners is an independent private equity firm, with offices in the Philadelphia and Los Angeles areas, that has raised over $1.1 billion in committed capital since its founding in 1999. The firm specializes in financial services and related business services opportunities and has provided equity capital for management buyouts, succession and ownership transitions, growth investments and recapitalizations for over 30 middle-market companies. See “Risk factors—Following this offering, we will most likely no longer be a controlled company; however, Lovell Minnick and its affiliated funds will continue to own a significant portion of our common stock, and their interests may differ from or conflict with the interests of our other stockholders.”
Risks affecting our business
Participating in this offering involves substantial risk. Our ability to execute our strategy is also subject to certain risks. The risks described under the heading “Risk factors” included elsewhere in this prospectus may cause us not to realize the full benefits of our strengths or may cause us to be unable to successfully execute all or part of our strategy. Some of the most significant challenges and risks include the following:
| • | Macroeconomic conditions could have a material adverse effect on our business, results of operations, financial condition and stock price; |
| • | Changes in market interest rates could have a material adverse effect on our net earnings, funding and liquidity; |
| • | We borrow most of the money we lend to our customers and any constraints on the amount of funds that are available for us to borrow at any given time could have a material adverse effect on our business, results of operations and financial condition; |
| • | Lending to small, privately owned companies exposes us to increased credit risk; |
| • | Our allowance for credit losses may not be adequate to cover actual losses, which may adversely affect our financial condition and results of operations; |
7
Table of Contents
| • | A reduction in the credit ratings of our asset-backed securities could materially increase the cost of our funding from, and restrict our access to, the capital markets; |
| • | Adverse developments in certain industries may have an adverse effect on our business, financial condition and results of operations; and |
| • | Lovell Minnick and its affiliated funds will continue to own a significant portion of our common stock, and their interests may differ from or conflict with the interests of our other stockholders. |
Before you invest in our common stock, you should carefully consider all of the information in this prospectus, including the matters set forth under the heading “Risk factors.”
Company information
We were incorporated in Delaware in 2014 and our wholly-owned, operating subsidiary Commercial Credit Group Inc. was incorporated in Delaware in 2004. Our principal executive offices are located at 227 West Trade Street, Suite 1450, Charlotte, North Carolina 28202 and our telephone number at that address is (704) 944-2770. Our internet address is www.commercialcreditinc.com. The information contained in or accessible from our website is not incorporated by reference into this prospectus, and such information should not be considered to be part of this prospectus.
Corporate reorganization
Commercial Credit, Inc. (“CCI”) is a Delaware corporation that was formed on July 31, 2014 by the board of directors of CCG, a Delaware corporation, for the purpose of creating a holding company corporate structure to optimize our corporate structure as the company’s operations continue to expand. The corporate reorganization was completed as of December 12, 2014 pursuant to which CCI filed an Amended and Restated Certificate of Incorporation (the “Amended Charter”) with the Secretary of State of the State of Delaware, and each stockholder of CCG contributed all of its shares of CCG’s capital stock to CCI in exchange for an equal number of newly issued shares of the corresponding class or series of capital stock of CCI (the “Share Exchange”). Upon the consummation of the Share Exchange, CCG became a direct, wholly owned subsidiary of CCI. Investors in this offering will only acquire, and this prospectus only describes the offering of, common shares of CCI.
We refer to the Share Exchange and the other transactions contemplated thereby as our “corporate reorganization.” The corporate reorganization occurred in several steps that are described below, all of which were completed prior to the consummation of this offering.
Exchange of CCG shares for CCI shares
Prior to the date of the Share Exchange, the capital stock of CCG was divided into Common Stock, par value $0.00001 per share, Series 1 Preferred Stock, par value $0.00001, and Series 2 Preferred Stock, par value $0.00001. On December 12, 2014, CCI filed the Amended Charter with the Secretary of State of the State of Delaware that authorized CCI to issue shares of Common Stock, par value $0.00001 per share, Series 1 Preferred Stock, par value $0.00001, and/or Series 2 Preferred Stock, par value $0.00001. Immediately following the filing of the Amended Charter, each stockholder of CCG entered into a Contribution Agreement, dated as of December 12, 2014, pursuant to which such stockholder contributed its shares of CCG to CCI in exchange for the issuance by CCI to such stockholder of the same number of shares of Common Stock, Series 1 Preferred Stock, and/or Series 2 Preferred Stock, as applicable, of CCI. As a result thereof, CCI became the sole shareholder of CCG.
8
Table of Contents
Concurrently with the Share Exchange, each new stockholder of CCI entered into a Stockholders Agreement and an Investor Rights Agreement with CCI that set forth certain governance and stockholder arrangements that are substantially similar to those that were in effect with respect to CCG prior to the Share Exchange. The Stockholder Agreement and Investor Rights Agreement are further described under the heading “Certain relationships and related party transactions.” Upon the completion of an “Initial Public Offering,” as such term is defined in the Stockholders Agreement to mean the first underwritten registered public offering of the company’s common stock, the Stockholders Agreement will terminate in accordance with its terms. We believe that this offering will satisfy the requirements of an Initial Public Offering as defined in the Stockholders Agreement. In addition, the bylaws of CCI, which were adopted prior to the Share Exchange, replicate the bylaws of CCG that were in effect prior to the Share Exchange.
By virtue of the execution of the Contribution Agreement, each share of Common Stock of CCG that was previously granted pursuant to the Commercial Credit Group Inc. 2012 Equity Incentive Plan (the “2012 Incentive Plan”) as a restricted share was exchanged for one share of Common Stock of CCI. In addition, in connection with corporate reorganization, CCG assigned to CCI, and CCI assumed from CCG, all of CCG’s rights and obligations under the 2012 Incentive Plan and under all restricted share agreements between CCG and each stockholder of CCG party thereto in respect of awards of restricted shares of Common Stock of CCG granted under the 2012 Incentive Plan. As a result thereof, all such restricted share agreements now apply to shares of Common Stock of CCI in the same manner and subject to the same terms and conditions that such restricted share agreements previously applied to shares of Common Stock of CCG prior to the Share Exchange.
Filing of amended charter of CCG
As the final step of our corporate reorganization, CCG filed an Eighth Amended and Restated Certificate of Incorporation with the Secretary of State of the State of Delaware on January 5, 2015. The filing of the Eighth Amended and Restated Certificate of Incorporation of CCG provided for the retirement of the previously authorized Series 1 Preferred Shares and Series 2 Preferred Shares of CCG and implemented a reverse stock split of the previously authorized shares of Common Stock of CCG.
Implications of being an emerging growth company
As a company with less than $1.0 billion in revenue during our last fiscal year, we qualify as an “emerging growth company” as defined in the Jumpstart Our Business Startups Act of 2012, or the JOBS Act. As an emerging growth company, we may take advantage of specified reduced reporting requirements and are relieved from certain other significant requirements that are otherwise generally applicable to public companies. We may choose to take advantage of some or all of these provisions for as long as we remain an emerging growth company. We will remain an emerging growth company until the earlier of (1) the last day of the fiscal year (a) following the fifth anniversary of the completion of this offering, (b) in which we have total annual gross revenue of at least $1.0 billion, or (c) in which we are deemed to be a large accelerated filer, which means the market value of our common stock that is held by non-affiliates exceeds $700 million as of the prior September 30th, or (2) the date on which we have issued more than $1.0 billion in non-convertible debt securities during the prior three-year period. See “Risk factors—We are an ‘emerging growth company,’ and any decision on our part to comply only with certain reduced reporting and disclosure requirements applicable to emerging growth companies could make our common stock less attractive to investors.”
The JOBS Act permits an “emerging growth company” like us to take advantage of an extended transition period to comply with new or revised accounting standards applicable to public companies. We are choosing to “opt out” of this provision and, as a result, we will comply with new or revised accounting standards as required when they are adopted. Our decision to opt out of the extended transition period is irrevocable.
9
Table of Contents
The offering
| Common stock offered by us |
shares. |
| Common stock offered by the selling stockholders |
shares. |
| Common stock to be outstanding immediately after the completion of this offering |
shares (assuming no exercise of the underwriters’ option to purchase additional shares). |
| Underwriters’ option to purchase additional shares |
We, along with certain of the selling stockholders, have granted the underwriters a 30-day option to purchase up to an additional shares. If this option is exercised in full, we will issue and sell shares and the selling stockholders will sell shares. |
| Use of proceeds |
We expect to receive net proceeds, after deducting estimated offering expenses and underwriting discounts and commissions payable by us, of approximately $ million (or $ million if the underwriters exercise their option to purchase additional shares in full), based on an assumed offering price of $ per share (the midpoint of the offering price range set forth on the cover page of this prospectus). We intend to use the net proceeds from this offering to retire the outstanding aggregate principal amount of our senior subordinated notes in the amount of $33 million, plus any interest and fees, and for working capital and general corporate purposes. We may also pay down our credit facilities. We will not receive any proceeds from the sale of shares of common stock by the selling stockholders. See “Use of proceeds” and “Principal and selling stockholders.” |
| Dividend policy |
We do not currently pay cash dividends on our common stock and do not anticipate paying any dividends on our common stock in the foreseeable future. Any future determinations relating to our dividend policy will be made at the discretion of our board of directors and will depend on various factors. See “Dividend policy.” |
| Risk factors |
You should read carefully this prospectus, including “Risk factors” for a discussion of factors that you should consider before deciding to invest in shares of our common stock. |
| Proposed trading symbol |
“CCR.” |
10
Table of Contents
Unless otherwise indicated, all information in this prospectus relating to the number of shares of common stock to be outstanding immediately after the completion of this offering:
| • | assumes the conversion, which we expect to take place immediately prior to the completion of this offering, of all outstanding shares of all series of our preferred stock into an aggregate of shares of common stock; |
| • | excludes shares of our common stock reserved as of , 2015 for future grants under our incentive plan, as described under the heading “Executive and director compensation—2015 Stock incentive plan,” which we intend to adopt in connection with this offering; and |
| • | assumes no exercise by the underwriters of their option to purchase up to an additional shares. |
11
Table of Contents
Summary consolidated financial and other data
The following summary of the consolidated financial data of Commercial Credit Group Inc. should be read in conjunction with, and is qualified by reference to, the consolidated financial statements and notes thereto appearing elsewhere in this prospectus, as well as “Selected consolidated financial and other data,” “Management’s discussion and analysis of financial condition and results of operations” and the other financial information included elsewhere in this prospectus. The consolidated statement of income data for the fiscal years ended March 31, 2012, 2013 and 2014 and the summary consolidated balance sheet data at March 31, 2013 and 2014 are derived from, and are qualified by reference to, our audited consolidated financial statements included elsewhere in this prospectus and should be read in conjunction with those consolidated financial statements and notes thereto. The summary consolidated balance sheet data at March 31, 2012 are derived from our consolidated financial statements not included in this prospectus. The consolidated statement of income data for the nine months ended December 31, 2013 and 2014 and the summary consolidated balance sheet data at December 31, 2013 and 2014 are derived from, and are qualified by reference to, our unaudited condensed consolidated financial statements included elsewhere in this prospectus and, in our opinion, reflect all adjustments, consisting of normal accruals, necessary for a fair presentation of the data for those periods. Our results of operations for the nine months ended December 31, 2014 may not be indicative of results that we may achieve for the full fiscal year. See “Index to consolidated financial statements.”
Commercial Credit, Inc. is a newly formed holding company and had only engaged in operations and activities incidental to its formation, the corporate reorganization that became effective as of December 12, 2014 and the initial public offering of our common shares. The consolidated financial statements of Commercial Credit, Inc. for the period ended December 31, 2014 include the financial results of Commercial Credit Group Inc., its wholly-owned subsidiary, as a result of the corporate reorganization. For periods prior to December 12, 2014, this prospectus only includes consolidated financial statements of Commercial Credit Group Inc. and not Commercial Credit, Inc., as Commercial Credit, Inc. did not have any material assets, liabilities or operations other than nominal organizational expenses until it completed the corporate reorganization. Our historical consolidated financial data may not be indicative of future results.
| Year
ended March 31, |
Nine months ended December 31, |
|||||||||||||||||||
| 2012 | 2013 | 2014 | 2013 | 2014 | ||||||||||||||||
| (in thousands) | ||||||||||||||||||||
| Statement of Income Data: |
||||||||||||||||||||
| Finance income |
$ | 33,206 | $ | 40,226 | $ | 45,806 | $ | 33,804 | $ | 41,109 | ||||||||||
| Interest expense |
15,353 | 16,546 | 15,586 | 11,622 | 11,850 | |||||||||||||||
|
|
|
|||||||||||||||||||
| Net finance income before provision for credit losses on finance receivables |
17,852 | 23,680 | 30,220 | 22,182 | 29,259 | |||||||||||||||
| Provision for credit losses on finance receivables |
1,975 | 1,825 | 2,348 | 2,098 | 1,700 | |||||||||||||||
|
|
|
|||||||||||||||||||
| Net finance income |
15,877 | 21,855 | 27,872 | 20,084 | 27,559 | |||||||||||||||
| Compensation and benefits |
4,348 | 6,724 | 8,009 | 5,389 | 7,608 | |||||||||||||||
| Other operating expenses |
3,543 | 3,893 | 4,259 | 3,846 | 5,110 | |||||||||||||||
|
|
|
|||||||||||||||||||
| Total operating expenses |
7,891 | 10,617 | 12,268 | 9,235 | 12,718 | |||||||||||||||
| Income before income taxes |
7,986 | 11,238 | 15,605 | 10,850 | 14,841 | |||||||||||||||
| Provision for income taxes |
3,124 | 4,380 | 6,255 | 4,291 | 5,812 | |||||||||||||||
|
|
|
|||||||||||||||||||
| Net income |
$ | 4,861 | $ | 6,857 | $ | 9,349 | $ | 6,559 | $ | 9,029 | ||||||||||
|
|
||||||||||||||||||||
12
Table of Contents
| Year ended March 31, | Nine months ended December 31, |
|||||||||||||||||||
| 2012 | 2013 | 2014 | 2013 | 2014 | ||||||||||||||||
| Earnings per Share Data: |
||||||||||||||||||||
| Earnings per share, basic and diluted(1) |
$ | 1.28 | $(86.74 | ) | $ | 11.93 | $ | — | $ | 13.25 | ||||||||||
| Pro forma earnings per share, basic and diluted(2) |
1.27 | (5.64 | ) | 11.86 | 7.92 | 13.27 | ||||||||||||||
| Weighted average shares used in computing earnings per share, basic and diluted (in thousands) |
245 | 263 | — | — | 2 | |||||||||||||||
| Shares used in computing pro forma earnings per share, basic and diluted(2) (in thousands) |
3,826 | 4,044 | 682 | 669 | 681 | |||||||||||||||
|
|
||||||||||||||||||||
| (1) | On May 10, 2012, pursuant to the Recapitalization, all then-outstanding shares of common stock were converted into Series 1 preferred stock. To show the impact of the Recapitalization on earnings per share for the year, the Company calculated earnings per share separately for the 40-day period prior to Recapitalization, beginning April 1, 2012 to May 10, 2012 (“pre-Recapitalization”) and the 325-day period after Recapitalization beginning May 11, 2012 to March 31, 2013 (“post-Recapitalization). The $(86.74) cited in this table represents the earnings per common share for the pre-Recapitalization period. Although no shares of common stock were outstanding during the post-Recapitalization period ended March 31, 2013, or during the nine month period ended December 31, 2013, the Company had outstanding participating securities in the form of convertible preferred stock and unvested restricted stock in both periods. For additional information regarding the calculation of earnings per share, see Note 11 to the annual consolidated financial statements for the three year period ended March 31, 2014 and Note 10 to the interim unaudited condensed consolidated financial statements for the nine month periods ended December 31, 2013, and 2014. |
| (2) | Pro forma basic and diluted earnings per share have been calculated assuming the conversion of all shares of our preferred stock and unvested restricted stock awards outstanding at each of the relevant period ends into shares of common stock as of the beginning of each of the applicable periods. |
| At March 31, | At December 31, | |||||||||||||||||||
| 2012 | 2013 | 2014 | 2013 | 2014 | ||||||||||||||||
| (in thousands) | ||||||||||||||||||||
| Summary Balance Sheet Data: |
||||||||||||||||||||
| Finance receivables, net |
$ | 315,997 | $ | 378,512 | $ | 494,683 | $ | 464,661 | $ | 604,329 | ||||||||||
| Total assets |
345,453 | 404,959 | 541,996 | 504,241 | 649,496 | |||||||||||||||
| Total debt |
300,257 | 350,700 | 479,422 | 443,696 | 577,332 | |||||||||||||||
| Total shareholders’ equity |
36,239 | 44,388 | 52,591 | 49,788 | 61,514 | |||||||||||||||
|
|
||||||||||||||||||||
| Year ended March 31, | Nine months ended December 31, |
|||||||||||||||||||
| 2012 | 2013 | 2014 | 2013 | 2014 | ||||||||||||||||
| ($ in thousands, except for percentages and ratios) | ||||||||||||||||||||
| Operating Data: |
||||||||||||||||||||
|
Originations(1) |
$ | 228,603 | $ | 251,683 | $ | 357,313 | $ | 255,757 | $ | 332,821 | ||||||||||
| Portfolio yield |
11.7% | 11.4% | 10.4% | 10.5% | 9.9% | |||||||||||||||
| Net interest margin |
6.3% | 6.7% | 6.8% | 6.9% | 7.0% | |||||||||||||||
| Net charge-off ratio (annualized)(2) |
0.44% | 0.20% | 0.31% | 0.29% | 0.22% | |||||||||||||||
| Return on average assets |
1.6% | 1.8% | 2.0% | 1.9% | 2.0% | |||||||||||||||
|
Leverage(3) |
4.8x | 4.1x | 5.2x | 5.0x | 5.8x | |||||||||||||||
| Return on average stockholders’ equity |
14.4% | 17.0% | 19.3% | 18.6% | 21.1% | |||||||||||||||
|
|
||||||||||||||||||||
| (1) | Originations are the aggregate dollar amount of loans and leases booked during a given period. |
| (2) | Our net charge-off ratio is the ratio of net charge-offs to the average finance receivables for a given period, stated as a percentage. Net charge-offs is the amount of the reduction in the allowance for credit losses when a finance receivable or a portion thereof is charged off under GAAP. |
| (3) | Our leverage is the ratio of our total senior outstanding debt to the sum of our equity plus our outstanding subordinated debt. The amount payable on our subordinated notes was $22.0 million in the year ended March 31, 2012 and $33.0 million in each of the years ended March 31, 2013 and 2014 and the nine month periods ended December 31, 2013 and 2014. |
13
Table of Contents
An investment in our common stock involves a high degree of risk. You should carefully consider the following risks and the other information contained in this prospectus, including our consolidated financial statements and the related notes, before investing in our common stock. If any of the following risks actually occurs, our business, financial condition, results of operations, cash flows and prospects would likely suffer, possibly materially. In addition, the trading price of our common stock could decline due to any of these risks occurring, and you may lose all or part of your investment in our common stock.
Risks related to our business
Macroeconomic conditions could have a material adverse effect on our business, results of operations, financial condition and stock price.
Key macroeconomic conditions historically have affected our business, results of operations and financial condition and are likely to affect them in the future. Consumer confidence, energy prices, unemployment, infrastructure spending by state and local governments and residential and non-residential construction activity are among the factors that often impact the borrowing behavior of our customers. Poor economic conditions reduce the demand for industrial and commercial equipment and our customers’ ability to repay their obligations to us which, in each case, reduces our finance income and increases our credit losses.
While certain economic conditions in the United States have shown signs of improvement following the recent global economic crisis, economic growth has been slow and uneven as consumers continue to face domestic concerns, as well as economic and political conditions in the global markets. A prolonged period of slow economic growth or a significant deterioration in economic conditions would likely affect our customers’ activity levels and the ability and willingness of customers to finance new purchases or leases or to pay amounts already owed to us, and could have a material adverse effect on our business, results of operations and financial condition.
A deterioration in macroeconomic conditions could also adversely affect our ability to fund in the wholesale market at attractive rates which could increase our cost of capital. For example, in 2009, the economic crisis had a deep impact on the wholesale funding market which significantly affected the terms of our funding in that market, particularly in the aftermath of the bankruptcy of Lehman Brothers Holdings, Inc. A reduction in our financing opportunities or market developments that make wholesale funding unprofitable could negatively impact our business, financial condition and results of operations.
Macroeconomic conditions may also cause our net earnings to fluctuate and diverge from expectations of securities analysts and investors, who may have differing assumptions regarding the impact of these conditions on our business, and this may adversely impact the trading price of our common stock.
Changes in market interest rates could have a material adverse effect on our net earnings, funding and liquidity.
Our profitability depends in large part upon the extent to which our average yield on finance receivables exceeds our average cost of borrowed funds (“net interest spread”). Because our borrowed funds mature or reprice at a faster rate than our finance receivables, a rapid and sustained rise in market interest rates, increasing our total cost of funds, could materially reduce our net interest spread and, therefore, reduce or eliminate our profitability. In addition, increases in market interest rates could materially reduce the volume of originations of new financings and leases because current or prospective customers may refrain from borrowing at higher rates of interest.
14
Table of Contents
We borrow most of the money we lend to our customers and any constraints on the amount of funds that are available for us to borrow at any given time could have a material adverse effect on our business, results of operations and financial condition.
We borrow most of the money we lend to our customers and, as a result, liquidity, or the amount of funds that are available for us to borrow at any given time, is very important to our business. Our inability to access funds, or to access funds on commercially attractive terms, to support our financing activities could have an adverse effect on our business, results of operations and financial condition.
Continuing to meet our cash requirements over the long-term could require substantial liquidity and access to sources of funds, including capital and credit markets. Such markets may not continue to represent a reliable source of financing, particularly if global economic conditions were to deteriorate. In the face of deteriorating global economic conditions, we could face materially higher financing costs, become unable to access adequate funding to operate and grow our business and/or meet our debt service obligations as they mature, and could be required to draw upon contractually committed lending agreements and/or to seek other funding sources. However, under distressed market conditions, such liquidity or funding sources may not be sufficient for our needs or available at all, which would restrict or prohibit our ability to generate new finance receivables and negatively affect our income, results of operations and financial condition.
Lending to small and medium sized, privately owned companies exposes us to increased credit risk.
Inherent in our business is the credit risk associated with our customers. The creditworthiness of each customer and the rate of delinquencies, repossessions and net losses on customer obligations are directly impacted by several factors, including relevant industry and economic conditions, the availability of capital, the experience and expertise of the customer’s management, commodity prices and the sustained value of the underlying collateral. We provide financings primarily to small and medium-sized, privately owned businesses. As compared to larger, publicly owned firms, these companies generally have more limited access to capital and higher funding costs, may be in a weaker financial position and may need more capital to expand or compete. Accordingly, receivables from the type of customers we typically serve may entail heightened risks. These customers are more sensitive to the effects of, among other factors, poor regional and general economic conditions, rising fuel and financing costs, loss of key personnel and increased competition. The effects of any of these factors on our customers’ operations and the ability of our customers to meet their obligations could negatively impact our business, financial condition and results of operations. As of December 31, 2014, no single customer represented more than 0.8% of our finance receivables.
Our allowance for credit losses may not be adequate to cover actual losses, which may adversely affect our financial condition and results of operations.
We maintain an allowance for credit losses to cover management’s estimate of expected future losses as of the balance sheet date resulting from the non-performance of our customers under their contractual obligations. The determination of the allowance involves significant assumptions, complex analysis, and management judgment and requires us to make significant estimates of current credit risks using existing qualitative and quantitative information, any or all of which may change. As a result, our allowance for credit losses may not be adequate to cover our actual losses. In addition, changes in economic conditions affecting our customers, accounting rules and related guidance and other factors, both within and outside of our control, may require changes to the allowance for credit losses. A material increase in our allowance for credit losses or a material difference between our allowance for credit losses and our actual losses may adversely affect our financial condition and results of operations.
15
Table of Contents
A reduction in the credit ratings of our asset-backed securities could materially increase the cost of our funding from, and restrict our access to, the capital markets.
Certain of the asset-backed securities issued by our securitization trusts are rated by Standard & Poor’s Ratings Services (“S&P”) and DBRS, Inc. (“DBRS”). As of December 31, 2014, the company had two term asset securitization borrowings outstanding. Each transaction had three notes outstanding at inception. The Class A-1 Notes were rated A1+(sf) and R-1(h)(sf), the Class A-2 Notes were rated AAA(sf) and AAA(sf) and the Class B Notes were rated A(sf) and A(sf), in each case by S&P and DBRS, respectively. There have been no subsequent changes to these ratings. We have not had any of our current or prior asset-backed securities downgraded by any rating agency, although it is possible that a downgrade of one or more of our asset-backed securities could occur in the future. The ratings of our asset-backed securities are, and will continue to be, based on a number of factors, including the quality of the underlying loans and the credit enhancement structure with respect to each series of asset-backed securities, as well as general performance of the underlying loans. These ratings also reflect the various methodologies and assumptions used by the rating agencies, which are subject to change and could adversely affect our ratings. The rating agencies regularly evaluate the credit ratings of our asset-backed securities. We may be unable to maintain our asset-backed securities’ credit ratings or such credit ratings may be lowered or withdrawn in the future. A downgrade in our asset-backed securities’ credit ratings (or investor concerns that a downgrade may occur) could materially increase the cost of our funding from, and restrict our access to, the capital markets.
If we fail to comply with financial and other covenants under our loan agreements, our business, financial condition and results of operations may be materially and adversely affected.
We enter into loan agreements containing financial and other covenants that require us to maintain certain financial ratios or impose certain restrictions on the disposition of our assets or the conduct of our business. While we are currently in compliance with all financial and other covenants, we may be unable to comply with some or all of these financial and other covenants in the future, particularly in periods of broader economic distress. If we are in breach of one or more financial or other covenants under any of our loan agreements and are not able to obtain waivers from the lenders or prepay such loan, such breach would constitute an event of default under the loan agreement. As a result, repayment of the indebtedness under the relevant loan agreement may be accelerated, which may in turn require us to repay the entire principal amount including interest accrued, if any, of certain of our other existing indebtedness prior to their maturity under cross-default provisions of other loan agreements. If we are required to repay a significant portion or all of our existing indebtedness prior to their maturity, we may lack sufficient financial resources to do so. Furthermore, a breach of those financial and other covenants will also restrict our ability to pay dividends. Any of those events could have a material adverse effect on our business, financial condition and results of operations.
Adverse developments in certain industries may have an adverse effect on our business, financial condition and results of operations.
Our customers are concentrated in the construction, fleet transportation and waste industries, which are sensitive to changes in general levels of activity in related industries, which may include services, manufacturing, mining, distribution and wholesale, forestry, transportation and retail. Adverse developments concerning any of these related industries may also increase the rate of delinquencies and defaults by our customers in the construction, fleet transportation and waste industries. Any resulting delay or reduction in collection of payments on our receivables may negatively impact our business, financial condition and results of operations. Adverse changes in these industries may have a corresponding adverse effect on amounts received upon a foreclosure from the sale or other disposition of financed equipment.
16
Table of Contents
We are in a highly competitive business and may not be able to compete effectively, which could impact our profitability.
Our business is highly competitive. We compete with banks, manufacturer-owned and independent finance and leasing companies, as well as other financial institutions. These competitors may have sources of funds available at a lower cost than those available to us, thereby enabling them to provide financing at rates lower than we may be able to profitably provide. In addition, these competitors may be better positioned than we are to market various services and financing programs to vendors and users of equipment because of their ability to offer additional services and products, and more favorable rates and terms. Many of these competitors offer point-of-sale access to the customer which we cannot. These competitors may have longer operating histories and may possess greater financial and other resources than we do. As a result of competition, we may not be able to attract new customers, retain existing customers or sustain the rate of growth that we have experienced to date, and our ability to maintain or grow our portfolio may decline.
Because our underwriting process relies heavily on information provided by our customers, we are susceptible to customer fraud, which could cause us to suffer losses.
In underwriting new business, we do not utilize credit scoring or actuarial models to evaluate any credit request, but rely on credit packages compiled by our credit analysts, which include, among other things, detailed information provided by the customer. A customer could defraud us by, among other things:
| • | misrepresenting their financial performance or business prospects; |
| • | failing to accurately report their financial position; |
| • | overstating or falsifying records showing their asset values; |
| • | failing to notify us of breaches under agreements with us or other lenders; |
| • | misstating or falsifying required reports; or |
| • | providing inaccurate reporting of other financial information. |
The failure of a customer to accurately report its financial position, compliance with loan covenants or eligibility for additional borrowings could result in our extending credit to a customer that does not meet our underwriting criteria. This may result in an increased likelihood of defaults in payments and increased losses. This risk is heightened for us because most of our customers do not publicly report their financial condition or results of operations.
Technological obsolescence of equipment or regulatory or other changes affecting the equipment we finance may reduce the value of the collateral for our loans.
If technological advances or regulatory changes relating to or affecting the underlying equipment we finance cause such equipment to become obsolete or restrict the use of the equipment or, in either case, render its use uneconomical compared to other available technologies, the value of the underlying equipment will decrease. Such developments, particularly with respect to the types of equipment we finance, would reduce the amount of monies recoverable should the underlying equipment be sold following a customer default on the related receivable and as a result our business, financial condition and results of operations could be negatively affected.
Additionally, most of the underlying equipment we finance uses gasoline or diesel fuel, which is a significant, critical operating expense for our customers. Disruptions in availability or unexpectedly large increases in the price of fuel could impair the ability of our customers to make payments on their contracts, which could negatively impact our business, financial condition and results of operations.
17
Table of Contents
Cyber-attacks or other security breaches could have a material adverse effect on our business.
In the normal course of business, we collect, process and retain sensitive and confidential information regarding our customers. We also have arrangements in place with third parties through which we share and receive information about their customers who are or may become our customers. Although we devote significant resources and management focus to ensuring the integrity of our systems through information security and business continuity programs, our facilities and systems, and those of our third-party service providers, are vulnerable to external or internal security breaches, acts of vandalism, computer viruses, misplaced or lost data, programming or human errors, or other similar events. We and our third-party service providers have experienced all of these events in the past and expect to continue to experience them in the future. These events could interrupt our business or operations, result in significant legal and financial exposure, damage to our reputation or a loss of confidence in the security of our systems, products and services. Although the impact to date from these events has not had a material adverse effect on us, we cannot be sure this will be the case in the future.
Information security risks for financial services companies like us have increased recently in part because of new technologies, the use of the internet and telecommunications technologies (including mobile devices) to conduct financial and other business transactions and the increased sophistication and activities of organized crime, perpetrators of fraud, hackers, terrorists and others. In addition to cyber-attacks or other security breaches involving the theft of sensitive and confidential information, hackers recently have engaged in attacks against large financial institutions that are designed to disrupt key business services, such as consumer-facing web sites. We are not able to anticipate or implement effective preventive measures against all security breaches of these types, especially because the techniques used change frequently and because attacks can originate from a wide variety of sources. We employ detection and response mechanisms designed to contain and mitigate security incidents, but early detection may be thwarted by sophisticated attacks and malware designed to avoid detection.
Geographical concentrations of our customers may affect our business, financial condition and results of operations.
Economic conditions such as unemployment, fuel prices, interest rates, inflation rates and effects of natural catastrophes in a state or province where our customers are located may affect loss experience and payment rates on our receivables. Adverse economic conditions in a state where a large number of our customers are located could have a disproportionately significant effect on the loss experience or payment rates on our receivables. The consequences of a decline in regional economic conditions, including rising unemployment, fluctuating fuel prices, increasing interest rates and a lack of availability of credit, may lead to increased delinquency and default rates by our customers, as well as decreased demand for construction, fleet transportation or waste equipment and declining market value of the related equipment securing our receivables, which could increase the amount of a loss if a customer defaults. As of December 31, 2014, 13.0%, 9.7%, 8.8%, 6.8% and 6.1% of our receivables balance are related to customers located in Texas, North Carolina, California, Georgia and Illinois, respectively. As of December 31, 2014, no other state represented more than 5.0% of our receivables. Adverse economic conditions in one or more of these states may affect demand for construction, fleet transportation and waste equipment and payments on our receivables from our customers located in that state.
The occurrence of a natural disaster in a state may also adversely affect our customers located in that state. In addition, we may be unable to accurately assess the effect of a natural disaster on the economy or on our customers or receivables in an affected state. The effect of natural disasters on the performance of our customers and receivables is unclear, but there may be an adverse effect on general economic conditions, consumer confidence and general market liquidity. Adverse impacts as a result of a further decline in economic
18
Table of Contents
conditions, natural disaster or any similar event may affect our business, financial condition and results of operations.
The loss of one or more of our key personnel, or our failure to attract and retain other highly qualified personnel in the future, could harm our business.
Our success has been and will be largely dependent on Daniel J. McDonough, our Chief Executive Officer, and other key personnel. Competition for qualified personnel in the financial services industry is intense, and we may not be able to retain existing personnel. Although we have entered into employment agreements with Mr. McDonough, Mr. Gebhart, Mr. McGinn, Mr. Pokorny, Mr. Lempko and Mr. Garubo, the agreements have no specific duration and constitute at-will employment. The loss of key personnel, including members of management as well as key marketing and sales personnel, could disrupt our operations and have an adverse effect on our business.
As we continue to grow, we cannot guarantee we will continue to attract the personnel we need to grow our business. If we do not succeed in attracting, hiring, and integrating excellent personnel, or retaining and motivating existing personnel, we may be unable to grow effectively.
If we fail to effectively manage our growth, our results of operations could be adversely affected.
In order to grow profitably, we will be required to further penetrate the markets in which we presently operate and/or enter new markets. Our ability to do so depends upon a number of factors, including identification of new markets in which we can successfully compete, the continued growth of the United States economy and regional economies in which we operate, and the hiring of marketing and other qualified personnel. We have expanded our business and operations rapidly since our inception. From our first fiscal year-end on March 31, 2005 to March 31, 2014, our finance income has grown from $270,270 to $45,806,189. This growth has placed, and may continue to place, significant demands on our origination, credit, and customer management systems and resources. The expansion of our operations has also placed significant demands on our management, operational and financial resources. To manage our anticipated growth successfully, we must continue to refine and expand our origination and marketing capabilities, credit review processes, management procedures, access to financing sources and technology resources, as well as continue to hire, train, supervise and manage new employees. If we are unable to manage our growth effectively, our results of operations could be adversely affected.
Our limited operating experience in the Canadian market may limit our growth strategy and our results of operations could be adversely affected.
As part of our growth strategy, in 2014, we commenced operations in Canada. This is a new market for us and may contain unknown market risks, which may limit our ability to penetrate or successfully operate in the Canadian market. In addition, we have limited experience operating within the Canadian regulatory environment. Moreover, there could be changes in Canadian laws and regulations which could adversely affect the company’s operations or performance in Canada and its broader growth strategy.
Our operations could be negatively affected by increased costs relating to accidents or equipment misuse.
Use of the equipment we lease to our customers involves inherent risks from accidents or misuse, which could result in property damage, personal injury or other losses. Although we typically require lessees to maintain insurance to protect against such claims, in the event of an accident or the misuse of such equipment, the aggrieved party could attempt to hold us liable for damages. In addition, insurance coverage could be inadequate to cover losses or our exposure to liability claims in the event of personal injury or loss.
19
Table of Contents
We may in the future acquire related businesses or additional portfolios, which we may not be able to successfully integrate, in which case we may be unable to recoup our investment in those acquisitions.
We may, from time to time, explore opportunities to acquire related businesses or additional portfolios, some of which could be material to us. If we do make acquisitions in the future, our ability to continue to grow will depend upon effectively integrating these acquired companies or portfolios, achieving cost efficiencies and managing such businesses or portfolios as part of our company. We may not be able to effectively integrate newly acquired companies or portfolios or successfully implement appropriate operational, financial and management systems and controls to achieve the benefits expected to result from these acquisitions. If we are unable to successfully integrate acquisitions or portfolios, we may not be able to recoup our investment in those acquisitions. Our efforts to integrate these businesses or portfolios could be affected by a number of factors beyond our control, such as general economic conditions and increased competition. In addition, the process of integrating these businesses or portfolios could cause the interruption of, or loss of momentum in, the activities of our existing business. The diversion of management’s attention and any delays or difficulties encountered in connection with the integration of these businesses or portfolios could negatively impact our business, results of operations and financial condition.
Risks related to regulation
Legal proceedings and related costs could negatively affect our financial results.
We are at risk of being subject to governmental proceedings and litigation. Litigation against us may involve class action lawsuits challenging our contracts, rates, disclosures, and collections or other practices, under state and federal statutes and other laws, as well as actions relating to federal securities laws. We may also become party to litigation relating to contractual disputes with individual customers, employment disputes with our employees, or otherwise.
As a lender, we are subject to additional potential liability. In recent years, a number of judicial decisions, not involving us, have upheld the right of borrowers to sue lending institutions on the basis of various evolving legal theories, collectively termed “lender liability.” Generally, lender liability is founded on the premise that a lender has either violated a duty, whether implied or contractual, of good faith and fair dealing owed to the borrower or has assumed a degree of control over the borrower resulting in the creation of a fiduciary duty owed to the borrower or its other creditors or shareholders. We may be subject to allegations of lender liability. We cannot assure you that these claims will not arise or that we will not be subject to significant liability if a claim of this type did arise.
Federal, state and provincial financial regulatory reform could have an adverse impact on our business and operations.
The Dodd-Frank Wall Street Reform and Consumer Protection Act of 2010, or the “Dodd-Frank Act,” is extensive legislation that impacts financial institutions and other non-bank financial companies like us. In addition, the Dodd-Frank Act will increase regulation of the securitization and derivatives markets. Compliance with the implementing regulations under the Dodd-Frank Act or the oversight of the U.S. Securities and Exchange Commission (the “SEC”) or other government entities, as applicable, may impose costs on, create operational constraints for, or place limits on pricing with respect to finance companies such as us or our affiliates. Many of the new requirements will be the subject of implementing regulations that have yet to be released and such new requirements may have an adverse impact on the servicing of our receivables, on our securitization programs or on the regulation and supervision of us or our affiliates. The Fair Debt Collection Practices Act (FDCPA) can impact financial institutions and other non-bank financial companies like us. Complying with these regulations imposes costs and operational constraints on us. The Gramm-Leach-Bliley Financial Modernization
20
Table of Contents
Act of 1999, or other similar state statutes which regulate the maintenance and disclosure of personal information, could be expanded to apply to non-consumer transactions and thus impose additional costs and operational constraints on us. As part of our loan and lease underwriting procedure, we comply with the applicable provisions of the Uniting and Strengthening America by Providing Appropriate Tools Required to Intercept and Obstruct Terrorism Act (USA PATRIOT Act) and applicable regulations promulgated by the United States Treasury Department’s Office of Foreign Assets Control. Failure to comply with these regulations could expose us to substantial fines and other consequences.
Risks related to this offering and our common stock
Our stock price could be extremely volatile and, as a result, you may not be able to resell your shares at or above the price you paid for them.
Volatility in the market price of our common stock may prevent you from being able to sell your shares at or above the price you paid for your shares. The stock market in general has been highly volatile, and this may be especially true for our common stock given our growth strategy and stage of development. As a result, the market price of our common stock is likely to be volatile. You may experience a decrease, which could be substantial, in the value of your stock, including decreases unrelated to our operating performance or prospects, and could lose part or all of your investment. The price of our common stock could be subject to wide fluctuations in response to a number of factors, including those described elsewhere in this prospectus and others such as:
| • | actual or anticipated fluctuations in our quarterly or annual operating results and the performance of our competitors; |
| • | publication of research reports by securities analysts about us, our competitors or our industry; |
| • | our failure or the failure of our competitors to meet analysts’ projections or guidance that we or our competitors may give to the market; |
| • | additions and departures of key personnel; |
| • | sales, or anticipated sales, of large blocks of our stock or of shares held by our stockholders, directors or executive officers; |
| • | strategic decisions by us or our competitors, such as acquisitions, divestitures, spin-offs, joint ventures, strategic investments or changes in business strategy; |
| • | the passage of legislation or other regulatory developments affecting us or our industry; |
| • | speculation in the press or investment community, whether or not correct, involving us, our customers or our competitors; |
| • | changes in accounting principles; |
| • | litigation and governmental investigations; |
| • | terrorist acts, acts of war or periods of widespread civil unrest; |
| • | natural disasters and other calamities; and |
| • | changes in general market and economic conditions. |
We are especially vulnerable to these factors to the extent that they affect our industry or the primary industries in which our customers operate. In the past, securities class action litigation has often been initiated
21
Table of Contents
against companies following periods of volatility in their stock price. This type of litigation, if initiated, could result in substantial costs and divert our management’s attention and resources, and could also require us to make substantial payments to satisfy judgments or to settle litigation.
There is no existing market for our common stock, and we do not know if one will develop to provide you with adequate liquidity.
Prior to this offering, there has not been a public market for our common stock. An active market for our common stock may not develop following the completion of this offering, or if it does develop, may not be maintained. If an active trading market does not develop, you may have difficulty selling any of our common stock that you buy. The initial public offering price for the shares of our common stock will be determined by negotiations between us, the selling stockholders and the representatives of the underwriters and may not be indicative of prices that will prevail in the open market following this offering. Consequently, you may not be able to sell shares of our common stock at prices equal to or greater than the price you paid in this offering.
Following this offering, we will most likely no longer be a controlled company; however, Lovell Minnick and its affiliated funds will continue to own a significant portion of our common stock, and their interests may differ from or conflict with the interests of our other stockholders.
We expect that as a result of sale of shares of common stock in this offering by us and by the selling stockholders, we will cease to be a “controlled company” within the meaning of the corporate governance standards of the New York Stock Exchange (the “NYSE”). Nonetheless, following this offering, Lovell Minnick will continue to beneficially own a significant percentage of our outstanding common stock. As a result, Lovell Minnick will have the ability to exercise substantial influence over our company, including with respect to decisions relating to our capital structure, issuing additional shares of our common stock or other equity securities, paying dividends, incurring additional debt, making acquisitions, selling assets and undertaking extraordinary transactions. In any of these or other matters, the interests of Lovell Minnick may differ from or conflict with the interests of our other stockholders.
There may be sales of a substantial amount of our common stock after this offering by our current stockholders, and these sales could cause the price of our common stock to fall.
After this offering, there will be shares of common stock outstanding ( if the underwriters exercise their option to purchase additional shares from us in full). Of our issued and outstanding shares, all the common stock sold in this offering will be freely transferable, except for any shares held by our “affiliates,” as that term is defined in Rule 144 under the Securities Act of 1933, as amended (the “Securities Act”). Following completion of this offering, % of our outstanding common stock will be held by our pre-IPO stockholders, including our directors, members of our management and employees (or % if the underwriters exercise their option to purchase additional shares from us and the selling stockholders in full). In addition, pursuant to an investor rights agreement, Lovell Minnick can require us, subject to any lock-up restrictions entered into in connection with this offering, to register under the Securities Act the sale of any shares owned by them as of the date of our initial public offering and Lovell Minnick and certain of our other stockholders have “piggy-back” registration rights that allow them, subject to the terms and conditions of the investor rights agreement, to have their shares included on any registration statement that we file. See “Certain relationships and related party transactions—Reorganization and arrangements with our investors—Investor rights agreement.”
Each of our directors and executive officers and substantially all of our stockholders have entered into a lock-up agreement with the representatives of the underwriters which regulates their sales of our common stock for a period of at least 180 days after the date of this prospectus, subject to certain exceptions and automatic extensions in certain circumstances. See “Underwriting.”
22
Table of Contents
Sales of substantial amounts of our common stock in the public market after this offering, or the perception that such sales will occur, could adversely affect the market price of our common stock and make it difficult for us to raise funds through securities offerings in the future. Of the shares to be outstanding after the offering, the shares offered by this prospectus will be eligible for immediate sale in the public market without restriction by persons other than our affiliates. Our remaining outstanding shares will become available for resale in the public market as shown in the chart below (less any shares sold as a result of the exercise of the underwriters’ option to purchase additional shares), subject to the provisions of Rule 144 and Rule 701.
| Number of Shares | Date Available for Resale | |
| On the date of this offering ( , ) | ||
| 180 days after this offering ( , ), subject to certain exceptions and automatic extensions in certain circumstances | ||
|
| ||
In addition, after this offering, we intend to register shares of common stock that are reserved for issuance under our stock incentive plan. See “Executive and director compensation—2015 Stock incentive plan.”
Provisions in our amended and restated certificate of incorporation and bylaws and Delaware law may discourage, delay or prevent a change of control of our company or changes in our management and, therefore, may depress the trading price of our stock.
Our amended and restated certificate of incorporation and bylaws will include certain provisions that could have the effect of discouraging, delaying or preventing a change of control of our company or changes in our management, including, among other things:
| • | our board will be classified into three classes of directors with only one class subject to election each year; |
| • | restrictions on the ability of our stockholders to fill a vacancy on the board of directors; |
| • | our ability to issue preferred stock with terms that the board of directors may determine, without stockholder approval, which could be used to significantly dilute the ownership of a hostile acquirer; |
| • | the inability of our stockholders to call a special meeting of stockholders; |
| • | our directors may only be removed from the board of directors for cause by the affirmative vote of the holders of at least 66-2/3% of the voting power of outstanding shares of our capital stock entitled to vote generally in the election of directors; |
| • | the absence of cumulative voting in the election of directors, which may limit the ability of minority stockholders to elect directors; |
| • | advance notice requirements for stockholder proposals and nominations, which may discourage or deter a potential acquirer from soliciting proxies to elect a particular slate of directors or otherwise attempting to obtain control of us; and |
| • | stockholders can only amend our bylaws by the affirmative vote of the holders of at least 66-2/3% of the voting power of outstanding shares of our capital stock entitled to vote generally in the election of directors. |
We have broad discretion in the use of the net proceeds from our initial public offering and may not use them effectively.
We intend to use the net proceeds from our initial public offering to retire the outstanding aggregate principal amount of our senior subordinated notes in the amount of $33 million, plus any interest and fees. We may also pay down our credit facilities. We cannot specify with any certainty the particular uses of the remaining net
23
Table of Contents
proceeds. We will have broad discretion in the application of the remaining net proceeds, including working capital, possible acquisitions, and other general corporate purposes, and we may spend or invest these proceeds in a way with which our stockholders disagree. The failure by our management to apply these funds effectively could adversely affect our business and financial condition. Pending their use, we may invest the net proceeds from our initial public offering in a manner that does not produce income or that loses value. These investments may not yield a favorable return to our investors.
We will incur increased costs and obligations as a result of being a public company.
As a privately held company, we were not required to comply with certain corporate governance and financial reporting practices and policies required of a publicly-traded company. As a publicly-traded company, we will incur significant legal, accounting and other expenses that we were not required to incur in the recent past, particularly after we are no longer an “emerging growth company” as defined under the JOBS Act. In addition, new and changing laws, regulations and standards relating to corporate governance and public disclosure, including the Dodd-Frank Act and the rules and regulations promulgated and to be promulgated thereunder, as well as under the Sarbanes-Oxley Act of 2002, as amended (the “Sarbanes-Oxley Act”) and the rules and regulations of the SEC and the NYSE, have created uncertainty for public companies and will increase our costs and the time that our board of directors and management must devote to complying with these rules and regulations. In addition, in the past we have identified a material weakness in our internal control over financial reporting and while we believe that weakness has been remedied, if we fail to establish and maintain an effective system of internal control over financial reporting as a public company our reputation may be harmed which could adversely impact the trading price of our common stock. Furthermore, the need to establish the corporate infrastructure demanded of a public company may divert management’s attention from implementing our growth strategy, which could prevent us from improving our business, results of operations and financial condition.
We are an “emerging growth company,” and any decision on our part to comply only with certain reduced reporting and disclosure requirements applicable to emerging growth companies could make our common stock less attractive to investors.
We are an “emerging growth company,” as defined in the JOBS Act, and, for as long as we continue to be an “emerging growth company,” we may choose to take advantage of exemptions from various reporting requirements applicable to other public companies but not to “emerging growth companies,” including, but not limited to, not being required to have our independent registered public accounting firm audit our internal control over financial reporting under Section 404 of the Sarbanes-Oxley Act, reduced disclosure obligations regarding executive compensation in our periodic reports and proxy statements and exemptions from the requirements of holding a nonbinding advisory vote on executive compensation and stockholder approval of any golden parachute payments not previously approved. We may choose to take advantage of some but not all of these reduced burdens until we are no longer an “emerging growth company.” We will remain an emerging growth company until the earlier of (1) the last day of the fiscal year (a) following the fifth anniversary of the completion of this offering, (b) in which we have total annual gross revenue of at least $1.0 billion, or (c) in which we are deemed to be a large accelerated filer, which means the market value of our common stock that is held by non-affiliates exceeds $700 million as of the prior September 30th, or (2) the date on which we have issued more than $1.0 billion in non-convertible debt securities during the prior three-year period. We cannot predict if investors will find our common stock less attractive if we choose to rely on these exemptions. If some investors find our common stock less attractive as a result of any choices to reduce future disclosure, there may be a less active trading market for our common stock and our stock price may be more volatile.
Under the JOBS Act, emerging growth companies can delay adopting new or revised accounting standards until such time as those standards apply to private companies. We have irrevocably elected not to avail ourselves of this exemption from new or revised accounting standards, and, therefore, we will be subject to the same new or
24
Table of Contents
revised accounting standards as other public companies that are not emerging growth companies.
Our ability to raise capital in the future may be limited, which could make us unable to fund our capital requirements.
Our business and operations may consume resources faster than we anticipate. In the future, we may need to raise additional funds through the issuance of new equity securities, debt or a combination of both. Additional financing may not be available on favorable terms or at all. If adequate funds are not available on acceptable terms, we may be unable to fund our capital requirements. If we issue new debt securities, the debt holders would have rights senior to common stockholders to make claims on our assets, and the terms of any debt could restrict our operations, including our ability to pay dividends on our common stock. If we issue additional equity securities, existing stockholders may experience dilution, and the new equity securities could have rights senior to those of our common stock. Because our decision to issue securities in any future offering will depend on market conditions and other factors beyond our control, we cannot predict or estimate the amount, timing or nature of our future offerings. Thus, our stockholders bear the risk of our future securities offerings reducing the market price of our common stock and diluting their interest.
If securities analysts or industry analysts downgrade our stock, publish negative research or reports, or do not publish reports about our business, our stock price and trading volume could decline.
We expect that the trading market for our common stock will be influenced by the research and reports that industry or securities analysts publish about us, our business and our industry. If one or more analysts adversely change their recommendation regarding our stock or our competitors’ stock, our stock price would likely decline. If one or more analysts cease coverage of us or fail to regularly publish reports on us, we could lose visibility in the financial markets, which in turn could cause our stock price or trading volume to decline.
Because we have no plans to pay cash dividends on our common stock for the foreseeable future, you may not receive any return on investment unless you sell your common stock for a price greater than that which you paid for it.
We may retain future earnings, if any, for future operations, expansion and debt repayment and have no current plans to pay any cash dividends for the foreseeable future. Any decision to declare and pay dividends in the future will be made at the discretion of our board of directors and will depend on, among other things, our results of operations, financial condition, cash requirements, contractual restrictions and other factors that our board of directors may deem relevant. In addition, our ability to pay dividends may be limited by covenants of any existing and future outstanding indebtedness we or our subsidiaries incur, including our credit facility. As a result, you may not receive any return on an investment in our common stock unless you sell our common stock for a price greater than that which you paid for it. See “Dividend policy.”
If you purchase shares in this offering, you will suffer immediate and substantial dilution.
If you purchase shares of our common stock in this offering, you will incur immediate and substantial dilution in the book value of your stock, because the price that you pay will be substantially greater than the net tangible book value per share of the shares you acquire. The net tangible book value deficiency per share, calculated as of , 2015 and after giving effect to the offering is $ , resulting in dilution of your shares of $ per share.
You will experience additional dilution upon the exercise of options to purchase our common stock, including options possibly granted in the future, and the issuance of restricted stock or other equity awards under our stock incentive plans. To the extent we raise additional capital by issuing equity securities, our stockholders may experience substantial additional dilution. See “Dilution.”
25
Table of Contents
Cautionary note regarding forward-looking statements
This prospectus includes statements that express our opinions, expectations, beliefs, plans, objectives, assumptions or projections regarding future events or future results and therefore are, or may be deemed to be, “forward-looking statements.” These forward-looking statements can generally be identified by the use of forward-looking terminology, including the terms “believes,” “estimates,” “anticipates,” “expects,” “strives,” “goal,” “seeks,” “projects,” “intends,” “forecasts,” “plans,” “may,” “will” or “should” or, in each case, their negative or other variations or comparable terminology. They appear in a number of places throughout this prospectus and include statements regarding our intentions, beliefs or current expectations concerning, among other things, our results of operations, financial condition, liquidity, prospects, growth, strategies and the industry in which we operate.
By their nature, forward-looking statements involve risks and uncertainties because they relate to events and depend on circumstances that may or may not occur in the future. We believe that these risks and uncertainties include, but are not limited to, those described in the “Risk factors” section of this prospectus, which include, but are not limited to, the following:
| • | adverse macroeconomic conditions; |
| • | changes in market interest rates; |
| • | constraints on the amount of funds available for us to borrow at any given time; |
| • | increased credit risk due to our customer profile; |
| • | our allowance for credit losses being inadequate to cover our actual losses; |
| • | reduction in the credit ratings of our asset-backed securities; |
| • | adverse developments in the construction, fleet transportation, waste and related industries; |
| • | our inability to compete effectively in a highly competitive business; |
| • | susceptibility to customer fraud due to private company customers; |
| • | reduction in value of the collateral for our loans due to technological obsolescence of equipment or regulatory or other changes affecting the equipment we finance; |
| • | our vulnerability to cyber-attacks and security breaches; |
| • | adverse conditions in the areas our customers are geographically concentrated; |
| • | loss of key personnel or failure to attract and retain highly qualified personnel in the future; |
| • | our failure to effectively manage our growth; |
| • | our lack of operating experience in Canada limiting our growth strategy; |
| • | increased costs relating to accidents or equipment misuse; |
| • | changes in regulations and our failure to meet increased regulatory requirements; and |
| • | other factors discussed under the headings “Risk factors,” “Management’s discussion and analysis of financial condition and results of operations” and “Business.” |
Although we base these forward-looking statements on assumptions that we believe are reasonable when made, we caution you that forward-looking statements are not guarantees of future performance and that our
26
Table of Contents
actual results of operations, financial condition and liquidity, and industry developments may differ materially from statements made in or suggested by the forward-looking statements contained in this prospectus. In addition, even if our results of operations, financial condition and liquidity, and industry developments are consistent with the forward-looking statements contained in this prospectus, those results or developments may not be indicative of results or developments in subsequent periods.
In light of these risks and uncertainties, we caution you not to place undue reliance on these forward-looking statements. Any forward-looking statement that we make in this prospectus speaks only as of the date of such statement, and we undertake no obligation to update any forward-looking statement or to publicly announce the results of any revision to any of those statements to reflect future events or developments. Comparisons of results for current and any prior periods are not intended to express any future trends or indications of future performance, unless specifically expressed as such, and should only be viewed as historical data.
27
Table of Contents
We estimate that the net proceeds we will receive from our issuance and sale of shares of our common stock in this offering, after deducting estimated offering expenses and underwriting discounts and commissions payable by us, will be approximately $ million (approximately $ million if the underwriters exercise their option to purchase additional shares in full). This estimate assumes an initial public offering price of $ per share, the midpoint of the offering price range set forth on the cover page of this prospectus.
A $1.00 increase (decrease) in the assumed initial public offering price of $ per share would increase (decrease) the net proceeds to us from this offering by $ million, assuming the number of shares offered by us, as set forth on the cover page of this prospectus, remains the same and after deducting the estimated underwriting discounts and commissions and estimated expenses payable by us.
We intend to use the net proceeds from this offering to retire the outstanding aggregate principal amount of our 12.75% senior subordinated notes due 2018 in the amount of $33 million, plus any interest and fees, and for working capital and general corporate purposes. We may also pay down our credit facilities. For information on the interest rates and maturity dates of our credit facilities, see Note 4 to our consolidated financial statements included herein.
We will not receive any proceeds from the sale of shares of common stock by the selling stockholders. See “Principal and selling stockholders.”
28
Table of Contents
We do not currently pay cash dividends on our common stock and we do not anticipate paying any dividends on our common stock in the foreseeable future. However, the board of directors may in the future determine that it is in our and our stockholders’ interest to pay a dividend. Any future determinations relating to our dividend policies will be made at the discretion of our board of directors and will depend on conditions then existing, including our financial condition, results of operations, contractual restrictions, capital requirements, business prospects and other factors our board of directors may deem relevant. In addition, our ability to pay dividends on our common stock is limited by restrictions on the ability of our subsidiaries and us to pay dividends or make distributions under the terms of our bank borrowings and senior subordinated notes.
29
Table of Contents
The following table sets forth our cash and cash equivalents, restricted cash, total debt and capitalization as of December 31, 2014:
| • | on an actual basis; |
| • | as adjusted to give effect to the conversion of all outstanding shares of all series of our preferred stock into common stock immediately prior to this offering; |
| • | presenting the adjustments for the offering include the offering and sale of shares of common stock in this offering by us at the estimated initial public offering price of $ per share (the midpoint of the offering price range set forth on the cover page of this prospectus), after deducting estimated underwriting discounts and commissions and estimated offering expenses payable by us, and the application of the net proceeds of this offering as described under the heading “Use of proceeds”; and |
| • | pro forma as further adjusted to give effect to the transactions described in the bullets immediately above, as if the events had occurred on December 31, 2014. |
30
Table of Contents
This table should be read in conjunction with “Use of proceeds,” “Selected consolidated financial and other data,” “Management’s discussion and analysis of financial condition and results of operations” and our condensed consolidated financial statements and related notes appearing elsewhere in this prospectus.
| As of December 31, 2014 | ||||||||||||||||
| (in thousands) | ||||||||||||||||
| Actual | As adjusted(1) | Adjustments for the offering |
Pro forma as |
|||||||||||||
| Cash and cash equivalents |
$ | 4,024 | $ | $ | $ | |||||||||||
| Restricted cash(2) |
33,294 | |||||||||||||||
|
|
|
|||||||||||||||
| Total debt: |
||||||||||||||||
| Bank borrowings |
$ | 54,646 | $ | $ | $ | |||||||||||
| Asset securitization borrowings—revolving |
212,846 | |||||||||||||||
| Asset securitization borrowings—term |
276,840 | |||||||||||||||
| Subordinated debt |
33,000 | |||||||||||||||
|
|
|
|||||||||||||||
| Total debt |
$ | 577,332 | $ | $ | $ | |||||||||||
| Equity: |
||||||||||||||||
| Redeemable convertible preferred stock, $0.00001 par value—800,000 shares authorized and 646,857 shares issued and outstanding on an actual basis; shares authorized and 0 issued and outstanding on an as adjusted basis; and shares authorized and 0 issued and outstanding on a pro forma as further adjusted basis |
51,163 | |||||||||||||||
| Common stock, $0.00001 par value—850,000 shares authorized and 2,176 issued and outstanding on an actual basis; shares authorized and issued and outstanding on an as adjusted basis; and shares authorized and issued and outstanding on a pro forma as further adjusted basis |
— | |||||||||||||||
| Additional paid-in capital |
130 | |||||||||||||||
| Accumulated other comprehensive loss, net of tax |
(411 | ) | ||||||||||||||
| Accumulated retained earnings |
10,633 | |||||||||||||||
|
|
|
|||||||||||||||
| Total stockholders’ equity |
61,514 | |||||||||||||||
|
|
|
|||||||||||||||
| Total capitalization |
$ | 649,496 | $ | $ | $ | |||||||||||
|
|
||||||||||||||||
| (1) | Assumes the conversion of all outstanding shares of all series of our preferred stock into an aggregate of shares of common stock immediately prior to the completion of this offering. |
| (2) | All financing facilities, bank credit facilities and asset securitization facilities revolving and term require that customer payments be sent to a single lockbox account. Funds in this account are then sent to a specific account designated for each facility. Funds in these accounts are distributed on a monthly basis in accordance with the provisions related to each facility. As such, these amounts are categorized as restricted cash. |
31
Table of Contents
If you invest in our common stock, your ownership interest will experience immediate book value dilution to the extent of the difference between the initial public offering price per share of our common stock and the net tangible book value per share of our common stock after this offering. Dilution results from the fact that the initial public offering price per share of common stock is substantially in excess of the net tangible book value per share of common stock attributable to the existing stockholders for the presently outstanding shares of common stock. Net tangible book value per share represents the amount of our total tangible assets less our total liabilities, divided by the number of shares of our common stock outstanding.
Our pro forma net tangible book value at , 2015 was approximately $ million, or $ per share of our common stock, after taking into account the conversion of our outstanding shares of our preferred stock but before giving effect to this offering. Dilution in pro forma net tangible book value per share represents the difference between the amount per share that you pay in this offering and the pro forma net tangible book value per share immediately after this offering.
After giving effect to our sale of shares in this offering and the conversion of our outstanding shares of our preferred stock, assuming an initial public offering price of $ per share (the midpoint of the offering price range set forth on the cover page of this prospectus), and the application of the estimated net proceeds as described under the heading “Use of proceeds,” our pro forma net tangible book value at , 2015 would have been approximately $ million, or $ per share of common stock. This represents an immediate increase in pro forma net tangible book value per share of $ to existing stockholders and an immediate and substantial dilution of $ per share to new investors. The following table illustrates this dilution per share.
| Assumed initial public offering price per share of common stock |
$ | |||||||
| Pro forma net tangible book value per share at , 2015 |
$ | |||||||
| Increase per share attributable to new investors in the offering |
||||||||
|
|
|
|||||||
| Pro forma net tangible book value per share of common stock after this offering |
||||||||
|
|
|
|||||||
| Dilution per share to new investors |
$ | |||||||
|
|
||||||||
If the underwriters were to fully exercise their option to purchase additional shares of our common stock, the pro forma net tangible book value per share of our common stock after giving effect to this offering would be $ per share of our common stock. This represents an increase in pro forma net tangible book value of $ per share of our common stock to existing stockholders and dilution of $ per share of our common stock to new investors.
A $1.00 increase (decrease) in the assumed initial public offering price of $ per share of our common stock would increase (decrease) our pro forma net tangible book value after giving effect to the offering by $ million, or by $ per share of our common stock, assuming no change to the number of shares of our common stock offered by us as set forth on the cover page of this prospectus, and after deducting the estimated underwriting discounts and commissions and estimated expenses payable by us.
32
Table of Contents
The following table sets forth, as of , 2015, the number of shares of common stock purchased from us, the total consideration paid to us and the average price per share paid by existing stockholders and to be paid by new investors purchasing shares of common stock in this offering, before deducting estimated underwriting discounts and commissions and estimated offering expenses payable by us.
| Shares purchased | Total consideration | Average price per share |
||||||||||||||||
| Number | Percent | Amount (in thousands) |
Percent | |||||||||||||||
| Existing stockholders |
% | $ | % | $ | ||||||||||||||
| New investors |
||||||||||||||||||
|
|
||||||||||||||||||
| Total |
100.0% | $ | 100.0% | |||||||||||||||
|
|
||||||||||||||||||
If the underwriters were to exercise in full their option to purchase additional shares of our common stock, the percentage of shares of our common stock held by existing stockholders would be %, and the percentage of shares of our common stock held by new investors would be %.
The discussion and tables above assume the conversion of all outstanding shares of our preferred stock into, an aggregate of shares of common stock immediately prior to the completion of this offering and excludes, as of , 2015, shares of our common stock reserved for future grants under our 2015 stock incentive plan, which we intend to adopt in connection with this offering.
To the extent any outstanding equity awards become vested or any other equity awards are granted and become vested or other issuances of shares of our common stock are made, there may be further economic dilution to new investors.
33
Table of Contents
Selected consolidated financial and other data
The following selected consolidated financial data of Commercial Credit Group Inc. should be read in conjunction with, and are qualified by reference to, the consolidated financial statements and notes thereto appearing elsewhere in this prospectus, as well as “Management’s discussion and analysis of financial condition and results of operations” and the other financial information included elsewhere in this prospectus. The consolidated statement of income data for the fiscal years ended March 31, 2012, 2013 and 2014 and the consolidated balance sheet data at March 31, 2013 and 2014 are derived from, and qualified by reference to, our audited consolidated financial statements included elsewhere in this prospectus and should be read in conjunction with those consolidated financial statements and notes thereto. The consolidated statement of income data for the fiscal years ended March 31, 2010 and 2011 and the consolidated balance sheet data at March 31, 2010, 2011, and 2012 are derived from our consolidated financial statements not included in this prospectus. The consolidated statement of income data for the nine months ended December 31, 2013 and 2014 and the balance sheet data as of December 31, 2013 and 2014 are derived from our unaudited condensed consolidated financial statements included elsewhere in this prospectus and, in our opinion, reflect all adjustments, consisting of normal accruals, necessary for a fair presentation of the data for those periods. Our results of operations for the nine months ended December 31, 2014 may not be indicative of results that we may achieve for the full fiscal year. See “Index to consolidated financial statements.”
Commercial Credit, Inc. is a newly formed holding company and had only engaged in operations and activities incidental to its formation, the corporate reorganization that became effective as of December 12, 2014 and the initial public offering of our common shares. The consolidated financial statements of Commercial Credit, Inc. for the period ended December 31, 2014 include the financial results of Commercial Credit Group Inc., its wholly-owned subsidiary, as a result of the corporate reorganization. For periods prior to December 12, 2014, this prospectus only includes consolidated financial statements of Commercial Credit Group Inc. and not Commercial Credit, Inc., as Commercial Credit, Inc. did not have any material assets, liabilities or operations other than nominal organizational expenses until it completed the corporate reorganization. Our historical consolidated financial data may not be indicative of future results.
| Year ended March 31, | Nine months
ended December 31, |
|||||||||||||||||||||||||||
| 2010 | 2011 | 2012 | 2013 | 2014 | 2013 | 2014 | ||||||||||||||||||||||
| (in thousands, except for earnings per share data) | ||||||||||||||||||||||||||||
| Statement of Income Data: |
||||||||||||||||||||||||||||
| Finance income |
$ | 22,886 | $ | 26,550 | $ | 33,206 | $ | 40,226 | $ | 45,806 | $ | 33,804 | $ | 41,109 | ||||||||||||||
| Interest expense |
13,609 | 16,444 | 15,353 | 16,546 | 15,586 | 11,622 | 11,850 | |||||||||||||||||||||
|
|
|
|||||||||||||||||||||||||||
| Net finance income before provision for credit losses on finance receivables |
9,278 | 10,106 | 17,852 | 23,680 | 30,220 | 22,182 | 29,259 | |||||||||||||||||||||
| Provision for credit losses on finance receivables |
1,200 | 1,250 | 1,975 | 1,825 | 2,348 | 2,098 | 1,700 | |||||||||||||||||||||
|
|
|
|||||||||||||||||||||||||||
| Net finance income |
8,078 | 8,856 | 15,877 | 21,855 | 27,872 | 20,084 | 27,559 | |||||||||||||||||||||
| Compensation and benefits |
3,255 | 2,952 | 4,348 | 6,724 | 8,009 | 5,389 | 7,608 | |||||||||||||||||||||
| Other operating expenses |
1,932 | 3,110 | 3,543 | 3,893 | 4,259 | 3,846 | 5,110 | |||||||||||||||||||||
|
|
|
|||||||||||||||||||||||||||
| Total operating expenses |
5,187 | 6,062 | 7,891 | 10,617 | 12,268 | 9,235 | 12,718 | |||||||||||||||||||||
| Income before income taxes |
2,891 | 2,794 | 7,986 | 11,238 | 15,605 | 10,850 | 14,841 | |||||||||||||||||||||
| Provision for income taxes |
1,255 | 1,053 | 3,124 | 4,380 | 6,255 | 4,291 | 5,812 | |||||||||||||||||||||
|
|
|
|||||||||||||||||||||||||||
| Net income |
$ | 1,635 | $ | 1,741 | $ | 4,861 | $ | 6,857 | $ | 9,349 | $ | 6,559 | $ | 9,029 | ||||||||||||||
|
|
|
|||||||||||||||||||||||||||
| Earnings per Share Data: |
||||||||||||||||||||||||||||
| Earnings per share, basic and diluted(1) |
$ | 0.79 | $ | 0.48 | $ | 1.28 | $ | (86.74 | ) | $ | 11.93 | $ | — | $ | 13.25 | |||||||||||||
| Pro forma earnings per share, basic and diluted(2) |
0.46 | 0.46 | 1.27 | (5.64) | 11.86 | 7.92 | 13.27 | |||||||||||||||||||||
| Weighted average shares used in computing earnings per share, basic and diluted (in thousands) |
172 | 235 | 245 | 263 | — | — | 2 | |||||||||||||||||||||
| Shares used in computing pro forma earnings per share, basic and diluted(2) (in thousands) |
3,546 | 3,789 | 3,826 | 4,044 | 682 | 669 | 681 | |||||||||||||||||||||
|
|
||||||||||||||||||||||||||||
| (1) | On May 10, 2012, pursuant to the Recapitalization, all then-outstanding shares of common stock were converted into Series 1 preferred stock. To show the impact of the Recapitalization on earnings per share for the year, the Company calculated earnings per share separately for the 40-day period prior to Recapitalization, beginning April 1, 2012 to May 10, 2012 (“pre-Recapitalization”) and the 325-day period after Recapitalization beginning May 11, 2012 to March 31, 2013 (“post-Recapitalization). The $(86.74) cited in this table represents the earnings per |
34
Table of Contents
| common share for the pre-Recapitalization period. Although no shares of common stock were outstanding during the post-Recapitalization period ended March 31, 2013, or during the nine month period ended December 31, 2013, the Company had outstanding participating securities in the form of convertible preferred stock and unvested restricted stock in both periods. For additional information regarding the calculation of earnings per share, see Note 11 to the annual consolidated financial statements for the three year period ended March 31, 2014 and Note 10 to the interim unaudited condensed consolidated financial statements for the nine month periods ended December 31, 2013, and 2014. |
| (2) | Pro forma basic and diluted earnings per share have been calculated assuming the conversion of all shares of our preferred stock and unvested restricted stock awards outstanding at each of the relevant period ends into shares of common stock as of the beginning of each of the applicable periods. |
| At March 31, | At December 31, | |||||||||||||||||||||||||||
| 2010 | 2011 | 2012 | 2013 | 2014 | 2013 | 2014 | ||||||||||||||||||||||
| (in thousands) | ||||||||||||||||||||||||||||
| Balance Sheet Data: |
||||||||||||||||||||||||||||
| Finance receivables |
$ | 200,643 | $ | 246,737 | $ | 320,257 | $ | 383,902 | $ | 501,042 | $ | 471,226 | $ | 611,467 | ||||||||||||||
| Allowance for credit losses |
(2,893 | ) | (3,540 | ) | (4,261 | ) | (5,389 | ) | (6,359 | ) | (6,565 | ) | (7,138 | ) | ||||||||||||||
| Finance receivables, net |
197,750 | 243,197 | 315,997 | 378,512 | 494,683 | 464,661 | 604,329 | |||||||||||||||||||||
| Cash and cash equivalents |
1,000 | 1,000 | 1,000 | 1,000 | 991 | 5,262 | 4,024 | |||||||||||||||||||||
| Restricted cash |
17,954 | 13,657 | 18,412 | 18,655 | 36,527 | 26,762 | 33,294 | |||||||||||||||||||||
| Other assets |
7,778 | 5,839 | 10,045 | 6,792 | 9,796 | 7,556 | 7,849 | |||||||||||||||||||||
| Total assets |
224,482 | 263,692 | 345,453 | 404,959 | 541,996 | 504,241 | 649,496 | |||||||||||||||||||||
|
|
|
|||||||||||||||||||||||||||
| Long-term debt |
184,547 | 169,720 | 264,214 | 309,587 | 417,928 | 310,993 | 479,259 | |||||||||||||||||||||
| Short-term debt |
5,453 | 57,758 | 36,043 | 41,113 | 61,494 | 132,703 | 98,073 | |||||||||||||||||||||
| Accrued interest, taxes and other liabilities |
4,855 | 4,781 | 8,957 | 9,870 | 9,983 | 10,756 | 10,650 | |||||||||||||||||||||
|
|
|
|||||||||||||||||||||||||||
| Total liabilities |
194,855 | 232,258 | 309,214 | 360,571 | 489,405 | 454,452 | 587,982 | |||||||||||||||||||||
| Total shareholders’ equity |
$ | 29,626 | $ | 31,434 | $ | 36,239 | $ | 44,388 | $ | 52,591 | $ | 49,788 | $ | 61,514 | ||||||||||||||
|
|
||||||||||||||||||||||||||||
| Year ended March 31, | Nine months ended December 31, |
|||||||||||||||||||||||||||
| 2010 | 2011 | 2012 | 2013 | 2014 | 2013 | 2014 | ||||||||||||||||||||||
| (in thousands, except for percentages and ratios) | ||||||||||||||||||||||||||||
| Operating Data: |
||||||||||||||||||||||||||||
|
Originations(1) |
$ | 117,695 | $ | 169,228 | $ | 228,603 | $ | 251,683 | $ | 357,313 | $ | 255,757 | $ | 332,821 | ||||||||||||||
| Portfolio yield |
11.0% | 11.9% | 11.7% | 11.4% | 10.4% | 10.5% | 9.9% | |||||||||||||||||||||
| Net interest margin |
4.5% | 4.5% | 6.3% | 6.7% | 6.8% | 6.9% | 7.0% | |||||||||||||||||||||
| Allowance for credit losses to finance receivables |
1.4% | 1.4% | 1.3% | 1.4% | 1.3% | 1.4% | 1.2% | |||||||||||||||||||||
| Net charge-offs(2) |
$ | 1,355 | $ | 603 | $ | 1,254 | $ | 696 | $ | 1,378 | $ | 922 | $ | 922 | ||||||||||||||
| Net charge-off ratio (annualized)(3) |
0.65% | 0.27% | 0.44% | 0.20% | 0.31% | 0.29% | 0.22% | |||||||||||||||||||||
| Operating expense ratio |
2.5% | 2.7% | 2.8% | 3.0% | 2.8% | 2.9% | 3.0% | |||||||||||||||||||||
| Return on average assets |
0.7% | 0.7% | 1.6% | 1.8% | 2.0% | 1.9% | 2.0% | |||||||||||||||||||||
|
Leverage(4) |
3.3x | 3.8x | 4.8x | 4.1x | 5.2x | 5.0x | 5.8x | |||||||||||||||||||||
| Return on average stockholders’ equity |
7.0% | 5.7% | 14.4% | 17.0% | 19.3% | 18.6% | 21.1% | |||||||||||||||||||||
|
|
||||||||||||||||||||||||||||
| (1) | Originations are the aggregate dollar amount of loans and leases booked during a given period. |
| (2) | Net charge-offs is the amount of the reduction in the allowance for credit losses when a finance receivable or a portion thereof is charged off under GAAP. |
| (3) | Our net charge-off ratio is the ratio of net charge-offs to the average finance receivables for a given period, stated as a percentage. |
| (4) | Our leverage is the ratio of our total senior outstanding debt to the sum of our equity plus our outstanding subordinated debt. The amount payable on our subordinated notes was $22.0 million in each of the years ended March 31, 2010, 2011 and 2012 and $33.0 million in each of the years ended March 31, 2013 and 2014 and the nine month periods ended December 31, 2013 and 2014. |
35
Table of Contents
Management’s discussion and analysis of
financial condition and results of operations
The following discussion and analysis of our financial condition and results of operations should be read together with our financial statements and related notes and other financial information appearing elsewhere in this prospectus. This discussion and analysis contains forward-looking statements that involve risk, uncertainties and assumptions. See “Cautionary note regarding forward-looking statements.” Our actual results could differ materially from those anticipated in the forward-looking statements as a result of many factors, including those discussed in “Risk factors” and elsewhere in this prospectus.
Our company
We are an independent financial services company engaged in the financing of commercial equipment. We provide secured loans and, to a lesser extent, leases to businesses that operate in the construction, fleet transportation and waste industries in the United States and Canada. Our target customers are primarily middle-market, family-owned businesses, and the equipment they finance with us is, in many cases, vital to their operations. This equipment includes mobile cranes, earth moving and paving equipment, over-the-road trucks and trailers, waste collection trucks and related equipment that are produced primarily by nationally recognized manufacturers.
Our primary source of revenue is finance income earned on our finance receivables portfolio. Finance income includes interest, prepayment premiums and other fees less amortization of capitalized origination costs and was $41.1 million for the nine months ended December 31, 2014. Our portfolio yield is calculated as finance income divided by average finance receivables for a given period, stated as a percentage. For the nine months ended December 31, 2014, our annualized portfolio yield was 9.9%. Our net interest margin is the difference between the finance income and our total cost of funds. For the nine months ended December 31, 2014, our net interest margin was 7.0%. We generate profits to the extent that our net interest margin exceeds our provision for credit losses, salaries and operating expenses. For the nine months ended December 31, 2014, we generated net income of $9.0 million and had an annualized return on average shareholders’ equity of 21.1%. Over the last five fiscal years, finance receivables and net income have grown at a compound annual rate of 18.3% and 48.4%, respectively.
We fund our portfolio through a combination of committed secured bank credit facilities, term and revolving asset-backed securitizations, unsecured subordinated debt and equity. Our funding providers are nationally recognized financial institutions. Our revolving credit facilities are on bilateral terms with staggered debt maturities. As of December 31, 2014, our leverage was 5.8x or x on a pro forma basis after giving effect to the intended application of net proceeds from this offering. Additionally, our financing strategy seeks to match the duration and interest rate characteristics of our portfolio by utilizing fixed rate term debt and interest rate hedges. As of December 31, 2014, 84% of our debt was either fixed rate debt or floating rate debt that had been swapped to a fixed rate using interest rate swaps.
Our finance receivables are secured by a first lien on the specific equipment financed. Additionally, our loans typically have fixed interest rates, are amortizing and include prepayment premium provisions. We also offer lease financing to our customers. As of December 31, 2014, there were $8.9 million of lease residuals retained on our balance sheet representing 1.5% of our finance receivables.
Income
Our income (“finance income”) is composed of interest income on finance receivables, prepayment premiums and other fees, less the amortization of capitalized costs related to origination of finance receivables. Interest income is recognized using the effective interest method over the expected life of the contract.
36
Table of Contents
Expenses
Our expenses are interest expense, provision for credit losses on finance receivables, compensation and benefits and other operating expenses.
Interest expense is comprised of interest expense on our outstanding indebtedness, commitment fees, amortization of capitalized debt issuance costs, payments under hedging agreements and other ancillary fees associated with the maintenance of credit facilities.
Provision for credit losses on finance receivables is the amount expensed in connection with amounts reserved for future credit losses on existing finance receivables.
Compensation and benefits are amounts paid for compensation and related expense less any such expenses that are capitalized related to the origination of finance receivables.
Other operating expenses are amounts paid for credit processing, sales and marketing, collections and other operating expenses such as rent, insurance, audit and supplies less any such expenses that are capitalized costs related to the origination of finance receivables.
Key performance indicators
Allowance for credit losses—represents the amount recorded as a reserve for losses in accordance with ASC 450-20 Loss Contingencies and ASC 310-10 Receivables, which discusses reserves for impaired loans and leases.
Average finance receivables—the average of the finance receivables balances at the beginning and end of a given period.
Total cost of funds—total interest expense related to our outstanding debt (including subordinated debt) for a given period, divided by the average balance of our outstanding debt for such period, stated as a percentage.
Delinquent finance receivables—the aggregate recorded value of finance receivables for which the most recent payment is more than 61 days past due.
Operating expense ratio—compensation and benefits and other operating expenses divided by average finance receivables for a given period, stated as a percentage.
Net interest margin—net finance income before provision for credit losses on finance receivables divided by average finance receivables for a given period, stated as a percentage.
Loss ratio—the ratio of net write-downs to the average finance receivables for a given period, stated as a percentage. Net write-downs are the aggregate write-downs on finance receivables, less any adjustments to prior write-downs and any recoveries of net charge-offs, for a given period. When a finance receivable is considered impaired, the finance receivable is written down to its estimated net realizable value based on the estimated liquidation value of the underlying collateral. The amount of the write-down causes an equal portion of the allowance for credit losses to be reserved for the impaired receivable. A prior write-down may be adjusted, in whole or in part, when the company determines that circumstances relating to collectability of the receivable or the value of the underlying collateral have changed. This amount will also be adjusted by any resulting recoveries related to the finance receivable. The amount remaining after the aforementioned adjustments becomes a charge-off when the receivable is either settled or the collateral is foreclosed upon.
Portfolio yield—finance income divided by average finance receivables for a given period, stated as a percentage.
37
Table of Contents
Return on average assets (“ROAA”)—net income divided by average assets for a given period, stated as a percentage. Average assets is the average of total assets at the beginning and end of a given period.
Return on average equity (“ROAE”)—net income divided by average equity for a given period, stated as a percentage. Average equity is the average of total shareholders’ equity at the beginning and end of a given period.
Risk-adjusted net interest margin—net finance income divided by average finance receivables for a given period, stated as a percentage.
Total non-performing assets—the sum of non-accrual finance receivables plus repossessed assets. Non-accrual finance receivables are the aggregate recorded value of finance receivables that have been placed on non-accrual. Finance receivables are placed on non-accrual upon the determination by management that collection of the outstanding receivable is not probable. Finance receivables may be removed from non-accrual status when doubts of collection are resolved. Repossessed assets are finance receivables whose collateral becomes subject to foreclosure and are removed from finance receivables and are reclassified as repossessed assets once title clears to us. Repossessed assets are initially recorded at fair value based on the estimated liquidation value of the collateral. Assets received to satisfy finance receivables (repossessed equipment, included in other assets) are initially written-down to our estimate of fair value by a charge to the allowance for credit losses. Subsequent to foreclosure, valuations are periodically performed by management and the assets are carried at the lower of the carrying amount or fair value, and any subsequent recoveries or write-downs are recorded as gains or losses in income.
Basis of presentation
Our fiscal year is the period beginning on April 1 and ending on March 31. The three completed fiscal years discussed in this “Management’s discussion and analysis of financial condition and results of operations” ended on March 31, 2012, 2013 and 2014. The two interim periods results discussed in the “Management’s discussion and analysis of financial condition and results of operations” are the nine-month periods ended December 31, 2013 and 2014. For ease of reference, we identify our fiscal years in this prospectus by reference to the calendar year in which the fiscal year ends. For example, “fiscal 2012” refers to our fiscal year ended March 31, 2012. Fiscal 2012 consists of 366 days and fiscal 2013 and 2014 consist of 365 days. The differing length of certain fiscal years may affect the comparability of certain data.
This prospectus contains the historical financial statements and other financial information of Commercial Credit Group Inc., which was recently acquired by and became a wholly-owned subsidiary of Commercial Credit, Inc. Commercial Credit, Inc.’s common shares are being offered hereby. Commercial Credit, Inc. is a newly formed holding company and to date has engaged to date only in activities incidental to its formation, the corporate reorganization and the initial public offering of our common shares. The consolidated financial statements of Commercial Credit, Inc. for the period ended December 31, 2014 include the financial results of Commercial Credit Group Inc., its wholly-owned subsidiary, as a result of the corporate reorganization that became effective as of December 12, 2014. For periods prior to December 12, 2014, this prospectus only includes consolidated financial statements of Commercial Credit Group Inc. and not Commercial Credit, Inc., as Commercial Credit, Inc. did not have any material assets, liabilities or operations other than nominal organizational expenses until it completed the corporate reorganization. See “Prospectus summary—Corporate reorganization.” We have made rounding adjustments to some of the figures included in this prospectus. Accordingly, numerical figures shown as totals in some tables may not be an arithmetic aggregation of the figures that preceded them.
38
Table of Contents
Finance receivables and asset quality
As of and for the nine months ended December 31, 2014 versus as of and for the nine months ended December 31, 2013
As of December 31, 2014, we had total finance receivables outstanding of $611.5 million which increased by $140.2 million, or 29.8%, from December 31, 2013. The increase was due to a higher rate of contract originations in this nine-month period as a result of our addition of sales and marketing staff in new geographic regions and somewhat due to slightly better level of economic activity for our customers. The following tables set forth certain key performance measures relating to the quality of our finance receivables portfolio.
| Nine months ended December 31, 2013 |
Nine months ended December 31, 2014 |
$ Change | % Change | |||||||||||||
| (in thousands, except for percentages) | ||||||||||||||||
| Finance receivables* |
$ | 471,226 | $ | 611,467 | $ | 140,241 | 29.8% | |||||||||
| Average finance receivables |
427,564 | 556,255 | 128,691 | 30.1% | ||||||||||||
| Originations |
255,757 | 332,821 | 77,065 | 30.1% | ||||||||||||
|
|
||||||||||||||||
| * | End of period |
| As of December 31, 2013 |
As of December 31, 2014 |
$ Change | ||||||||||
| (in thousands) | ||||||||||||
| Allowance for credit losses |
$ | 6,565 | $ | 7,138 | $ | 572 | ||||||
| Non-accrual finance receivables |
13,455 | 18,886 | 5,431 | |||||||||
| Repossessed assets |
4,427 | 3,231 | (1,196 | ) | ||||||||
| Total non-performing assets |
17,882 | 22,117 | 4,236 | |||||||||
| Delinquent finance receivables |
15,474 | 22,171 | 6,697 | |||||||||
| Net write-downs* |
964 | 1,129 | 165 | |||||||||
|
|
||||||||||||
| * | For the nine-month period ended |
| As of December 31, 2013 |
As of December 31, 2014 |
Change in percentage |
||||||||||
| As a percentage of finance receivables: |
||||||||||||
| Allowance for credit losses |
1.4% | 1.2% | (0.2)% | |||||||||
| Non-accrual finance receivables |
2.9% | 3.1% | 0.2% | |||||||||
| Repossessed assets |
0.9% | 0.5% | (0.4)% | |||||||||
| Total non-performing assets |
3.8% | 3.6% | (0.2)% | |||||||||
| Delinquent finance receivables |
3.3% | 3.6% | 0.3% | |||||||||
| Loss ratio* |
0.30% | 0.27% | (0.03)% | |||||||||
|
|
||||||||||||
| * | As a percentage of average finance receivables; note: annualized |
Our allowance for credit losses increased from $6.6 million for the nine months ended December 31, 2013 to $7.1 million in the nine months ended December 31, 2014 and the allowance for credit losses as a percentage of finance receivables, or allowance level, decreased to 1.2% of finance receivables from 1.4%. The increase in the allowance for credit losses was due to the increased level of finance receivables. The allowance level declined slightly due generally to a more favorable economic environment which resulted in slightly lower levels of net write-downs.
39
Table of Contents
Total non-performing assets increased from $17.9 million in the nine months ended December 31, 2013 to $22.1 million in the nine months ended December 31, 2014. As a percentage of finance receivables, total non-performing assets decreased by 0.2% to 3.6% in the nine months ended December 31, 2014 from 3.8% for the nine months ended December 31, 2013. The period over period increase in total non-performing assets was the result of an increase in the number and amount of finance receivables which were placed on non-accrual status as a result of their delinquency measurement during this period.
Delinquent finance receivables increased from $15.5 million in the nine months ended December 31, 2013 to $22.2 million in the nine months ended December 31, 2014. As a percentage of finance receivables, delinquent finance receivables were 3.3% in the nine months ended December 31, 2013 and 3.6% for the nine months ended December 31, 2014. The additional amount of delinquent finance receivables was the result of the migration of several contracts through the delinquency cycle and the overall growth in total finance receivables.
Net write-downs increased slightly from $1.0 million to $1.1 million in the nine months ended December 31, 2013 and 2014. Net write-downs as a percentage of average finance receivables (or loss ratio) decreased to 0.27% in the nine months ended December 31, 2014 from 0.30% in the nine months ended December 31, 2013. The slight decrease in the loss ratio was due to the higher overall amount of total finance receivables.
As of and for the year ended March 31, 2014 versus as of and for the year ended March 31, 2013
As of March 31, 2014, we had total finance receivables outstanding of $501.0 million which increased by $117.1, or 30.5%, from March 31, 2013 to the end of fiscal 2014. We originated $357.3 million of finance receivables in fiscal 2014 compared to $251.7 million in fiscal 2013 due to our continuing penetration into existing markets and expansion into new geographic markets. The following tables set forth certain key performance measures relating to the quality of our finance receivables portfolio.
| Year ended March 31, | ||||||||||||||||
| 2013 | 2014 | $ Change | % Change | |||||||||||||
| (in thousands, except for percentages) | ||||||||||||||||
| Finance receivables* |
$ | 383,902 | $ | 501,042 | $ | 117,141 | 30.5% | |||||||||
| Average finance receivables |
352,080 | 442,472 | 90,392 | 25.7% | ||||||||||||
| Originations |
251,683 | 357,313 | 105,631 | 42.0% | ||||||||||||
|
|
||||||||||||||||
| * | End of period |
| As of March 31, | ||||||||||||
| 2013 | 2014 | $ Change | ||||||||||
| (in thousands) | ||||||||||||
| Allowance for credit losses |
$ | 5,389 | $ | 6,359 | $ | 970 | ||||||
| Non-accrual finance receivables |
11,372 | 16,102 | 4,730 | |||||||||
| Repossessed assets |
4,232 | 5,942 | 1,710 | |||||||||
| Total non-performing assets |
15,604 | 22,045 | 6,441 | |||||||||
| Delinquent finance receivables |
11,382 | 10,841 | (541 | ) | ||||||||
| Net write-downs* |
934 | 1,371 | 436 | |||||||||
|
|
||||||||||||
| * | For the year ended |
40
Table of Contents
| As of March 31, | Change in percentage |
|||||||||||
| 2013 | 2014 | |||||||||||
| As a percentage of finance receivables: |
||||||||||||
| Allowance for credit losses |
1.4% | 1.3% | (0.1)% | |||||||||
| Non-accrual finance receivables |
3.0% | 3.2% | 0.3% | |||||||||
| Repossessed assets |
1.1% | 1.2% | 0.1% | |||||||||
| Total non-performing assets |
4.1% | 4.4% | 0.3% | |||||||||
| Delinquent finance receivables |
3.0% | 2.2% | (0.8)% | |||||||||
| Loss ratio* |
0.27% | 0.31% | 0.04% | |||||||||
|
|
||||||||||||
| * | As a percentage of average finance receivables |
Our allowance for credit losses increased from $5.4 million in fiscal year 2013 to $6.4 million in fiscal year 2014 and the allowance level decreased to 1.3% of finance receivables from 1.4%. The increase in the allowance for credit losses resulted from the growth in finance receivables over the period reflecting the necessary increase in provisions related to such growth.
Total non-performing assets increased by $6.4 million to $22.0 million in fiscal 2014 from $15.6 million in fiscal 2013. Total non-performing assets as a percentage of finance receivables increased by 0.3% to 4.4% in fiscal 2014 from 4.1% in fiscal 2013. The increase was due to the number and amount of contracts that were placed on non-accrual status at this period end resulting from their delinquency performance over this period.
Delinquent finance receivables decreased from $11.4 million in fiscal 2013 to $10.8 million in fiscal 2013 and, as a percentage of finance receivables, decreased from 3.0% in fiscal 2013 to 2.2% in fiscal 2014 which we believe was largely due to moderately improving economic conditions.
Net write-downs increased to $1.4 million in fiscal 2014 from $0.9 million in fiscal 2013. Our net write-downs as a percentage of average finance receivables (or loss ratio) increased to 0.31% in fiscal 2014 from 0.27% in fiscal 2013. The increase was due to both an increase in the number and amount of write-downs which occurred in this period consistent with the higher overall amount of total finance receivables.
Results of operations
Comparison of nine months ended December 31, 2013 and 2014
| Nine months ended December 31, |
$ Change | % Change | ||||||||||||||
| 2013 | 2014 | |||||||||||||||
| ($ in thousands, except for %) | ||||||||||||||||
| Finance income |
$ | 33,804 | $ | 41,109 | $ | 7,305 | 21.6% | |||||||||
| Interest expense |
11,622 | 11,850 | 228 | 2.0% | ||||||||||||
|
|
|
|||||||||||||||
| Net finance income before provision for credit losses on finance receivables |
22,182 | 29,259 | 7,077 | 31.9% | ||||||||||||
| Provision for credit losses on finance receivables |
2,098 | 1,700 | (398) | (19.0)% | ||||||||||||
|
|
|
|||||||||||||||
| Net finance income |
20,084 | 27,559 | 7,475 | 37.2% | ||||||||||||
|
|
|
|||||||||||||||
| Compensation and benefits |
5,389 | 7,608 | 2,219 | 41.2% | ||||||||||||
| Other operating expenses |
3,846 | 5,110 | 1,265 | 32.9% | ||||||||||||
|
|
|
|||||||||||||||
| Income before income taxes |
10,850 | 14,841 | 3,992 | 36.8% | ||||||||||||
|
|
|
|||||||||||||||
| Provision for income taxes |
4,291 | 5,812 | 1,521 | 35.4% | ||||||||||||
|
|
|
|||||||||||||||
| Net income |
$ | 6,559 | $ | 9,029 | $ | 2,471 | 37.7% | |||||||||
|
|
||||||||||||||||
41
Table of Contents
| Nine months
ended December 31, |
||||||||||||
| 2013 | 2014 | % Change | ||||||||||
| Key performance indicators*: |
||||||||||||
| Portfolio yield |
10.5% | 9.9% | (0.7% | ) | ||||||||
| Total cost of funds |
3.9% | 3.0% | (0.9% | ) | ||||||||
| Net interest margin |
6.9% | 7.0% | 0.1% | |||||||||
| Risk-adjusted net interest margin |
6.3% | 6.6% | 0.3% | |||||||||
| Operating expense ratio |
2.9% | 3.0% | 0.2% | |||||||||
| ROAA |
1.9% | 2.0% | 0.1% | |||||||||
| ROAE |
18.6% | 21.1% | 2.6% | |||||||||
|
|
||||||||||||
| * | Note: annualized |
Finance income. Finance income increased by $7.3 million, or 21.6%, to $41.1 million for the nine months ended December 31, 2014 from $33.8 million for the nine months ended December 31, 2013 because of the growth in the average finance receivables. The increase in finance income is primarily reflective of our sales force and geographic expansion which led to a greater number of funded transactions. This increase was partially offset by a decrease of 0.7% in the portfolio yield which was primarily due to lower yielding new business.
Interest expense. Interest expense increased by $0.2 million, or 2.0%, to $11.9 million for the nine months ended December 31, 2014 from $11.6 million for the nine months ended December 31, 2013. We incurred additional interest expense due to higher amounts of debt required to fund the growth in finance receivables. The increase in the amount of total interest expense period over period was mitigated by a lower interest rate on our debt.
Net finance income before provision for credit losses on finance receivables. Net finance income before provision for credit losses on finance receivables increased by $7.1 million, or 31.9%, to $29.3 million for the nine months ended December 31, 2014 from $22.2 million for the nine months ended December 31, 2013. This increase was principally the result of the growth in finance receivables over this period. Our net interest margin increased slightly to 7.0% for the nine months ended December 31, 2014 from 6.9% for the nine months ended December 31, 2013 as a result of the decline in the total cost of funds for the comparable period even though the portfolio yield declined slightly in the most recent period due to lower yielding new business.
Provision for credit losses on finance receivables. Provision for credit losses on finance receivables decreased from $2.1 million for the nine months ended December 31, 2013 to $1.7 million for the nine months ended December 31, 2014. The total allowance decreased over the period as a result of the lower level of net charge-offs, as percent of finance receivables, experienced by the company during the period.
Compensation and benefits. Compensation and benefits increased by $2.2 million, or 41.2%, to $7.6 million for the nine months ended December 31, 2014 from $5.4 million for the nine months ended December 31, 2013. We are a growth company and, as such, have been investing heavily in our human resources and expanding our markets. This increase was mainly due to the number of employees increasing 15.4% to 120 at the end of the nine months ended December 31, 2014 from 104 at the end of the nine months ended December 31, 2013. Despite the larger employee expense, our operating expense ratio was only slightly higher at 3.0% for the nine months ended December 31, 2014 from 2.9% for the nine months ended December 31, 2013 because we were able to spread the cost of operating our business over a higher amount of finance receivables.
42
Table of Contents
Other operating expenses. Other operating expenses increased by $1.3 million, or 32.9%, to $5.1 million for the nine months ended December 31, 2014 from $3.8 million for the nine months ended December 31, 2013. The
increase was due to the company’s expansion in Canada, expansion of its offices in Buffalo, New York and Naperville, Illinois, and increased costs related to sales and marketing, collection, and credit processing fees required to support the growth in finance receivables and credit submissions in this period compared to the prior period.
Provision for income taxes. Provision for income taxes increased by $1.5 million to $5.8 million for the nine months ended December 31, 2014 from $4.3 million for the nine months ended December 31, 2013 because of a higher amount of net income from operations. Our effective tax rate was 39.2% for the nine months ended December 31, 2014 and 39.6% for the nine months ended December 31, 2013 and the change was largely due to the impact of our developing operations in Canada.
Net income. As a result of the factors described above, net income increased by $2.5 million, or 37.7%, to $9.0 million for the nine months ended December 31, 2014 from $6.6 million for the nine months ended December 31, 2013. ROAA increased slightly to 2.0% for the nine months ended December 31, 2014 from 1.9% for the nine months ended December 31, 2013 while ROAE increased to 21.1% for the nine months ended December 31, 2014 from 18.6% for the nine months ended December 31, 2013. The increase in ROAE was the result of the increased level of net income and the fact that we operated at a higher level of leverage for this period compared to the prior period.
Comparison of fiscal 2013 to fiscal 2014
| Fiscal year
ended March 31, |
||||||||||||||||
| 2013 | 2014 | $ Change | % Change | |||||||||||||
| ($ in thousands, except for %) | ||||||||||||||||
| Finance income |
$ | 40,226 | $ | 45,806 | $ | 5,580 | 13.9% | |||||||||
| Interest expense |
16,546 | 15,586 | (960 | ) | (5.8% | ) | ||||||||||
|
|
|
|||||||||||||||
| Net finance income before provision for credit losses on finance receivables |
23,680 | 30,220 | 6,540 | 27.6% | ||||||||||||
| Provision for credit losses on finance receivables |
1,825 | 2,348 | 523 | 28.6% | ||||||||||||
|
|
|
|||||||||||||||
| Net finance income |
21,855 | 27,872 | 6,018 | 27.5% | ||||||||||||
|
|
|
|||||||||||||||
| Compensation and benefits |
6,724 | 8,009 | 1,285 | 19.1% | ||||||||||||
| Other operating expenses |
3,893 | 4,259 | 366 | 9.4% | ||||||||||||
|
|
|
|||||||||||||||
| Income before income taxes |
11,238 | 15,605 | 4,367 | 38.9% | ||||||||||||
|
|
|
|||||||||||||||
| Provision for income taxes |
4,380 | 6,255 | 1,875 | 42.8% | ||||||||||||
|
|
|
|||||||||||||||
| Net income |
$ | 6,857 | $ | 9,349 | 2,492 | 36.3% | ||||||||||
|
|
||||||||||||||||
| Fiscal year ended March 31, |
Change in percentage |
|||||||||||
| 2013 | 2014 | |||||||||||
| Key performance indicators: |
||||||||||||
| Portfolio yield |
11.4% | 10.4% | (1.1% | ) | ||||||||
| Total cost of funds |
5.1% | 3.8% | (1.3% | ) | ||||||||
| Net interest margin |
6.7% | 6.8% | 0.1% | |||||||||
| Risk-adjusted net interest margin |
6.2% | 6.3% | 0.1% | |||||||||
| Operating expense ratio |
3.0% | 2.8% | (0.2% | ) | ||||||||
| ROAA |
1.8% | 2.0% | 0.1% | |||||||||
| ROAE |
17.0% | 19.3% | 2.3% | |||||||||
|
|
||||||||||||
43
Table of Contents
Finance income. Finance income increased by $5.6 million, or 13.9%, to $45.8 million in fiscal 2014 from $40.2 million in fiscal 2013 because average finance receivables also increased $90.4 million, or 25.7%, to $442.5 million in fiscal 2014 from $352.1 million in fiscal 2013. The increase in finance income is reflective of our sales force and geographic expansion which led to a greater number of funded transactions. This increase was partially offset by a decrease of 1.1% in the portfolio yield which was primarily due to lower yielding new business as a result of the competitive environment.
Interest expense. Interest expense decreased by $1.0 million, or 5.8%, to $15.6 million in fiscal 2014 from $16.5 million in fiscal 2013, despite us carrying larger aggregate debt balances. This reduction was due to lower total cost of funds on our revolving credit facilities and an increased proportion of receivables financed by our term securitization facilities which generally have lower interest rates than our credit facilities.
Net finance income before provision for credit losses on finance receivables. Net finance income before provision for credit losses on finance receivables increased by $6.5 million, or 27.6%, to $30.2 million in fiscal 2014 from $23.7 million in fiscal 2013 as a result of the increase in finance income and average finance receivables and the decrease in interest expense described above. Our net interest margin increased slightly to 6.8% in fiscal 2014 from 6.7% in fiscal 2013 as our lower total cost of funds more than offset a lower portfolio yield.
Provision for credit losses on finance receivables. Provision for credit losses on finance receivables increased by $0.5 million, or 28.6%, to $2.3 million in fiscal 2014 from $1.8 million in fiscal 2013 consistent with the growth in finance receivables.
Compensation and benefits. Compensation and benefits increased by $1.3 million, or 19.1%, to $8.0 million in fiscal 2014 from $6.7 million in fiscal 2013. We are a growth company and, as such, have been investing heavily in our human resources. This increase was mainly due to the number of employees increasing 23.6% to 110 at the end of fiscal 2014 from 89 at the end of fiscal 2013. Despite the larger employee expense, our operating expense ratio improved to 2.8% in fiscal 2014 from 3.0% in fiscal 2013 as fixed expenses were spread over the larger amount of finance receivables.
Other operating expenses. Other operating expenses increased by $0.4 million, or 9.4%, to $4.3 million in fiscal 2014 from $3.9 million in fiscal 2013. The increase was the result of additional sales and marketing and credit and collection costs required to support the higher level of finance receivables.
Provision for income taxes. Provision for income taxes increased by $1.9 million to $6.3 million in fiscal 2014 from $4.4 million in fiscal 2013 because of the increase in net income. Our effective tax rate was 40.1% in fiscal 2014 and 39.0% in fiscal 2013.
Net income. For the reasons described above, net income increased by $2.5 million, or 36.3%, to $9.3 million in fiscal 2014 from $6.9 million in fiscal 2013. ROAA increased slightly to 2.0% in fiscal 2014 from 1.8% in fiscal 2013 while ROAE increased to 19.3% in fiscal 2014 from 17.0% in fiscal 2013 due to higher profitably and to a lesser extent an improved operating expense ratio.
44
Table of Contents
Comparison of fiscal 2012 to fiscal 2013
| Fiscal year
ended March 31, |
||||||||||||||||
| 2012 | 2013 | $ Change | % Change | |||||||||||||
| ($ in thousands, except for percentages) | ||||||||||||||||
| Finance income |
$ | 33,206 | $ | 40,226 | $7,020 | 21.1% | ||||||||||
| Interest expense |
15,353 | 16,546 | 1,193 | 7.8% | ||||||||||||
|
|
|
|||||||||||||||
| Net finance income before provision for credit losses on finance receivables |
17,852 | 23,680 | 5,827 | 32.6% | ||||||||||||
| Provision for credit losses on finance receivables |
1,975 | 1,825 | (150 | ) | (7.6% | ) | ||||||||||
|
|
|
|||||||||||||||
| Net finance income |
15,877 | 21,855 | 5,977 | 37.6% | ||||||||||||
|
|
|
|||||||||||||||
| Compensation and benefits |
4,348 | 6,724 | 2,376 | 54.6% | ||||||||||||
| Other operating expenses |
3,543 | 3,893 | 350 | 9.9% | ||||||||||||
|
|
|
|||||||||||||||
| Income before income taxes |
7,986 | 11,238 | 3,252 | 40.7% | ||||||||||||
|
|
|
|||||||||||||||
| Provision for income taxes |
3,124 | 4,380 | 1,256 | 40.2% | ||||||||||||
|
|
|
|||||||||||||||
| Net income |
$ | 4,861 | $ | 6,857 | 1,996 | 41.1% | ||||||||||
|
|
||||||||||||||||
| Fiscal year ended March 31, |
Change in percentage |
|||||||||||
| 2012 | 2013 | |||||||||||
| Key performance indicators: |
||||||||||||
| Portfolio yield |
11.7% | 11.4% | (0.3% | ) | ||||||||
| Total cost of funds |
5.8% | 5.1% | (0.7% | ) | ||||||||
| Net interest margin |
6.3% | 6.7% | 0.4% | |||||||||
| Risk-adjusted net interest margin |
5.6% | 6.2% | 0.6% | |||||||||
| Operating expense ratio |
2.8% | 3.0% | 0.2% | |||||||||
| ROAA |
1.6% | 1.8% | 0.2% | |||||||||
| ROAE |
14.4% | 17.0% | 2.6% | |||||||||
|
|
||||||||||||
Finance income. Finance income increased by $7.0 million, or 21.1%, to $40.2 million in fiscal 2013 from $33.2 million in fiscal 2012 because average finance receivables increased by $68.6 million to $352.1 million in fiscal 2013 from $283.5 million in fiscal 2012. The increase in finance income is reflective of our sales force and geographic expansion which led to a greater number of funded transactions. Our portfolio yield on finance receivables remained relatively constant with a slight decrease of 0.3% from 11.7% in fiscal 2012 to 11.4% in fiscal 2013. The decrease was due to lower yielding new business.
Interest expense. Interest expense increased $1.2 million to $16.5 million in fiscal 2013 from $15.4 million in fiscal 2012. This increase was due to larger aggregate debt balances in fiscal 2013 compared to fiscal 2012, offset in part by lower interest rates on our revolving credit facilities and an increased proportion of receivables financed in term securitization facilities which generally have lower interest rates than our other credit facilities.
Net finance income before provision for credit losses on finance receivables. Net finance income before provision for credit losses on finance receivables increased $5.8 million to $23.7 million in fiscal 2013 from $17.9 million in fiscal 2012 as the increase in finance income more than offset the increase in interest expense. Our net interest margin increased from 6.3% in fiscal 2012 to 6.7% in fiscal 2013 as our lower total cost of funds offset a lower portfolio yield.
45
Table of Contents
Provision for credit losses on finance receivables. Provision for credit losses on finance receivables decreased by $0.2 million, or 7.6%, to $1.8 million in fiscal 2013 from $2.0 million in fiscal 2012, reflective of an improving economy.
Compensation and benefits. Compensation and benefits increased $2.4 million, or 54.6%, to $6.7 million in fiscal 2013 from $4.3 million in fiscal 2012. We are a growth company and, as such, have been investing heavily in our human resources. This increase was mainly due to the number of employees increasing 48.3% to 89 at the end of fiscal 2013 from 60 at the end of fiscal 2012. As a result of the higher employee expense, our operating expense ratio declined to 3.0% in fiscal 2013 from 2.8% in fiscal 2012.
Other operating expenses. Other operating expenses increased by $0.4 million, or 9.9%, to $3.9 million in fiscal 2013 from $3.5 million in fiscal 2012. This increase resulted from the establishment of a field sales and operational support office in Buffalo, New York as well as additional costs related to sales and marketing, collection, and credit processing fees required to support the growth in finance receivables and credit submissions in this period compared to the prior period.
Provision for income taxes. Provision for income taxes increased by $1.3 million to $4.4 million in fiscal 2013 from $3.1 million in fiscal 2012 because of the increase in net income. Our effective tax rate was 39.0% in fiscal 2013 and 39.1% in fiscal 2012.
Net income. As a result of the factors described above, net income increased by $2.0 million, or 41.1%, to $6.9 million in fiscal 2013 from $4.9 million in fiscal 2012. ROAA increased slightly to 1.8% in fiscal 2013 from 1.6% in fiscal 2012 due to our net income increasing at a greater rate than our average assets. ROAE increased to 17.0% in fiscal 2013 from 14.4% in fiscal 2012 due to our net income increasing at a greater rate than our average equity. Additionally, our company operated at a higher level of leverage for this period compared to the prior period.
Liquidity and capital resources
In this section, we describe our need for raising capital (debt and equity), our need to maintain a substantial amount of liquidity (meaning available cash and the amount of funds that are available for us to borrow at any given time), how we manage liquidity and our funding sources. Key indicators of our liquidity are leverage (total senior debt divided by total shareholders’ equity and subordinated debt), available liquidity, and the scheduled maturities of our outstanding debt. We have been successful in issuing debt that has staggered maturities and is diversified in terms of lending source (including commercial banks and institutional investors) and the type of indebtedness (including revolving credit facilities and term asset backed securities). We are not dependent on any one of our funding sources or providers. We believe that these sources of liquidity and capital will be sufficient to finance our continued operations for at least the next twelve months.
Our asset securitization revolving and term financing facilities require that funds received from obligors be retained in a specific account related to that particular financing facility. As customer payments are received, they are deposited in a lockbox account. The lockbox account is governed by an intercreditor agreement. As the payments are applied to each contract they are transferred from the lockbox account to a specific account for each facility. Funds in this account are then distributed on a monthly basis in accordance with the provisions related to that facility. As such, the level of restricted cash does not impact our liquidity or working capital as it represents payments to reduce indebtedness on these facilities on a monthly basis that would ordinarily have occurred during the month if such facilities allowed daily repayment.
Our leverage increased to 5.8x at December 31, 2014 from 5.2x at March 31, 2014 because we have continued to utilize available debt capital, including borrowing under credit facilities, to finance the growth of our finance receivables. As a result, our debt increased by $97.9 million, or 20.4%, to $577.3 million at December 31, 2014
46
Table of Contents
from $479.4 million at March 31, 2014. The growth in debt was greater than the growth in stockholders’ equity, which increased by $8.9 million, or 17.0%, to $61.5 million at December 31, 2014 from $52.6 million at March 31, 2014.
Our leverage increased to 5.2x at March 31, 2014 from 4.1x at March 31, 2013 because we have continued to utilize available capital, including borrowing under credit facilities, to finance the growth of our finance receivables. As a result, our debt increased by $128.7 million, or 36.7%, to $479.4 million in fiscal 2014 from $350.7 million in fiscal 2013. The growth in debt was greater than the growth in stockholders’ equity which increased by $8.2 million, or 18.5%, to $52.6 million in fiscal 2014 from $44.4 million in fiscal 2013.
Liquidity and access to capital are vital to our operations and growth. We need continued availability of funds to originate or acquire finance receivables and to repay our debt. To ensure we have enough liquidity, we project our financing needs based on estimated receivables growth and maturing debt, monitor capital markets closely, diversify our funding sources and stagger our debt maturities.
Funding sources usually available to us include operating cash flow, issuances of term debt, committed revolving bank credit facilities, and conduit and term securitizations of finance receivables, as well as sales of common and preferred equity. These external funding sources may not be available to us or may only be available at unfavorable terms because of conditions in the credit markets or the economy in general, or in the event that financial covenants are breached. At December 31, 2014, we had $460.0 million of total commitments under revolving credit facilities and have utilized $267.5 million of this commitment. Utilization of these facilities is subject to a borrowing base. In addition, at December 31, 2014, we had $276.8 million of amortizing term securitization indebtedness and $33.0 million of senior subordinated notes outstanding.
As of December 31, 2014, we had two term asset-backed securitizations. These transactions originally raised total proceeds of $459.9 million. The first transaction was privately placed in April 2013 and totaled $194.5 million, of which $55.1 million was rated A-1+ (sf) and R-1 (h) (sf), and $124.3 million was rated AAA (sf) and $15.1 million was rated A(sf) by S&P and DBRS, respectively. The second transaction was privately placed in May 2014 and totaled $265.4 million, of which $72.4 million was rated A-1+(sf) and R-1(h)(sf), and $177.1 million was rated AAA (sf) and $15.8 million was rated A(sf) by S&P and DBRS, respectively.
In addition to these securitization transactions, we also issued two series of asset backed securities, one in January 2011 for $63.7 million and one in February 2012 for $105 million, to institutional investors. The first series was rated A(sf) by DBRS and the second series was rated A(sf) by DBRS and S&P. These notes were fully repaid as of December 31, 2014.
We believe utilizing fixed rate, term asset-backed securitizations to fund our finance receivables best matches the term and interest rate characteristics of our assets, thereby limiting our susceptibility to these risks.
Net cash provided by (used in)(1):
| For the fiscal year ended March 31, |
For the nine
months ended December 31, |
|||||||||||||||||||
| 2012 | 2013 | 2014 | 2013 | 2014 | ||||||||||||||||
| ($ in thousands) | ||||||||||||||||||||
| Operating activities |
$ | 14,969 | $ | 15,753 | $ | 17,793 | $ | 13,840 | $ | 16,112 | ||||||||||
| Investing activities |
$ | (85,021 | ) | $ | (66,085 | ) | $ | (141,663 | ) | $ | (99,253 | ) | $ | (108,735 | ) | |||||
| Financing activities |
$ | 70,052 | $ | 50,332 | $ | 123,861 | $ | 89,676 | $ | 95,763 | ||||||||||
| Net change in cash and cash equivalents |
$ | — | $ | — | $ | (9 | ) | $ | 4,262 | $ | 3,033 | |||||||||
|
|
||||||||||||||||||||
| (1) | We maintained a consistent fixed level of cash at fiscal year end for each of these periods of approximately $1.0 million as amounts in excess of this amount were used to repay senior debt or fund finance receivables. |
47
Table of Contents
Cash flows from operating activities
Net cash provided by operating activities increased by $2.3 million to $16.1 million in the nine months ended December 31, 2014 from $13.8 million in the nine months ended December 31, 2013. The change is the result of the higher level of net income and a higher level of amortization of financing costs.
Net cash provided by operating activities increased by $2.0 million to $17.8 million in fiscal 2014 compared to $15.8 million in fiscal 2013. The increase was due to higher overall net income which was partially offset by an increase in the provision for credit losses which was necessitated by the overall growth in finance receivables.
Net cash provided by operating activities increased by $0.8 million to $15.8 million in fiscal 2013 from $15.0 million in fiscal 2012 largely due to increased net income, which was offset somewhat by an increase in the provision for credit losses that resulted from growth in finance receivables.
Cash flows from investing activities
Net cash used in investing activities includes our lending activity in connection with the origination of finance receivables, net of any payments received on financing receivables, proceeds received from repossessed asset sales, as well as restricted cash. Restricted cash consists of amounts collected by us from our obligors and segregated for repayment of our credit facilities. Net cash used in investing activities increased by $9.5 million to $108.7 million in the nine months ended December 31, 2014 from $99.3 million in the nine months ended December 31, 2013 as a result of a higher level of origination of finance receivables compared to the prior period.
Net cash used in investing activities increased by $75.6 million from $66.0 million in fiscal 2013 to $141.7 million in fiscal 2014. This increase was due to an increase of $54.7 million in origination lending activity, net of any payments received on finance receivables, and an increase of $17.9 million in restricted cash which resulted from an increase in the overall payment activity from obligors due to a higher level of finance receivables than in fiscal 2013.
Net cash used in investing activities decreased by $18.9 million from $85.0 million in fiscal 2012 to $66.1 million in fiscal 2013. This decrease was due to a lower rate of growth in finance receivables in fiscal 2013 compared to the growth that occurred in fiscal 2012. In fiscal 2013, the amount of cash used to fund the increase in finance receivables, net of any repayments and prepayments during the period, was $62.0 million compared to $77.0 million in fiscal 2012.
Cash flows from financing activities
Net cash provided by financing activities increased by $6.1 million to $95.8 million in the nine months ended December 31, 2014 from $89.7 million in the nine months ended December 31, 2013, resulting from a higher amount of debt financing used to fund finance receivable originations.
Net cash provided by financing activities increased by $73.5 million to $123.9 million in fiscal 2014 from $50.3 million in fiscal 2013 due to our increased utilization of borrowings under our financing facilities and the issuance of additional amounts of asset backed term securities. These additional borrowings were utilized to fund the net increase in the level of finance receivables that were originated during this period.
Net cash provided by financing activities declined by $19.7 million to $50.3 million for fiscal 2013 from $70.1 million in fiscal 2012. In fiscal 2013, compared to fiscal 2012, cash supplied by financing activities was $20 million lower, largely as a result of a lower net increase in finance receivables that took place in this year, compared to that which occurred in fiscal 2012 as a result of the higher repayments and prepayments in the fiscal 2013 period.
48
Table of Contents
Debt facilities
Bank borrowings
We have an $80.0 million committed secured revolving credit facility that matures in January 2017 with a one year amortization period. At December 31, 2014, we had $54.6 million outstanding under this facility. We are able to borrow or repay this facility during the committed revolving period. As such, we utilize this facility to finance the origination of finance receivables and then either transfer and assign the finance receivables on a periodic basis to the asset securitization facilities discussed below or continue to finance them in this facility. At the end of the revolving period, if the facility is not renewed, the amounts outstanding amortize in proportion to the underlying receivables included in the facility. The amortization period is one year. The revolving credit facility contains certain financial covenants which, among other things, require the company to maintain minimum debt-to-net worth ratios, interest coverage ratios and minimum net worth. In addition, the agreement contains certain restrictions which, among other things, limit the incurrence of additional indebtedness and limitations on the payment of dividends or distributions.
Asset securitization borrowings—revolving
We had three revolving asset securitization facilities totaling $380.0 million at December 31, 2014 that provide for committed revolving financing for periods ranging from 12 to 25 months. At December 31, 2014, $212.8 million was outstanding under these three facilities. Additionally, we will, from time to time, consolidate the finance receivables included in these facilities and refinance them with term asset backed security transactions and utilize the proceeds to repay borrowings under the revolving facilities. If the facilities are not renewed at their respective maturity dates, the borrowings convert into amortizing term debt. The amortizing term debt would be repaid monthly from collections of securitized receivables. The amortization periods range from one to three years depending on the facility. At the conclusion of the applicable amortization period, the full remaining amount is due. Borrowings under these facilities are without recourse to us, except to the extent of the finance receivables securing such facilities.
In addition, on February 23, 2015, the Company established a new revolving asset securitization facility that provides for a committed revolving financing of $100.0 million through August 2016. At March 31, 2015, the company had $38.8 million outstanding under this facility.
Our other asset securitization facilities might be renewed, extended or increased before they expire. These facilities may terminate if the loss ratio on securitized receivables or delinquent receivables exceeds certain levels in addition to other requirements.
Asset securitization borrowings—term
We had two amortizing term debt facilities totaling $276.8 million outstanding at December 31, 2014. The monthly repayment amounts on the notes issued under these facilities vary based on the amount of securitized receivables collected on the pool of receivables securing these borrowings. The notes are nonrecourse to us, except to the extent of the finance receivables securing such facilities.
Senior subordinated notes
At December 31, 2014, we had $33.0 million of unsecured senior subordinated notes outstanding, $28.0 million of which is held by Ares Capital Corporation and $5.0 million of which is held by Archbrook Capital Management, LLC, a related party. The senior subordinated notes were originally issued in May 2012, have an interest rate of 12.75% and mature in May 2018. We expect to repay the senior subordinated notes in full with a portion of the proceeds of this offering. See “Use of proceeds.”
49
Table of Contents
The table below summarizes the outstanding principal amount, the revolving period renewal date (if applicable) and the final maturity date for each of the four categories of debt facilities discussed above as of December 31, 2014:
| Total commitment |
Amount outstanding |
Revolving period renewal date |
Final maturity date | |||||||||
| ($ in thousands) | ||||||||||||
| Bank borrowings |
$ | 80,000 | $ | 54,646 | Jan-17 | Jan-18 | ||||||
| Asset securitization borrowings—revolving |
||||||||||||
| CCG Receivables III, LLC |
125,000 | 66,447 | Jun-16 | Jun-18 | ||||||||
| CCG Receivables V, LLC |
130,000 | 74,886 | Dec-15 | Dec-16 | ||||||||
| CCG Receivables VI, LLC |
125,000 | 71,513 | Jan-17 | Jan-20 | ||||||||
|
|
|
|||||||||||
| Total |
$ | 380,000 | $ | 212,846 | ||||||||
| Asset securitization borrowings—term |
||||||||||||
| 2013-1 term asset backed notes |
N/A | $ | 73,355 | N/A | Dec-19 | |||||||
| 2014-1 term asset backed notes |
N/A | 203,485 | N/A | Aug-20 | ||||||||
|
|
|
|||||||||||
| Total |
N/A | $ | 276,840 | |||||||||
| Senior subordinated notes |
N/A | $ | 33,000 | N/A | May-18 | |||||||
| Total debt |
$ | 460,000 | $ | 577,332 | N/A | N/A | ||||||
|
| ||||||||||||
Contractual obligations
The following table is a summary of our significant contractual obligations as of December 31, 2014. As described in more detail in the footnotes, some of the payments are based on projected repayments of receivables and actual payments could vary materially from those depicted in the table below.
| Payments due by period, December 31, 2014 | ||||||||||||||||||||
| Total | Less than 1 year |
1-3 years | 3-5 years | More than 5 years |
||||||||||||||||
| ($ in thousands) | ||||||||||||||||||||
| Bank borrowings(1) |
$ | 54,646 | $ | — | $ | 9,451 | $ | 45,195 | $ | — | ||||||||||
| Asset securitization borrowings—revolving |
||||||||||||||||||||
| CCG Receivables III, LLC(1) |
66,447 | — | 22,914 | 43,533 | — | |||||||||||||||
| CCG Receivables V, LLC(1) |
74,886 | — | 74,886 | — | — | |||||||||||||||
| CCG Receivables VI, LLC(1) |
71,513 | — | 17,663 | 36,603 | 17,248 | |||||||||||||||
|
|
|
|||||||||||||||||||
| Total |
$ | 212,846 | $ | — | $ | 115,463 | 80,135 | 17,248 | ||||||||||||
| Asset securitization borrowings—term |
||||||||||||||||||||
| CCGR Trust 2013-1(2) |
73,355 | 32,370 | 34,016 | 6,857 | 111 | |||||||||||||||
| CCGR Trust 2014-1(2) |
203,485 | 65,702 | 105,097 | 30,374 | 2,312 | |||||||||||||||
|
|
|
|||||||||||||||||||
| Total |
$ | 276,840 | $ | 98,073 | $ | 139,113 | $ | 37,231 | $ | 2,424 | ||||||||||
| Senior subordinated notes |
33,000 | — | 33,000 | — | — | |||||||||||||||
| Office operating lease obligations(3) |
3,972 | 553 | 1,178 | — | 2,241 | |||||||||||||||
|
|
|
|||||||||||||||||||
| $ | 581,304 | $ | 98,626 | $ | 298,205 | $ | 162,561 | $ | 21,912 | |||||||||||
|
|
||||||||||||||||||||
| (1) | We are able to borrow funds and repay them under these revolving facilities during the committed revolving period. At the end of each facility’s committed revolving period, if the facility is not renewed or refinanced, amounts outstanding under the facility amortize in proportion to the actual repayments of underlying pledged receivables through the final maturity date, at which time the remaining outstanding principal amount |
50
Table of Contents
| is due. Amounts in the table above assume no repayments during the revolving period and the amortization of the debt is based on the projected contractual repayments of the underlying pledged receivables in accordance with the terms of the financing. For the revolving period renewal date and the final maturity date of each facility, see the table above under “—Debt facilities.” |
| (2) | Amounts outstanding under our term securitization facilities amortize in proportion to the actual repayments of the underlying pledged receivables securing these facilities. Amortization payments in the table above are based on the projected contractual scheduled repayments of the underlying pledged receivables in accordance with the terms of the financing. For the final maturity date of each facility, see the table above under “—Debt facilities.” |
| (3) | Represents total operating lease rental payments having initial or remaining non-cancelable lease terms longer than one year. Amounts principally are related to payments required under our leases for our headquarters and branch locations. As of December 31, 2014, we did not have any capital leases. |
Off-balance sheet arrangements
As of December 31, 2014, we do not have any unconsolidated subsidiaries, partnerships or joint ventures and do not have any off-balance sheet assets or liabilities, commitments to lend, goodwill, other intangible assets or pension obligations, and we are not involved in income tax shelters. We have four consolidated special purpose entities for our asset securitization facilities.
Critical accounting policies and estimates
Our discussion and analysis of our financial condition and results of operations are based on our consolidated financial statements, which have been prepared in accordance with accounting principles generally accepted in the United States of America (“GAAP”). The preparation of our consolidated financial statements requires us to make estimates and assumptions that affect the reported amounts of assets and liabilities and disclosure of contingent assets and liabilities at the date of the financial statements, and the reported amounts of revenues and expenses during the reporting period. Actual results could differ from those estimates. Critical accounting policies are those that management believes are both most important to the portrayal of our financial condition and operating results, and require management’s most difficult, subjective or complex judgments, often as a result of the need to make estimates about the effect of matters that are inherently uncertain. We base our estimates on historical experience and other factors that are believed to be reasonable under the circumstances, the results of which form the basis for making judgments about the carrying value of assets and liabilities that are not readily apparent from other sources. Judgments and uncertainties affecting the application of those policies may result in materially different amounts being reported under different conditions or using different assumptions. Our significant accounting policies can be found in Note 2 to our consolidated financial statements.
Allowance for credit losses on finance receivables
Provisions for credit losses on finance receivables are charged against income in amounts considered by management to be sufficient in relation to receivables outstanding. Impaired finance receivables are written down to their estimated fair value, based on the estimated liquidation value of the underlying collateral. Charge-offs which are recovered are credited to the allowance for credit losses. The allowance for credit losses is established through provisions for credit losses charged to income. The company maintains the allowance for credit losses at a level that is deemed to be appropriate to absorb probable losses inherent in the respective finance receivable portfolio, based on a quarterly evaluation of a variety of factors. These factors include, but are not limited to: (i) historical credit loss experience and recent trends in that experience; (ii) historical loss discover periods, and (iii) qualitative factors that may result in further adjustments to the quantitative analysis include items such as changes in the composition of our finance receivable portfolio, seasonality, economic or business conditions and emerging trends, business practices or policies at the reporting date that are different from the periods used in the quantitative analysis, an evaluation of delinquent and non-performing loans and
51
Table of Contents
related collateral values, external factors such as regulatory, legal or competitive matters, interest rates, industry conditions, and used equipment values.
The company reviews this data quarterly to determine that such a correlation continues to exist. Additionally, at interim dates between quarterly reviews, these factors are evaluated in order to conclude that they continue to be appropriate based on current economic conditions. The allowance for credit losses on finance receivables is our estimate of losses inherent in our finance receivables at the balance sheet date. The allowance is difficult to determine and requires significant judgment. Changes in the allowance level may be necessary based on unexpected changes in these factors.
Repossessed assets
All contract receivables whose collateral becomes subject to foreclosure are removed from finance receivables and are reclassified once title clears to us. Repossessed assets are initially recorded at fair value based on the estimated liquidation value of the collateral. Assets received to satisfy finance receivables (repossessed equipment, included in other assets) are initially written-down to our estimate of fair value by a charge to the allowance for credit losses. We estimate the fair value of repossessed assets by evaluating their market value and condition based on recent sales of similar equipment, used equipment publications, our market knowledge and information from equipment vendors. Subsequent to foreclosure, we periodically perform valuations and the assets are carried at the lower of the carrying amount or fair value. Any subsequent recoveries or write-downs are recorded into income.
Income taxes
We provide for the income tax impact of all transactions reported in the financial statements regardless of when such taxes are payable. Provision for income taxes consists of taxes currently payable or refundable and deferred income taxes or benefits. Deferred tax assets and liabilities are recognized for the expected future tax consequences of temporary differences between the tax and financial statement basis of assets and liabilities. Temporary differences arise from using different methods of accounting for credit losses, depreciation and accrued expenses. Deferred taxes are based on tax laws currently enacted with tax rates expected to be in effect when the taxes are actually paid or recovered. A tax benefit from a tax position is recognized only if it is more likely than not that the position will be sustained on its technical merits.
We record interest and penalties related to unrecognized tax benefits as unrecognized tax benefits for provision for income taxes. Based on management’s analysis, we do not believe any remaining unrecognized tax benefits will significantly change in the next fiscal year. As of December 31, 2014, our open tax years include fiscal 2010 through fiscal 2014.
We have applied the principles of ASC 740-10-25-3 with respect to our Canadian operations which currently are nascent and developing. Our Canadian subsidiary currently requires capital support from us to fund ongoing operating costs. The total net investment in our Canadian subsidiary was $4.3 million at December 31, 2014 and the subsidiary had $0.6 million of cash at such date. The growth profile for our Canadian operations indicates that our Canadian subsidiary will be a net consumer of capital requiring supplemental capital from us for the foreseeable future. In addition, when the portfolio of Canadian loans grows to the point where earnings exceed operating costs, we intend to reinvest those earnings toward further growing the Canadian loan portfolio. Accordingly, we currently do not have any plans to repatriate any earnings from our Canadian subsidiary to us in the U.S. As a result, we have not made any adjustments to our provision for income taxes to reflect the potential repatriation of earnings from Canada and do not expect that we will be required to do so in the near future.
52
Table of Contents
Quantitative and qualitative disclosures about market risk
Market interest rate risk and sensitivity
Market interest rates and credit spreads affect our net interest margin and how we manage interest rate risk. Net interest margin is an integral part of profitability for a finance company like us. Our net interest margin was 7.0% at December 31, 2014 compared to 6.9% at December 31, 2013, The change in this comparable period was largely due to an improvement in our total cost of funds which resulted from the issuance of a term asset backed security which had a lower fixed rate of interest than we can achieve in our revolving credit facilities. Our net interest margin was 6.8% in fiscal 2014, which is 10 basis points higher than 6.7% in fiscal 2013 because decreases in market interest rates lowered our cost of debt more than they lowered the net yield on our finance receivables. Although interest rates increased somewhat during this period, the increase was offset by lower overall credit margins on our debt facilities, including a high proportion of debt being sourced from term asset backed securities. Because the improvement in credit spreads helped offset the increases in the overall interest rate environment, we were able to originate new contracts at a yield that was less than the year before and yet maintain a similar net interest margin.
Our net interest margin is sensitive to changes in short and long-term market interest rates (such as LIBOR, rates on U.S. Treasury securities, money-market rates, and swap rates). Increases in short-term rates reduce our net interest margin and decreases in short-term rates increase our net interest margin to the extent such floating rate debt is not hedged. Interest rates on our debt change faster than the yield on our receivables because 100% of our receivables are fixed rate and a changing rate environment must be reflected in new originations.
Credit spreads available to customers in the market-at-large also affect our net interest spread. Changes in credit spreads affect the yield on our receivables when originated and the cost of our debt when issued. Credit spreads have improved during the fiscal year 2014 and by issuing a term asset backed security in May 2014, we were able to achieve a fixed coupon on our debt that was less than what we can achieve from our revolving credit lenders. Our cost of debt could increase considerably as we obtain or renew financing if credit spreads were to increase and if the mix of debt changes overtime from one source to another.
Our income is subject to the risk of rising short-term market interest rates and changes in the yield curve due to the lag between short-term interest rate changes and finance receivable pricing. The terms and prepayment experience of fixed rate receivables mitigate this risk. We collect receivables monthly over short periods of two to seven years on average. Our finance receivables had an average remaining life excluding prepayments of approximately 20 and 21 months at December 31, 2014 and March 31, 2014, respectively, and scheduled receivables payments, including interest, of $204 million in fiscal 2015. Historically, annual collections are higher than the sum of the regularly scheduled payments because of prepayment activity. We do not match the maturities of our debt to our receivables except in the case of term asset backed securitizations where the notes repay in proportion to the collection of the underlying receivables.
We monitor our exposure to potential adverse changes in market interest rates. We may hedge our exposure to this interest rate risk by entering into derivatives on existing debt or debt we expect to issue, and we may change the proportion of our fixed and floating rate debt. We do not speculate with or trade derivatives. At December 31, 2014, we had $175.7 million in notional amount of derivatives outstanding which covered $267.5 million of floating rate debt. We had $169.7 million in notional amount of derivatives outstanding at March 31, 2014, covering $289.5 million of our floating rate debt. We also manage our interest rate exposure on floating rate debt by issuing term asset backed securities, where the notes have a fixed coupon. In fiscal 2014, we issued $194.5 million of such notes. In May 2014, we issued an additional $265.5 million of these notes.
We quantify interest rate risk by calculating the effect on net income of a hypothetical, immediate 100 basis point rise in market interest rates on the unhedged portion of our floating rate debt. As of March 31, 2014, net
53
Table of Contents
income before taxes would have been reduced by $1.2 million if interest rates had changed by 1.0% on the unhedged portion of our debt and remained at that level for a year and by about $0.9 million for the period ended December 31, 2014.
Foreign exchange risk
Because our financial statements are denominated in U.S. dollars and we receive a portion of our net revenue in Canadian dollars, we are exposed to fluctuations in this foreign currency. In addition, we pay certain of our expenses in Canadian dollars. As of March 31, 2014 and December 31, 2014, we had not entered into any transactions to hedge our exposure to the foreign exchange fluctuations through the use of derivative instruments or otherwise. An appreciation or depreciation of Canadian dollars relative to the U.S. dollar would result in an adverse or beneficial impact, respectively, to our financial results and is reflected in the foreign currency translation adjustment. We quantify foreign exchange rate risk by calculating the effect on total shareholder’s equity of a hypothetical, immediate change in the exchange rate of the Canadian Dollar to the U.S. Dollar, resulting from a relative strengthening or weakening of one currency compared to the other, at the time of determination, of a 10% change on the recorded value of our net investment in our Canadian subsidiary. As of March 31, 2014, our net investment in the Canadian subsidiary was $1.2 million as converted to U.S. Dollars. A 10% change in the exchange rate would have changed this value by approximately $122,000. As of December 31, 2014, our net investment in our Canadian subsidiary was $4.3 million as converted to U.S. Dollars. This investment included both loans from the parent company and direct investment in equity of the Canadian subsidiary. A 10% change in the exchange rate would have changed this value by approximately $0.4 million.
54
Table of Contents
Industry overview
Equipment finance industry
According to the Equipment Leasing and Finance Association (“ELFA”), U.S. equipment finance loans and leases are projected to exceed $900 billion in 2014. According to Monitor, the top 100 equipment finance entities had $569 billion in aggregate net assets as of December 31, 2013 and together originated $231 billion in loans and leases in calendar year 2013. According to ELFA, new business volume across the equipment finance industry grew 9.3% and 16.4% in 2013 and 2012, respectively. Independent finance companies saw volume grow in 2013 at an even faster rate of 17.7%.
Industry segment mix by net assets
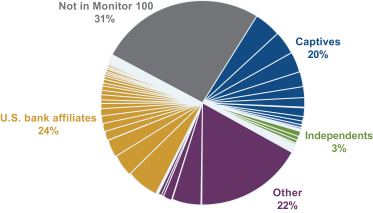
Source: 2014 Monitor 100 Equity Leasing and Finance publication, Data as of December 31, 2013; ELFA.
“Other” includes U.S. industrial affiliates, entities Not elsewhere Classified and Foreign Affiliates.
We believe that growth in the equipment finance industry is highly correlated to overall economic growth and is driven by investment in new equipment and growth in customers’ propensity to utilize financing for existing and new equipment. Since 2010, Gross Private Domestic Investment as a percentage of U.S. GDP has increased by 23%, which we believe indicates a strengthening business appetite for equipment. We believe growth will continue as the equipment replacement cycle drives additional capital expenditures. In calendar year 2013, total public and private sector equipment and software investment grew by 3.2% and equipment finance volume grew by more than 8%.
55
Table of Contents
Relationship between gross private domestic investment and originations
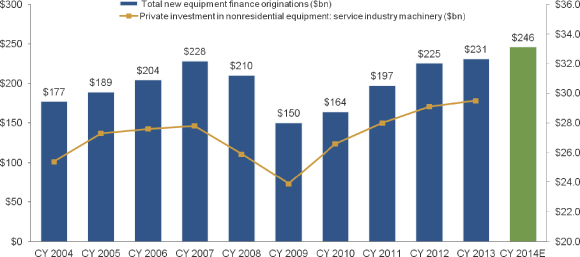
Source: Monitor Reports, St. Louis Federal Reserve
Note: Real GDP based on chained 2009 dollars; not seasonally adjusted; Real private investment in equipment chained in 2005; annual and seasonally adjusted
Industry participants include national and regional banking institutions, independent finance companies, manufacturer-owned finance companies, as well as smaller finance companies. Since 2009, many independent finance companies have been acquired or have exited the market, reducing the number and market share of independent finance companies. According to Monitor, independent finance companies have historically represented as much as 10% of the industry’s net assets in 2007 compared to approximately 5% as of December 31, 2013.
The equipment finance industry has also benefited from an improvement in credit quality since 2008-2009, with average charge-offs for ELFA’s Monthly Leasing and Finance Index reaching 0.2% in May 2014, a 93.4% decline from its peak in the third quarter of 2009.
Average charge-offs
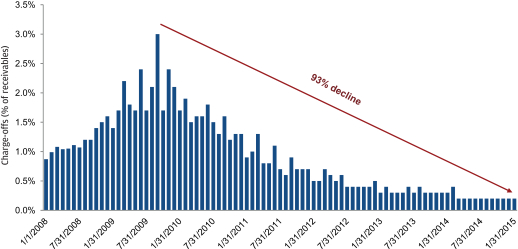
Source: ELFA Monthly Leasing and Finance Index (MLFI-25)
56
Table of Contents
Trends underlying our target industries
We focus on providing commercial equipment financing to businesses in the United States and Canada that operate in three targeted industries: construction, fleet transportation and waste. These industries are large, yet highly fragmented in terms of the end-user and equipment sales channels. As an independent equipment finance provider focused on these industries, we are able to capitalize on favorable industry dynamics and economic trends to drive originations growth.
Construction
Construction is a large, dynamic, and complex industry sector that plays an important role in the U.S. economy. In 2013, loans made to individuals or businesses in the construction sector accounted for 8% of all equipment finance loans according to ELFA, representing a substantial portion of the market.
Construction spending has rebounded from the lows of 2008 and 2009. According to the U.S. Department of Commerce, overall construction spending in December 2014 was estimated at a seasonally adjusted annual rate of $984.5 billion, an increase of 2.4% from December 2013. Private non-residential construction spending in December 2014 totaled $351.5 billion, a 6.0% year-over-year increase. Total non-residential spending (public and private) amounted to $629.3 billion, a 6.3% increase from May 2013.
| Private nonresidential construction spending | Public nonresidential construction spending | |
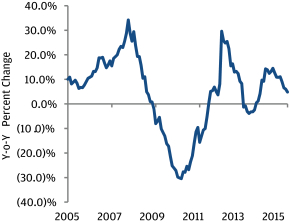
|
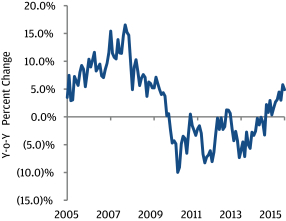
| |
| Source: U.S. Department of Commerce; U.S. Census Bureau |
Source: U.S. Department of Commerce; U.S. Census Bureau | |
The construction industry is also heavily tied to the real estate market. An improving real estate market should continue to be a leading indicator of growth in the construction market. U.S. housing starts continue to show strength and, according to the American Institute of Architects (“AIA”) consensus forecasts, U.S. put-in-place construction is expected to increase 4.4% in 2014 and 8.1% in 2015. This is further supported by the nearly double-digit growth in U.S. housing starts over the past two years. Within the non-residential real estate market, the AIA consensus forecast indicates that non-residential real estate is expected to show modest growth of 5.8% and 8.0% for 2014 and 2015, respectively. Confidence in the construction market extends to industry executives as well, with the Wells Fargo Optimism Quotient reaching a historic high of 124 for 2014, a positive indicator of the current market outlook. The view of prospective growth is also shared by contractors with Wells Fargo also indicating that more contractors in 2014 say they will increase new and used equipment acquisitions as compared to 2013.
57
Table of Contents
Housing starts (000s)
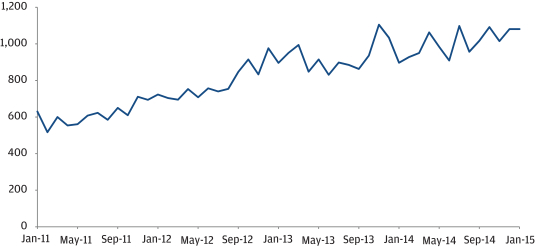
Source: U.S. Department of Commerce; U.S. Census Bureau
Fleet transportation
The freight industry is an integral component of the economy by transporting large quantities of raw materials, works in process and finished goods over land—typically from manufacturing plants to retail distribution centers. Fleet transportation is the largest revenue generating industry within the U.S. freight market with 2012 revenue value at $642.1 billion, or approximately 80% of the freight market revenue. In 2013, loans made to companies in the transportation industry accounted for 26% of all equipment finance loans—a portion of which is attributed to the fleet sector—according to the ELFA.
Class 8 average age
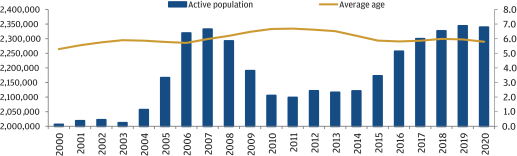
Source: ACT Research
58
Table of Contents
The U.S. Department of Transportation’s “Transportation Services Freight Index,” a seasonally adjusted measure of freight volume, has risen on a year-over-year basis in 48 of the past 50 months. Growth in freight volumes serve as a tailwind for the fleet finance industry.
Transportation Services Index (freight)1
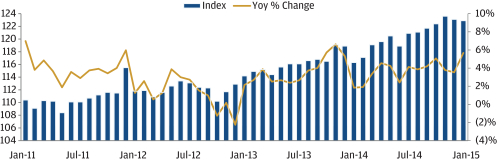
Source: U.S. Department of Transportation, Bureau of Transportation Statistics
| 1 | The Transportation Services Index, created by the U.S. Department of Transportation measures the movement of freight. The index, which is seasonally adjusted, combines available data on freight traffic that have been weighted to yield a monthly measure of transportation services output |
We expect the aging of our customers’ fleets to result in additional equipment expenditures. The last industry wide fleet renewal occurred from 2004 to 2006 in anticipation of new emissions standards. According to ACT Research, the age of the class 8 truck and trailer fleet is near an all-time high at approximately 6 years, and class 8 truck production is expected to continue to grow in the future as companies seek to replace their older trucks. Truck utilization is at its highest level in the last three years at over 90%. Higher utilization has resulted in increased spot freight rates, which helps support continued fleet investment. New vehicle standards for heavy vehicles were introduced in 2014 and are expected to drive heightened equipment expenditures for our customers by the end of 2018. Federal officials estimate that the new regulations will increase the costs of long-haul tractor trailers by $6,220. The added vehicle replacement cost should increase the amount of financing demanded by fleet transportation companies as they seek to finance the augmented tractor trailer purchase cost.
North American class 8 production—actual and estimated
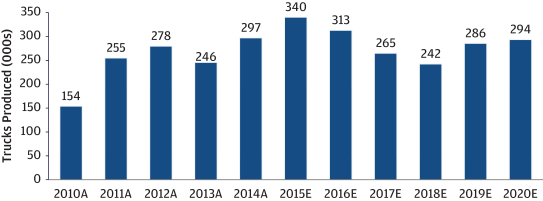
Source: ACT Research
59
Table of Contents
Waste
The overall waste management industry has annual revenues in excess of $50 billion according to the Waste Business Journal. The waste management industry is divided into two subsectors: solid waste and liquid waste. The solid waste business mainly involves the collection, disposal (through landfills and incineration) and recycling of nonhazardous solid waste. The liquid waste industry includes industrial cleaning contractors, sewer and utility contractors and companies that deliver and maintain portable toilets.
Waste volume is projected to grow on the heels of an increase in projected housing starts. Additionally, new waste conversion technologies are being demonstrated and compressed natural gas (CNG) trucks are becoming more common. The trend toward CNG trucks has the potential to increase capital expenditures within the industry as natural gas vehicles require a greater equipment investment than diesel vehicles. An increase in waste industry capital expenditures should drive demand for equipment financing.
| Post-recovered MSW and WTE tons
|
Waste group1 volume trend
| |
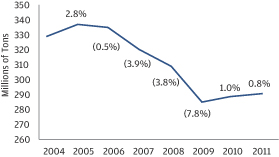
|
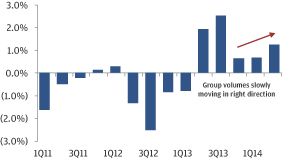
| |
| Source: Waste Business Journal, Waste Market Overview & Outlook 2012, Company reports, KeyBanc Capital research 1 Waste Group contains BIN, CWST, RSG, WCN, WM | ||
In addition to increased waste volumes, conversion of diesel-fueled fleets to compressed and liquefied natural gas are expected to spur increased industry equipment expenditure as natural gas vehicles require a higher equipment investment than diesel vehicles. As a result, this trend has the potential to increase capital expenditures and financing needs within the industry. Waste Management Inc. publicly stated it believed natural gas vehicles would account for approximately 90% of its annual new truck purchases over the coming years. Recently, Waste Management indicated that natural gas vehicles now account for 18% of its fleet, and that the changeover has already saved the company $1 billion in operational cost due to the lower prices of natural gas relative to diesel. Other companies, such as Republic Services, have also stated that they have begun shifting truck purchases to natural gas.
60
Table of Contents
Our company
We are an independent financial services company engaged in the financing of commercial equipment. We provide secured loans and, to a lesser extent, leases to businesses that operate in the construction, fleet transportation and waste industries in the United States and Canada. Our target customers are primarily middle-market, family-owned businesses, and the equipment they finance with us is, in many cases, vital to their operations. This equipment includes mobile cranes, earth moving and paving equipment, over-the-road trucks and trailers, waste collection trucks and related equipment that are produced primarily by nationally recognized manufacturers.
Our business is relationship and service oriented. The loans and leases we originate enable our customers to acquire equipment and refinance existing obligations. We have a team of more than 50 experienced sales representatives who work directly with our customers, which we believe, given the size of their businesses, are often underserved by larger financial institutions. We complement our interaction with customers by building and maintaining relationships with equipment vendors and manufacturers and educating them about our financing parameters. However, we do not rely on marketing programs with equipment vendors or manufacturers to source new business. We believe that knowledge of our customers, their industries and the equipment they employ enables us to provide superior customer service and customized financing solutions while maintaining strong credit quality.
Since our inception in October 2004, our sales force has directly originated $1.9 billion of loans and leases. As of December 31, 2014, we had a finance receivables portfolio of $611.5 million, comprised of over 3,900 loans and leases to more than 1,800 customers. We originate loans and leases that typically range from $50,000 to $2.5 million per transaction. For the nine months ended December 31, 2014, our average new contract was approximately $209,000, had an original term of 46 months and had a yield of 9.8%. We retain all of our originations and hold them to maturity. The composition of our finance receivables portfolio by receivable and industry type as of December 31, 2014 can be seen in the charts below:
| Portfolio by Receivable Type, as of
|
Portfolio by Industry, as of
|
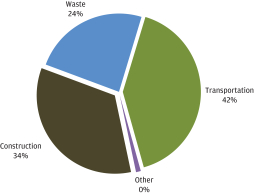
Our finance receivables are secured by a first lien on the specific equipment financed. Additionally, our loans typically have fixed interest rates, are amortizing and include prepayment premium provisions. We also offer lease financing to our customers. As of December 31, 2014, there were $8.9 million of lease residuals retained on our balance sheet representing 1.5% of our finance receivables.
We concentrate on financing equipment that has an economic life longer than the term of the financing provided by us, is unlikely to be subject to rapid technological obsolescence, has applications in a variety of
61
Table of Contents
different industries, has a relatively broad resale market and is easily movable. We believe these characteristics of the underlying equipment, coupled with the expertise of our management team in underwriting, structuring and servicing of our finance receivables, have historically enabled us to minimize credit losses. Our annualized net charge-offs as a percentage of average finance receivables were 0.22% for the nine months ended December 31, 2014. For the fiscal year ended March 31, 2014, net charge-offs as a percentage of average finance receivables were 0.31%, and peaked at 0.65% for the fiscal year ended March 31, 2010.
We fund our portfolio through a combination of committed secured bank credit facilities, term and revolving asset-backed securitizations, unsecured subordinated debt and equity. Our funding providers are nationally recognized financial institutions. Our revolving credit facilities are on bilateral terms with staggered debt maturities. As of December 31, 2014, our leverage was 5.8x or x on a pro forma basis after giving effect to the intended application of net proceeds from this offering. Additionally, our financing strategy seeks to match the duration and interest rate characteristics of our portfolio by utilizing fixed rate term debt and interest rate hedges. As of December 31, 2014, 84% of our debt was either fixed rate debt or floating rate debt that had been swapped to a fixed rate using interest rate swaps.
Our primary source of revenue is finance income earned on our finance receivables portfolio. Finance income includes interest, prepayment premiums and other fees less amortization of capitalized origination costs and was $41.1 million for the nine months ended December 31, 2014. Our portfolio yield is calculated as finance income divided by average finance receivables for a given period, stated as a percentage. For the nine months ended December 31, 2014, our annualized portfolio yield was 9.9%. Our net interest margin is the difference between the finance income and our total cost of funds. For the nine months ended December 31, 2014, our net interest margin was 7.0%. We generate profits to the extent that our net interest margin exceeds our provision for credit losses, salaries and operating expenses. For the nine months ended December 31, 2014, we generated net income of $9.0 million and had an annualized return on average shareholders’ equity of 21.1%. Over the last five fiscal years, finance receivables and net income have grown at a compound annual rate of 18.3% and 48.4%, respectively.
5-Year Historical Growth in Finance Receivables

| * | Five-Year CAGR uses the period beginning with the fiscal year ended March 31, 2009. |
62
Table of Contents
5-Year Historical Growth in Net Income
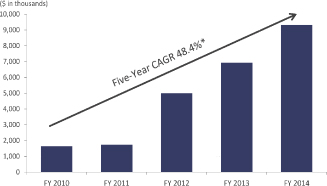
| * | Five-Year CAGR uses the period beginning with the fiscal year ended March 31, 2009. |
Our business and growth strategies
Our business objectives are to grow our portfolio of finance receivables while seeking to maximize long-term earnings growth and generate attractive risk-adjusted returns through economic cycles. We believe the following strategies will help us meet these objectives:
Continue to focus on serving middle-market companies. Historically, small-and medium-sized businesses have been constrained in their ability to access traditional sources of financing. Our focus on middle-market businesses provides us the opportunity to meet what we believe is significant unfulfilled demand for financing among our target customers.
Maintain and grow our existing customer relationships. Our existing customers have historically been and we expect will continue to be a source of new business. Our service-oriented culture, strong customer relationships and focus on being a reliable financing partner have historically resulted in high levels of repeat business from our customers. For the nine months ended December 31, 2014, 68% of our originations were generated from existing customers. We believe our direct sales and customer contact model enhances our customer relationships, enabling us to offer customized financing solutions to meet customers’ individual needs. We will seek to continue to build and enhance customer loyalty, allowing us to increase business volume through our existing customer base.
Further penetrate existing markets. We have customers in all 50 states, as well as in Canada where we commenced operations in April 2014. However, we do not currently maintain marketing employees for each of our targeted industries in every state and province. We believe we can generate additional origination volume by increasing the number of dedicated sales and marketing employees within our current geographic footprint. By strengthening our industry coverage and further penetrating our existing markets, we expect that we can continue to drive significant growth.
Expand our geographic footprint. We plan to place dedicated sales representatives into additional U.S. states and Canadian provinces and expect that additional representatives in such regions will provide substantial incremental origination and portfolio growth. We have increased and intend to increase the number of representatives in key geographic regions that we believe are underserved. We have a proven track record of successfully entering new markets and hiring sales representatives to cover new territories.
Opportunistically pursue portfolio and business acquisitions. We believe that we possess the capacity to manage a larger finance receivables portfolio without substantially increasing our infrastructure costs due to the scalable and efficient nature of our operating platform and the breadth and experience of our management team. As a result, we believe that we are also well positioned to opportunistically pursue portfolio and business
63
Table of Contents
acquisitions to complement our base growth strategy. Currently, we do not have any agreements, arrangements or understandings to make any acquisitions.
Our competitive strengths
We believe that the following competitive strengths enhance our ability to execute our business and growth strategies, creating long-term value for our shareholders:
Relationship-driven lending model.
We originate finance receivables through our team of more than 50 experienced sales representatives, serving over 1,800 unique customers as of December 31, 2014. We focus on direct relationships with end-users, a commitment to superior customer service, maintaining local presence and frequent in-person contact. We believe these attributes promote customer loyalty and present opportunities for repeat business. For the nine months ended December 31, 2014, 68% of our originations were generated from existing customers.
Rigorous risk management culture and collateral expertise leading to strong credit performance.
We maintain a conservative credit culture with strict underwriting standards. We evaluate each loan or lease based on the obligor’s cash flow, ability to pay, character and the collateral value of the equipment. Our underwriting policies and procedures were developed by our senior management team which possesses an average of over 25 years of experience in equipment finance. Substantially all of the loans and leases in our portfolio are subject to cross-collateralization and cross-default provisions. The useful life of the equipment we finance is typically greater than the amortization period of our loans and leases, which minimizes collateral risk, and reduces losses. Our annualized net charge-offs as a percentage of average finance receivables were 0.22% for the nine months ended December 31, 2014. For the fiscal year ended March 31, 2014, net charge-offs as a percentage of average finance receivables were 0.31%, and peaked at 0.65% for the fiscal year ended March 31, 2010. Receivables from our small and medium-sized, privately owned customers may entail heightened risks given our customers’ sensitivity to the effects of, among other factors, poor regional and general economic conditions, rising fuel and financing costs, loss of key personnel and increased competition, any of which could negatively effect our customers’ operations and their ability to meet their obligations.
Diversified and high quality portfolio.
We concentrate on financing equipment that has an economic life longer than the term of the financing provided. Our finance receivables are secured by a first lien on the equipment financed in substantially all cases. We strive to maintain a diversified portfolio across a number of categories, including customer, industry, equipment type and geography. For example, our largest customer represented 0.82% of our portfolio and our top 10 customers represented 6.5% of our portfolio as of December 31, 2014. Our portfolio is diversified across the fleet transportation (42%), construction (34%) and waste (24%) industries, as of December 31, 2014. We are also geographically diversified with our largest state concentrations in Texas, North Carolina and California constituting 13.0%, 9.7% and 8.8% of our portfolio, respectively, as of December 31, 2014.
Proven organic growth and consistently strong financial performance.
We believe we are well positioned to acquire new customers and retain existing customers. Over the five fiscal years ended March 31, 2014, our originations and finance receivables grew at compound annual growth rates of 20.5% and 18.3%, respectively. Our net income has increased in each of our ten full years of operations, including during 2008 and 2009, and our ability to originate new finance receivables and increase our portfolio has helped us continue to grow net finance income and net income. For the five fiscal years ended March 31, 2014, we achieved compound annual growth rates for finance income and net income of 16.1% and 48.4%,
64
Table of Contents
respectively. Additionally, for the fiscal year ended March 31, 2014, our net income was $9.3 million, representing a return on average assets of 2.0% and a return on average shareholders’ equity of 19.3%. We believe that our portfolio size, track record and reputation with our customers, funding providers and employees give us operational scale, diversified and reliable access to funding and reputational advantage over our competitors as we continue to expand our business and attract new talent.
Experienced management team with significant ownership stake.
Members of our management team have worked together for almost two decades dating back to their time together at Financial Federal Corporation, a publicly-traded, independent equipment finance company prior to its acquisition in 2009 by People’s United Financial, Inc., whose portfolio reached a size at its peak of $2.0 billion. Our senior management team averages over 25 years of experience in the equipment finance industry, are major shareholders of the company and will beneficially own % of our common shares after this offering (assuming no exercise of the underwriters’ option to purchase additional shares). We believe this ownership stake aligns their interest with that of our shareholders.
Our financing philosophy
Our financing strategy is critical to the success and growth of our business. We manage our financing to complement our asset composition and to diversify our exposure across multiple capital markets and counterparties.
We finance the loans and leases we originate with our working capital, secured bank credit facilities and asset-backed revolving and term securitization facilities. As of December 31, 2014, we had committed secured bank credit facilities and asset-backed revolving securitization facilities of $80.0 million and $380.0 million, respectively. As of December 31, 2014, $54.6 million of our committed revolving credit facility was drawn and $25.4 million was unused and available to us, and $212.8 million of our revolving asset securitization facilities was drawn and $167.2 million was unused and available to us.
We believe operating with prudent leverage is essential to managing a successful financial services company. We consider our total senior debt to include our borrowings under secured bank credit facilities, borrowings under revolving securitization facilities, and term asset-backed securitization facilities. We consider our capital to include total shareholders’ equity and subordinated notes payable, although we intend to use a portion of the proceeds from this offering to repay our subordinated notes payable in their entirety. As of December 31, 2014, our leverage was 5.8x and we expect it will be on a pro forma basis after giving effect to the application of the net proceeds from this offering. This ratio will typically fluctuate during the course of a fiscal year due to the normal course of business. We believe that our asset mix and current leverage levels provide financial flexibility to be able to capitalize on attractive market opportunities as they arise.
Our customers
Our target customers are mid-sized, family-owned and operated businesses, which finance equipment with secured loans and leases that typically range from $50,000 to $2.5 million. We believe our target customers are underserved because:
| (1) | large commercial finance companies and commercial banks typically concentrate their efforts on transaction sizes in excess of $1 million (large ticket); and |
| (2) | industry participants that focus on small and micro-ticket transactions typically use automated credit scoring models that are not well-equipped to analyze the customized financing solutions desired by customers targeting loans and leases above $200,000 (mid-ticket). |
65
Table of Contents
We focus on providing superior service to our customers, which include construction companies, for-hire carriers, solid waste haulers and industrial cleaning contractors. In most scenarios, either the end-user works directly with one of our sales representatives prior to purchasing equipment or an equipment manufacturer or vendor contacts one of our sales representatives with an end-user’s name, contact information and equipment detail. We manage and control the underwriting process for each of our loans and leases and we do not purchase contracts from third party brokers. Our customers typically operate in one of three industries: construction, fleet transportation or waste. Our target customers have significant operating history, have between 25 to 30 employees, operate between 10 and 100 pieces of equipment, have annual revenue of $500,000 to $10,000,000 and have a net worth of $100,000 to $10,000,000.
| Portfolio by industry, as of December 31, 2014
|
Portfolio by industry, as of December 31, 2013
| |

|

|
Construction
Our construction customers typically work in the construction and renovation of structures for both public and private projects, infrastructure and engineering projects (such as highways, bridges and utility systems) and in some cases may include engineering projects in connection with residential construction. The general contractors within this industry are the “lead” on projects and may or may not perform specific work. Our customers can be bonded regional contractors or subcontractors. The subcontractor customers typically specialize in grading and land clearing, sewer and utility installation and maintenance, road building, concrete, aggregates, mobile cranes, vocational trucking, highway/bridge construction and maintenance, utility construction, lifting and rigging, concrete placement and excavation and earthmoving.
Our construction customers are typically family-owned and operated, enhancing their personal and financial commitment to their businesses. Many of our customers seek to build equity in their equipment. Their primary assets are construction equipment, which are frequently depreciated to a level where there is real value in the equipment even if it may be fully depreciated on an accounting basis. We interface with our construction customers to finance the purchase of a single piece or multiple pieces of income-producing equipment, ranging in value from $50,000 to $2.5 million. Typical manufacturers of construction equipment financed are: Caterpillar, Grove, John Deere, Komatsu, Link-Belt, Manitowoc, Terex and Volvo.
Fleet Transportation
Our fleet transportation customers are an integral component of the U.S. economy by transporting large quantities of raw materials and work in process and finished goods to and from manufacturing plants and retail
66
Table of Contents
distribution centers. Fleet transportation is the largest revenue-generating industry within the U.S. freight market. Our fleet transportation customers focus on components of the transportation industry such as dry, refrigerated, specialized or “heavy haul,” liquid and dry bulk hauling and flatbed.
Our customers are typically for-hire carriers who maintain small to midsize fleets. We do not finance owner-operators, who are individuals who own and operate their own truck. The majority of our customers operate nationally within the dry and refrigerated freight components, while the remaining portion of our customers tend to maintain a more regional market focus. By its nature, the equipment that we finance is mobile and interchangeable and is suitable for multiple applications. Typical manufacturers of fleet transportation equipment include: Freightliner, Great Dane, International, Kenworth, Mack, Peterbilt, Utility, Volvo and Wabash.
Waste
Our target market in the waste industry can be bifurcated into solid waste and liquid waste customers. Our solid waste customers are residential and commercial waste companies that provide disposal service to residential homeowners and commercial construction job sites. Our liquid waste customers include industrial cleaning contractors, sewer and utility contractors and companies that deliver and maintain portable toilets.
Customers in the residential waste industry are engaged in collecting residential waste on a contract or subscription basis. Customers in the commercial waste industry are engaged in collecting waste from commercial properties with trucks and waste containers ranging in size from 2 to 8 yards of capacity. Customers in the roll-off industry place containers at job sites or in driveways to be filled with demolition material. Once the roll-off container is full, the company will transport the filled container to a landfill or other disposal site to be emptied. Roll-off containers range from 10 to 30 cubic yards of capacity.
Industrial cleaning contractors clean in and around large industrial facilities such as steel mills, oil refineries, chemical plants and paper mills. Sewer and utility contractors inspect and repair underground pipes. The equipment utilized by these customers is a remote control camera to inspect pipes, a van housing the camera monitor, a liquid vacuum truck and a lining system. Hydro-excavation trucks are becoming increasingly popular as municipalities prefer digging around utility lines using water as opposed to using a traditional excavator. Typical manufacturers of the waste equipment that we finance include: Guzzler, Heil, Leach, McNeilus and WasteQuip.
Our services
We originate new loans and leases to allow our customers to acquire equipment as well as refinance our customers’ existing obligations. As of December 31, 2014, 92% of our finance receivables were secured loans and 8% were finance leases.
Loans to purchase equipment (“purchase money loans”) typically range between $50,000 and $1.5 million and have terms of 3 to 7 years. These loans typically have fixed interest rates, are amortizing and include prepayment premium provisions.
Loans to refinance existing equipment typically range between $100,000 and $2.5 million and have terms of 3 to 4 years. These loans typically have fixed interest rates, are amortizing, and include prepayment premium provisions. Many of our competitors do not engage in refinancing transactions given the heightened focus required in originating and underwriting these products. We believe refinancing transactions can be highly attractive given the characteristics of these loans, which include high collateral-to-loan values, shorter amortization, and higher rates and fees than typical purchase money loans. Additionally, we offer our customers the ability to refinance their existing loans concurrently with financing the purchase of new equipment.
We offer lease financing when appropriate to our customers. We do not finance operating leases. Our leases are non-cancelable and are accounted for as finance leases for our financial reporting purposes. As of December 31,
67
Table of Contents
2014, there were $8.9 million of lease residuals retained on our balance sheet representing 1.5% of our finance receivables.
Our portfolio
As of December 31, 2014, our finance receivables portfolio consisted of over 3,900 loans and leases to more than 1,800 customers, with a total balance of $611.5 million. At December 31, 2014, our finance portfolio had a weighted average remaining term of 40 months, a portfolio yield of 9.9% and an average remaining contract balance of $156,026.
| Portfolio by term | ||||||||
| As of December 31, 2014 | ||||||||
| Months | Original term |
Remaining term |
||||||
| < 24 Months |
0.4% | 14.4% | ||||||
| 25—36 Months |
11.3% | 27.4% | ||||||
| 37—48 Months |
27.6% | 30.1% | ||||||
| 49—60 Months |
36.7% | 23.8% | ||||||
| 61—72 Months |
19.0% | 2.3% | ||||||
| > 73 Months |
5.0% | 2.0% | ||||||
| 100.0% | 100.0% | |||||||
|
|
||||||||
| Portfolio by interest rate | ||||||||
| (dollars in thousands) | As of December 31, 2014 | |||||||
| Contract Yield | Finance receivables |
% of Finance receivables |
||||||
| < 7% |
$ | 6,505 | 1.1% | |||||
| 7%—8% |
21,171 | 3.5% | ||||||
| 8%—9% |
121,901 | 19.9% | ||||||
| 9%—10% |
239,023 | 39.1% | ||||||
| 10%—11% |
154,996 | 25.3% | ||||||
| 11%—12% |
46,967 | 7.7% | ||||||
| > 12% |
20,907 | 3.4% | ||||||
| 611,469 | 100.0% | |||||||
|
|
||||||||
| Portfolio by remaining contract balance | ||||||||
| (dollars in thousands) | As of December 31, 2014 | |||||||
| Current amount outstanding | Finance receivables |
% of Finance receivables |
||||||
| < 100,000 |
$ | 90,565 | 14.8% | |||||
| 100,000—250,000 |
178,551 | 29.2% | ||||||
| 250,000—500,000 |
167,419 | 27.4% | ||||||
| 500,000—750,000 |
105,832 | 17.3% | ||||||
| 750,000—1,000,000 |
37,020 | 6.1% | ||||||
| 1,000,000—1,250,000 |
12,029 | 2.0% | ||||||
| 1,250,000 + |
20,053 | 3.3% | ||||||
| 611,469 | 100.0% | |||||||
|
|
||||||||
68
Table of Contents
As demonstrated in the table below, we have recently experienced growth both by expanding into the northeast and west coast such as Pennsylvania and California, and by further developing our existing markets such as North Carolina. The following chart shows the 10 states with the largest change in finance receivables from December 31, 2013 to December 31, 2014.
| Top 10 state increases in finance receivables 2013-2014 | ||||||||||||||||
| (dollars in thousands)
State |
Finance receivables |
Finance receivables at December 31, 2014 |
$ Change 2013—2014 |
Change in % |
||||||||||||
| CA |
$ | 11,778,291 | $ | 53,941,326 | $ | 42,163,036 | 358.0% | |||||||||
| TX |
62,799,224 | 79,696,987 | 16,897,762 | 26.9% | ||||||||||||
| NC |
46,352,589 | 59,526,650 | 13,174,062 | 28.4% | ||||||||||||
| GA |
30,590,904 | 41,303,072 | 10,712,168 | 35.0% | ||||||||||||
| PA |
18,750,074 | 27,098,315 | 8,348,241 | 44.5% | ||||||||||||
| FL |
15,914,260 | 23,441,679 | 7,527,420 | 47.3% | ||||||||||||
| AZ |
6,123,646 | 12,887,300 | 6,763,654 | 110.5% | ||||||||||||
| SC |
23,119,677 | 29,204,443 | 6,084,766 | 26.3% | ||||||||||||
| MD |
9,805,839 | 15,502,434 | 5,696,595 | 58.1% | ||||||||||||
| NJ |
12,883,660 | 18,227,108 | 5,343,448 | 41.5% | ||||||||||||
| Others |
233,107,923 | 250,640,136 | 17,532,213 | 7.5% | ||||||||||||
|
|
||||||||||||||||
The following chart shows the top 10 states by amount of finance receivables at December 31, 2014.
| Top 10 states by finance receivables at December 31, 2014 | ||||||||
| (dollars in thousands)
State |
Finance receivables at December 31, 2014 |
% of Finance receivables |
||||||
| TX |
$ | 79,697 | 13.0% | |||||
| NC |
59,527 | 9.7% | ||||||
| CA |
53,941 | 8.8% | ||||||
| GA |
41,303 | 6.8% | ||||||
| IL |
37,275 | 6.1% | ||||||
| SC |
29,204 | 4.8% | ||||||
| PA |
27,098 | 4.4% | ||||||
| FL |
23,442 | 3.8% | ||||||
| NJ |
18,227 | 3.0% | ||||||
| MO |
17,247 | 2.8% | ||||||
| Others |
224,507 | 36.7% | ||||||
|
|
||||||||
Underwriting and credit
Our underwriting policies and procedures were developed by a senior management team that is composed of individuals with an average of over 25 years of experience in equipment finance. The key elements to our underwriting, collection and recovery processes include the following:
| • | Performing detailed credit analysis by understanding the customer’s cash flow, debt service and business dynamics; |
| • | Maintaining a realistic approach to collateral values within the context of the underlying receivable’s creditworthiness; |
| • | Securing additional equipment or other collateral as needed; |
69
Table of Contents
| • | Establishing and maintaining a strong relationship with the customer; |
| • | Obtaining personal and cross-corporate guarantees from the customer in substantially all transactions; and |
| • | Identifying and addressing any problems quickly to avoid subsequent larger issues. |
We assemble a credit package for each transaction. Several employees are involved with underwriting and documenting a new receivable. The credit package, which is documented on our standard form credit application, is prepared by a credit analyst, the receivable documents are prepared by documentation specialists and the credit request is approved by two credit officers. Prior to funding, two credit officer signatures are required on each disbursement.
We do not utilize credit scoring or actuarial models to evaluate any credit request. Instead, we underwrite each loan and lease we originate. We believe this allows us to develop closer relationships with our customers, improving our ability to monitor customers’ creditworthiness and reduce credit risk. The credit analysts and marketing personnel are responsible for compiling a credit package on each new loan or lease that typically includes the following information:
| • | Year-end and interim financial statements and tax returns of the proposed customer and affiliates as appropriate for the request; |
| • | Personal financial statements and tax returns (if different than above); |
| • | Dun & Bradstreet and Paynet credit reports and personal guarantor’s credit bureau reports; |
| • | Detailed equipment descriptions; |
| • | Proposed transaction terms; and |
| • | References documented on our standard form of internal credit documents. |
The prospective receivable is ultimately approved based on the cash flow of the customer, the collateral value of the equipment financed and the character of the borrower, among other factors.
| • | Cash Flow. We assess the Debt Service Coverage Ratio (“DSCR”). DSCR is defined as the sum of net income and non-cash expenses divided by current maturities of long-term debt, which excludes revolving facilities and balloon payments. If a customer’s financial information does not itemize current maturities of long-term debt, our credit analysts use their best efforts to determine an estimate of current maturities of long-term debt. |
| • | Collateral. We assess the equipment based on value, industry application and marketability, in addition to being cross-collateralized with other receivables of the same customer. |
| • | Character. We evaluate a customer’s character based on references, payment history, industry reputation and level of cooperation during our process. We check references on a customer’s other secured debt to ensure payments are made in a satisfactory manner. The customer and its majority owners must not have experienced an event of bankruptcy within the last seven years. |
Credit requests that do not meet the requirements outlined above must be reviewed and approved by a corporate officer with credit authority of at least $750,000, regardless of the size of the proposed transaction.
When available, all receivables with a common customer are cross-collateralized and subject to a cross-default, which frequently results in us being in an over-collateralized position on new receivables for existing customers. Additionally, we require provisions relating to prepayment premiums and late charges (where
70
Table of Contents
permitted) in substantially all receivable documentation and do not allow any notice or cure provisions. We obtain personal guarantees and cross-corporate guarantees for substantially all of our receivables.
The transaction process, from marketing to funding, generally takes one to two weeks for new customers, while the origination process for existing customers can be completed as promptly as within a day, and typically in less than a week, depending on the complexity of the transaction. Following approval of a new receivable, a documentation specialist compiles receivable documents that may include the following, as appropriate, based on the receivable type:
| Loan and lease documentation | ||||
| Purchase money loan | Non-purchase money loan | Equipment lease | ||
| Security Agreement | Security Agreement | Lease Agreement | ||
| Conditional Sale Contract | Equipment Schedule | Purchase Option | ||
| Equipment Schedule | Promissory Note | Invoice (sold to CCG) | ||
| Promissory Note | Proceeds Disbursement Letter | Delivery / Acceptance Certificate | ||
| Proceeds Disbursement Letter | Guaranty (continuing) | Guaranty (continuing) | ||
| Delivery / Acceptance Certificate Guaranty (continuing) |
Insurance (CCG loss payee) Corp / LLC Resolutions |
Insurance (CCG loss payee and additional insured) | ||
| Insurance (CCG loss payee) | Proof of Ownership | Corp / LLC Resolutions | ||
| Corp / LLC Resolutions | Certificate of Title (if applicable) | Certificate of Title (if applicable) | ||
| Equipment Invoice / Bill of Sale | UCC Financing Statement | UCC Financing Statement | ||
| Certificate of Title | ||||
| UCC Financing Statement | ||||
|
| ||||
Credit concentrations
Our internal policy limits our total exposure to any one customer (including related parties such as guarantors and affiliated entities with similar ownership) to no more than 4% of our net portfolio. Our exposure to our largest customer as of December 31, 2014 is 0.8% of our net portfolio. As of December 31, 2014, our top ten customers totaled 6.5% of our net portfolio. To date, we have not sold any receivables to third-parties. In the future, we may sell all or part of a transaction to third parties on a non-recourse basis, resulting in the net amount sold being removed from the total concentration of the related customer.
Servicing and collections
We act as the servicer of all of our receivables. Routine collection activity is conducted at the full service office location where such receivable was originated. Each full service office has a designated collection manager. The role of the collection manager is to oversee all routine collection activity and to target non-routine situations and resolve them with the assistance of our senior management, in-house legal counsel and the sales representative that originated the transaction. In an effort to emphasize accountability among sales representatives, each sales representative is liable for a sales incentive reduction if a loan becomes a non-accrual within 12 months of origination.
We utilize the Collections Plus module of our receivable system, LeasePlus, to track collection activities and statistics. The system has the ability to sort by due date, assign accounts to specific personnel, combine all accounts with the same customer to reflect the total receivable aging and track late charges and other fee aging. We accept payments in the form of physical check, wire transfer, Automated Clearing House, or “ACH,” fax check (via ACH), and in Canada, Preauthorized Payment, or “PAP.” All invoiced payments are directed to our lockbox account. In the event payments are delivered to one of our physical locations, the checks are deposited
71
Table of Contents
into the lock-box account via remote deposit capture. At the inception of a receivable, each customer is given the opportunity to elect automatic ACH for their monthly payments. For the nine months ended December 31, 2014, approximately 67% of our payments were in the form of wire transfers or ACH, with the remainder in the form of remote or lockbox deposit.
Below is a general timeline of events that illustrates our process as a receivable ages from on schedule current pay to nonaccrual and eventual repossession:
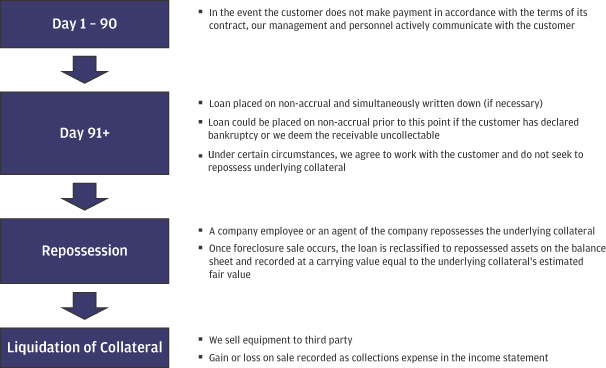
Customer bankruptcies are reported to the branch manager, the Chief Executive Officer and in-house legal counsel. All pre-petition payment schedules—and any related delinquency—remain in place until we receive written agreements authorized by a bankruptcy court outlining the new payment schedule. Where appropriate, we will reschedule receivables for customers that have filed for bankruptcy after a court order has been received.
The decision to repossess is made collectively by the branch manager and the Chief Executive Officer with guidance from legal counsel. In the majority of repossessions, we use “self-help” to retrieve the collateral. Self-help is the repossession of the collateral by us or by an agent on our behalf from the customer in question. Upon repossession, we will conduct either a public or private sale. In the case of both public and private sales, we handle the entire process in-house through a combined effort of the branch manager and the collections manager. In some instances, we may also sell the repossessed collateral to an existing customer.
We measure our recovery rate on defaulted finance receivables, which from our inception through December 31, 2014 was approximately 94.6%, by capturing the cash proceeds received, through any means, on contracts for a given customer for which recovery action is fully complete. This value is then compared to the original principal amount which was unpaid at the time the recovery actions were initiated. The resulting calculation is a cumulative measure over our complete history, which may or may not be indicative of performance in any given fiscal year period or in any future period.
72
Table of Contents
Competition
The business of financing industrial and commercial equipment is highly competitive. We compete with national and regional banks, manufacturer-owned and other finance and leasing companies, and other financial institutions. Some of our competitors may be better positioned to market their services and financing programs because of their ability to offer more favorable rates and terms and other services. Such rates may be impacted by the competitor’s size, access to financial resources and cost of capital. We believe we compete favorably by emphasizing a high level of equipment and financial expertise, customer service, flexibility in structuring transactions and management involvement in customer relationships, as well as by attracting and retaining experienced managerial and marketing personnel.
Employees
We had 120 full-time employees as of December 31, 2014. None of our employees have collective bargaining arrangements. We consider our relations with employees to be good.
Capital equipment
We utilize standard office equipment which includes desks, chairs and cubicles, readily available computer and telecommunication equipment and standard office support equipment.
Facilities
Our executive office is located at Suite 1450, 227 W. Trade Street, Charlotte, North Carolina 28202. We also have two full-service operations centers in Naperville, Illinois and Buffalo, New York where credit analysis and approval, collection and marketing functions are performed. Each of our three primary locations is leased. The office leases terminate on various dates through fiscal 2022. We believe our offices are suitable and adequate for their present and proposed uses, and suitable and adequate offices would be available on reasonable terms as needed.
Intellectual property
We do not own any intellectual property. We primarily use vendor-provided productivity, accounting and contract administration systems in our daily operations. These products are supported by the associated vendor but operated by our internal staff.
Regulation
Our commercial financing, lending and leasing activities are not subject to the same degree of regulation as consumer finance or banking activities. We are subject to federal and state requirements and regulations covering motor vehicle transactions, licensing, documentation and lien perfection. States also limit the rates and fees we can charge. Our failure to comply with these regulations and requirements can result in loss of principal, interest, or finance charges, the imposition of penalties and restrictions on future business activities. The Fair Debt Collection Practices Act (FDCPA) can impact financial institutions and other non-bank financial companies like us. Complying with these regulations imposes costs and operational constraints on the company. The Gramm-Leach-Bliley Financial Modernization Act of 1999, or other similar state statutes which regulate the maintenance and disclosure of personal information, could be expanded to apply to non-consumer transactions and thus impose additional costs and operational constraints on the company. As part of our loan and lease underwriting procedure, we comply with the applicable provisions of the Uniting and Strengthening
73
Table of Contents
America by Providing Appropriate Tools Required to Intercept and Obstruct Terrorism Act (USA PATRIOT Act) and applicable regulations promulgated by the United States Treasury Department’s Office of Foreign Assets Control.
Legal proceedings
We are not involved in any legal proceedings we believe could have a material impact on our financial condition or results of operations.
74
Table of Contents
Below is a list of the names, ages as of March 1, 2015, positions, and a brief account of the business experience, of the individuals who serve as the executive officers and directors as of the date of this prospectus.
| Name | Age | Position | ||||
| Daniel McDonough | 52 | President, Chief Executive Officer and Chairman | ||||
| E. Roger Gebhart | 58 | Senior Vice President and Chief Financial Officer | ||||
| Kevin McGinn | 46 | Senior Vice President, National Waste | ||||
| Donald Pokorny | 53 | Senior Vice President, Midwest | ||||
| Angelo Garubo | 54 | Senior Vice President and Corporate Secretary | ||||
| Robert Qulia | 59 | Vice President and General Counsel | ||||
| Rebecca Sabo | 49 | Vice President and Chief Accounting Officer | ||||
| Mark Lempko | 54 | Senior Vice President, Northeast U.S. and Canada | ||||
| Paul Bottiglio | 42 | Treasurer | ||||
| W. Bradford Armstrong(1)(2) | 34 | Director | ||||
| John Cochran II(2)(3) | 43 | Director | ||||
| John Fruehwirth(1)(3) | 47 | Director | ||||
| Steven Groth(1)(2)(3) | 62 | Director | ||||
| (1) | Member of Audit Committee. |
| (2) | Member of Corporate Governance and Nominating Committee. |
| (3) | Member of Compensation Committee. |
Daniel McDonough has served as our President, Chief Executive Officer and Chairman since the company’s inception in 2004. Mr. McDonough began his career in equipment finance with First Interstate Credit Alliance Inc. in 1986 as a credit analyst and Regional Credit Manager. Prior to founding the company, Mr. McDonough spent 14 years at Financial Federal Credit Inc. where he had oversight responsibility for their Charlotte and Houston operation centers. Mr. McDonough earned a B.B. degree from Western Illinois University and an M.B.A. degree from DePaul University.
E. Roger Gebhart has served as our Senior Vice President and Chief Financial Officer since 2005. Prior to joining the company, Mr. Gebhart worked with the Redstone Group in Houston, Texas as a director in their private equity group where he developed and managed investments in the general industry middle-market area and in specialty finance. From 1997 to 2001, Mr. Gebhart served as Executive Vice President, Treasurer and Chief Operating Officer of First Sierra Financial, Inc. Mr. Gebhart worked at First Union Capital Markets in their specialized industries finance group from 1986 to 1997. Mr. Gebhart earned a B.S. degree from Cornell University and an M.B.A. from the Colgate Darden Graduate School of Business at the University of Virginia.
Kevin McGinn has served as our Senior Vice President, National Waste since the company’s inception in 2004. Mr. McGinn began his career in 1992 as a credit analyst with the Chicago office of Financial Federal Credit Inc. and was relocated to Charlotte, North Carolina in 1994, where he acted as operations manager for the Southeast construction and transportation equipment financing division and the nationwide waste service equipment financing division. He was later promoted by Financial Federal to manage their entire waste division. Mr. McGinn earned a B.S. degree from the University of Iowa and an M.B.A. from Queens University.
Donald Pokorny has served as our Senior Vice President, Midwest since 2005. Mr. Pokorny began his career in equipment finance with Orix Credit Alliance Inc. in 1984 and held various positions there. In 1994, Mr. Pokorny joined Financial Federal Credit Inc. as Vice President of Credit and Operations of the Chicago Business Center and was later given the responsibility of starting and managing their large-ticket syndication group, as well as developing their internet business. Mr. Pokorny earned a B.S. degree from Northern Illinois University, an
75
Table of Contents
M.B.A. from the University of Missouri, and a Master’s Degree from Keller Graduate School of Management. Mr. Pokorny is a certified public accountant licensed in Illinois.
Angelo Garubo has served as our Senior Vice President and Corporate Secretary since 2013. Prior to joining the company, Mr. Garubo was a partner with the law firm of Romano, Garubo & Argentieri LLC, and served as General Counsel to Financial Federal Corporation, a publicly-held, nationwide asset based leasing and finance company, from 2000 through 2010. Mr. Garubo earned a B.A. degree from George Washington University and a J.D., magna cum laude, from California Western School of Law.
Rebecca Sabo has served as our Vice President and Chief Accounting Officer since the inception of the company in 2004. Ms. Sabo began her career in equipment finance and leasing in 1990 with Integral Truck Leasing, which at that time was a wholly-owned subsidiary of Volvo Trucks Corporation. In 1995, she joined Volvo Commercial Finance and held various management roles within their finance department; her responsibilities included managing accounting, financial reporting, expense planning, financial systems, accounts payable, cash application, cash management, and payroll for a $2.5 billion portfolio. Ms. Sabo earned a B.S. degree from Western Carolina University and a certificate in accounting from Guilford College. Ms. Sabo is a certified public accountant licensed in North Carolina.
Mark Lempko has served as our Senior Vice President, Northeast U.S. and Canada since 2012. Mr. Lempko started his career in the equipment finance industry in 1987 with Fleet Credit Corporation serving as the Regional Sales Manager for the upstate New York region. In 1995, Mr. Lempko joined HSBC Equipment Finance and advanced to the position of National Sales Manager in 1998. With the sale of the HSBC platform to Alter Moneta in 2003, Mr. Lempko assumed the role of National Sales Manager. In 2005, he was promoted to General Manager of the U.S. and English speaking Canadian divisions. Mr. Lempko earned a B.A. degree from Siena College.
Paul Bottiglio has served as our Treasurer since 2012. Prior to that, he served as our Assistant Treasurer from 2009 to 2012 and our Senior Financial Analyst Assistant from 2008 to 2009. Prior to joining the company, Mr. Bottiglio was the Operations Manager with NIRCM, a boutique CDO investment manager from 2006 to 2008. Prior to that, Mr. Bottiglio was an Accounting Manager with State Street Corporation responsible for the daily pricing of a group of mutual funds. Mr. Bottiglio earned a B.A. degree from Concord University and is presently a candidate for an Executive M.B.A. degree at Queens University of Charlotte.
Robert Qulia has served as our Vice President and General Counsel since 2007. Mr. Qulia previously served as a confidential law clerk to two U.S. bankruptcy judges, and was engaged in private practice of law in New York. Mr. Qulia also served as associate counsel with KeyBank prior to joining CCG. Mr. Qulia earned a B.A. degree from SUNY Fredonia and a J.D. from Quinnipiac University School of Law.
W. Bradford Armstrong has served as our director since 2012. Mr. Armstrong joined the Philadelphia office of Lovell Minnick Partners in 2009. Prior to that, Mr. Armstrong was part of the Financial Institutions Group at Bank of America Merrill Lynch, where he focused on M&A and capital raising transactions for investment banking clients. Previously, Mr. Armstrong was an Assistant Vice President in Bank of America’s Finance Group. Mr. Armstrong began his career in a strategic advisory group within Wachovia Corporation. Mr. Armstrong previously served on the board of First Allied Holdings, and has held board observer roles at several Lovell Minnick portfolio companies. Mr. Armstrong received his B.S. degree in Business Administration from the University of North Carolina at Chapel Hill and his M.B.A. from the Kellogg School of Management at Northwestern University.
John Cochran II has served as our director since 2012. Mr. Cochran is a Managing Director and a member of the Investment Committee of Lovell Minnick Partners LLC, a private equity firm focused on the financial services industry. Mr. Cochran joined Lovell Minnick in 2008. Prior to that, he was a private equity professional with SV
76
Table of Contents
Investment Partners and J.W. Childs Associates and also worked at Salomon Brothers Inc in the Mergers and Acquisitions group. Mr. Cochran has served on the boards of ALPS Holdings, Inc., Mercer Advisors, Inc. and PlanMember Financial Corporation and currently serves on the board of Seaside National Bank & Trust. Mr. Cochran received a B.A. degree from the University of California, Los Angeles and an M.B.A. and M.M.S.E. from Stanford University.
John Fruehwirth has served as our director since 2012. Mr. Fruehwirth is a founding member and Managing Partner of Rotunda Capital Partners. Prior to that, he was the Deputy Head of Private Finance at Allied Capital Corporation. Mr. Fruehwirth served on the Management, Investment and Portfolio Management committees and was Co-Head of Allied Capital’s Operating Committee. Prior to joining Allied Capital, he worked at Wachovia Capital Partners and at Conoco, Inc. Mr. Fruehwirth has served on the boards of Financial Pacific Holdings, Direct Capital Corporation and Callidus Capital. Mr. Fruehwirth received a B.B.A. degree from the University of Wisconsin–Madison and an M.B.A. degree from the Colgate Darden Graduate School of Business at the University of Virginia.
Steven Groth has served as our director since 2014. Mr. Groth is an investment consultant who advises and executes financial planning and product decisions. Mr. Groth served as Senior Vice President and Chief Financial Officer of Financial Federal Corporation from 2000 to 2010. Prior to that, Mr. Groth was Senior Banker and Managing Director of Specialty Finance and Transportation with Fleet Bank from 1997 to 2000. From 1985 to 1996, Mr. Groth held several positions, including Division Head, with Fleet Bank and its predecessor, NatWest Bank. Mr. Groth is a Chartered Financial Analyst (CFA). Mr. Groth served as Vice-Chairman of the Equipment Leasing Association Foundation Board. Mr. Groth earned a B.A. degree from Quinnipiac University and an M.B.A. from Pace University.
Board composition
Our board of directors currently consists of five directors, all of whom were elected as directors according to our Stockholders Agreement, pursuant to which Lovell Minnick Partners has the right to designate four directors. The Stockholders Agreement, including the provisions regarding the right of our stockholders to nominate and elect members of the board, will terminate upon the completion of this offering. The term of office for each director will be until his or her successor is elected at our annual meeting or his or her death, resignation or removal, whichever is earliest to occur.
Upon the completion of this offering, our certificate of incorporation will divide our board into three classes with staggered terms. Mr. Armstrong and Mr. Fruehwirth will serve as Class I directors with an initial term expiring at the first annual meeting of stockholders following the completion of this offering. At such meeting, the Class I directors shall be elected for a term expiring at our fourth annual meeting of stockholders. Mr. Cochran and Mr. Groth will serve as Class II directors with an initial term expiring at the second annual meeting of stockholders. At such meeting, the Class II directors shall be elected for a term expiring at our fifth annual meeting of stockholders. Mr. McDonough will serve as a Class III director with an initial term expiring at the third annual meeting of stockholders. At such meeting, the Class III directors shall be elected for a term expiring at our sixth annual meeting of stockholders.
Our certificate of incorporation, as amended and restated upon completion of the offering, will provide that directors may only be removed for cause. To remove a director for cause, 66- 2/3% of the voting power of the outstanding voting stock must vote as a single class to remove the director at an annual or special meeting. The certificate will also provide that, if a director is removed or if a vacancy occurs due to either an increase in the size of the board or the death, resignation, disqualification or other cause, the vacancy will be filled solely by the affirmative vote of a majority of the remaining directors then in office, even if less than a quorum remain.
77
Table of Contents
This classification of the board of directors, together with the ability of the stockholders to remove our directors only for cause and the inability of stockholders to call special meetings, may have the effect of delaying or preventing a change in control or management. See “Description of capital stock—Anti-takeover effects of our amended and restated certificate of incorporation and restated bylaws” for a discussion of other anti-takeover provisions that will be found in our certificate of incorporation.
Director independence
Our board of directors has determined that all directors except Mr. McDonough are “independent” as such term is defined by the NYSE, corporate governance standards and the federal securities laws.
Committees of the board of directors
We expect that, immediately following this offering, the standing committees of our board of directors will consist of an Audit Committee, a Compensation Committee and a Corporate Governance and Nominating Committee. Each of the committees will report to the board of directors as they deem appropriate and as the board may request. The expected composition, duties and responsibilities of these committees are set forth below.
Audit committee
The purpose of the audit committee will be set forth in the audit committee charter and will be primarily to assist the board in overseeing:
| • | the integrity of our financial statements, our financial reporting process and our systems of internal accounting and financial controls; |
| • | our compliance with legal and regulatory requirements; |
| • | the independent auditor’s qualifications and independence; |
| • | the evaluation of enterprise risk issues; |
| • | the performance of our internal audit function and independent auditor; |
| • | the preparation of an audit committee report as required by the SEC to be included in our annual proxy statement; and |
| • | our systems of disclosure controls and procedures and ethical standards. |
Upon completion of this offering, the audit committee will consist of W. Bradford Armstrong, John Fruehwirth and Steven Groth and the chairperson will be Steven Groth. Our board of directors has determined that John Fruehwirth and Steven Groth are independent directors and are “audit committee financial experts” within the meaning of Item 407 of Regulation S-K. Mr. Armstrong will not meet the heightened independence requirements for audit committee members. Within one year of the date of this offering, the audit committee will consist entirely of independent directors. Prior to the completion of this offering, our board of directors will adopt a written charter under which the audit committee will operate. A copy of the charter, which will satisfy the applicable standards of the SEC and NYSE, will be available on our website.
78
Table of Contents
Corporate governance and nominating committee
The purpose of the nominating and corporate governance committee will be set forth in the nominating and corporate governance committee charter and will be primarily to:
| • | identify individuals qualified to become members of our board of directors, and to recommend to our board of directors the director nominees for each annual meeting of stockholders or to otherwise fill vacancies on the board; |
| • | review and recommend to our board of directors committee structure, membership and operations; |
| • | recommend to our board of directors the persons to serve on each committee and a chairman for such committee; |
| • | develop and recommend to our board of directors a set of corporate governance guidelines applicable to us; and |
| • | lead our board of directors in its annual review of its performance. |
Upon completion of this offering, the nominating and corporate governance committee will consist of W. Bradford Armstrong, John Cochran II and Steven Groth and the chairperson will be John Cochran II. The nominating and corporate governance committee will consist entirely of independent directors. Prior to the completion of this offering, our board of directors will adopt a written charter under which the nominating and corporate governance committee will operate. A copy of the charter, which will satisfy the applicable standards of the SEC and NYSE, will be available on our website.
Compensation committee
The purpose of the compensation committee will be set forth in the compensation committee charter and will be primarily to:
| • | oversee our executive compensation policies and practices; |
| • | discharge the responsibilities of our board of directors relating to executive compensation by determining and approving the compensation of our Chief Executive Officer and our other executive officers and reviewing and approving any compensation and employee benefit plans, policies and programs, and exercising discretion in the administration of such programs; and |
| • | produce, approve and recommend to our board of directors for its approval reports on compensation matters required to be included in our annual proxy statement or annual report, in accordance with all applicable rules and regulations. |
Upon completion of this offering, the compensation committee will consist of John Cochran II, John Fruehwirth and Steven Groth and the chairperson will be John Fruehwirth. The compensation committee will consist entirely of independent directors. Prior to the completion of this offering, our board of directors will adopt a written charter under which the compensation committee will operate. A copy of the charter, which will satisfy the applicable standards of the SEC and NYSE, will be available on our website.
Compensation committee interlocks and insider participation
None of our executive officers has served as a member of the board of directors or compensation committee of any entity that has one or more executive officers serving on our board of directors or compensation committee.
79
Table of Contents
Other committees
Our board of directors may establish other committees as it deems necessary or appropriate from time to time.
Board’s role in risk oversight
The entire board of directors is engaged in risk management oversight. At the present time, the board of directors has not established a separate committee to facilitate its risk oversight responsibilities. The board of directors expects to continue to monitor and assess whether such a committee would be appropriate. The audit committee will assist the board of directors in its oversight of our risk management and the process established to identify, measure, monitor, and manage risks, in particular major financial risks. The board of directors will receive regular reports from management, as well as from the audit committee, regarding relevant risks and the actions taken by management to address those risks.
Code of business conduct and ethics
We have a written code of business conduct and ethics that applies to our directors, officers and employees. Prior to the completion of this offering, we will adopt a new written code of business conduct and ethics that applies specifically to our directors and officers, including our principal executive officer, principal financial and principal accounting officer and persons performing similar functions. A copy of this new code, and information regarding any amendment to or waiver from its provisions, will be posted on our website.
Director compensation
See “Executive and director compensation—Director compensation.”
80
Table of Contents
Executive and director compensation
Summary compensation table
The following table sets forth the compensation awarded to, earned by or paid to our chief executive officer and our next highest-paid executive officers for the fiscal years ended March 31, 2014 and 2013. We refer to these officers as our named executive officers or “NEOs.”
Summary compensation table
| Name and principal position | Year | Salary ($) | Bonus ($) | Stock awards(1) ($) |
All other compensation ($) |
Total | ||||||||||||||||||
| Daniel McDonough |
2014 | $ | 275,000 | $ | 425,000 | $ | 18,918 | — | $ | 718,918 | ||||||||||||||
| President and Chief Executive Officer |
2013 | $ | 250,000 | $ | 385,000 | $ | 124,496 | — | $ | 759,496 | ||||||||||||||
| E. Roger Gebhart |
2014 | $ | 232,000 | $ | 175,000 | $ | 18,225 | — | $ | 425,225 | ||||||||||||||
| Senior Vice President and Chief Financial Officer |
2013 | $ | 225,000 | $ | 120,000 | $ | 32,025 | — | $ | 377,025 | ||||||||||||||
| Donald Pokorny |
2014 | $ | 207,000 | $ | 100,000 | $ | 16,403 | — | $ | 323,403 | ||||||||||||||
| Senior Vice President, Midwest |
2013 | $ | 200,000 | $ | 115,000 | $ | 32,025 | — | $ | 347,025 | ||||||||||||||
|
|
||||||||||||||||||||||||
| (1) | Amounts represent the aggregate grant-date fair value of restricted stock awards granted to our named executive officers in the year indicated computed in accordance with FASB ASC Topic 718. For more information, please see Note 10 to the Consolidated Financial Statements of Commercial Credit Group Inc. for the year ended March 31, 2014. |
Narrative to summary compensation table
Employment arrangements with our named executive officers
We have entered into an employment agreement with each of our named executive officers in connection with their employment with us. These agreements have no specified term but can be terminated at will by either party.
Base salary
Daniel McDonough. On June 22, 2010, we entered into an employment agreement with Mr. McDonough for the position of President and Chief Executive Officer. Mr. McDonough currently receives a base salary of $275,000, which may be adjusted by the company periodically at the discretion of the board of directors. Mr. McDonough’s employment agreement requires the company to establish a bonus program that will provide bonuses to Mr. McDonough.
E. Roger Gebhart. On November 3, 2005, we entered into an employment agreement with Mr. Gebhart (originally for the position of Treasurer but Mr. Gebhart has since been promoted to the position of Senior Vice President and Chief Financial Officer). Mr. Gebhart currently receives a base salary of $232,000; his salary must be reviewed periodically and, at least annually, may be adjusted in accordance with the salary reviews in good faith but in the company’s sole discretion.
Donald Pokorny. On June 15, 2005, we entered into an employment agreement with Mr. Pokorny (originally for the position of Vice President and Co-Manager of the company’s Midwest office but Mr. Pokorny has since been promoted to the position of Senior Vice President, Midwest). Mr. Pokorny currently receives a base salary of $207,000, which may be evaluated and adjusted based on the evaluation in such manner as the company shall determine in its sole discretion.
81
Table of Contents
Annual bonuses
Annual bonuses awarded to our named executive officers are discretionary. Our annual bonuses are intended to incentivize our executive officers by providing them a variable level of compensation based upon the company’s and the individual executive’s performance. For the fiscal year ending March 31, 2014, we awarded cash bonuses of $425,000, $175,000, and $100,000 to each of Mr. McDonough, Mr. Gebhart, and Mr. Pokorny, respectively, based upon the company’s and their performances during that period. These bonuses were approved by our board of directors.
Employee benefits program
Mr. McDonough is eligible to participate in the company’s employee benefit programs generally in effect for the company’s employees in accordance with their terms. If the company ceases to sponsor a group health insurance plan, under his employment agreement, Mr. McDonough is entitled to monthly payments that will, after tax, allow him to obtain health insurance coverage for Mr. McDonough and his dependents on terms substantially equivalent to the terms Mr. McDonough and his dependents received from the company’s group health plan immediately prior to the company’s ceasing to sponsor a group health insurance plan.
Mr. Gebhart and Mr. Pokorny are each eligible to participate in the company’s employee benefit programs in effect for the company’s employees generally, subject to their participation being permissible under the plan, being without inordinate expense, and in accordance with their terms.
Retirement benefits
All of our employees are eligible to participate in the Commercial Credit Group Inc., a qualified defined contribution plan to which employees may make salary reduction contributions (which we refer to as a “401(k) plan”). We provide this 401(k) plan to help our employees save some amount of their cash compensation for retirement in a tax efficient manner. Under the 401(k) plan, eligible employees are eligible to defer a portion of their base salary, and we, at our discretion, make matching contributions at the rate of $0.50 for each $1.00 contributed by a participant, up to a maximum of 6% of eligible compensation per year.
Other compensation
No perquisites have been awarded to any of our named executive officers which have, on an individual basis, exceeded $10,000 annually.
Post-IPO employment agreements
In connection with the closing of this offering, Mr. McDonough, Mr. Gebhart, and Mr. Pokorny have entered into a new employment agreement with us and/or our affiliates effective upon the offering. These new employment agreements, which are contingent upon a successful closing of the offering, will replace and supersede each of Mr. McDonough’s, Mr. Gebhart’s and Mr. Pokorny’s current employment agreements with us and/or our affiliates described above. The employment agreements which will have an indefinite term, will be effective as of the date on which the offering closes (provided that the offering closes) and ending upon a termination of an executive’s employment by the company or the executive for any reason.
Pursuant to their new employment agreements, Mr. McDonough, Mr. Gebhart, and Mr. Pokorny, will be entitled to annual base salaries of $300,000, $239,000, and $213,000, respectively. Each of their base salaries will be reviewed by the company at least annually and may be adjusted in the discretion of the company. Mr. McDonough, Mr. Gebhart, and Mr. Pokorny will also be eligible to receive bonuses and to participate in incentive compensation plans of the company in accordance with any plan, the board of directors, or any committee or other person authorized by the board of directors, may determine from time to time.
82
Table of Contents
Pursuant to their new employment agreements, Mr. McDonough, Mr. Gebhart, and Mr. Pokorny will be permitted to participate in any equity compensation plan as the board of directors in its discretion may decide to offer, subject to the terms and conditions of any such equity compensation plan adopted by the company.
Pursuant to their new employment agreements, Mr. McDonough, Mr. Gebhart, and Mr. Pokorny will be eligible to participate in the company’s 401(k) plan in accordance with its terms.
Pursuant to their new employment agreements, Mr. McDonough, Mr. Gebhart, and Mr. Pokorny will also be eligible to participate in the medical and dental insurance programs and other employee benefit plans and programs that the company has or may establish, subject to meeting any qualification or other requirements for participation. If the company ceases to sponsor a group health insurance plan, under their new employment agreements, Mr. McDonough, Mr. Gebhart, and Mr. Pokorny are each entitled to monthly payments that will, after tax, allow each of them to obtain health insurance coverage for himself and his dependents on terms substantially equivalent to the terms that he and his dependents received from the company’s group health plan immediately prior to the company’s ceasing to sponsor a group health insurance plan. Mr. McDonough, Mr. Gebhart, and Mr. Pokorny are each entitled to 28 days of paid time off (“PTO”) for use during each calendar year of employment, subject to the company’s policies governing the use of such PTO, to be prorated and accrued for any partial year. PTO days accrued but not taken during a particular calendar year may not be carried forward and will expire if not used in the year in which they are accrued.
For a discussion of the severance pay and other benefits to be provided to Mr. McDonough, Mr. Gebhart, and Mr. Pokorny in connection with a termination of employment and/or a change in control under the employment arrangements at or following this offering, please see “—Payments provided to each NEO upon termination or change in control: post-IPO employment agreements” below.
The foregoing descriptions of Mr. McDonough’s, Mr. Gebhart’s and Mr. Pokorny’s new employment agreements as well as the descriptions below of each new agreement’s provisions regarding payments upon termination or change in control, and employee confidentially, non-competition, and non-solicitation are each qualified in its entirety by the full text of the employment agreement, the form of which is being filed as an exhibit to the registration statement of which this prospectus is a part. Capitalized terms not otherwise defined herein will have the meanings assigned to such terms in the new employment agreements.
Equity awards
2012 Equity incentive plan
The Commercial Credit Group Inc. 2012 Equity Incentive Plan (the “2012 Plan”) was established effective November 7, 2012 and was approved by our shareholders on November 7, 2012. The 2012 Plan provides that it shall be administered by the compensation committee of our board of directors unless the board of directors has not established a Compensation Committee, in which case the 2012 Plan shall be administered by the board of directors. Accordingly, until our compensation committee is established upon the completion of this offering, the 2012 Plan is currently administered by our board of directors, who are authorized to make awards of restricted stock and stock options under the 2012 Plan. The maximum number of shares of our common stock for which Awards may be granted under the 2012 Plan is 35,000 shares, of which 50% of the authorized shares may be granted as “Performance-Based Restricted Stock Awards” (described below) and 50% may be issued as restricted stock awards that vest upon the passage of time (“Time-Vesting Restricted Stock Awards”).
Although the 2012 Plan authorizes the award of stock options, none of the 35,000 shares of our common stock authorized for awards under the 2012 Plan have been allocated to the award of stock options. Accordingly, this description of the 2012 Plan and awards granted under the 2012 Plan does not contain any further description of stock options.
83
Table of Contents
Eligibility
Awards may be granted only to managerial and other key employees, directors and consultants of the company or any of the company’s subsidiaries.
Restricted stock
A restricted stock grant is an award of one or more shares of our common stock to an eligible person that is subject to forfeiture if the vesting terms and conditions are not achieved. Under the 2012 Plan, the board of directors may subject a restricted stock grant to such terms and conditions as it deems appropriate.
Restricted stock granted by the board of directors under the 2012 Plan that constitutes Time-Vesting Restricted Stock Awards requires the participant to remain in the employment or service of the company for the period of time specified in the restricted stock agreement, commencing on the date of the award. The board of directors may provide for the lapse of forfeiture restrictions (i.e., vesting) in installments during the restriction period or all at once at the end of the restriction period. The board of directors may also provide for the lapsing of restrictions based upon the performance by the participant of past or future services or the attainment of performance targets. Additionally, the board of directors may provide for the lapsing of restrictions upon the occurrence of a designated event. Finally, under the 2012 Plan, the board of directors may provide relief from the requirement that the participant remain employed by or in the service of the company during the restriction period for specified reasons. All of the forgoing restrictions and the conditions under which the restrictions will lapse are determined by the board of directors in its sole discretion. To date, the restricted stock granted by our board of directors that constitutes Time-Vesting Restricted Stock Awards vests in equal annual installments over five years, subject to the participant’s continued employment. Time-Vesting Restricted Stock Awards granted to Mr. McDonough, Mr. Gebhart, and Mr. Pokorny will immediately vest upon the NEO’s death, retirement, disability, or in the event of a “Liquidating Event.” For the purposes of the foregoing, a “Liquidating Event,” as defined in the 2012 Plan, generally means the occurrence of one of the following events: (i) any person or group other than the Investors, as defined below, acquires a majority of the company’s voting securities and the Investors dispose of more than 35% of their initially-acquired stock of the company; (ii) the a consolidation, merger or other transaction involving the company in which a person or group other than the Investors acquires a majority of the voting securities of the surviving entity and the Investors dispose of more than 35% of their initially-acquired stock of the company, (iii) any person or group other than the Investors acquires all or substantially all of the assets of the company, (iv) a transaction or transaction resulting in the Investors no longer having control of the board of directors, or (v) a complete liquidation of the company. “Investors” refers to certain Lovell Minnick Equity Partners investment funds and their affiliated investment funds.
A Performance-Based Restricted Stock Award vests if a Liquidating Event occurs within 15 years of the award’s grant and certain Return-On-Investment (“ROI”) Triggers are met at the time of a Liquidating Event. If these ROI Triggers are not met, 25% of the Performance-Based Restricted Stock Awards may still vest if the Compound Annual Growth Rate of Receivables equals or exceeds 20% at the time of the Liquidating Event, and another 25% of the Performance-Based Restricted Stock Awards may still vest if the Cumulative Average Return on Equity equals or exceeds 12.5% at the time of the Liquidating Event. Unless an award provides otherwise, a Performance-Based Restricted Stock Award that has not vested as of a participant’s termination date or the date on which the participant ceases to provide services will be forfeited at that time. However, under the 2012 Plan, the board of directors may, in its sole discretion, provide for the lapse of restrictions on restricted stock granted under the 2012 Plan upon the occurrence of a designated event. The board of directors intends to amend the Performance-Based Restricted Stock Awards to provide for the vesting of all Performance-Based Restricted Stock Awards immediately after the completion of our initial public offering.
84
Table of Contents
Transferability
Awards under the 2012 Plan are not transferable except by will or the laws of descent and distribution.
Amendment and termination
The board of directors may at any time terminate the 2012 Plan and may amend it from time to time. However, the board of directors may not amend the 2012 Plan without the approval of the company’s shareholders if the amendment (i) would require shareholder approval under the applicable requirements for incentive stock options under Section 422 of the Code; or (ii) would require shareholder approval under applicable law or under the rules of any national securities exchange on which the company’s common stock is listed at the time the amendment is proposed. No amendment may materially affect a participant’s rights with respect to any outstanding award without the written consent of the participant.
2015 Stock incentive plan
In anticipation of our initial public offering, we intend to adopt a new equity incentive plan (the “2015 Plan”), under which we expect to make periodic grants of equity and equity-based awards in our common stock to our NEOs, other key employees, and other service providers. The following description of the 2015 Plan is qualified in its entirety by the full text of the proposed plan, the form of which is being filed as an exhibit to the registration statement of which this prospectus is a part. Capitalized terms not otherwise defined herein will have the meanings assigned to such terms in the 2015 Plan.
Types of awards granted under the 2015 plan
The 2015 Plan permits the grant of the following types of incentive awards: (1) stock options, including incentive stock options and nonqualified stock options, (2) stock appreciation rights (“SARs”), (3) restricted stock, (4) performance shares, (5) other stock-based awards, and (6) performance-based cash awards (each, an “Award”).
Administration of the 2015 plan
The 2015 Plan will be administered by a committee (the “Committee”) which has the authority to, among other things, grant awards and determine the terms and conditions of awards (subject to the terms of the 2015 Plan), including the exercise price of stock options and stock appreciation rights and the vesting schedule of awards. Until the compensation committee of our board of directors is established following the completion of our offering, our board of directors will act as the Committee.
Stock available for awards
The aggregate number of shares of the company’s common stock that currently may be issued pursuant to Awards under the 2015 Plan is shares.
Any shares of common stock that are subject to restricted stock, performance shares or other stock-based awards that confer potential for gain other than based on the appreciation of the value of a share of common stock will be counted against this limit as one share for every share granted.
Eligibility to receive awards
Awards under the 2015 Plan may be granted to employees and consultants of the company and its subsidiaries or parent corporations (as defined under Section 424 of the Code) and to non-employee directors of the company.
85
Table of Contents
Stock options
A stock option is the right to acquire shares of the company’s common stock at a fixed exercise price for a fixed period of time. Under the 2015 Plan, the Committee may grant nonqualified stock options and/or incentive stock options (only to eligible employees). The Committee will determine the number of shares subject to each option, the term of each option (which may not exceed 10 years (or five years in the case of an incentive option granted to a 10% stockholder)), the exercise price, the vesting schedule, and other material terms of each option.
The exercise price of the shares subject to each option cannot be less than 100% of the fair market value on the date of grant (or, in the case of an incentive stock option granted to a 10% stockholder, 110% of the fair market value). Options vest and become exercisable at the times and on the terms established by the Committee at the time of grant. The exercise price of each option granted under the 2015 Plan must be paid in full in cash or its equivalent at the time of exercise. The Committee also may permit payment through the tender of shares that are already owned by the participant, a broker-facilitated cashless exercise, or by any other form of legally permissible consolidation which the Committee determines to be consistent with the purpose of the 2015 Plan.
Stock appreciation rights
Awards of stock appreciation rights (SARs) may be granted in tandem with or in connection to all or any part of an option, either concurrently with the grant of an option or at any time thereafter during the term of the option, or may be granted independently of options. A SAR is a right to receive a payment in Common Stock or cash (as determined by the Committee) equal in value to the excess of the fair market value of one share of Common Stock on the date of exercise over the exercise price per share established in connection with the SAR. The maximum term permitted for SARs is ten years. The Committee determines the terms of SARs, except that the exercise price of a SAR that is granted independently of an option may not be less than 100% of the fair market value of the shares on the date of grant and the exercise price of a SAR that is granted in tandem with or in connection to an option may not be less than the exercise price of the related option. The Committee may determine the effect of termination of employment or service on the rights and benefits under SARs and in doing so may make distinctions based upon the cause of termination or other factors.
A SAR granted in tandem with an option will entitle the participant to exercise the SAR by surrendering to the company a portion of the unexercised related option. The participant will receive in exchange from the company an amount equal to the excess of the fair market value of the shares on the date of exercise of the SAR covered by the surrendered portion of the related option over the exercise price of the shares covered by the surrendered portion of the related option. When a SAR granted in tandem with an option is exercised, the related option, to the extent surrendered, will cease to be exercisable. A SAR granted in connection with an option will be exercisable until, and will expire no later than, the date on which the related option ceases to be exercisable or expires. A SAR granted in connection with an option will automatically be deemed exercised after the related option is exercised.
Restricted stock
Awards of restricted stock are shares that vest in accordance with the terms and conditions established by the Committee. The Committee will determine the number of shares subject to a restricted stock award and the other terms of the Award (including the purchase price, if any, and transfer restrictions). In determining whether an Award of restricted stock should be made, and/or the vesting schedule for any such award, the Committee may impose whatever conditions to vesting as it determines to be appropriate or determine that fully-vested shares should be awarded. For example, the Committee may determine to grant an award of restricted stock that will vest only if the participant continues employment and certain performance goals
86
Table of Contents
established by the Committee are satisfied. The performance goals for performance-based restricted stock will be based on one or more of the objective criteria set forth on Exhibit A to the 2015 Plan, discussed in general below, and such other factors as the Committee may determine in its sole discretion, including to comply with Code Section 162(m).
Holders of restricted stock awards are entitled to dividends paid on the underlying stock, although such dividends may be subject to the same vesting conditions as the restricted stock to which they are attributable.
Performance shares
A performance share is the equivalent of one share of common stock. The grant of performance shares will specify one or more performance criteria to meet within a specified period determined by the Committee at the time of grant. The performance criteria for performance shares will be based on one or more of the objective criteria set forth on Exhibit A to the plan, discussed in general below. If, by the end of the performance period, the recipient has achieved the specified performance criteria, he or she will be deemed to have fully earned the performance shares. To the extent earned, the performance shares will be paid to the recipient at the time and in the manner determined by the Committee in cash, shares of common stock or any combination thereof.
Other stock-based awards
The Committee may, subject to limitations under applicable law, make a grant of such other stock-based awards (including, without limitation, stock equivalent units, restricted stock units, deferred stock units and awards valued by reference to the book value of shares of Common Stock) under the 2015 Plan that are payable in cash or denominated or payable in or valued by shares of Common Stock or factors that influence the value of such shares. The Committee will determine the terms and conditions of any such other awards, which may include the achievement of certain minimum performance criteria for purposes of compliance with Section 162(m) of the Code and/or a minimum vesting period. The performance goals for performance-based other stock-based awards will be based on one or more of the objective criteria set forth on Exhibit A to the 2015 Plan, discussed in general below.
Performance-based cash awards
Cash awards may be granted either alone or in tandem with other awards granted under the 2015 Plan. Cash awards are contingent upon the satisfaction of certain pre-established performance criteria that are reached within a specified performance period, each of which, together with any other terms and conditions, will be determined by the Committee in its sole discretion at the time of grant. At the time the performance criteria are established, the Committee will prescribe a formula to determine the maximum or minimum percentages (which may be greater or less than 100%) of the individual target award which may be earned or payable based upon the degree of attainment of the performance criteria during the performance period. The Committee may, in its sole discretion, elect to pay a participant an amount that is less than the participant’s individual target award regardless of the degree of attainment of the performance criteria; provided that, except as otherwise specified by the Committee with respect to an individual target award, no discretion to reduce a performance-based cash award earned based on achievement of the applicable performance criteria will be permitted for any performance period in which a change of control occurs, or during such performance period with regard to the prior performance periods if the performance-based cash awards for the prior performance periods have not been paid by the time of the change of control, with regard to individuals who were participants at the time of the change of control. The performance criteria for performance-based cash awards will be based on one or more of the objective criteria set forth on Exhibit A to the 2015 Plan, discussed in general below.
87
Table of Contents
Performance goals
Awards under the 2015 Plan may be made subject to performance conditions as well as time-vesting conditions. Awards that are intended to qualify as “performance-based compensation” under Section 162(m) of the Code will be based on the attainment of a certain target level of, or a specified increase or decrease in, one or more of the following criteria selected by the Committee:
| • | enterprise value or value creation targets; |
| • | after-tax or pre-tax profits, including without limitation as attributable to our continuing and/or other operations; |
| • | operational cash flow or economic value added; |
| • | specified objectives with regard to limiting the level of increase in all or a portion of, our bank debt or our other long-term or short-term public or private debt or other similar financial obligations, or other capital structure improvements, which may be calculated net of cash balances and/or other offsets and adjustments as may be established by the Committee; |
| • | earnings per share or earnings per share from continuing operations; |
| • | sales (domestic and/or international), operating performance and efficiency (including shipment performance and inventory management), revenues, net income, gross margin, operating income or earnings before income tax or other exclusions; |
| • | return on capital employed, return on invested capital or return on assets; |
| • | total stockholder return, including after-tax or pre-tax return on stockholder equity; |
| • | fair market value or book value of the shares of Common Stock; |
| • | growth in the value of an investment in Common Stock assuming the reinvestment of dividends, dividend growth or market capitalization; |
| • | a transaction that results in the sale of our stock or assets; |
| • | earnings before interest, taxes plus amortization and depreciation; |
| • | reduction in expenses or cost savings; |
| • | strategic objectives including management development, new product development and introduction; |
| • | individual participant goals and objectives, including management development, new product development and introduction; or |
| • | any financial metric set forth in the 2015 Plan or in our financial statements as a percentage of another financial metric. |
Performance goals may differ from participant to participant and from Award to Award. Performance goals also may be based on individual participant performance objectives, as determined by the Committee, in its sole discretion.
In addition, all performance goals may be based upon our (or our affiliates, subsidiaries, divisions, other operational units or administrative departments) attainment of specified levels under one or more of the measures described above relative to the performance of other corporations. To the extent permitted by law, the Committee may designate additional business criteria on which the performance goals may be based or adjust, modify or amend those criteria.
88
Table of Contents
Change of control
In the event of a Change in Control, the Committee may, but is not obligated to :
| • | accelerate, vest or cause the restrictions to lapse with respect to all or part of an award; |
| • | provide for the cancellation, without payment, of any options SARs, or other awards the value of which is based upon appreciation in the award from the time of grant, if no appreciation has occurred; |
| • | provide for the purchase of options, SARs and other awards that are “in the money;” or |
| • | provide for the issuance of substitute awards. |
For the purposes of the foregoing, a “Change in Control,” as defined in the 2015 Plan, generally means the occurrence of one of the following events:
| • | the consummation of a transaction, including a merger, a disposition of all or substantially all or substantially all of the company’s assets, or the adoption of a plan of liquidation unless upon the completion of the transaction, 50% of more of the beneficial ownership of the voting power of the company or of the surviving corporation is held by the same persons as held beneficial ownership immediately prior to the transaction; |
| • | beneficial ownership of securities representing 50% or more of the combined voting power of the company is acquired, other than from the company, by any person; or |
| • | an election of individuals to our board of directors that causes a change in a majority of our board of directors, unless the individuals elected are approved by a vote of at least two-thirds of the directors then in office who either were directors as of the effective date of the 2015 Plan or whose election or nomination for election was previously so approved. |
Limited transferability of awards
Awards granted under the 2015 Plan generally are nontransferable, other than by will or by the applicable laws of descent and distribution. However, the Committee may provide for the transferability of nonqualified stock options at the time of grant or thereafter to certain family members or trusts. Transfers for value are prohibited.
Amendment and termination of the 2015 plan
The board of directors or the Committee may generally suspend, terminate, modify or amend the 2015 Plan at any time, subject to stockholder approval if required under applicable law or stock exchange requirements. However, unless otherwise required by law or specifically provided in the 2015 Plan, the rights of a participant with respect to awards granted prior to any amendment, suspension, modification or termination may not be adversely affected without the consent of such participant. In addition, other than adjustments or substitutions specifically permitted in the 2015 Plan, no amendment to the 2015 Plan or to an outstanding award may reduce the exercise price of stock options or SARs or cancel out-of-the-money outstanding stock options or SARs in exchange for cash, other awards or stock options or SARs with an exercise price that is less than the exercise price of the original stock option or SAR, unless such transaction is approved in advance by the stockholders.
Federal Income tax consequences
The following is a brief summary of the general federal income tax consequences to U.S. taxpayers and the company with respect to the grant, vesting and exercise of Awards granted under the 2015 Plan. This summary
89
Table of Contents
of the general federal income tax consequences to U.S. taxpayers and the company also applies to restricted stock granted under the 2012 Plan. This summary does not purport to be complete and does not discuss the tax consequences of a participant’s death, the tax consequences of an Award that is subject to but does not satisfy the deferred compensation rules of Section 409A of the Internal Revenue Code, or the tax laws of any locality, state or foreign country in which the participant may reside. Tax consequences for any particular individual may be different.
Nonqualified stock options
No taxable income is recognized when a nonqualified stock option is granted to a participant. Upon exercise of a nonqualified stock option with respect to vested shares, the participant will generally recognize ordinary income in an amount equal to the excess of the fair market value (on the exercise date) of the shares purchased over the exercise price of the option. Any taxable income recognized in connection with exercise of a nonqualified stock option would be added to the tax basis of the shares and, with respect to an employee, is subject to tax withholding by the company. Any additional gain or loss recognized upon any later disposition of the shares by the participant would be either long-term or short-term capital gain or loss, depending on how long the stock was held.
Incentive stock options
In general, no taxable income is recognized by a participant upon the grant of an incentive stock option. If the participant does not dispose of the option shares within the two-year period after the date of grant or within one year after the receipt of such shares by the participant (an earlier disposition is a “disqualifying disposition”), then generally upon sale of such shares, any amount realized in excess of the exercise price paid for the shares will be taxed to such participant as capital gain (or loss). The amount by which the fair market value of the shares on the exercise date of an incentive stock option exceeds the exercise price generally will constitute an item which increased the participant’s “alternative minimum taxable income.” Alternative minimum tax is an alternative method of calculating the income tax that must be paid each year, which includes certain additional items of income and tax preferences and disallows or limits certain deductions otherwise allowable for regular tax purposes. Alternative minimum tax is payable only to the extent that the alternative minimum tax exceeds “ordinary” federal income tax for the year (computed without regard to certain credits and special taxes).
If shares acquired upon the exercise of an incentive stock option are disposed of in a disqualifying disposition, the participant generally would include in ordinary income in the year of disposition an amount equal to the excess of the fair market value of the shares at the time of exercises (or, if less, the amount realized on the disposition of the shares), over the exercise price paid for the shares. In the case of both nonqualified stock options and incentive stock options, special federal income tax rules apply if the company’s common stock is used to pay all or part of the option exercise price, and different rules than those described above will apply if unvested shares are purchased on exercise of the option.
Stock appreciation rights
Generally, no taxable income is recognized when a SAR is granted to a participant. Upon exercise of a SAR, the participant will generally recognize ordinary income in an amount equal to the amount of cash received or the fair market value of any shares received as of the payment date. Any additional gain or loss recognized upon any later disposition of the shares would be either long-term or short-term capital gain or loss, depending on how long the stock was held.
90
Table of Contents
Restricted stock
No taxable income is generally recognized when restricted stock is granted to a participant if the shares are subject to vesting requirements. Upon vesting (or at grant as to any shares that are vested at grant), the participant will generally recognize ordinary income in an amount equal to the then fair market value of the shares subject to the portion of the restricted stock award becoming vested. A participant who receives a restricted stock award may also elect to be taxed at ordinary income rates at the time of grant (notwithstanding that the shares of restricted stock are unvested), in which case future changes in the value of the shares are eligible to be taxed as capital gain or loss when the shares are ultimately sold.
Cash awards
Upon receipt of cash, the recipient will have taxable ordinary income in the year of receipt equal to the cash received. Any cash received by an employee will be subject to tax withholding by the company.
Tax effect for the company
The company generally will be entitled to a tax deduction in connection with an Award under the 2015 Plan in an amount equal to the ordinary income realized by a participant at the time the participant recognizes such income (for example, upon the exercise of a nonqualified stock option). Special rules limit the deductibility of compensation paid to the chief executive officer and to certain of the company’s other executive officers. If compensation attributable to Awards to such individuals is not “performance-based” within the meaning of Section 162(m) of the Internal Revenue Code, the company may not be permitted to deduct compensation paid to such individuals to the extent that aggregate non-performance-based compensation exceeds $1,000,000 per individual in any tax year. Furthermore, if an Award is accelerated under the 2015 Plan in connection with a “change in control” (as this term is used under the Internal Revenue Code), the company may not be permitted to deduct the portion of the compensation attributable to the acceleration (“parachute payments”) if it exceeds certain threshold limits under the Internal Revenue Code (and certain related excise taxes may be triggered).
Future 2015 plan awards
Except as set forth above, the terms and number of awards to be granted in the future under the Incentive Plan are to be determined in the discretion of the Committee. Since no other determinations regarding awards or grants have yet been made, the benefits or amounts that will be received by or allocated to our eligible employees, consultants or non-employee directors cannot be determined at this time.
Following completion of this offering, we intend to file a registration statement on Form S-8 under the Securities Act to register the full number of shares of our common stock that will be available for issuance under the 2015 Plan.
Payments provided to each NEO upon termination or change in control.
Mr. McDonough. If Mr. McDonough’s employment is terminated for any reason, he is entitled to all earned but unpaid base salary and bonus, as well as accrued but unused vacation benefits, any vested 401(k) and other benefits, reimbursement of reasonable business expenses incurred during his employment, and the right to elect certain benefit coverage continuation under COBRA.
If Mr. McDonough’s employment is terminated without cause or if Mr. McDonough resigns for good reason (each as defined in Mr. McDonough’s employment agreement), he is entitled to a bonus for the fiscal year in which the termination occurs (pro rated based on the number of days in such year that he was employed) and 78 weeks of
91
Table of Contents
severance pay at a weekly rate calculated as his yearly base salary rate in effect at the end of his employment term plus the annual average of all bonuses paid to him during the first two fiscal years prior to the fiscal year in which his employment terminated, divided by 52. For the twelve months following the end of his employment term, Mr. McDonough is also entitled to whatever health and life insurance benefits he was enrolled in just prior to his employment termination or to payments which would allow him to purchase substantially similar benefits. A Change in Control (as defined in Mr. McDonough’s employment agreement) is considered a “good reason” for purposes of Mr. McDonough’s right to resign for good reason.
If Mr. McDonough dies during his employment, we will continue to provide health insurance benefits to his dependants for 12 months at no cost to them. If Mr. McDonough becomes disabled during his employment and is no longer able to continue in his role, we will continue to provide health and life insurance benefits to him for one year after the termination of his employment.
Mr. Gebhart. Pursuant to the terms of Amendment One of Mr. Gebhart’s employment agreement entered into on January 23, 2013, we agreed to pay Mr. Gebhart a severance benefit equal to his then current annual base salary, pro-rated over twelve months, in the event that Mr. Gebhart is terminated by the company without cause. Mr. Gebhart’s eligibility for severance pay is conditioned upon his continued compliance with our Confidentiality Policy and his non-compete and non-solicitation agreements.
In the event that Mr. Gebhart’s termination without cause is a result of a change in control of the company (as defined in Mr. Gebhart’s employment agreement), he is entitled to severance pay pro-rated over the following eighteen months and calculated according to the following formula: the amount of the most recent bonus payment actually paid by us to Mr. Gebhart within the previous fourteen months multiplied by one and one half (1.5) plus Mr. Gebhart’s then current annual base salary.
If Mr. Gebhart’s employment is terminated as a result of disability or death, Mr. Gebhart or his estate will be entitled to receive the compensation and benefits earned through the effective date of termination, plus any other benefits due to him under the company’s employee benefits plans.
Mr. Pokorny. Pursuant to his employment agreement, Mr. Pokorny is not entitled to severance pay after termination of his employment. He is, however, entitled to salary continuation payments for up to one year after his termination in the event that he is restricted from competing against us for that year.
Vesting of Equity Upon Termination of Change in Control. Time-Vesting Restricted Stock Awards granted to Mr. McDonough, Mr. Gebhart, and Mr. Pokorny will immediately vest upon the NEO’s death, retirement, disability, or in the event of a “Liquidating Event.”
Payments provided to each NEO upon termination or change in control: post-IPO employment agreements
As discussed above, in connection with this offering, Mr. McDonough, Mr. Gebhart, and Mr. Pokorny will each enter into a new employment agreement with us and/or our affiliates effective upon the offering. These new employment agreements, which are contingent upon a successful closing of the offering, will replace and supersede each of Mr. McDonough’s, Mr. Gebhart’s and Mr. Pokorny’s current employment agreements with us and/or our affiliates described above.
Death or Disability. Under their new employment agreements, if his employment with the company is terminated due to death or disability (as defined in the employment agreement) each of Mr. McDonough, Mr. Gebhart, and Mr. Pokorny is entitled to receive the compensation and benefits earned by him through the effective date of termination, plus any other benefits due to him under the company’s employee benefits plans. In addition, if his employment with the company is terminated due to death, each of Mr. McDonough’s, Mr. Gebhart’s, and Mr. Pokorny’s eligible dependents shall be entitled, at no cost to them, to continued
92
Table of Contents
coverage for 12 full months under any health plans in which they were participating at the time of the his death, or if such coverage cannot be provided, to monthly cash payments to his family in an amount, on an after-tax basis, necessary to obtain substantially equivalent coverage.
Termination Without Cause or by the NEO for Good Reason. Under their new employment agreements, if each of Mr. McDonough’s, Mr. Gebhart’s, or Mr. Pokorny’s employment with the company is terminated without cause (as defined in the employment agreements) or if he terminates his employment with the company for good reason (as defined in the employment agreements), each is entitled to receive his base salary and benefits earned by him through the date of termination. In addition, in such circumstances, and subject to the requirement that he execute a release of claims in favor of the company and its affiliates, each of Mr. McDonough, Mr. Gebhart, and Mr. Pokorny is entitled, for the year of termination, to a pro-rata bonus payment (based on the number of days elapsed during the year of termination and the most recent bonus payment actually paid or accrued and payable by the company to him within the previous 14 months, if any), plus a severance benefit (the “Severance Pay”) equal to the named executive officer’s base salary, paid in accordance with the company’s customary payroll practices, over a 12-month period. The 12-month period commences with the first payroll period which coincides with or in which the NEO’s release of claims becomes effective. However, if Mr. McDonough’s, Mr. Gebhart’s, or Mr. Pokorny’s employment with the company is terminated without cause or if he terminates his employment with the company for good reason as a result of, or within 12 months after a Change in Control, the Severance Pay is equal to 1.5x the sum of (i) the NEO’s base salary (in effect prior to any reduction) plus (ii) the amount of the most recent bonus actually paid or accrued and payable by the company to the NEO within the prior 14 months, paid in accordance with the company’s customary payroll practices and over an 18-month period. The 18-month period commences with the first payroll period which coincides with or in which the NEO’s release of claims becomes effective. Mr. McDonough, Mr. Gebhart, and Mr. Pokorny would not be entitled to the Severance Pay if they are employed by the buyer or receiver of the company’s capital stock, assets or employed by a successor in interest of the company. A change in control would occur if a person or group of persons becomes or obtains to become the owner of more than 50% of the outstanding Common Stock. An initial public offering does not constitute a change in control.
Under their new employment agreements, if Mr. McDonough’s, Mr. Gebhart’s, or Mr. Pokorny’s employment with the company is terminated without cause or if he terminates his employment with the company for good reason (as defined in the employment agreements), each is also entitled, for a period of 12 months following termination of employment (18 months if the termination is in connection with a change in control), to continued coverage under any health plans and/or life insurance plans in which he was participating at the time of the termination. This continuation coverage is subject to the company’s continuing such benefit plans for its employees and subject also to the named executive officer making timely payment of premiums at the active employee premium rate. If such coverage cannot be provided, the company will make a monthly cash payment to the NEO in an amount, on an after-tax basis, necessary to obtain substantially equivalent coverage. Any continuation coverage in effect will end earlier than the applicable 12-month or 18-month period if the NEO becomes eligible for comparable coverage under another employer’s benefit plans.
Vesting of Equity Upon Termination of Change in Control. If Mr. McDonough’s, Mr. Gebhart’s, or Mr. Pokorny’s employment with the company is terminated without cause or if he terminates his employment with the company for good reason (as defined in the employment agreements) as a result of, or within 12 months of a change in control (as defined in their new employment agreements), any outstanding, unexercised stock options held by the named executive officer will vest and be exercisable for the remaining original term of the option and any unvested stock and other equity awards held by the named executive officer under any of the company’s equity plans will immediately vest.
93
Table of Contents
Employee confidentiality, non-competition, and non-solicitation agreements.
Mr. McDonough. Under the terms of his employment agreement, during his employment with the company and for three years afterwards, Mr. McDonough is obligated to maintain the confidentiality of the company’s confidential information. In the event his employment with the company terminates, Mr. McDonough’s employment agreement requires him to return all property, documents, data, and confidential information prepared or collected by him during the course of his employment; Mr. McDonough is not permitted to retain any confidential information belonging to the company.
For a period of 12 months following his employment termination date, Mr. McDonough is prohibited by his employment agreement with the company from competing against the company, anywhere in the continental United States, in its current business lines and in the businesses engaged in by the company during the last 12 months of Mr. McDonough’s employment. Mr. McDonough is also prohibited, for the same period, (i) from soliciting the company’s customers for business that is competitive with the company’s businesses or encouraging a customer to reduce its business with the company, (ii) from soliciting or encouraging the company’s suppliers not to business with, or to reduce their business with the company and (iii) hiring or engaging as an independent contractor, or soliciting or encouraging to leave the company, any person who was employed or engaged by the company. If Mr. McDonough’s employment with the company is terminated by the company without cause or by Mr. McDonough for good reason, the 12-month restricted period described above is increased to 18 months.
Mr. Gebhart. As a condition of his employment, Mr. Gebhart was required to sign the company’s confidentiality policy, which obligates Mr. Gebhart to maintain the confidentiality of the company’s confidential information during his employment with the company and afterwards. The company’s confidentiality policy also obligates Mr. Gebhart to return all company property and confidential information to the company upon his termination of employment.
For a period of 12 months following his employment termination date, Mr. Gebhart is prohibited by his employment agreement with the company from directly or indirectly, on his own behalf or on behalf of another person, from inducing or attempting to induce any employee, consultant, independent contractor of other person affiliated with the company or an affiliate to terminate such affiliation or breach any agreement with the company. If Mr. Gebhart’s employment with the company is terminated by the company without cause or by Mr. Gebhart for good reason, the 12-month restricted period described above is increased to 18 months.
Mr. Pokorny. As a condition of his employment, Mr. Pokorny was required to sign the company’s confidentiality policy, which obligates Mr. Pokorny to maintain the confidentiality of the company’s confidential information during his employment with the company and afterwards. The company’s confidentiality policy also obligates Mr. Pokorny to return all company property and confidential information to the company upon his termination of employment.
During his employment with the company and for a period of 12 months following his employment termination date, Mr. Pokorny is prohibited by his employment agreement from competing against the company in its business lines, without the company’s written consent, anywhere in the United States. Mr. Pokorny is also prohibited, for the same period, without the company’s written consent, (i) from soliciting the company’s customers for business that is competitive with the company’s businesses or encouraging a customer to reduce its business with the company, and (ii) from directly or indirectly, on his own behalf or on behalf of another person, from inducing or attempting to induce any employee, consultant, independent contractor of other person affiliated with the company or an affiliate to terminate such affiliation or breach any agreement with the company. In the event he is restricted from competing after the termination of his employment, we have agreed to make salary continuation payments during the period he is so restricted in the amount of his salary in effect at the time of the termination of his employment.
94
Table of Contents
Employee confidentiality, non-competition, and non-solicitation agreements: post-IPO employment agreements
Under the terms of their new employment agreements, which will become effective upon the closing of the offering, during their employment with the company and afterwards, Mr. McDonough and Mr. Pokorny are each obligated to maintain the confidentiality of the company’s confidential information and trade secrets. Mr. McDonough and Mr. Pokorny are also obligated, (i) upon request while employed by the company, and (ii) immediately on the date on which their employment with the company terminates, to return to the company all confidential information of the company and all company property of any kind in their possession.
During their employment with the company and for a period of 12 months following their termination, each of Mr. McDonough and Mr. Pokorny is prohibited by his new employment agreement from competing against the company, (i) in the geographic territory assigned to him by the company during the last 12 months of his employment, (ii) in those states and provinces within the United States and Canada in which he assisted the company in the conduct of its business during the last 12 months of employment, and (iii) in those states and provinces within the United States and Canada in which the company engaged in its business and had company customers at any time during the last 12 months of his employment. Mr. McDonough and Mr. Pokorny are also each prohibited, for the same period, (i) from soliciting the company’s customers in an effort to divert or take away business from the company, (ii) from soliciting, without its prior written consent, the company’s vendors and manufacturers through whom the company sources business, in order to limit or modify a vendor’s or manufacturer’s business relationship with the company, or to divert or transfer any business opportunity from the company, and (iii) from soliciting, recruiting, or influencing any employee of the company who is or was employed by the company at the time of, or during the 12-month period prior to Mr. McDonough’s or Mr. Pokorny’s termination date, as applicable, to cease working for the company. If Mr. McDonough’s or Mr. Pokorny’s employment with the company is terminated by the company without cause or by him for good reason as a result of or within 12 months of a change in control (as defined in the new employment agreements), the 12-month restricted period described above is increased to 18 months, commencing on the termination date.
Mr. Gebhart’s new employment agreement contains confidentiality and non-solicitation provisions that are identical to those contains in Mr. McDonough’s and Mr. Pokorny’s new employment agreements except that Mr. Gebhart’s new employment agreement does not include a restriction against competing against the company.
Outstanding equity awards as of March 31, 2014
The following table presents the outstanding and unvested equity awards held by each of our named executive officers as of March 31, 2014. None of our NEOs held any options that were outstanding as of March 31, 2014.
95
Table of Contents
Outstanding equity awards at fiscal year-end
Stock awards
| Name | No. of shares or units of stock that have not vested (#)(1) |
Market value as of grant date of shares or units of stock that have not yet vested ($) |
Equity incentive plan awards: number of unearned shares, units or other rights that have not yet vested (#)(2) |
Equity incentive plan awards: market or payout value as of grant date of unearned shares, units or other rights that have not yet vested ($) |
||||||||||||
| Daniel McDonough |
3,585 | $ | 87,659.37 | 4,352 | $ | 37,430.39 | ||||||||||
| E. Roger Gebhart |
1,289 | $ | 32,734.21 | 1,486 | $ | 12,809.74 | ||||||||||
| Donald Pokorny |
1,239 | $ | 31,345.71 | 1,436 | $ | 12,375.74 | ||||||||||
|
|
||||||||||||||||
| (1) | Mr. McDonough’s restricted stock awards are scheduled to vest based on his continued employment with the company as follows: 3,066 shares granted on March 1, 2013 are scheduled to vest in four equal annual installments on each of March 1, 2015, March 1, 2016, March 1, 2017, and March 1, 2018; 519 shares granted on February 1, 2014 are scheduled to vest in five equal annual installments on each of February 1, 2015, February 1, 2016, February 1, 2017, February 1, 2018 and February 1, 2019 with an additional share vesting on February 1, 2015. |
Mr. Gebhart’s restricted stock awards are scheduled to vest based on his continued employment with the company as follows: 789 shares granted on March 1, 2013 are scheduled to vest in four equal annual installments on each of March 1, 2015, March 1, 2016, March 1, 2017, and March 1, 2018; 500 shares granted on February 1, 2014 are scheduled to vest in five equal annual installments on each of February 1, 2015, February 1, 2016, February 1, 2017, February 1, 2018 and February 1, 2019 with an additional share vesting on February 1, 2015.
Mr. Pokorny’s restricted stock awards are scheduled to vest based on his continued employment with the company as follows: 789 shares granted on March 1, 2013 are scheduled to vest in four equal annual installments on each of March 1, 2015, March 1, 2016, March 1, 2017, and March 1, 2018; 450 shares granted on February 1, 2014 are scheduled to vest in five equal annual installments on each of February 1, 2015, February 1, 2016, February 1, 2017, February 1, 2018 and February 1, 2019 with an additional share vesting on February 1, 2015.
| (2) | Mr. McDonough’s performance-based restricted stock awards vest based upon the following: Mr. McDonough’s performance-based restricted stock awards vest if a Liquidating Event (as defined in the Plan and described in the narrative above) occurs within 15 years of the award’s grant and certain Return-On-Investment (ROI) Triggers are met at the time of a Liquidation Event. If these ROI Triggers are not met, 25% of the Performance-Based Restricted Stock Awards may vest if the Compound Annual Growth Rate of Receivables, (as defined in the Plan) equals or exceeds 12.5% at the time of the Liquidating Event and another 25% of the Performance-Based Restricted Stock Awards may still vest if the Cumulative Average Return on Equity equals or exceeds 12.5% at the time of the Liquidating Event. A Performance-Based Restricted Stock Award that has not vested as of Mr. McDonough’s termination date will be forfeited at that time. Mr. McDonough received awards of performance-based restricted stock as follows: 3,833 shares on March 1, 2013 and 591 shares on February 1, 2014. |
Mr. Gebhart’s performance-based restricted stock awards vest based upon the following: Mr. Gebhart’s performance-based restricted stock awards vest on the same basis as Mr. McDonough’s performance-based restricted stock awards will vest. Mr. Gebhart received awards of performance-based restricted stock as follows: 986 shares on March 1, 2013 and 500 shares on February 1, 2014.
Mr. Pokorny’s performance-based restricted stock awards vest based upon the following: Mr. Pokorny’s performance-based restricted stock awards vest on the same basis as Mr. McDonough’s performance-based restricted stock awards will vest. Mr. Pokorny received awards of performance-based restricted stock as follows: 986 shares on March 1, 2013 and 450 shares on February 1, 2014.
96
Table of Contents
Director compensation
The following table sets forth a summary of the compensation we paid to our nonemployee directors during the year ended March 31, 2014.
Director compensation
| Name | Fees earned or paid in cash |
Stock award |
Option awards |
Non-equity incentive plan compensation |
Nonqualified deferred compensation earnings |
All other compensation |
Total | |||||||||||||||||||||
| W. Bradford Armstrong |
$ | — | $ | — | $ | — | $ | — | $ | — | $ | — | $ | — | ||||||||||||||
| John Cochran |
— | — | — | — | — | — | — | |||||||||||||||||||||
| John Fruehwirth |
50,000 | — | — | — | — | — | 50,000 | |||||||||||||||||||||
| Steven Groth |
— | — | — | — | — | — | — | |||||||||||||||||||||
|
|
||||||||||||||||||||||||||||
Narrative to director compensation table
For the year ended March 31, 2013, Mr. McDonough served as a member of our board of directors, but did not receive any additional compensation for service as a director of the company. For the year ending March 31, 2014, our director John Fruehwirth received a director’s fee of $50,000, our only director to receive a fee. However, under our professional services agreement with Lovell Minnick Partners, we pay an annual management fee to Lovell Minnick Partners of $250,000, which we paid for our fiscal year ending March 31, 2014.
Following the consummation of this offering, officers or employees or paid consultants or advisors of the company or its affiliates who also serve as directors will not receive additional compensation for their service as directors. Following the consummation of this offering, our independent directors who are not officers, employees or paid consultants or advisors of the company or its affiliates will receive compensation for their services as directors. Although the terms of our expected director compensation program have not yet been finally determined, we expect such compensation may consist of the following:
| • | an annual cash retainer of $50,000, payable annually; and |
| • | an additional annual cash retainer of $10,000 for service as the chair of a board committee, payable annually. |
Directors will also receive reimbursement for out-of-pocket expenses associated with attending such board or committee meetings and director and officer liability insurance coverage. Each director will be fully indemnified by us for actions associated with being a director to the fullest extent permitted under Delaware law.
97
Table of Contents
Certain relationships and related party transactions
Reorganization and arrangements with our investors
Reorganization and contribution agreement
The company was formed by the board of directors of CCG for purposes of creating a new holding company structure in which CCG would be a direct, wholly-owned subsidiary of the company (the “Reorganization”). In order to implement the Reorganization, we entered into a Contribution Agreement, dated December 12, 2014 (the “Contribution Agreement”) with each of CCG’s stockholders pursuant to which each stockholder contributed all of its shares of CCG’s capital stock to the company in exchange for an equal number of the corresponding class or series of our capital stock.
Our capital structure, governance arrangements, stockholder arrangements and incentive compensation arrangements are substantially similar to those that were in effect with respect to CCG prior to the Reorganization. For example, our Amended and Restated Certificate of Incorporation authorizes the company to issue common stock, par value $0.00001 per share, Series 1 Preferred Stock, par value $0.00001 per share, and Series 2 Preferred Stock, par value $0.00001 per share. The terms of each class and series of our capital stock are identical to those of the corresponding class or series of CCG’s capital stock. Our bylaws, which were adopted prior to the Reorganization, replicate CCG’s bylaws.
In connection with the Reorganization, we also assumed from CCG, all of CCG’s rights and obligations under (i) CCG’s 2012 Equity Incentive Plan (the “Incentive Plan”) and (ii) all Restricted Stock Award Agreements granted by CCG in respect of restricted stock granted pursuant to the Incentive Plan. As a result, any Restricted Stock Award Agreements now apply to the our common stock in the same manner and subject to the same terms that such agreements applied to CCG’s common stock prior to the Reorganization.
Stockholders agreement
In connection with the Reorganization, we entered into a Stockholders Agreement, dated December 12, 2014 (the “Stockholders Agreement”) with certain holders of our common and preferred stock, including Lovell Minnick and A/B Partners X, LP (the “Archbrook Stockholders”), some of whom, individually or together with their respective affiliates, own 5% or more of our capital stock.
The Stockholders Agreement gives certain stockholders or groups of stockholders the right to appoint one or more directors each to our board of directors. It also provides that our Chief Executive Officer shall serve as a director. The Stockholders Agreement grants pre-approval rights to the directors appointed by Lovell Minnick for the company to take certain actions, including, among other things, the issuance of equity to company employees, officers, directors and consultants, the incurrence of debt in excess of $250,000, entering into a related party transaction, or the filing or settlement of any material litigation, arbitration or dispute. In addition, the Stockholders Agreement also sets forth restrictions on transfers of our capital stock and on a sale of the company.
Upon the completion of an “Initial Public Offering,” with such term is defined in the Stockholders Agreement to mean the first underwritten registered public offering of the company’s common stock, the Stockholders Agreement will terminate in accordance with its terms. We believe that this offering will satisfy the requirements of an Initial Public Offering as defined in the Stockholders Agreement.
Investor rights agreement
On December 12, 2014, we entered into an Investor Rights Agreement (the “Investor Rights Agreement”) with certain holders of our capital stock, including Lovell Minnick and the Archbrook Stockholders, some of whom,
98
Table of Contents
individually or together with their respective affiliates, own 5% or more of our capital stock. The Investor Rights Agreement sets forth certain rights and obligations of the stockholders with respect to the registration of our capital stock under the Securities Act, including the right to demand registration of the company’s capital stock and to participate in the company’s registration of its capital stock.
Upon the registration of our capital stock in connection with a public offering, the Investor Rights Agreement imposes upon our stockholders certain resale restrictions with respect to our capital stock, including pursuant to customary lock-up agreements, for a period from 7 days prior to such initial public offering until 180 days following the effective date of such public offering. The Investor Rights Agreement also specifies certain procedures with which we must comply in connection with the registration and sale of our capital stock.
Investment agreement with Ares Capital Corporation and affiliates
On May 10, 2012, CCG entered into an Investment Agreement (the “Investment Agreement”) with Ares Capital Corporation and A/B Partners V (the “Noteholders”) pursuant to which CCG issued to the Noteholders 12.75% senior subordinated notes due May 9, 2018, in the principal amount of $33,000,000. Upon an initial underwritten public offering of CCG’s common stock pursuant to a registration statement filed under the Securities Act, the Noteholders may elect for CCG to redeem in full all of the outstanding notes held by such Noteholders. In addition, CCG may repay, at any time, the outstanding principal amount of the notes issued to the Noteholders pursuant to the Investment Agreement, including any interests, fees (including a prepayment fee of 1% if the notes are retired on or before May 10, 2015) or other charges owned to the Noteholders, and we intend to use the proceeds from this offering to cause CCG to repay in full any such amounts owed to such Noteholders under the Investment Agreement, whereupon the Investment Agreement will terminate in accordance with its terms.
Consulting arrangements
Messrs. Armstrong and Cochran, two of our directors, are employed by Lovell Minnick Partners LLC, a company that acts as business advisor and provides us with financial and management consulting services. We entered into a professional services agreement with Lovell Minnick Partners LLC on December 12, 2014 (the “Services Agreement”), pursuant to which we have agreed to pay Lovell Minnick Partners LLC a recurring annual fee of $250,000. The Services Agreement will automatically terminate in accordance with its terms upon the completion of our initial public offering, provided that we will be obligated to pay any fees, costs or expenses due and not paid to Lovell Minnick Partners LLC as of the effective date of the termination. This fee will be pro rated as of the date of the termination of the Services Agreement.
Indemnification agreements
Our amended and restated certificate of incorporation will limit the liability of our directors to the fullest extent permitted by the Delaware General Corporation Law, and our amended and restated bylaws will provide that we will indemnify them to the fullest extent permitted by such law. Our employment agreements with our current executive officers provide, and similar agreements entered into with any new executive officers will provide, for indemnification of such executive officer by the Company.
We have increased our directors’ and officers’ liability insurance coverage effective upon completion of this offering.
99
Table of Contents
Review, approval or ratification of transactions with related persons
Our board of directors currently is primarily responsible for developing and implementing processes and controls to obtain information from our directors, executive officers and significant stockholders regarding related-person transactions and then determining, based on the facts and circumstances, whether we or a related person has a direct or indirect material interest in these transactions. Following this offering, our audit committee will be responsible for the review, approval and ratification of “related-person transactions” between us and any related person. Under SEC rules, a related person is a director, executive officer, nominee for director or beneficial holder of more than of 5% of any class of our voting securities since the beginning of the last fiscal year or an immediate family member of any of the foregoing. In the course of its review and approval or ratification of a related-person transaction, the audit committee will consider:
| • | the nature of the related person’s interest in the transaction; |
| • | the material terms of the transaction, including the amount involved and type of transaction; |
| • | the importance of the transaction to the related person and to our company; |
| • | whether the transaction would impair the judgment of a director or executive officer to act in our best interest and the best interest of our stockholders; and |
| • | any other matters the audit committee deems appropriate. |
Any member of the audit committee who is a related person with respect to a transaction under review will not be able to participate in the deliberations or vote on the approval or ratification of the transaction. However, such a director may be counted in determining the presence of a quorum at a meeting of the committee that considers the transaction.
100
Table of Contents
Principal and selling stockholders
The following table sets forth certain information with respect to the beneficial ownership of our common stock at , 2015 for:
| • | each person whom we know beneficially owns more than five percent of our common stock; |
| • | each of our named executive officers; |
| • | each of our directors; |
| • | all of our directors and executive officers as a group; and |
| • | each selling stockholder. |
The number of shares beneficially owned by each stockholder is determined under rules issued by the SEC. Unless otherwise indicated below, the address for each listed director, officer and stockholder is c/o Commercial Credit, Inc., 227 West Trade Street, Suite 1450, Charlotte, NC, 28202.
Beneficial ownership and the percentage of beneficial ownership by each person before the offering is based on shares of common stock outstanding as of , 2015 after giving effect to the conversion of all outstanding shares of all series of our preferred stock into an aggregate of shares of common stock immediately prior to the completion of this offering, and the percentage beneficially owned after the offering is based on shares of common stock expected to be outstanding following this offering after giving effect to the issuance of of the shares of common stock offered hereby. See “Description of capital stock.”
No selling stockholders are broker-dealers. Two selling stockholders participating in the offering, Lovell Minnick Equity Partners III LP and Lovell Minnick Equity Partners III-A LP (collectively, the “LM Selling Stockholders”), have advised the Company that they are affiliates of a broker-dealer, but that they are not required to be identified as underwriters because they acquired the shares of Commercial Credit Group Inc. that were exchanged for the shares of the Company in the ordinary course of their business and without any agreements or understandings, directly or indirectly, with any person to distribute the securities and in fact held them for several years. The remaining selling stockholder has confirmed to the Company that it is not affiliated with any broker-dealer.
| Shares beneficially owned before the offering |
Shares beneficially owned after the offering | |||||||||||||||||||
| Name of beneficial owner | Number | Percentage | Number of shares offered |
Number | Percentage | Number of underwriters option |
Number if option exercised in full |
Percentage if option exercised in full | ||||||||||||
| 5% or more stockholders: |
||||||||||||||||||||
| Lovell Minnick Equity Partners III LP(1) |
352,720 | 51.7% | ||||||||||||||||||
| Lovell Minnick Equity Partners III-A LP(2) |
157,280 | 23.1% | ||||||||||||||||||
| A/B Partners X LLC(3) |
50,000 | 7.3% | ||||||||||||||||||
| Named executive officers and directors: |
||||||||||||||||||||
| Daniel McDonough(4) |
43,080 | 6.3% | ||||||||||||||||||
| Donald Pokorny |
15,562 | 2.3% | ||||||||||||||||||
| E. Roger Gebhart |
13,795 | 2.0% | ||||||||||||||||||
| W. Bradford Armstrong(5) |
— | — | ||||||||||||||||||
| John Cochran II(6) |
— | — | ||||||||||||||||||
| John Fruehwirth |
1,500 | * | ||||||||||||||||||
| Steven Groth |
— | — | ||||||||||||||||||
| All executive officers and directors as a group (13 persons)(7) |
105,237 | 15.4% | ||||||||||||||||||
|
| ||||||||||||||||||||
| * | Indicates less than one percent of common stock. |
101
Table of Contents
| (1) | Lovell Minnick Partners LLC is the managing member of Fund III UGP LLC, which is, in turn, the general partner of Lovell Minnick Equity Advisors III LP, which is, in turn, the general partner of each of Lovell Minnick Equity Partners III LP and Lovell Minnick Equity Partners III-A LP. As officers of Lovell Minnick Partners LLC, Messrs. Cochran and Armstrong may be deemed to share beneficial ownership of the shares of our common stock held by the Lovell Minnick funds. Messrs. Cochran and Armstrong disclaim beneficial ownership of such shares. Lovell Minnick Partners LLC has voting and dispositive power over these shares. The business address for each of Lovell Minnick Equity Partners III LP and Lovell Minnick Equity Partners III-A LP is 150 N. Radnor Chester Road, Suite A200, Radnor, Pennsylvania 19087. Lovell Minnick Equity Partners III LP is a selling stockholder in this offering. |
| (2) | Lovell Minnick Partners LLC is the managing member of Fund III UGP LLC, which is, in turn, the general partner of Lovell Minnick Equity Advisors III LP, which is, in turn, the general partner of each of Lovell Minnick Equity Partners III LP and Lovell Minnick Equity Partners III-A LP. As officers of Lovell Minnick Partners LLC, Messrs. Cochran and Armstrong may be deemed to share beneficial ownership of the shares of our common stock held by the Lovell Minnick funds. Messrs. Cochran and Armstrong disclaim beneficial ownership of such shares. Lovell Minnick Partners LLC has voting and dispositive power over these shares. The business address for each of Lovell Minnick Equity Partners III LP and Lovell Minnick Equity Partners III-A LP is 150 N. Radnor Chester Road, Suite A200, Radnor, Pennsylvania 19087. Lovell Minnick Equity Partners III-A LP is a selling stockholder in this offering. |
| (3) | A/B Partners X, LLC is a private investment firm and a Delaware LLC whose Managing Member is Archbrook Capital Management LLC. The business addresses for each of A/B Partners X, LLC and Archbrook Capital Management are 500 Fifth Avenue, Suite 2440, New York, NY 10110 and 100 Front Street, Suite 570, Conshohocken, PA 19428. Archbrook Capital Management LLC as Managing Member of A/B Partners X, LLC has voting and dispositive power over these shares. David Apple and John McGlinn, as Managers of Archbrook Capital Management LLC, share voting and dispositive power over these shares. A/B Partners X LLC is a selling stockholder in this offering. |
| (4) | Includes 15,000 shares owned by McDonough Holdings, LLC. |
| (5) | As an officer of Lovell Minnick Partners LLC, Mr. Armstrong may be deemed to share beneficial ownership of the shares held respectively by Lovell Minnick Equity Partners III LP and Lovell Minnick Equity Partners III-A LP. Mr. Armstrong disclaims beneficial ownership of such shares and any other shares held by affiliates of Lovell Minnick Partners LLC. |
| (6) | As an officer of Lovell Minnick Partners LLC, Mr. Cochran may be deemed to share beneficial ownership of the shares held respectively by Lovell Minnick Equity Partners III LP and Lovell Minnick Equity Partners III-A LP. Mr. Cochran disclaims beneficial ownership of such shares and any other shares held by affiliates of Lovell Minnick Partners LLC. |
| (7) | Includes shares beneficially owned by our other executive officers, as follows: Paul Bottiglio 2,763 shares; Angelo Garubo: 3,400 shares; Mark Lempko: 3,380 shares; Kevin McGinn: 15,138 shares; Robert Qulia: 1,511; and Rebecca Sabo: 5,108 shares. |
102
Table of Contents
The following is a summary of our capital stock and provisions of our amended and restated certificate of incorporation and our amended and restated bylaws, as each will be in effect as of the closing of this offering, and certain provisions of Delaware law. This summary does not purport to be complete and is qualified in its entirety by the provisions of our certificate of incorporation and our amended and restated bylaws, copies of which have been or will be filed with the SEC as exhibits to the registration statement of which this prospectus is a part. References in this section to “the company,” “we” “us” and “our” refer to Commercial Credit, Inc. and not to any of its subsidiaries.
General
Upon the closing of this offering, our amended and restated certificate of incorporation will be amended and restated to provide for authorized capital stock of shares of common stock, par value $0.00001 per share, and shares of undesignated preferred stock. As of , 2015, we had outstanding shares of common stock held by stockholders of record.
After giving effect to this offering, we will have shares of common stock and no shares of preferred stock outstanding. The following summary describes all material provisions of our capital stock. We urge you to read our amended and restated certificate of incorporation and our amended and restated bylaws, which are included as exhibits to the registration statement of which this prospectus forms a part.
Our amended and restated certificate of incorporation and our amended and restated bylaws will contain provisions that are intended to enhance the likelihood of continuity and stability in the composition of the board of directors and that may have the effect of delaying, deferring or preventing a future takeover or change in control of our company unless that takeover or change in control is approved by our board of directors. These provisions include a classified board of directors, elimination of stockholder action by written consents, elimination of the ability of stockholders to call special meetings, advance notice procedures for stockholder proposals, and supermajority vote requirements for amendments to our amended and restated bylaws.
Common stock
Dividend Rights. Subject to preferences that may apply to shares of preferred stock outstanding at the time, holders of outstanding shares of common stock will be entitled to receive dividends out of assets legally available at the times and in the amounts as the board of directors may from time to time determine.
Voting Rights. Each outstanding share of common stock will be entitled to one vote on all matters submitted to a vote of stockholders. Our amended and restated certificate of incorporation will not provide for cumulative voting in connection with the election of directors, and accordingly, holders of more than 50% of the shares voting will be able to elect all of the directors. The holders of a majority of the shares of common stock issued and outstanding constitute a quorum at all meetings of the stockholders for the transaction of business.
Preemptive Rights. Our common stock will not be entitled to preemptive or other similar subscription rights to purchase any of our securities.
Conversion or Redemption Rights. Our common stock will be neither convertible nor redeemable.
Liquidation Rights. Upon our liquidation, the holders of our common stock will be entitled to receive pro rata our assets that are legally available for distribution, after payment of all debts and other liabilities and subject to the prior rights of any holders of preferred stock then outstanding.
103
Table of Contents
Consent Rights. Our Stockholders Agreement grants pre-approval rights to the directors appointed by Lovell Minnick for the company to take certain actions, including, among other things, the issuance of equity to company employees, officers, directors and consultants, the incurrence of debt in excess of $250,000, entering into a related party transaction, or the filing or settlement of any material litigation, arbitration or dispute.
Preferred stock
Our board of directors may, without further action by our stockholders, from time to time, direct the issuance of shares of preferred stock in series and may, at the time of issuance, determine the designations, powers, preferences, privileges, and relative participating, optional or special rights as well as the qualifications, limitations or restrictions thereof, including dividend rights, conversion rights, voting rights, terms of redemption and liquidation preferences, any or all of which may be greater than the rights of the common stock. Satisfaction of any dividend preferences of outstanding shares of preferred stock would reduce the amount of funds available for the payment of dividends on shares of our common stock. Holders of shares of preferred stock may be entitled to receive a preference payment in the event of our liquidation before any payment is made to the holders of shares of our common stock. Under specified circumstances, the issuance of shares of preferred stock may render more difficult or tend to discourage a merger, tender offer or proxy contest, the assumption of control by a holder of a large block of our securities or the removal of incumbent management. Upon the affirmative vote of a majority of the total number of directors then in office, our board of directors, without stockholder approval, may issue shares of preferred stock with voting and conversion rights that could adversely affect the holders of shares of our common stock and the market value of our common stock. Upon completion of this offering, there will be no shares of preferred stock outstanding, and we have no present intention to issue any shares of preferred stock.
Anti-takeover effects of our amended and restated certificate of incorporation and our amended and restated bylaws
Delaware Anti-Takeover Law
We are subject to Section 203 of the Delaware General Corporation Law. Section 203 generally prohibits a public Delaware corporation from engaging in a “business combination” with an “interested stockholder” for a period of three years after the date of the transaction in which the person became an interested stockholder, unless:
| • | prior to the date of the transaction, the board of directors of the corporation approved either the business combination or the transaction which resulted in the stockholder becoming an interested stockholder; |
| • | upon consummation of the transactions which resulted in the stockholder becoming an interested stockholder, the interested stockholder owned at least 85% of the voting stock of the corporation outstanding at the time the transaction commenced, excluding for purposes of determining the number of shares outstanding (a) shares owned by persons who are directors and also officers and (b) shares owned by employee stock plans in which employee participants do not have the right to determine confidentially whether shares held subject to the plan will be tendered in a tender or exchange offer; or |
| • | on or subsequent to the date of the transaction, the business combination is approved by the board of directors of the corporation and authorized at an annual or special meeting of stockholders, and not by written consent, by the affirmative vote of at least 66-2/3% of the outstanding voting stock which is not owned by the interested stockholder. |
Section 203 defines a business combination to include:
| • | any merger or consolidation of the corporation or any majority-owned subsidiary of the corporation with the interested stockholder; |
104
Table of Contents
| • | any sale, transfer, pledge or other disposition of 10% or more of the assets of the corporation involving the interested stockholder; |
| • | subject to exceptions, any transaction that results in the issuance or transfer by the corporation of any stock of the corporation to the interested stockholder; |
| • | any transaction involving the corporation that has the effect of increasing the proportionate share of the stock of any class or series of the corporation beneficially owned by the interested stockholder; and |
| • | the receipt by the interested stockholder of the benefit of any loans, advances, guarantees, pledges or other financial benefits provided by or through the corporation. |
In general, Section 203 defines an interested stockholder as any entity or person beneficially owning 15% or more of the outstanding voting stock of the corporation at any time within three years immediately prior to the date of determination and any entity or person affiliated with or controlling or controlled by the entity or person.
Certificate of Incorporation and Bylaw Provisions
Our amended and restated certificate of incorporation and our amended and restated bylaws will contain certain provisions that are intended to enhance the likelihood of continuity and stability in the composition of our board of directors and that may have the effect of delaying, deferring or preventing a future takeover or change in control of the company unless that takeover or change in control is approved by our board of directors.
These provisions include:
Classified Board. Our amended and restated certificate of incorporation will provide that our board of directors will be divided into three classes of directors, with the directorships in the classes as nearly equal in number as possible. As a result, approximately one-third of our board of directors will be elected each year. The classified nature of our board of directors could have the effect of delaying or discouraging an acquisition of us or a change in our management.
In addition, because our board initially will be classified, under Delaware General Corporation Law, directors may only be removed for cause. Our amended and restated certificate of incorporation will also provide that, subject to any rights of holders of preferred stock to elect additional directors under specified circumstances, the number of directors will be fixed exclusively pursuant to a resolution adopted by our board of directors but will consist of not more than twelve directors. Upon completion of this offering, our board of directors will have five members. Our amended and restated certificate of incorporation and amended and restated bylaws will provide that the authorized number of directors may be changed only by resolution of the board of directors and that all vacancies, including newly created directorships, may, except as otherwise required by law, be filled by the affirmative vote of a majority of directors then in office, even if less than a quorum.
Action by Written Consent; Special Meetings of Stockholders. Our amended and restated certificate of incorporation will provide that stockholder action can be taken only at an annual or special meeting of stockholders and cannot be taken by written consent in lieu of a meeting. Our amended and restated certificate of incorporation and amended and restated bylaws will also provide that special meetings of our stockholders may be called only by the chairman of the board, our Chief Executive Officer or the board of directors pursuant to a resolution adopted by a majority of the total number of directors. Stockholders will not be permitted to call a special meeting or to require the board of directors to call a special meeting.
Super Majority Approval Requirements. The Delaware General Corporation Law generally provides that the affirmative vote of a majority of the outstanding stock entitled to vote on any matter is required to amend a corporation’s bylaws, unless either a corporation’s certificate of incorporation or bylaws require a greater
105
Table of Contents
percentage. Our amended and restated certificate of incorporation will provide that the affirmative vote of holders of at least 66-2/3% of the total votes entitled to vote in the election of directors will be required to amend, alter, change or repeal our amended and restated bylaws. This requirement of a supermajority vote to approve amendments to our amended and restated bylaws could enable a minority of our stockholders to exercise veto power over any such amendments. Our board of directors retains the right to amend our amended and restated bylaws.
Advance Notice Procedures. Our bylaws will establish an advance notice procedure for stockholder proposals to be brought before an annual meeting of our stockholders, including proposed nominations of persons for election to the board of directors. Stockholders at an annual meeting will only be able to consider proposals or nominations specified in the notice of meeting or brought before the meeting by or at the direction of the board of directors or by a stockholder who was a stockholder of record on the record date for the meeting, who is entitled to vote at the meeting and who has given our Secretary timely written notice, in accordance with our amended and restated bylaws, of the stockholder’s intention to bring that business before the meeting. Although the amended and restated bylaws will not give the board of directors the power to approve or disapprove stockholder nominations of candidates or proposals regarding other business to be conducted at a special or annual meeting, the amended and restated bylaws may have the effect of precluding the conduct of certain business at a meeting if the proper procedures are not followed or may discourage or deter a potential acquiror from conducting a solicitation of proxies to elect its own slate of directors or otherwise attempting to obtain control of the company.
Authorized but Unissued Shares. Our authorized but unissued shares of common stock and preferred stock will be available for future issuance without stockholder approval, subject to relevant NYSE listing rules. These additional shares may be utilized for a variety of corporate purposes, including future public offerings to raise additional capital, corporate acquisitions and employee benefit plans. The existence of authorized but unissued shares of common stock and preferred stock could render more difficult or discourage an attempt to obtain control of a majority of our common stock by means of a proxy contest, tender offer, merger or otherwise.
Exclusive Jurisdiction of Certain Actions. Our amended and restated certificate of incorporation will require, to the fullest extent permitted by law, that derivative actions brought in the name of the company, actions against directors, officers and employees for breach of fiduciary duty and other similar actions may be brought only in the Court of Chancery in the State of Delaware or federal court in Delaware if the Court of Chancery does not have jurisdiction. We believe this provision benefits the company by providing increased consistency in the application of Delaware law in the types of lawsuits to which it applies.
Limitations on liability and indemnification of officers and directors
Our amended and restated certificate of incorporation will limit the liability of our directors to the fullest extent permitted by the Delaware General Corporation Law, and our amended and restated bylaws will provide that we will indemnify them to the fullest extent permitted by such law. Our employment agreements with our current executive officers provide, and similar agreements entered into with any new executive officers will provide, for indemnification of such executive officer by the Company. We have increased our directors’ and officers’ liability insurance coverage effective upon the completion of this offering.
Listing
We applied to have our shares of common stock listed on the NYSE under the symbol “CCR.”
Transfer agent and registrar
The transfer agent and registrar for our common stock will be Wells Fargo Bank, National Association. Its telephone number is 1-800-401-1957 (toll free).
106
Table of Contents
Shares eligible for future sale
Prior to this offering, there has been no market for shares of our common stock. We cannot predict the effect, if any, that future sales of shares of our common stock, or the availability for future sale of shares of our common stock, will have on the market price of shares of our common stock prevailing from time to time. The sale of substantial amounts of shares of our common stock in the market, or the perception that such sales could occur, could harm the prevailing market price of shares of our common stock.
Sale of restricted shares
Upon completion of this offering, we will have shares of common stock outstanding. Of these shares, the shares sold in this offering will be freely tradable without restriction under the Securities Act, except for any shares purchased by our “affiliates” as that term is defined in Rule 144 promulgated under the Securities Act. In general, affiliates include our executive officers, directors, and 10% stockholders. Shares purchased by affiliates will remain subject to the resale limitations of Rule 144.
Upon completion of this offering, shares of our common stock will be “restricted securities,” as that term is defined in Rule 144 promulgated under the Securities Act. These restricted securities are eligible for public sale only if they are registered under the Securities Act or if they qualify for an exemption from registration under Rules 144 or 701 promulgated under the Securities Act, which are summarized below. We have granted Lovell Minnick demand and “piggy-back” registration rights with respect to the shares of our common stock owned by Lovell Minnick as of the date of our initial public offering, and we have also granted the other stockholders party to the investor rights agreement “piggy-back” registration rights with respect to the shares of our common stock owned by them. See “Certain relationships and related party transactions—Reorganization and arrangements with our investors—Investor rights agreement.”
As a result of the lock-up agreements described below and the provisions of Rules 144 and Rule 701 promulgated under the Securities Act, the shares of our common stock (excluding the shares sold in this offering) will be available for sale in the public market as follows:
| • | no shares will be eligible for sale on the date of this prospectus; |
| • | shares will be eligible for sale upon the expiration of the lock-up agreements, as more particularly described below, beginning 180 days after the date of this prospectus, subject to certain exceptions and automatic extensions in certain circumstances; and |
| • | shares will be eligible for sale, upon the exercise of vested options and upon the expiration of the lock-up agreements, as more particularly described below, beginning 180 days after the date of this prospectus, subject to certain exceptions and automatic extensions in certain circumstances. |
Rule 144
Generally, Rule 144 provides that an affiliate who has beneficially owned “restricted” shares of our common stock for at least six months will be entitled to sell on the open market in brokers’ transactions, within any three-month period, a number of shares that does not exceed the greater of:
| • | 1% of the number of shares of our common stock then outstanding, which will equal approximately shares immediately after this offering; or |
| • | the average weekly trading volume of the common stock on the NYSE during the four calendar weeks preceding the filing of a notice on Form 144 with respect to such sale. |
107
Table of Contents
In addition, sales under Rule 144 are subject to requirements with respect to manner of sale, notice, and the availability of current public information about us.
If any person who is deemed to be our affiliate purchases shares of our common stock, sales under Rule 144 of the shares held by that person will be subject to the volume limitations and other restrictions described in the preceding two paragraphs.
The volume limitation, manner of sale and notice provisions described above will not apply to sales by non-affiliates. For purposes of Rule 144, a non-affiliate is any person or entity who is not our affiliate at the time of sale and has not been our affiliate during the preceding three months. Once we have been a reporting company for 90 days, persons who have beneficially owned restricted shares of our common stock for six months may rely on Rule 144 provided that certain public information regarding us is available. The six-month holding period increases to one year if we have not been a reporting company for at least 90 days. However, a non-affiliate who has beneficially owned the restricted shares proposed to be sold for at least one year will not be subject to any restrictions under Rule 144 regardless of how long we have been a reporting company.
Rule 701
Under Rule 701, each of our employees, officers, directors, consultants or advisors who purchased shares pursuant to a written compensatory plan or contract is eligible to resell these shares 90 days after the effective date of this offering in reliance upon Rule 144, but without compliance with specific restrictions. Rule 701 provides that affiliates may sell their Rule 701 shares under Rule 144 without complying with the holding period requirement and that non-affiliates may sell their shares in reliance on Rule 144 without complying with the holding period, public information, volume limitation, or notice provisions of Rule 144.
Lock-up agreements
We, our directors and officers and substantially all of our stockholders have agreed, subject to certain exceptions, not to offer, sell or transfer any common stock or securities convertible into or exchangeable or exercisable for common stock for 180 days after the date of this prospectus without first obtaining the written consent of each of the representatives of the underwriters, subject to certain exceptions and automatic extensions in certain circumstances. See “Underwriting” for a description of these lock-up agreements.
Registration statements
We intend to file one or more registration statements under the Securities Act as soon as practicable after the completion of this offering for shares to be issued under our employee benefit plans. As a result, any such options or shares will be freely tradable in the public market. However, such shares held by affiliates will still be subject to the volume limitation, manner of sale, notice, and public information requirements of Rule 144 unless otherwise resalable under Rule 701.
108
Table of Contents
Material U.S. federal tax considerations
for non-U.S. holders of our common stock
The following is a summary of the material U.S. federal income and certain estate tax considerations relating to the purchase, ownership and disposition of our common stock by Non-U.S. Holders (defined below). This summary does not purport to be a complete analysis of all the potential tax considerations relevant to Non-U.S. Holders. This summary is based upon the Internal Revenue Code of 1986, as amended (the “Internal Revenue Code”), the Treasury regulations promulgated or proposed thereunder and administrative and judicial interpretations thereof, all as of the date hereof and all of which are subject to change or differing interpretations at any time, possibly with retroactive effect.
This summary assumes that shares of our common stock are held as “capital assets” within the meaning of Section 1221 of the Internal Revenue Code. This summary does not purport to deal with all aspects of U.S. federal income taxation that might be relevant to particular Non-U.S. Holders in light of their particular investment circumstances or status, nor does it address specific tax considerations that may be relevant to particular persons (including, for example, financial institutions, broker-dealers, insurance companies, partnerships or other pass-through entities, certain U.S. expatriates, tax-exempt organizations, pension plans, “controlled foreign corporations,” “passive foreign investment companies,” corporations that accumulate earnings to avoid U.S. federal income tax, persons in special situations, such as those who have elected to mark securities to market or those who hold common stock as part of a straddle, hedge, conversion transaction, synthetic security or other integrated investment, or holders subject to the alternative minimum tax). In addition, except as explicitly addressed herein with respect to estate tax, this summary does not address estate and gift tax considerations or considerations under the tax laws of any state, local or non-U.S. jurisdiction.
For purposes of this summary, a “Non-U.S. Holder” means a beneficial owner of our common stock that for U.S. federal income tax purposes is not treated as a partnership and is not:
| • | an individual who is a citizen or resident of the United States; |
| • | a corporation or any other organization treated as a corporation for U.S. federal income tax purposes, created or organized in or under the laws of the United States, any state thereof or the District of Columbia; |
| • | an estate, the income of which is included in gross income for U.S. federal income tax purposes regardless of its source; or |
| • | a trust, if (i) a U.S. court is able to exercise primary supervision over the trust’s administration and one or more U.S. persons have the authority to control all of the trust’s substantial decisions or (ii) the trust has a valid election in effect under applicable U.S. Treasury regulations to be treated as a U.S. person. |
If an entity or arrangement that is classified as a partnership for U.S. federal income tax purposes holds our common stock, the tax treatment of persons treated as its partners for U.S. federal income tax purposes will generally depend upon the status of the partner and the activities of the partnership. Partnerships and other entities or arrangements that are classified as partnerships for U.S. federal income tax purposes, and persons holding our common stock through such an entity or arrangement, are urged to consult their own tax advisors.
There can be no assurance that the Internal Revenue Service (“IRS”) will not challenge one or more of the tax consequences described herein, and we have not obtained, nor do we intend to obtain, a ruling from the IRS with respect to the U.S. federal income or estate tax consequences to a Non-U.S. Holder of the purchase, ownership or disposition of our common stock.
109
Table of Contents
THIS SUMMARY IS NOT INTENDED TO BE TAX ADVICE. EACH NON-U.S. HOLDER IS URGED TO CONSULT ITS OWN TAX ADVISOR ABOUT THE U.S. FEDERAL INCOME AND ESTATE TAXATION, STATE, LOCAL AND NON-U.S. TAXATION AND OTHER TAX CONSEQUENCES TO THEM OF THE PURCHASE, OWNERSHIP AND DISPOSITION OF OUR COMMON STOCK.
Distributions on our common stock
As discussed under “Dividend policy” above, we do not currently expect to pay regular dividends on our common stock. If we do make a distribution of cash or property with respect to our common stock, any such distributions generally will constitute dividends for U.S. federal income tax purposes to the extent of our current or accumulated earnings and profits, as determined under U.S. federal income tax principles. If a distribution exceeds our current and accumulated earnings and profits, the excess will constitute a return of capital and will first reduce the holder’s basis in our common stock, but not below zero. Any remaining excess will be treated as capital gain, subject to the tax treatment described below in “—Gain on sale, exchange or other taxable disposition of our common stock.” Any such distribution would also be subject to the discussion below in “—Additional withholding and information reporting requirements.”
Dividends paid to a Non-U.S. Holder generally will be subject to withholding of U.S. federal income tax at a 30% rate unless such Non-U.S. Holder provides us or our agent, as the case may be, with the appropriate IRS Form W-8, such as:
| • | IRS Form W-8BEN or W-8BEN-E (or, in each case, a successor form) certifying, under penalties of perjury, a reduction in the rate of withholding of tax under an applicable income tax treaty, or |
| • | IRS Form W-8ECI (or successor form) certifying that a dividend paid on common stock is not subject to withholding of tax because it is effectively connected with a trade or business in the United States of the Non-U.S. Holder (in which case such dividend generally will be subject to regular graduated U.S. federal income tax rates as described below). |
The certification requirement described above also may require a Non-U.S. Holder that provides an IRS form or that claims treaty benefits to provide its U.S. taxpayer identification number. Special certification and other requirements apply in the case of certain Non-U.S. Holders that are intermediaries or pass-through entities for U.S. federal income tax purposes.
Each Non-U.S. Holder is urged to consult its own tax advisor about the specific methods for satisfying these requirements. A claim for exemption will not be valid if the person receiving the applicable form has actual knowledge or reason to know that the statements on the form are false.
If dividends are effectively connected with a trade or business in the United States of a Non-U.S. Holder (and, if required by an applicable income tax treaty, attributable to a permanent establishment maintained by such Non-U.S. Holder in the United States), the Non-U.S. Holder, although exempt from the withholding of tax described above (provided that the certifications described above are satisfied), generally will be subject to U.S. federal income tax on such dividends on a net income basis in the same manner as if it were a resident of the United States. In addition, if a Non-U.S. Holder is treated as a corporation for U.S. federal income tax purposes, the Non-U.S. Holder may be subject to an additional “branch profits tax” equal to 30% (unless reduced by an applicable income treaty) of its earnings and profits in respect of such effectively connected dividend income.
If a Non-U.S. Holder is eligible for a reduced rate of U.S. federal withholding tax pursuant to an income tax treaty, the holder may obtain a refund or credit of any excess amount withheld by timely filing an appropriate claim for refund with the IRS.
110
Table of Contents
Gain on sale, exchange or other taxable disposition of our common stock
Subject to the discussion below in “—Additional withholding and information reporting requirements,” in general, a Non-U.S. Holder will not be subject to U.S. federal income tax or withholding of tax on gain realized upon such holder’s sale, exchange or other taxable disposition of shares of our common stock unless (i) such Non-U.S. Holder is an individual who is present in the United States for 183 days or more in the taxable year of disposition, and certain other conditions are met, (ii) such gain is effectively connected with the conduct by such Non-U.S. Holder of a trade or business in the United States (and, if required by an applicable income tax treaty, is attributable to a permanent establishment maintained by such Non-U.S. Holder in the United States), or (iii) we are or have been a “United States real property holding corporation,” as defined in the Internal Revenue Code (a “USRPHC”), at any time within the shorter of the five-year period preceding the disposition and the Non-U.S. Holder’s holding period in the shares of our common stock, and certain other requirements are met.
If the first exception applies, the Non-U.S. Holder generally will be subject to U.S. federal income tax at a rate of 30% (or at a reduced rate under an applicable income tax treaty) on the amount by which such Non-U.S. Holder’s capital gains allocable to U.S. sources (including gain, if any, realized on a disposition of our common stock) exceed capital losses allocable to U.S. sources during the taxable year of the disposition.
If the second exception applies, the Non-U.S. Holder generally will be subject to U.S. federal income tax with respect to such gain on a net income basis in the same manner as if it were a resident of the United States, and a Non-U.S. Holder that is a corporation for U.S. federal income tax purposes may also be subject to a branch profits tax with respect to any earnings and profits attributable to such gain at a rate of 30% (or at a reduced rate under an applicable income tax treaty).
With respect to the third exception, we believe that we are not, and do not anticipate becoming, a USRPHC. However, there can be no assurance in this regard. If we are or become a USRPHC, so long as our common stock is considered “regularly traded on an established securities market” at any time during the calendar year in which the disposition occurs, only a Non-U.S. Holder who holds or held (directly, indirectly or constructively) more than 5% of our common stock at any time during the shorter of the five-year period ending on the date of disposition and the holder’s holding period would be subject to U.S. federal income tax on a sale, exchange or other taxable disposition of our common stock in the same manner as gain that is effectively connected with a trade or business of a Non-U.S. Holder in the United States, except that the branch profits tax generally will not apply. Each Non-U.S. Holder is urged to consult its own tax advisor about the possible consequences to them if we are, or were to become, a USRPHC.
Additional withholding and information reporting requirements
Generally, a 30% U.S. federal withholding tax will be imposed in accordance with Sections 1471 through 1474 of the Internal Revenue Code and the Treasury regulations thereunder (commonly referred to as “FATCA”) on U.S. source dividends and gross proceeds from the sale or other disposition of stock or property that is capable of producing U.S. source dividends paid to (i) a foreign financial institution (as defined in Section 1471(d)(4) of the Internal Revenue Code) unless such foreign financial institution enters into a reporting agreement with the IRS to collect and disclose certain information regarding its U.S. account holders (including certain account holders that are foreign entities that have U.S. owners), complies with any laws and rules implementing FATCA under an applicable bilateral governmental agreement with respect to FATCA between the United States and the foreign financial institution’s jurisdiction of organization and/or is otherwise registered deemed compliant with FATCA and (ii) certain other non-U.S. entities unless the entity provides the payor with information regarding certain direct and indirect U.S. owners of the entity, or certifies that it has no such U.S. owners, and complies with certain other requirements. Under current guidance, the FATCA withholding rules would apply to certain
111
Table of Contents
payments, including dividend payments on our common stock, if any, and to payments of gross proceeds from the sale or other dispositions of our common stock occurring after December 31, 2016. These FATCA withholding rules apply regardless of whether a payment would otherwise be exempt from the withholding of tax described above in respect of distributions on and dispositions of our common stock.
Each Non-U.S. Holder is urged to consult its own tax advisor about the possible impact of these rules on their investment in our common stock, and the entities through which they hold our common stock, including, without limitation, the process and deadlines for meeting the applicable requirements to prevent the imposition of this 30% withholding of tax under FATCA.
Backup withholding and information reporting
We must report annually to the IRS and to each Non-U.S. Holder the gross amount of the distributions on our common stock paid to the holder and the tax withheld, if any, with respect to the distributions. Pursuant to tax treaties or other agreements, the IRS may make its reports available to tax authorities in the Non-U.S. Holder’s country of residence, organization or incorporation.
Non-U.S. Holders may have to comply with specific certification procedures to establish that the holder is not a United States person (as defined in the Internal Revenue Code) in order to avoid backup withholding at the applicable rate, currently 28%, with respect to dividends on our common stock. Dividends paid to Non-U.S. Holders subject to withholding of U.S. federal income tax, as described above in “—Distributions on our common stock,” generally will be exempt from U.S. backup withholding.
Information reporting and backup withholding will generally apply to the proceeds of a disposition of our common stock by a Non-U.S. Holder effected by or through the U.S. office of any broker, U.S. or foreign, unless the holder certifies its status as a Non-U.S. Holder and satisfies certain other requirements, or otherwise establishes an exemption. Dispositions effected through a non-U.S. office of a U.S. broker or a non-U.S. broker with substantial U.S. ownership or operations generally will be treated in a manner similar to dispositions effected through a U.S. office of a broker. Each Non-U.S. Holder is urged to consult its own tax advisor about the application of the information reporting and backup withholding rules to them.
Backup withholding is not an additional tax. Any amounts withheld under the backup withholding rules from a payment to a Non-U.S. Holder can be refunded or credited against the Non-U.S. Holder’s U.S. federal income tax liability, if any, provided that an appropriate claim is timely filed with the IRS.
Federal estate tax
Common stock owned (or treated as owned) by an individual who is not a citizen or a resident of the United States (as defined for U.S. federal estate tax purposes) at the time of death will be included in the individual’s gross estate for U.S. federal estate tax purposes, unless an applicable estate or other tax treaty provides otherwise, and, therefore, may be subject to U.S. federal estate tax.
Medicare contributions tax
A 3.8% tax is imposed on the net investment income (which includes dividends and gains recognized upon of a disposition of stock) of certain individuals, trusts and estates with adjusted gross income in excess of certain thresholds. This tax is imposed on individuals, estates and trusts that are U.S. persons. The tax is expressly not imposed on nonresident aliens; however, estates and trusts that are Non-U.S. Holders are not expressly exempted from the tax. Therefore, each Non-U.S. Holder is urged to consult its own tax advisor about the application of this Medicare contribution tax in their particular situations.
112
Table of Contents
We and the selling stockholders are offering the shares of our common stock described in this prospectus through a number of underwriters. J.P. Morgan Securities LLC and Keefe, Bruyette & Woods, Inc. are acting as joint book-running managers of the offering and as representatives of the underwriters. We and the selling stockholders have entered into an underwriting agreement with the underwriters. Subject to the terms and conditions of the underwriting agreement, we and the selling stockholders have agreed to sell to the underwriters, and each underwriter has severally agreed to purchase, at the public offering price less the underwriting discounts and commissions set forth on the cover page of this prospectus, the number of shares of our common stock listed next to its name in the following table:
| Underwriter | Number of shares | |
| J.P. Morgan Securities LLC |
||
| Keefe, Bruyette & Woods, Inc.(1) |
||
| BMO Capital Markets Corp. |
||
| SunTrust Robinson Humphrey, Inc. |
||
| Wells Fargo Securities, LLC |
||
| BB&T Capital Markets, a division of BB&T Securities, LLC |
||
| Total |
||
|
| ||
| (1) | Stifel, Nicolaus & Company, Incorporated, an affiliate of Keefe, Bruyette & Woods, Inc., may act in the capacity of underwriter in this offering. |
The underwriters are committed to purchase all the shares of our common stock offered by us and the selling stockholders if they purchase any shares. The underwriting agreement also provides that if an underwriter defaults, the purchase commitments of non-defaulting underwriters may also be increased or the offering may be terminated.
The underwriters propose to offer the shares of our common stock directly to the public at the initial public offering price set forth on the cover page of this prospectus and to certain dealers at that price less a concession not in excess of $ per share. Any such dealers may resell shares to certain other brokers or dealers at a discount of up to $ per share from the initial public offering price. After the initial public offering of the shares, the offering price and other selling terms may be changed by the underwriters. Sales of shares made outside of the United States may be made by affiliates of the underwriters. The representatives have advised us that the underwriters do not intend to confirm discretionary sales in excess of 5% of the shares of our common stock offered in this offering.
The underwriters have an option to buy up to additional shares of our common stock from us and the selling stockholders to cover sales of shares by the underwriters which exceed the number of shares specified in the table above. The underwriters have 30 days from the date of this prospectus to exercise this option. If any shares are purchased with this option, the underwriters will purchase shares in approximately the same proportion as shown in the table above. If any additional shares of our common stock are purchased, the underwriters will offer the additional shares on the same terms as those on which the shares are being offered.
113
Table of Contents
The underwriting fee is equal to the public offering price per share less the amount paid by the underwriters to us per share of our common stock. The following table shows the per share and total underwriting discounts and commissions to be paid to the underwriters assuming both no exercise and full exercise of the underwriters’ option to purchase additional shares.
| Without exercise of option to purchase additional shares |
With full exercise of option to purchase additional shares |
|||||||
| Per share |
$ | $ | ||||||
| Total |
$ | $ | ||||||
|
|
||||||||
We estimate that the total expenses of this offering, including registration, filing and listing fees, printing fees and legal and accounting expenses, but excluding the underwriting discounts and commissions, will be approximately $ million and will be payable by us. We have agreed to reimburse the underwriters for certain expenses of up to $ , including expenses and application fees incurred in connection with any filing with, and clearance of the offering by, the Financial Industry Regulatory Authority, Inc.
A prospectus in electronic format may be made available on the web sites maintained by one or more underwriters, or selling group members, if any, participating in the offering. The underwriters may agree to allocate a number of shares to underwriters and selling group members for sale to their online brokerage account holders. Internet distributions will be allocated by the representatives to underwriters and selling group members that may make internet distributions on the same basis as other allocations.
We, all of our directors and executive officers, the selling stockholders and holders of substantially all of our shares of common stock and securities exercisable for or convertible into our shares of common stock outstanding immediately prior to this offering have agreed not to (1) offer, pledge, sell, contract to sell, sell any option or contract to purchase, purchase any option or contract to sell, grant any option, right or warrant to purchase, or otherwise transfer or dispose of, directly or indirectly, or file with the SEC a registration statement under the Securities Act relating to, any of our shares of common stock or securities convertible into or exchangeable or exercisable for any of our shares of common stock (including, without limitation, shares of our common stock or such other securities which may be deemed to be beneficially owned by such directors, executive officers and security holders in accordance with the rules and regulations of the SEC and securities which may be issued upon exercise of a share option or warrant), or publicly disclose the intention to make any offer, sale, pledge, disposition or filing, (2) enter into any swap or other arrangement that transfers, in whole or in part, any of the economic consequences of ownership of any our shares of common stock or any such other securities (whether any such transactions described in clause (1) or (2) above is to be settled by the delivery of shares of our common stock or such other securities, in cash or otherwise) or (3) in the case of our directors, executive officers and holders of shares of our common stock and securities exercisable for or convertible into shares of our common stock outstanding immediately prior to this offering, make any demand for or exercise any right with respect to the registration of any shares of our common stock or any security convertible into or exercisable or exchangeable for shares of our common stock, in each case without the prior written consent of J.P. Morgan Securities LLC and Keefe, Bruyette & Woods, Inc. for a period of 180 days after the date of this prospectus.
We, the selling stockholders, our directors, executive officers and stockholders and the underwriters have agreed in the underwriting agreement or in separate lock-up agreements, and subject to certain conditions, that such restrictions shall not apply to:
| • | shares of our common stock to be sold by the underwriters pursuant to the underwriting agreement; |
| • | transfers of shares of our common stock as bona fide gifts or charitable contributions; |
114
Table of Contents
| • | transfers of shares of our common stock by a corporation, limited liability company, partnership or other business entity to an affiliate or as part of a disposition, transfer, distribution or liquidation without consideration by the stockholder to its equity holders; |
| • | transfers to any member of the immediate family of the stockholder or any trust for the direct or indirect benefit of the stockholder or the immediate family of the stockholder; |
| • | transfers of shares of our common stock to any beneficiary pursuant to a will or other testamentary document or applicable laws of descent upon the death of the stockholder; |
| • | sales of our common stock acquired in open market transactions after completion of our initial public offering; |
| • | any shares of our common stock issued upon the exercise of options granted under company share plans described herein; and |
| • | establishment of a 10b5-1 plan, provided that such plan does not provide for the transfer of common stock during the restricted period referred to above and no public announcement or filing shall be required or voluntarily made. |
provided, in certain cases, the donee, transferee or distributee, as applicable, must execute and deliver to the representatives a lock-up letter, and provided, further, in certain cases, that no filing by any party under the Exchange Act or other public announcement shall be required or shall be made voluntarily in connection with such transfer.
We and the selling stockholders have agreed to indemnify the underwriters against certain liabilities, including liabilities under the Securities Act.
We expect to apply for listing of our shares of common stock on the NYSE under the symbol “CCR.”
In connection with this offering, the underwriters may engage in stabilizing transactions, which involve making bids for, purchasing and selling shares of our common stock in the open market for the purpose of preventing or retarding a decline in the market price of the shares of our common stock while this offering is in progress. These stabilizing transactions may include making short sales of the shares of our common stock, which involves the sale by the underwriters of a greater number of shares of our common stock than they are required to purchase in this offering, and purchasing shares of our common stock on the open market to cover positions created by short sales. Short sales may be “covered” shorts, which are short positions in an amount not greater than the underwriters’ option to purchase additional shares referred to above, or may be “naked” shorts, which are short positions in excess of that amount. The underwriters may close out any covered short position either by exercising their option to purchase additional shares, in whole or in part, or by purchasing shares in the open market. In making this determination, the underwriters will consider, among other things, the price of shares available for purchase in the open market compared to the price at which the underwriters may purchase shares through the option to purchase additional shares. A naked short position is more likely to be created if the underwriters are concerned that there may be downward pressure on the price of the shares of our common stock in the open market that could adversely affect investors who purchase in this offering. To the extent that the underwriters create a naked short position, they will purchase shares in the open market to cover the position.
The underwriters have advised us that, pursuant to Regulation M of the Securities Act, they may also engage in other activities that stabilize, maintain or otherwise affect the price of the shares of our common stock, including the imposition of penalty bids. This means that if the representatives of the underwriters purchase shares of our common stock in the open market in stabilizing transactions or to cover short sales, the
115
Table of Contents
representatives can require the underwriters that sold those shares as part of this offering to repay the underwriting discount received by them.
These activities may have the effect of raising or maintaining the market price of the shares of our common stock or preventing or retarding a decline in the market price of the shares of our common stock, and, as a result, the price of the shares of our common stock may be higher than the price that otherwise might exist in the open market. If the underwriters commence these activities, they may discontinue them at any time. The underwriters may carry out these transactions on the NYSE, as the case may be, in the over-the-counter market or otherwise.
Prior to this offering, there has been no public market for shares of our common stock. The initial public offering price will be determined by negotiations between us, the selling stockholders and the representatives of the underwriters. In determining the initial public offering price, we, the selling stockholders and the representatives of the underwriters expect to consider a number of factors including:
| • | the information set forth in this prospectus and otherwise available to the representatives; |
| • | our prospects and the history and prospects for the industry in which we compete; |
| • | an assessment of our management; |
| • | our prospects for future earnings; |
| • | the general condition of the securities markets at the time of this offering; |
| • | the recent market prices of, and demand for, publicly traded shares of generally comparable companies; and |
| • | other factors deemed relevant by the underwriters and us. |
Neither we, the selling stockholders nor the underwriters can assure investors that an active trading market will develop for shares of our common stock, or that the shares will trade in the public market at or above the initial public offering price.
Selling restrictions
General
Other than in the United States, no action has been taken by us, the selling stockholders or the underwriters that would permit a public offering of the securities offered by this prospectus in any jurisdiction where action for that purpose is required. The shares of our common stock offered by this prospectus may not be offered or sold, directly or indirectly, nor may this prospectus or any other offering material or advertisements in connection with the offer and sale of any such securities be distributed or published in any jurisdiction, except under circumstances that will result in compliance with the applicable rules and regulations of that jurisdiction. Persons into whose possession this prospectus comes are advised to inform themselves about and to observe any restrictions relating to the offering and the distribution of this prospectus. This prospectus does not constitute an offer to sell or a solicitation of an offer to buy any securities offered by this prospectus in any jurisdiction in which such an offer or a solicitation is unlawful.
European economic area
In relation to each member state of the EEA, or a Relevant Member State which has implemented the EU Prospectus Directive, as defined below, from and including the date on which the EU Prospectus Directive was implemented in that Relevant Member State, or the Relevant Implementation Date, an offer of securities described in this prospectus may not be made to the public in that Relevant Member State prior to the publication of a prospectus in relation to the securities which has been approved by the competent authority in that Relevant Member State or, where appropriate, approved in another Relevant Member State and notified to
116
Table of Contents
the competent authority in that Relevant Member State, all in accordance with the EU Prospectus Directive, except that, with effect from and including the Relevant Implementation Date, an offer of securities described in this prospectus may be made to the public in that Relevant Member State at any time:
| • | to any legal entity which is a qualified investor as defined under the EU Prospectus Directive; |
| • | to fewer than 100 or, if the Relevant Member State has implemented the relevant provision of the 2010 PD Amending Directive, 150 natural or legal persons (other than qualified investors as defined in the EU Prospectus Directive); or |
| • | in any other circumstances falling within Article 3(2) of the EU Prospectus Directive, |
provided that no such offer of securities described in this prospectus shall result in a requirement for the publication by us of a prospectus pursuant to Article 3 of the EU Prospectus Directive.
For the purposes of this provision, the expression an “offer of securities to the public” in relation to any securities in any Relevant Member State means the communication in any form and by any means of sufficient information on the terms of the offer and the securities to be offered so as to enable an investor to decide to purchase or subscribe for the securities, as the same may be varied in that member state by any measure implementing the EU Prospectus Directive in that member state. The expression “EU Prospectus Directive” means Directive 2003/71/EC (and any amendments thereto, including the 2010 PD Amending Directive, to the extent implemented in the Relevant Member State) and includes any relevant implementing measure in each Relevant Member State, and the expression “2010 PD Amending Directive” means Directive 2010/73/EU.
United Kingdom
This document is only being distributed to and is only directed at (i) persons who are outside the United Kingdom or (ii) to investment professionals falling within Article 19(5) of the Financial Services and Markets Act 2000 (Financial Promotion) Order 2005, or the Order, or (iii) high net worth entities, and other persons to whom it may lawfully be communicated, falling with Article 49(2)(a) to (e) of the Order (all such persons together being referred to as “relevant persons”). The securities are only available to, and any invitation, offer or agreement to subscribe, purchase or otherwise acquire such securities will be engaged in only with, relevant persons. Any person who is not a relevant person should not act or rely on this document or any of its contents.
Switzerland
The securities may not be publicly offered in Switzerland and will not be listed on the SIX Swiss Exchange, or SIX, or on any other stock exchange or regulated trading facility in Switzerland. This document has been prepared without regard to the disclosure standards for issuance prospectuses under art. 652a or art. 1156 of the Swiss Code of Obligations or the disclosure standards for listing prospectuses under art. 27 ff. of the SIX Listing Rules or the listing rules of any other stock exchange or regulated trading facility in Switzerland. Neither this document, nor any other offering or marketing material relating to the securities or the offering, may be publicly distributed or otherwise made publicly available in Switzerland. Neither this document nor any other offering or marketing material relating to the offering, the Company or the securities has been or will be filed with or approved by any Swiss regulatory authority. In particular, this document will not be filed with, and the offer of securities will not be supervised by, the Swiss Financial Market Supervisory Authority FINMA, or FINMA, and the offer of securities has not been and will not be authorized under the Swiss Federal Act on Collective Investment Schemes, or CISA. The investor protection afforded to acquirers of interests in collective investment schemes under the CISA does not extend to acquirers of securities.
117
Table of Contents
United Arab Emirates
This prospectus relates to an Exempt Offer in accordance with the Offered Securities Rules of the Dubai Financial Services Authority (“DFSA”). This prospectus is intended for distribution only to persons of a type specified in the Offered Securities Rules of the DFSA. It must not be delivered to, or relied on by, any other person. The DFSA has no responsibility for reviewing or verifying any documents in connection with Exempt Offers. The DFSA has not approved this prospectus nor taken steps to verify the information set forth herein and has no responsibility for the prospectus. The securities to which this prospectus relates may be illiquid and/or subject to restrictions on their resale. Prospective purchasers of the securities offered should conduct their own due diligence on the securities. If you do not understand the contents of this prospectus you should consult an authorized financial advisor.
Australia
No placement document, prospectus, product disclosure statement or other disclosure document has been lodged with the Australian Securities and Investments Commission (“ASIC”), in relation to the offering. This prospectus does not constitute a prospectus, product disclosure statement or other disclosure document under the Corporations Act 2001 (the “Corporations Act”), and does not purport to include the information required for a prospectus, product disclosure statement or other disclosure document under the Corporations Act.
Any offer in Australia of the securities may only be made to persons (the “Exempt Investors”) who are “sophisticated investors” (within the meaning of section 708(8) of the Corporations Act), “professional investors” (within the meaning of section 708(11) of the Corporations Act) or otherwise pursuant to one or more exemptions contained in section 708 of the Corporations Act so that it is lawful to offer the securities without disclosure to investors under Chapter 6D of the Corporations Act.
The securities applied for by Exempt Investors in Australia must not be offered for sale in Australia in the period of 12 months after the date of allotment under the offering, except in circumstances where disclosure to investors under Chapter 6D of the Corporations Act would not be required pursuant to an exemption under section 708 of the Corporations Act or otherwise or where the offer is pursuant to a disclosure document which complies with Chapter 6D of the Corporations Act. Any person acquiring securities must observe such Australian on-sale restrictions.
This prospectus contains general information only and does not take account of the investment objectives, financial situation or particular needs of any particular person. It does not contain any securities recommendations or financial product advice. Before making an investment decision, investors need to consider whether the information in this prospectus is appropriate to their needs, objectives and circumstances, and, if necessary, seek expert advice on those matters.
Hong Kong
The securities have not been offered or sold and will not be offered or sold in Hong Kong, by means of any document, other than (a) to “professional investors” as defined in the Securities and Futures Ordinance (Cap. 571) of Hong Kong and any rules made under that Ordinance; or (b) in other circumstances which do not result in the document being a “prospectus” as defined in the Companies Ordinance (Cap. 32) of Hong Kong or which do not constitute an offer to the public within the meaning of that Ordinance. No advertisement, invitation or document relating to the securities has been or may be issued or has been or may be in the possession of any person for the purposes of issue, whether in Hong Kong or elsewhere, which is directed at, or the contents of which are likely to be accessed or read by, the public of Hong Kong (except if permitted to do so under the securities laws of Hong Kong) other than with respect to securities which are or are intended to be disposed of
118
Table of Contents
only to persons outside Hong Kong or only to “professional investors” as defined in the Securities and Futures Ordinance and any rules made under that Ordinance.
Japan
The securities have not been and will not be registered under the Financial Instruments and Exchange Law of Japan (Law No. 25 of 1948, as amended) and, accordingly, will not be offered or sold, directly or indirectly, in Japan, or for the benefit of any Japanese Person or to others for re-offering or resale, directly or indirectly, in Japan or to any Japanese Person, except in compliance with all applicable laws, regulations and ministerial guidelines promulgated by relevant Japanese governmental or regulatory authorities in effect at the relevant time. For the purposes of this paragraph, “Japanese Person” shall mean any person resident in Japan, including any corporation or other entity organized under the laws of Japan.
Singapore
This prospectus has not been registered as a prospectus with the Monetary Authority of Singapore. Accordingly, this prospectus and any other document or material in connection with the offer or sale, or invitation for subscription or purchase, of securities may not be circulated or distributed, nor may the securities be offered or sold, or be made the subject of an invitation for subscription or purchase, whether directly or indirectly, to persons in Singapore other than (i) to an institutional investor under Section 274 of the Securities and Futures Act, Chapter 289 of Singapore (the “SFA”), (ii) to a relevant person pursuant to Section 275(1), or any person pursuant to Section 275(1A), and in accordance with the conditions specified in Section 275, of the SFA, or (iii) otherwise pursuant to, and in accordance with the conditions of, any other applicable provision of the SFA.
Where the securities are subscribed or purchased under Section 275 of the SFA by a relevant person which is:
(a) a corporation (which is not an accredited investor (as defined in Section 4A of the SFA)) the sole business of which is to hold investments and the entire share capital of which is owned by one or more individuals, each of whom is an accredited investor; or
(b) a trust (where the trustee is not an accredited investor) whose sole purpose is to hold investments and each beneficiary of the trust is an individual who is an accredited investor,
securities (as defined in Section 239(1) of the SFA) of that corporation or the beneficiaries’ rights and interest (howsoever described) in that trust shall not be transferred within six months after that corporation or that trust has acquired the securities pursuant to an offer made under Section 275 of the SFA except:
(a) to an institutional investor or to a relevant person defined in Section 275(2) of the SFA, or to any person arising from an offer referred to in Section 275(1A) or Section 276(4)(i)(B) of the SFA;
(b) where no consideration is or will be given for the transfer;
(c) where the transfer is by operation of law;
(d) as specified in Section 276(7) of the SFA; or
(e) as specified in Regulation 32 of the Securities and Futures (Offers of Investments) (Shares and Debentures) Regulations 2005 of Singapore.
119
Table of Contents
Other activities
The underwriters and their respective affiliates are full service financial institutions engaged in various activities, which may include securities trading, commercial and investment banking, financial advisory, investment management, investment research, principal investment, hedging, financing and brokerage activities. Certain of the underwriters and their affiliates have provided in the past to us and our affiliates and may provide from time to time in the future certain commercial banking, financial advisory, investment banking and other services for us and such affiliates in the ordinary course of their business, for which they have received and may continue to receive customary fees and commissions. In addition, from time to time, certain of the underwriters and their affiliates may effect transactions for their own account or the account of customers, and hold on behalf of themselves or their customers, long or short positions in our debt or equity securities or loans, and may do so in the future. The underwriters and their respective affiliates may also make investment recommendations and/or publish or express independent research views in respect of such securities or instruments and may at any time hold, or recommend to clients that they acquire, long and/or short positions in such securities and instruments.
120
Table of Contents
Mayer Brown LLP, New York, New York, has passed upon the validity of the common stock offered hereby on our behalf. The underwriters are being represented by Davis Polk & Wardwell LLP, New York, New York.
Change in independent registered public accounting firm
On July 29, 2014, at the direction of our board of directors, we dismissed Grant Thornton LLP (“Grant Thornton”) as the company’s independent registered public accounting firm, effective immediately. The decision to change accounting firms was approved by our board of directors on July 29, 2014.
During our two most recent fiscal years ended March 31, 2013 and 2014 and through the date of their dismissal, July 29, 2014, there were no disagreements with Grant Thornton on any matter of accounting principles or practices, financial statement disclosure or auditing scope or procedure, which disagreements, if not resolved to the satisfaction of Grant Thornton, would have caused Grant Thornton to make reference to the subject matter of disagreement in their reports on our consolidated financial statements. In addition, during such periods, there were no “reportable events” as that term is defined in Item 304(a)(1)(v) of Regulation S-K. Grant Thornton’s reports on our consolidated financial statements as of and for the fiscal years ended March 31, 2013 and 2014 did not contain any adverse opinion or a disclaimer of opinion, nor were they qualified or modified as to uncertainty, audit scope or accounting principles.
We provided Grant Thornton with a copy of the above disclosure made in response to Item 304(a) of Regulation S-K prior to its filing with the SEC and requested Grant Thornton furnish the company with a letter addressed to the SEC, stating whether it agrees with the above statements and if not, stating the respects in which it does not agree. A letter addressed to the SEC from Grant Thornton stating that it agrees with the statements made herein is filed as Exhibit 16.1 to the Registration Statement of which this prospectus is a part.
On October 24, 2014, at the direction of our board of directors, we engaged KPMG LLP (“KPMG”), effective immediately, to serve as the company’s independent registered public accounting firm to audit the company’s financial statements for the fiscal years ended March 31, 2012, 2013 and 2014. Our board of directors approved the engagement of KPMG on October 23, 2014.
During our fiscal years ended March 31, 2013 and 2014, and the subsequent interim period prior to engaging KPMG, neither the company nor anyone on its behalf has consulted with KPMG regarding either of the following: (1) the application of accounting principles to any specified transaction, either completed or proposed, or the type of audit opinion that might be rendered on our financial statements, and KPMG did not provide a written report or oral advice on any accounting, auditing or financial reporting issue that KPMG concluded was an important factor considered by the company in reaching a decision as to the accounting, auditing or financial reporting issue, or (2) any matter that was either the subject of a disagreement, as defined in Item 304(a)(1)(iv) of Regulation S-K and the related instructions, or a “reportable event,” as defined in Item 304(a)(1)(v) of Regulation S-K.
The consolidated financial statements of Commercial Credit Group Inc. as of March 31, 2013 and 2014, and for each of the years in the three-year period ended March 31, 2014, have been included herein in reliance upon the report of KPMG LLP, independent registered public accounting firm, appearing elsewhere herein, and upon the authority of said firm as experts in accounting and auditing.
121
Table of Contents
Where you can find more information
We have filed with the SEC a registration statement on Form S-1 under the Securities Act that registers the shares of our common stock to be sold in this offering. This prospectus does not contain all of the information set forth in the registration statement and the exhibits and schedules thereto. For further information with respect to us and our common stock, you should refer to the registration statement and the exhibits and schedules filed as a part of the registration statement. Statements contained in this prospectus concerning the contents of any contract or any other document are not necessarily complete. If a contract or document has been filed as an exhibit to the registration statement, we refer you to the copy of the contract or document that has been filed. Each statement in this prospectus relating to a contract or document filed as an exhibit is qualified in all respects by the filed exhibit.
We are not currently subject to the informational requirements of the Securities Exchange Act of 1934. As a result of this offering, we will become subject to the informational requirements of the Exchange Act and, in accordance therewith, will file reports and other information with the SEC. The registration statement, reports and other information we file with the SEC can be read and copied at the SEC’s Public Reference Room at 100 F Street, N.E., Washington D.C. 20549. You may obtain information regarding the operation of the public reference room by calling 1-800-SEC-0330. The SEC also maintains a website (http://www.sec.gov) that contains reports, proxy and information statements and other information that we file electronically with the SEC. We also maintain a website at www.commercialcreditinc.com. Our website, and the information contained on or accessible through our website, is not part of this prospectus.
We intend to furnish our stockholders with annual reports containing audited financial statements and make available to our stockholders quarterly reports for the first three quarters of each fiscal year containing unaudited interim financial information.
122
Table of Contents
Index to unaudited condensed consolidated financial statements:
| Unaudited condensed consolidated balance sheets as of March 31, 2014 and December 31, 2014 |
F-2 | |||
| F-3 | ||||
| F-4 | ||||
| F-5 | ||||
| F-6 | ||||
| Notes to unaudited condensed consolidated financial statements |
F-7 | |||
F-1
Table of Contents
Commercial Credit, Inc. and subsidiaries
Unaudited condensed consolidated balance sheets
| March 31, 2014 |
December 31, 2014 |
|||||||
| ASSETS |
||||||||
| Finance receivables |
$ | 501,042,435 | $ | 611,466,930 | ||||
| Allowance for credit losses |
(6,359,337 | ) | (7,137,544 | ) | ||||
|
|
|
|||||||
| Finance receivables—net |
494,683,098 | 604,329,386 | ||||||
| Cash and cash equivalents |
990,656 | 4,023,702 | ||||||
| Restricted cash |
36,526,866 | 33,294,034 | ||||||
| Other assets |
9,795,644 | 7,848,806 | ||||||
|
|
|
|||||||
| TOTAL ASSETS |
$ | 541,996,264 | $ | 649,495,928 | ||||
|
|
|
|||||||
| LIABILITIES |
||||||||
| Long-term debt ($5,000,000 at March 31, 2014, and $5,000,000 at December 31, 2014, owed to related parties) |
$ | 417,927,944 | $ | 479,259,439 | ||||
| Short-term debt |
61,494,002 | 98,072,722 | ||||||
| Accrued interest, taxes and other liabilities ($221,875 at March 31, 2014, and $221,875 at December 31, 2014 owed to related parties) |
9,983,431 | 10,649,534 | ||||||
|
|
|
|||||||
| TOTAL LIABILITIES |
489,405,377 | 587,981,695 | ||||||
|
|
|
|||||||
| SHAREHOLDERS’ EQUITY |
||||||||
| Series 1 Preferred stock ($.00001 par value; $7,230,600 liquidation value; 125,000 shares authorized; 72,306 shares issued and outstanding as of March 31, 2014, and December 31, 2014) |
96,273 | 96,273 | ||||||
| Series 2 Preferred stock ($.00001 par value; $57,455,100 liquidation value; 675,000 shares authorized; 574,551 shares issued and outstanding as of March 31, 2014, and December 31, 2014) |
51,066,434 | 51,066,434 | ||||||
| Common stock ($.00001 par value; 850,000 shares authorized; 2,176 shares issued and outstanding as of March 31, 2014, and December 31, 2014) |
— | — | ||||||
| Additional paid-in capital |
64,564 | 129,898 | ||||||
| Accumulated other comprehensive loss, net of tax |
(239,713 | ) | (411,042 | ) | ||||
| Retained earnings |
1,603,329 | 10,632,670 | ||||||
|
|
|
|||||||
| TOTAL SHAREHOLDERS’ EQUITY |
52,590,887 | 61,514,233 | ||||||
|
|
|
|||||||
| TOTAL LIABILITIES AND SHAREHOLDERS’ EQUITY |
$ | 541,996,264 | $ | 649,495,928 | ||||
|
|
||||||||
See accompanying notes to unaudited condensed consolidated financial statements
F-2
Table of Contents
Commercial Credit, Inc. and subsidiaries
Unaudited condensed consolidated statements of income
| For the nine months ended December 31, |
||||||||
| 2013 | 2014 | |||||||
| Finance income |
$ | 33,803,986 | $ | 41,109,267 | ||||
| Interest expense ($478,125 and $478,125 in interest incurred to related parties for the nine months ended December 31, 2013 and 2014, respectively) |
(11,621,967 | ) | (11,849,874 | ) | ||||
|
|
|
|||||||
| Net finance income before provision for credit losses on finance receivables |
22,182,019 | 29,259,393 | ||||||
| Provision for credit losses on finance receivables |
2,097,730 | 1,700,000 | ||||||
|
|
|
|||||||
| Net finance income |
20,084,289 | 27,559,393 | ||||||
| Compensation and benefits |
5,388,631 | 7,607,627 | ||||||
| Other operating expenses ($187,500 and $187,500 in expenses incurred to related parties for the nine months ended December 31, 2013 and 2014, respectively) |
3,845,906 | 5,110,483 | ||||||
|
|
|
|||||||
| Total operating expenses |
9,234,537 | 12,718,110 | ||||||
| Income before income taxes |
10,849,752 | 14,841,283 | ||||||
| Provision for income taxes |
4,291,181 | 5,811,942 | ||||||
|
|
|
|||||||
| Net income |
$ | 6,558,571 | $ | 9,029,341 | ||||
|
|
|
|||||||
| Summary of Earnings per Share |
||||||||
| For the nine months ended December 31, 2013 |
||||||||
| Net income |
$ | 6,558,571 | $ | — | ||||
| Distribution to preferred shareholders |
$ | (1,262,103 | ) | $ | — | |||
| Income available to participating securities |
$ | 5,296,468 | $ | — | ||||
| Basic and diluted earnings per participating share (number of common shares outstanding was zero) |
$ | 7.81 | $ | — | ||||
| For the nine months ended December 31, 2014 |
||||||||
| Net income |
$ | — | $ | 9,029,341 | ||||
| Income available to common shareholders |
$ | — | $ | 28,841 | ||||
| Basic and diluted earnings per common share |
$ | — | $ | 13.25 | ||||
|
|
||||||||
See accompanying notes to unaudited condensed consolidated financial statements
F-3
Table of Contents
Commercial Credit, Inc. and subsidiaries
Unaudited condensed consolidated statements of comprehensive income
| For the nine months ended December 31, |
||||||||
| 2013 | 2014 | |||||||
| Net income |
$ | 6,558,571 | $ | 9,029,341 | ||||
| Other comprehensive income (loss), net of tax |
||||||||
| Foreign currency translation adjustment |
— | (229,680 | ) | |||||
| Unrealized gains of cash flow hedges |
853,097 | 84,990 | ||||||
|
|
|
|||||||
| Other comprehensive income (loss) |
853,097 | (144,690 | ) | |||||
| Less: tax expense |
(324,177 | ) | (26,639 | ) | ||||
|
|
|
|||||||
| Other comprehensive income (loss), net |
528,920 | (171,329 | ) | |||||
|
|
|
|||||||
| Comprehensive income |
$ | 7,087,491 | $ | 8,858,012 | ||||
|
|
||||||||
See accompanying notes to unaudited condensed consolidated financial statements
F-4
Table of Contents
Commercial Credit, Inc. and subsidiaries
Unaudited condensed consolidated statements of changes in shareholder’s equity
| Series 1 preferred stock |
Series 2 preferred stock |
Common stock |
Additional capital |
Retained deficit) |
Accumulated loss |
Total equity |
||||||||||||||||||||||||||||||||||
| Shares | Amount | Shares | Amount | Shares | Amount | |||||||||||||||||||||||||||||||||||
| Balance, March 31, 2013 |
81,590 | $ | 108,634 | 579,620 | $ | 51,516,970 | — | $ | — | $ | — | $ | (6,483,761 | ) | $ | (753,822 | ) | $ | 44,388,021 | |||||||||||||||||||||
| Net income |
— | — | — | — | — | — | — | 6,558,571 | 6,558,571 | |||||||||||||||||||||||||||||||
| Change in accumulated other comprehensive loss |
— | — | — | — | — | — | — | — | 528,920 | 528,920 | ||||||||||||||||||||||||||||||
| Share-based compensation |
— | — | — | — | — | — | 37,534 | — | — | 37,534 | ||||||||||||||||||||||||||||||
| Redemption of preferred stock |
(9,284 | ) | (12,361 | ) | (5,069 | ) | (450,536 | ) | — | — | — | (1,262,103 | ) | — | (1,725,000 | ) | ||||||||||||||||||||||||
|
|
|
|||||||||||||||||||||||||||||||||||||||
| Balance, December 31, 2013 |
72,306 | $ | 96,273 | 574,551 | $ | 51,066,434 | — | $ | — | $ | 37,534 | $ | (1,187,293 | ) | $ | (224,902 | ) | $ | 49,788,046 | |||||||||||||||||||||
|
|
|
|||||||||||||||||||||||||||||||||||||||
| Balance, March 31, 2014 |
72,306 | $ | 96,273 | 574,551 | $ | 51,066,434 | 2,176 | $ | — | $ | 64,564 | $ | 1,603,329 | $ | (239,713 | ) | $ | 52,590,887 | ||||||||||||||||||||||
| Net income |
— | — | — | — | — | — | — | 9,029,341 | — | 9,029,341 | ||||||||||||||||||||||||||||||
| Change in accumulated other comprehensive loss |
— | — | — | — | — | — | — | — | (171,329 | ) | (171,329 | ) | ||||||||||||||||||||||||||||
| Share-based compensation |
— | — | — | — | — | — | 65,334 | — | — | 65,334 | ||||||||||||||||||||||||||||||
|
|
|
|||||||||||||||||||||||||||||||||||||||
| Balance, December 31, 2014 |
72,306 | $ | 96,273 | 574,551 | $ | 51,066,434 | 2,176 | $ | — | $ | 129,898 | $ | 10,632,670 | $ | (411,042 | ) | $ | 61,514,233 | ||||||||||||||||||||||
|
|
||||||||||||||||||||||||||||||||||||||||
See accompanying notes to unaudited condensed consolidated financial statements
F-5
Table of Contents
Commercial Credit, Inc. and subsidiaries
Unaudited condensed consolidated statements of cash flows
| For the nine months ended December 31, |
||||||||
| 2013 | 2014 | |||||||
| Cash flows from operating activities: |
||||||||
| Net income |
$ | 6,558,571 | $ | 9,029,341 | ||||
| Adjustments to reconcile net income to net cash provided by operating activities: |
||||||||
| Provision for credit losses on finance receivables |
2,097,730 | 1,700,000 | ||||||
| Amortization of debt issuance and origination costs |
3,743,124 | 4,782,788 | ||||||
| Depreciation |
197,109 | 254,946 | ||||||
| Share-based compensation |
37,534 | 65,334 | ||||||
| Loss (gain) on repossessed assets |
96,881 | (74,859 | ) | |||||
| Changes in operating assets and liabilities: |
||||||||
| Increase in other assets |
(306,475 | ) | (353,486 | ) | ||||
| Increase in accrued interest, taxes and other liabilities |
1,415,267 | 708,280 | ||||||
|
|
|
|||||||
| Net cash provided by operating activities |
13,839,741 | 16,112,344 | ||||||
|
|
|
|||||||
| Cash flows from investing activities: |
||||||||
| Finance receivables originated |
(224,751,337 | ) | (297,893,939 | ) | ||||
| Finance receivables collected |
136,225,041 | 188,518,767 | ||||||
| Proceeds from repossessed asset sales |
955,727 | 1,627,521 | ||||||
| Loan/lease origination costs |
(3,100,311 | ) | (3,768,807 | ) | ||||
| (Increase) decrease in restricted cash |
(8,107,180 | ) | 3,228,258 | |||||
| Purchase of property and equipment |
(475,284 | ) | (446,603 | ) | ||||
|
|
|
|||||||
| Net cash used in investing activities |
(99,253,344 | ) | (108,734,803 | ) | ||||
|
|
|
|||||||
| Cash flows from financing activities: |
||||||||
| Advances on senior credit facility |
109,163,041 | 322,015,329 | ||||||
| Payments on senior credit facility |
(131,128,992 | ) | (315,356,422 | ) | ||||
| Advances on securitization facilities |
374,185,000 | 486,003,691 | ||||||
| Payments on securitization facilities |
(259,223,437 | ) | (394,650,082 | ) | ||||
| Redemption of preferred stock |
(1,725,000 | ) | — | |||||
| Debt issuance costs |
(1,595,026 | ) | (2,249,100 | ) | ||||
|
|
|
|||||||
| Net cash provided by financing activities |
89,675,586 | 95,763,416 | ||||||
|
|
|
|||||||
| Effect of exchange rate changes on cash and cash equivalents |
— | (107,911 | ) | |||||
| Net change in cash and cash equivalents |
4,261,983 | 3,033,046 | ||||||
| Cash and cash equivalents, beginning of period |
1,000,000 | 990,656 | ||||||
|
|
|
|||||||
| Cash and cash equivalents, end of period |
$ | 5,261,983 | $ | 4,023,702 | ||||
|
|
|
|||||||
| Supplemental disclosures of cash flow information: |
||||||||
| Income taxes paid |
$ | 4,279,991 | $ | 6,828,550 | ||||
| Interest paid ($478,125, and $478,125 paid to related parties during nine months ended December 31, 2013 and 2014, respectively) |
$ | 9,521,681 | $ | 9,248,734 | ||||
|
|
||||||||
See accompanying notes to unaudited condensed consolidated financial statements
F-6
Table of Contents
Commercial Credit, Inc. and subsidiaries
Notes to unaudited condensed consolidated financial statements
1 Description of business
Reporting entity and reorganization
On July 31, 2014, the Board of Directors of Commercial Credit Group Inc. (“CCG”) formed Commercial Credit, Inc. (“CCI”) to facilitate an initial public offering by creating a new holding company structure, in which CCG would be a direct, wholly-owned subsidiary of CCI (the “Reorganization”). On December 12, 2014, CCI entered into a contribution agreement with each of CCG’s stockholders pursuant to which each CCG stockholder contributed all of its shares of CCG capital stock to CCI in exchange for an equal number of the corresponding class or series of CCI capital stock upon the same terms and conditions. Additionally, each outstanding restricted share of common stock of CCG was also exchanged for a restricted share of common stock of CCI upon the same terms and conditions. The directors and executive officers of CCI immediately after completion of the Reorganization are comprised of the same persons who were directors of and executive officers of CCG immediately prior to the Reorganization.
As CCI and CCG are under common control, the Reorganization transaction has been accounted for in accordance ASC 805-50. The historical basis of CCG has been maintained and the comparative information presented herein has been adjusted to reflect the historical results of CCG. The term “Company” as used herein and unless otherwise stated or indicated by context, refer to CCG, together with its consolidated subsidiaries, before the Reorganization and to CCI, together with its consolidated subsidiaries, after the Reorganization.
Business
The Company offers financing and leasing arrangements of commercial equipment for middle market companies operating throughout the United States and Canada and its primary area of focus is to provide purchase money and refinance transactions within the construction, fleet transportation and waste industries. Financing transactions primarily are sourced through end-users, equipment vendors and manufacturers with typical transaction sizes ranging from $50,000 to $2,500,000. The Company is headquartered in Charlotte, North Carolina, operates satellite offices in Naperville, Illinois and Buffalo, New York and operates a Canadian office in Hamilton, Ontario.
2 Summary of significant accounting principles
Principles of consolidation and basis of presentation
The unaudited condensed consolidated financial statements reflect the consolidated financial position, results of operations and cash flows of the Company and its wholly-owned subsidiaries, which include a Canadian subsidiary and special purpose entities for the Company’s on-balance sheet asset securitization borrowing facilities. All significant intercompany balances and transactions have been eliminated in consolidation. The Company operates as a single reportable segment.
The financial information presented in the accompanying unaudited condensed consolidated financial statements as of December 31, 2014 and for the nine months ended December 31, 2013 and 2014 has been prepared in accordance with U.S. generally accepted accounting principles (“GAAP”). Accordingly, they do not include all of the information and footnotes required by GAAP for a complete set of financial statements. These unaudited condensed consolidated financial statements and notes reflect all adjustments which are, in the
F-7
Table of Contents
Commercial Credit, Inc. and subsidiaries
Notes to unaudited condensed consolidated financial statements
opinion of management, necessary to present fairly our financial position and results of operations for the periods presented and should be read in conjunction with the annual audited consolidated financial statements and notes thereto.
Cash and cash equivalents
Cash and cash equivalents include cash and short-term, interest-bearing investments with an original maturity date of 90 days or less.
Restricted cash
Certain financing facilities maintained by the Company require that funds received from obligors be retained in a specific account related to that particular financing facility. Funds in this account are distributed on a monthly basis in accordance with the provisions related to that facility. As such, these amounts are categorized as restricted cash on the Company’s unaudited condensed consolidated balance sheet.
Finance receivable
The Company’s finance receivable portfolio is comprised of finance loans and leases. Finance loans consist of installment loans which are made on a discounted basis, whereby interest and other charges are generally added to the amount advanced to arrive at the face amount of the note. The discount, called unearned finance income, is netted against the face of the note on the accompanying balance sheet and amortized into finance income using the effective interest method. Leases, which account for less than 7.7% of the entire portfolio as of December 31, 2014, are accounted for as direct financing leases where total lease payments plus any residual values less unearned interest income is reported in the aggregate as finance receivables. The Company records residual values at the lowest of (i) any stated purchase option, (ii) the present value at the end of the initial lease term of rentals due under any renewal options or (iii) the Company’s projection of the equipment’s fair value at the end of the lease.
Revenue recognition
Finance income includes interest and fee income earned on finance receivables less the amortization of capitalized costs related to the origination of finance receivables, such as allocation of employee compensation and other direct origination costs, involved in loan processing. Finance income is recognized using the effective interest method over the term of the contract.
Recognition of interest income is suspended upon the determination by management that collection of the outstanding receivable is not probable. Receivables may be removed from nonaccrual status and recognition of interest income resumes when collection of any outstanding contractual amounts due is deemed probable. The Company accounts for any interest received on receivables on nonaccrual status on the cost recovery method. As of March 31, 2014, and December 31, 2014, there were no nonaccrual status finance receivables still accruing interest. Nonaccrual finance receivables represent the Company’s impaired finance receivables and no amount of interest income for these receivables was recognized within the nine months ended December 31, 2013 and 2014.
F-8
Table of Contents
Commercial Credit, Inc. and subsidiaries
Notes to unaudited condensed consolidated financial statements
Allowance for credit losses on finance receivables
The allowance for credit losses on finance receivables is the Company’s estimate of losses inherent in the outstanding receivables. The Company estimates this allowance based upon several quantitative and qualitative factors, including, among others, the amount of total finance receivables, net charge-off experience, impaired and delinquent receivables, the Company’s current assessment of the risks from national and regional economic conditions, the financial condition of customers and guarantors, historical collection experience, and collateral values. Actual losses may vary from current estimates. These estimates are reviewed periodically, and no less frequently than quarterly, and as adjustments become necessary, they are recorded against earnings in the period in which they become known.
The Company evaluates a finance receivable for impairment at the earliest of the date at which (i) it becomes more than 91 days past due, (ii) when and if it is placed on nonaccrual status, (iii) in the event the underlying customer files a bankruptcy petition, or (iv) management becomes aware of circumstances that would indicate that the loan may not be repaid according to its terms and should be evaluated for potential impairment. In addition, the Company evaluates the level of any impairment of a finance receivable on a quarterly or more frequent basis until there is no further evidence of impairment.
Impaired finance receivables are written down to their estimated fair value, based on the estimated liquidation value of the underlying collateral, and charged against the allowance for credit losses when a loss is considered imminent. Charge-offs subsequently recovered are credited to the allowance for credit losses.
Repossessed assets
All contract receivables whose collateral becomes subject to foreclosure are removed from finance receivables and are reclassified once title clears to the Company as repossessed assets, which are included within other assets in the Company’s unaudited condensed consolidated balance sheets. Repossessed assets are initially recorded at fair value based on the estimated liquidation value of the collateral. The Company estimates the fair value of repossessed assets by evaluating their market value and condition based on recent sales of similar equipment, used equipment publications, the Company management’s market knowledge and information from equipment vendors. Assets received to satisfy finance receivables (repossessed equipment, included in other assets) are initially written-down to the Company’s estimate of fair value by a charge to the allowance for credit losses. Subsequent to foreclosure, valuations are periodically performed by management and the assets are carried at the lower of the carrying amount or fair value. Any subsequent recoveries or write-downs are recorded into income.
Property and equipment, net
Property and equipment, net are recorded at cost. Depreciation is computed using the straight-line method over the estimated useful lives of the assets ranging from three to five years. Maintenance and repair costs that do not improve or extend the useful lives of assets are charged to expense as incurred.
F-9
Table of Contents
Commercial Credit, Inc. and subsidiaries
Notes to unaudited condensed consolidated financial statements
As of March 31, 2014 and December 31, 2014, respectively, the Company’s property and equipment, net, which are included within other assets in the Company’s unaudited condensed consolidated balance sheets, were as follows:
| March 31, 2014 |
December 31, 2014 |
|||||||
| Equipment and software |
$ | 1,158,739 | $ | 1,382,488 | ||||
| Furniture and fixtures |
495,777 | 611,614 | ||||||
| Leasehold improvements |
62,441 | 154,000 | ||||||
|
|
|
|||||||
| Property and equipment |
1,716,957 | 2,148,102 | ||||||
| Less: Accumulated depreciation |
(977,019 | ) | (1,216,814 | ) | ||||
|
|
|
|||||||
| Property and equipment, net |
$ | 739,938 | $ | 931,288 | ||||
|
|
||||||||
Interest expense
Interest expense is comprised of interest expense on the Company’s outstanding indebtedness, unused facility fees, amortization of capitalized debt issuance costs, payments under hedging agreements and other ancillary fees associated with the maintenance of credit facilities.
Derivative financial instruments
The Company manages its exposure to market interest rate movements through the use of interest-rate swap contracts. These derivative financial instruments are carried at fair value in accrued interest, taxes and other liabilities in the accompanying unaudited condensed consolidated balance sheet. The Company does not enter into derivative financial instruments for trading or speculative purposes. To qualify as an accounting hedge under the hedge accounting rules, a derivative must be highly effective in offsetting the risk designated as being hedged. The hedge relationship must be formally documented at inception, detailing the particular risk management objective and strategy for the hedge. This includes the item and risk that is being hedged, the derivative that is being used and how effectiveness will be assessed and ineffectiveness measured. Periodically, as required, the Company assesses whether the derivative in each hedging relationship is expected to be and has been highly effective in offsetting changes in cash flows of the hedged item using regression analysis. Hedge ineffectiveness is measured and recorded in current earnings. If a hedge relationship is found to be ineffective, it no longer qualifies as an accounting hedge and hedge accounting would not be applied.
For the Company’s cash flow hedges, which use derivatives to hedge the variability of cash flows related to forecasted interest payments on floating-rate liabilities, the accounting treatment depends on the effectiveness of the hedge. To the extent these derivatives are effective in offsetting the variability of the forecasted cash flows, the effective portion of the changes in the derivatives’ fair values will not be included in current earnings, but is reported in accumulated other comprehensive income (loss) on the unaudited condensed consolidated statement of comprehensive income. These changes in fair value will be included in earnings of future periods when the hedged cash flows impact earnings. To the extent these derivatives are not effective, changes in their fair values are immediately included in current earnings.
For those accounting hedge relationships that are terminated or when hedge designations are removed, the hedge accounting treatment described in the paragraphs above is no longer applied. For these cash flow
F-10
Table of Contents
Commercial Credit, Inc. and subsidiaries
Notes to unaudited condensed consolidated financial statements
hedges, any changes in fair value of the derivative remain in accumulated other comprehensive loss and are included in earnings of future periods when the hedged cash flows impact earnings. However, if it becomes probable that the hedged forecasted transaction will not occur, any amounts that remain in accumulated other comprehensive loss are immediately reflected in current earnings. See Note 5 to the Unaudited Condensed Consolidated Financial Statements for a further discussion of the Company’s hedging and derivative activities.
Translation of foreign currencies
The financial statements of the Company’s Canadian subsidiary are translated into U.S. dollars. Revenue and expenses are translated at average current exchange rates during each period and assets and liabilities are translated at the current rate as of the period end date. Net translation exchange gains or losses and the effect of exchange rate changes on intercompany transactions of a long-term nature are recorded in accumulated other comprehensive loss in stockholders’ equity. Gains and losses from translation of assets and liabilities denominated in other than the functional currency of the operation are recorded in income as incurred.
New accounting standards
In August 2014, the Financial Accounting Standards Board (“FASB”) issued ASU 2014-13 Consolidation, (“ASU 2014-13”) which states that the fair value of the financial assets of a collateralized financing entity, as determined under GAAP, may differ from the fair value of its financial liabilities even when the financial liabilities have recourse only to the financial assets. Before this update, there was no specific guidance in GAAP on how a reporting entity should account for that difference. The amendments in ASU 2014-13 provide an alternative to measuring the financial assets and the financial liabilities of a consolidated collateralized financing entity to eliminate that difference. When the measurement alternative is not elected for a consolidated collateralized financing entity within the scope of ASU 2014-13, the amendments clarify that (1) the fair value of the financial assets and/or liabilities of the consolidated collateralized financing entity should be measured using the requirements of ASC 820, Fair Value and (2) any differences in the fair value of the financial assets and/or liabilities of that consolidated collateralized financing entity should be reflected in earnings. This update is effective for fiscal years, and interim periods within those years, beginning after December 15, 2015, which will be April 1, 2016, for the Company. The Company is currently evaluating the impact the changes will have on the presentation of its financial position and results of operations.
In May 2014, the FASB issued ASU No. 2014-09, Revenue from Contracts with Customers (Topic 606), which supersedes the revenue recognition requirements in ASC 605, Revenue Recognition. This ASU is based on the principle that revenue is recognized to depict the transfer of goods or services to customers in an amount that reflects the consideration to which the entity expects to be entitled in exchange for those goods or services. The ASU also requires additional disclosure about the nature, amount, timing and uncertainty of revenue and cash flows arising from customer contracts, including significant judgments and changes in judgments and assets recognized from costs incurred to obtain or fulfill a contract. The effective date will be the first quarter of fiscal year 2018 using one of two retrospective application methods. The Company has not determined the potential effects on the consolidated financial statements.
F-11
Table of Contents
Commercial Credit, Inc. and subsidiaries
Notes to unaudited condensed consolidated financial statements
3 Finance receivables
As of March 31, 2014 and December 31, 2014, the Company’s financing and leasing receivables were comprised of the following:
| March 31, 2014 |
December 31 2014 |
|||||||
| Finance receivables, including unearned finance income |
$ | 580,597,823 | $ | 708,248,385 | ||||
| Estimated residual value of leased assets |
7,734,679 | 8,893,752 | ||||||
| Unearned finance income |
(91,397,808 | ) | (110,564,099 | ) | ||||
| Funds withheld from account proceeds |
(534,441 | ) | (770,539 | ) | ||||
| Net unamortized fees and costs |
4,642,182 | 5,659,431 | ||||||
|
|
|
|||||||
| Total finance receivables |
$ | 501,042,435 | $ | 611,466,930 | ||||
|
|
||||||||
| March 31, 2014 |
December 31 2014 |
|||||||
| Nonaccrual Status—Finance Receivables |
||||||||
| Nonaccrual finance receivables |
$ | 16,102,463 | $ | 18,886,183 | ||||
|
|
|
|||||||
| Average investment in nonaccrual finance receivables |
$ | 13,737,266 | $ | 17,494,323 | ||||
|
|
|
|||||||
| Finance receivables past due 90 days or more and still accruing |
$ | 69,944 | $ | — | ||||
|
|
||||||||
The Company’s financing arrangements typically feature a fixed-interest rate. The portfolio yield was 10.4% for the fiscal year ended March 31, 2014 and on an annualized basis, 9.9% for the nine months ended December 31, 2014. The Company periodically evaluates the contracts in its portfolio for impairment on an individual basis and records a specific allowance for those receivables that are deemed to be uncollectible.
When assessing a loan for impairment, the Company considers the customer’s payment status, payment history, the expected potential recovery from underlying collateral in the event the equipment is repossessed and liquidated, as well as any other potential recovery available from other sources of repayment such as additional collateral securing the loan or recovery under any guarantees as may be applicable to each loan according to its individual circumstances.
Summary of impaired finance receivables and specific allowance
| Unpaid contractual principal balance |
Recorded investment in impaired loans with no specific allowance |
Recorded investment in impaired loans with specific allowance |
Nonaccrued loans (total recorded investment in impaired loans) |
Specific allowance |
Specific allowance as percentage of impaired loans with specific allowance |
|||||||||||||||||||
| March 31, 2014 |
$ | 17,597,243 | $ | 15,120,831 | $ | 981,632 | $ | 16,102,463 | $ | 385,000 | 39.2% | |||||||||||||
| December 31, 2014 |
$ | 20,717,961 | $ | 16,364,866 | $ | 2,521,317 | $ | 18,886,183 | $ | 592,000 | 23.5% | |||||||||||||
|
|
||||||||||||||||||||||||
F-12
Table of Contents
Commercial Credit, Inc. and subsidiaries
Notes to unaudited condensed consolidated financial statements
Summary of allowance for credit losses: specific and general allowances
| March 31, 2014 | December 31, 2014 | |||||||
| Specific allowance for finance receivables individually evaluated for impairment |
$ | 385,000 | $ | 592,000 | ||||
| General allowance for finance receivables collectively evaluated for impairment |
5,974,337 | $ | 6,545,544 | |||||
|
|
|
|||||||
| Allowance for credit losses for finance receivables |
$ | 6,359,337 | $ | 7,137,544 | ||||
|
|
||||||||
Finance receivables generally require monthly installments over two to seven years. Annual contractual maturities at December 31, 2014 are as follows:
| Year | Amount | |||
| 2015 |
$ | 67,406,277 | ||
| 2016 |
227,560,809 | |||
| 2017 |
192,986,870 | |||
| 2018 |
131,778,177 | |||
| 2019 |
64,872,127 | |||
| Thereafter |
23,644,125 | |||
|
|
|
|||
| Total |
$ | 708,248,385 | ||
|
|
||||
Credit quality
The Company measures the delinquency of its finance receivables in the aggregate based on the number of days the customer’s oldest receivable is past due. The Company’s aging summary of its entire portfolio is as follows:
| Finance receivables |
Current | 1-30 days past due |
31-60 days past due |
61-90 days Past due |
91-120 Days past due |
120+ Days past due |
||||||||||||||||||||||
| March 31, 2014 |
$ | 501,042,435 | $ | 354,557,050 | $ | 100,204,951 | $ | 35,439,399 | $ | 3,490,602 | $ | 4,401,976 | $ | 2,948,457 | ||||||||||||||
| December 31, 2014 |
$ | 611,466,930 | $ | 458,404,297 | $ | 102,622,275 | $ | 28,268,948 | $ | 12,712,515 | $ | 3,420,307 | $ | 6,038,588 | ||||||||||||||
|
|
||||||||||||||||||||||||||||
| March 31, 2014 |
December 31, 2014 |
|||||||
| Collectively evaluated for impairment |
$ | 484,737,106 | $ | 592,514,724 | ||||
| Individually evaluated for impairment |
16,102,463 | 18,886,183 | ||||||
| Loans acquired with deteriorated credit quality |
202,866 | 66,023 | ||||||
|
|
|
|||||||
| Finance receivables |
$ | 501,042,435 | $ | 611,466,930 | ||||
|
|
||||||||
Concentrations of credit risk result when customers have similar economic characteristics that would cause their ability to meet contractual obligations to be affected by changes in economic or other conditions similarly. The Company does not have a significant concentration of credit risk with any customer.
F-13
Table of Contents
Commercial Credit, Inc. and subsidiaries
Notes to unaudited condensed consolidated financial statements
Credit risk associated with finance receivables is concentrated in the following states:
| March 31, 2014 | December 31, 2014 | |||||
| TX | 14% | TX | 13% | |||
| NC | 10% | NC | 10% | |||
| GA | 7% | CA | 9% | |||
| IL | 6% | GA | 7% | |||
| SC | 5% | IL | 6% | |||
| CA | 5% | SC | 5% | |||
| PA | 4% | PA | 4% | |||
| VA | 3% | FL | 4% | |||
| FL | 3% | NJ | 3% | |||
| MI | 2% | MO | 3% | |||
| Remaining | 41% | Remaining | 36% | |||
|
|
|
|
| |||
Allowance for credit losses
The Company maintains an allowance for credit losses at an amount sufficient to absorb losses inherent in its finance receivables for both its loan and leasing arrangements combined. The portfolio represents one class, commercial equipment financing, evaluated on a pooled basis, due to its composition of mid-sized balances of homogenous accounts with similar general credit risk characteristics. Impaired finance receivables are written down to their estimated net realizable value, based on the estimated liquidation value of the underlying collateral. Each impaired loan is assessed regularly to ensure its carrying value is appropriate given current market conditions and the value of the underlying collateral. Impaired finance receivables are charged against the allowance for credit losses when a loss appears imminent with recoveries of previous charge-offs credited to the allowance for credit losses.
The allowance for credit losses is established through provisions for credit losses charged to income. The Company maintains the allowance for credit losses based on a quarterly evaluation of a variety of factors. These factors include, but are not limited to: (i) historical credit loss experience, which includes the most recent three year historical period, and recent trends in that experience; (ii) historical loss discover periods, and (iii) qualitative factors such as changes in the composition of the Company’s finance receivable portfolio, seasonality, economic or business conditions and emerging trends, business practices or policies at the reporting date that are different from the periods used in the quantitative analysis, an evaluation of delinquent and non-performing loans and related collateral values, external factors such as regulatory, legal or competitive matters, interest rates, industry conditions, and used equipment values. Changes in economic conditions, the risk characteristics and composition of the portfolio, bankruptcy laws and other factors could impact the actual and projected net credit losses and the related allowance for credit losses. Actual losses may vary from current estimates.
F-14
Table of Contents
Commercial Credit, Inc. and subsidiaries
Notes to unaudited condensed consolidated financial statements
The activity in the allowance for credit losses is summarized below for the nine months ended December 31, 2013, and 2014, respectively:
| For the nine months ended December 31, | ||||||||
| 2013 | 2014 | |||||||
| Allowance, beginning of period |
$ | 5,389,451 | $ | 6,359,337 | ||||
| Provision |
2,097,730 | 1,700,000 | ||||||
| Charge-offs |
(951,461 | ) | (1,110,058 | ) | ||||
| Recoveries |
29,729 | 188,265 | ||||||
|
|
|
|||||||
| Allowance, end of period |
$ | 6,565,449 | $ | 7,137,544 | ||||
|
|
|
|||||||
| Allowance, end of period as a percentage of finance receivables |
1.39% | 1.17% | ||||||
|
|
|
|||||||
| Net charge offs, as a percentage of average finance receivables |
0.22% | 0.17% | ||||||
|
|
||||||||
Troubled debt restructurings
A troubled debt restructuring (“TDR”) is generally the modification of debt in which a creditor grants a concession it would not otherwise consider to an obligor that is experiencing financial difficulties. These modifications may include a reduction of the stated interest rate, an extension of the maturity dates, a reduction of the face amount of the debt, or a reduction of accrued interest. For the nine month period ended December 31, 2014, the Company identified 7 individual contracts, spread over 5 obligors as TDRs with aggregate balances of $1,624,801 pre-modification and $1,641,978 post-modification. The Company did not identify any individual contracts as TDRs during the nine months ended December 31, 2013. The nature of the Company’s receivable modifications qualifying as TDRs during these periods was comprised of payment deferrals and interest rate reductions. Payment deferrals result in lower net present value of cash flows, if not accompanied by additional interest or fees. The financial impact of these modifications is not significant given the limited number of such modifications as well as the length of deferral periods. Interest rate reductions result in lower amounts of interest being charged to the customer. The weighted average change in interest rates for all TDRs occurring during the nine months ended December 31, 2014 was not significant.
During these same periods, the Company had no commitments to lend additional funds to obligors whose accounts were TDRs. The Company has not experienced any subsequent credit loss on any of the contracts that were identified as TDRs. All of the contracts identified as TDR’s have been paid off or are performing satisfactorily and are monitored and treated in accordance with the Company’s credit and collection policy.
Loans classified as TDRs are considered impaired loans. Impaired finance receivables are written down to their estimated net realizable value, based on the estimated liquidation value of the underlying collateral. Each impaired loan is assessed regularly to ensure its carrying value is appropriate given current market conditions and the value of the underlying collateral. Impaired finance receivables are charged against the allowance for credit losses when a loss appears imminent with recoveries of previous charge-offs credited to the allowance for credit losses.
Loans acquired with deteriorated credit quality
The Company acquired certain loans in a prior period which had evidence of credit deterioration since their origination and for which it was probable that at the date of acquisition the Company would not collect all
F-15
Table of Contents
Commercial Credit, Inc. and subsidiaries
Notes to unaudited condensed consolidated financial statements
contractually required principal and interest payments. The loans were not significant relative to the size of the Company’s overall loan portfolio and as of December 31, 2014, approximately 95% of the original loan balance has been paid off with minimal charge-offs. The loans were recorded at fair value at the date of acquisition, and the historical allowance for credit losses related to these loans was not carried over to the Company’s balance sheet. The excess of cash flows expected to be collected over the carrying value of these loans is referred to as the accretable yield and is recognized in interest income using an effective yield method over the remaining life of the loan. The accretable yield is affected by several factors including changes in prepayment assumptions which affect the estimated remaining life of the loan, interest income and possibly principal expected to be collected. The following additional information is presented for the Company’s loans acquired with deteriorated credit quality:
| March 31, 2014 |
December 31 2014 |
|||||||
| Outstanding balance, beginning |
$ | 2,592,529 | $ | 1,278,837 | ||||
| Outstanding balance, ending |
$ | 1,278,837 | $ | 393,904 | ||||
| Carrying amount, beginning |
$ | 813,830 | $ | 202,866 | ||||
| Carrying amount, ending |
$ | 202,866 | $ | 66,023 | ||||
|
|
||||||||
| For the nine months ended December 31, | ||||||||
| 2013 | 2014 | |||||||
| Accretable yield, beginning |
$ | 1,260,193 | $ | 820,203 | ||||
| Accretion into interest income(1) |
(561,113 | ) | (453,927 | ) | ||||
| Reclassifications |
24,990 | (100,000 | ) | |||||
|
|
|
|||||||
| Accretable yield, ending |
$ | 724,070 | $ | 266,276 | ||||
|
|
||||||||
| (1) | Includes accretable yield released as a result of settlements with obligors, which is included in interest income |
4 Debt
As of March 31, 2014, and December 31, 2014, the Company’s debt was comprised of the following:
| March 31, 2014 |
December 31, 2014 |
|||||||
| Long Term Debt: |
||||||||
| Bank Borrowings(1) |
$ | 47,986,929 | $ | 54,645,835 | ||||
| Asset Securitization Borrowings: Revolving(1) |
241,492,817 | 212,846,354 | ||||||
| Asset Securitization Borrowings: Term(2) |
95,448,198 | 178,767,250 | ||||||
| Subordinate Debt |
33,000,000 | 33,000,000 | ||||||
|
|
|
|||||||
| Total Long Term Debt |
$ | 417,927,944 | $ | 479,259,439 | ||||
|
|
|
|||||||
| Short Term Debt: |
||||||||
| Asset Securitization Borrowings: Term(2) |
$ | 61,494,002 | $ | 98,072,722 | ||||
| Asset Securitization Borrowings: Revolving, due within one year(1) |
— | — | ||||||
|
|
|
|||||||
| Total Short Term Debt |
$ | 61,494,002 | $ | 98,072,722 | ||||
|
|
||||||||
| (1) | Amounts outstanding amortize in proportion to the underlying contracts starting at the facility renewal date through final maturity. |
| (2) | Amounts outstanding amortize in proportion to the underlying contracts; amortization is based on a projected schedule of contractual payments. |
F-16
Table of Contents
Commercial Credit, Inc. and subsidiaries
Notes to unaudited condensed consolidated financial statements
The weighted average interest rate of the Company’s short term debt as of March 31, 2014 and December 31, 2014, was 1.55% and 1.16%, respectively.
On December 23, 2014, the Company renewed and increased the commitment of one of its Asset Backed Securitization-Revolving facilities from $100,000,000 to $125,000,000 and extended the revolving commitment period to January 2017. Additionally, the Company renewed and increased the commitment of one of its Asset Backed Securitization-Revolving facilities from $100,000,000 to $125,000,000 on December 31, 2014 and extended the revolving commitment period to June 2016.
On May 14, 2014, the Company issued $265,380,000 of fixed-rate asset-backed non-recourse securities. A portion of the proceeds from the issuance were used to pay down amounts outstanding under the Bank Facility and Revolving Securitization borrowings. The term debt, which was issued as asset-backed non-recourse securities, consists of three classes of notes which had a weighted average interest rate of .91% at inception. The final maturity of the latest maturing note is November 2021. The Company retains the right, as an option, to redeem the remaining amount of the notes when the pool of receivables, which serve as security for the notes comprising the debt, has reached 15.0% of its original amount.
At December 31, 2014, finance receivables included $516,753,048 of securitized receivables which are pledged as collateral for the Asset Securitization-Revolving and Asset Securitization-Term facilities. In addition, these facilities had $22,817,127 of restricted cash in collection and reserve account balances that serve as collateral for repayment of the debt on the next scheduled payment date the following month. The total amount of finance receivables which serve as collateral for the debt facilities was $594,972,538 at December 31, 2014. Of this amount of finance receivables, $101,067,864 is scheduled to mature in the next 12 months.
5 Derivatives
The Company accounts for its hedging activities in accordance with Accounting Standards Codification (“ASC”) 815, Derivatives and Hedging (formerly SFAS 133). As a general rule, hedge accounting is permitted where the Company is exposed to a particular risk, such as interest-rate risk, that causes changes in the variability in the expected future cash flows of an existing asset, liability or a forecasted transaction that may affect earnings. Movement in interest rates creates a degree of risk by directly affecting the amount of interest incurred and paid by the Company on its Bank Credit Facilities, which are computed at variable rates, compared with the interest payments earned and received from customer financing and leasing arrangements, which are typically based upon fixed-interest rates. The Company has entered into interest rate swap agreements to manage a portion of this interest rate risk. The derivatives are measured at fair value and were included in accrued interest, taxes and other liabilities in the accompanying unaudited condensed consolidated balance sheet.
At March 31, 2014 and December 31, 2014, a summary of the Company’s derivative hedging instruments, which have all been designated as cash flow hedges, is presented below:
| Fair value | Fair value | |||||||||||||||||||||||
| Notional amount |
Asset derivatives |
Liability derivatives |
Notional amount |
Asset derivatives |
Liability derivatives |
|||||||||||||||||||
| Interest rate swaps |
$ | 169,712,304 | $ | — | $ | 679,661 | $ | 221,604,660 | $ | — | $ | 594,671 | ||||||||||||
Key aspects of achieving ASC 815 hedge accounting are documentation of hedging strategy and hedge effectiveness at the hedge inception and substantiating hedge effectiveness on an ongoing basis. A derivative
F-17
Table of Contents
Commercial Credit, Inc. and subsidiaries
Notes to unaudited condensed consolidated financial statements
must be highly effective in accomplishing the hedge objective of offsetting changes in cash flows of the hedged item for the risk being hedged. Any ineffectiveness in the hedge relationship is recognized in current earnings. The assessment of effectiveness excludes changes in the value of the hedged item that are unrelated to the risks being hedged.
The Company hedges variability of cash flows resulting from forecasted interest rate payments on floating-rate liabilities, with the longest period of time for a forecasted interest rate payment to occur of April 21, 2021. Variable cash flows from those forecasted interest rate payments are converted to fixed-rate cash flows by entering into receive-variable, pay-fixed interest rate swaps. These cash-flow hedging relationships use regression analysis to assess whether the hedging relationships are highly effective at inception and an ongoing basis. Since efforts are made to match the terms of the derivatives to those of the hedged forecasted cash flows as closely as possible, the amount of hedge ineffectiveness is not significant. The effective portion of cash flow hedges included in accumulated other comprehensive loss at March 31, 2014 and December 31, 2014 was $239,713 and $181,362, respectively. Based on the Company’s ineffectiveness assessment, no amounts were recorded in net income related to ineffectiveness for the nine month periods ended December 31, 2013 and 2014. Amounts accumulated in other comprehensive income are recognized in earnings (interest expense) as periodic settlements of the hedging instruments (interest rate swaps) occur and the fair value of the interest rate swaps decline to zero. Net settlements paid by the Company related to such interest rate swaps for the nine month periods ended December 31, 2013 and 2014 were $891,579 and $856,558, respectively. The Company has forecasted net settlement payments for the 12 month period ended December 31, 2015, of approximately $1,060,670 based on the notional amount of the interest rate swaps and market rates existing at December 31, 2014.
6 Accumulated other comprehensive loss
Accumulated other comprehensive loss and the related activity for the nine months ended December 31, 2013 and 2014 were comprised of the following:
| For the nine months ended December 31, 2013 | ||||||||||||
| Gains (losses) on cash flow hedges |
Foreign currency translation |
Total | ||||||||||
| Beginning balance |
$ | (753,822 | ) | $ | — | $ | (753,822 | ) | ||||
| Other comprehensive income, net |
||||||||||||
| Foreign currency translation |
— | — | — | |||||||||
| Gains on cash flow hedges |
853,097 | — | 853,097 | |||||||||
|
|
|
|||||||||||
| Other comprehensive income |
853,097 | — | 853,097 | |||||||||
| Less: tax benefit |
(324,177 | ) | (324,177 | ) | ||||||||
|
|
|
|||||||||||
| Other comprehensive income, net |
528,920 | — | 528,920 | |||||||||
|
|
|
|||||||||||
| Ending Balance |
$ | (224,902 | ) | $ | — | $ | (224,902 | ) | ||||
|
|
||||||||||||
F-18
Table of Contents
Commercial Credit, Inc. and subsidiaries
Notes to unaudited condensed consolidated financial statements
| For the nine months ended December 31, 2014 | ||||||||||||
| Gains (losses) on cash flow hedges |
Foreign currency translation |
Total | ||||||||||
| Beginning balance |
$ | (239,713 | ) | $ | — | $ | (239,713 | ) | ||||
| Other comprehensive income, net |
||||||||||||
| Foreign currency translation |
— | (229,680 | ) | (229,680 | ) | |||||||
| Gains on cash flow hedges |
84,990 | — | 84,990 | |||||||||
|
|
|
|||||||||||
| Other comprehensive income (loss) |
84,990 | (229,680 | ) | (144,690 | ) | |||||||
| Less: tax benefit |
(26,639 | ) | — | (26,639 | ) | |||||||
|
|
|
|||||||||||
| Other comprehensive income (loss), net |
58,351 | (229,680 | ) | (171,329 | ) | |||||||
|
|
|
|||||||||||
| Ending Balance |
$ | (181,362 | ) | $ | (229,680 | ) | $ | (411,042 | ) | |||
|
|
||||||||||||
7 Other assets
As of March 31, 2014, and December 31, 2014, the amounts shown in other assets were comprised of the following components:
| March 31, 2014 |
December 31, 2014 |
|||||||
| Repossessed assets |
$ | 5,942,062 | $ | 3,231,016 | ||||
| Debt issuance costs, net |
2,468,845 | 2,688,147 | ||||||
| Other |
1,384,737 | 1,929,643 | ||||||
|
|
|
|||||||
| Total |
$ | 9,795,644 | $ | 7,848,806 | ||||
|
|
||||||||
The Company repossessed assets to satisfy $5,566,308 and $6,886,677 of finance receivables for the nine months ended December 31, 2013 and 2014, respectively.
8 Shareholders’ equity
Series 1 and series 2 preferred stock
As of December 31, 2014, the Company held two classes of convertible preferred stock, the terms of which grant the holder both voting rights and participation rights to receive nonforfeitable dividends at the same per share rate as common shareholders. Each series 1 and series 2 preferred shareholder is entitled to the number of votes equal to the number of shares of common stock into which such holder’s shares are convertible. Each share of series 2 preferred stock (“Series 2”) and series 1 preferred stock (“Series 1”) is convertible into shares of the Company’s common stock at any time at the option of the holder and automatically convert to common stock in the event of an initial public offering.
In the event of any liquidation, dissolution or winding up of the Company, the holders of Series 2 are entitled to receive distributions prior to, and in preference to, any distribution to holders of Series 1 and common shareholders. The holders of Series 1 are entitled to receive distributions prior to, and in preference to, any distribution to common shareholders. Such distributions shall be equal to the greater of $100 per share, subject to certain stock split, dividend and other adjustments or such amount per share as would have been payable had each such series been converted into common stock. In the event Company assets available for liquidation
F-19
Table of Contents
Commercial Credit, Inc. and subsidiaries
Notes to unaudited condensed consolidated financial statements
are not sufficient to pay both preferred and common shareholders the equivalent of $100.00 per share, the Series 2 and Series 1 shareholders would receive payment in full of the $100.00 liquidation value and the remaining assets of the Company would be distributed ratably between the Series 2 shareholders, Series 1 shareholders, and all issued and outstanding common shareholders. In the event that Company assets available for liquidation are sufficient to pay all shareholders the equivalent of not less than $100.00 per share, all shareholders would share ratably in any such distribution.
The following table provides additional conversion feature information for Series 2 and Series 1:
| As of December 31, 2014 | ||||||||||||||||
| Preferred stock |
Number of shares |
Amount | Conversion ratio per common share: holder’s election |
Liquidation value per share |
||||||||||||
| Series 2 |
574,551 | $ | 51,066,434 | 1 to 1 | $ | 100.00 | ||||||||||
| Series 1 |
72,306 | 96,273 | 1 to 1 | $ | 100.00 | |||||||||||
|
|
|
|||||||||||||||
| Shares outstanding |
646,857 | $ | 51,162,707 | |||||||||||||
|
|
||||||||||||||||
On September 18, 2013, the Company re-purchased 5,069 preferred shares of Series 2 and 9,284 preferred shares of Series 1 from a related party using the value of the most recent sale of new shares in each class as a basis for the then market value. The redemption price of $1,725,000 exceeded the aggregate carrying value of the re-purchased shares, which was $462,897 at the time of the repurchase. The difference of $1,262,103 was recognized within retained earnings in the accompanying unaudited condensed consolidated balance sheet as of December 31, 2013.
Common stock
As of December 31, 2014, the Company had issued 2,176 shares of common stock. The voting, dividend and liquidation rights of the holders of the Company’s common stock are junior to the rights, powers, and preferences of Series 2 and Series 1 preferred stock.
Formation of Commercial Credit Inc.
Commercial Credit, Inc. (“CCI”) was formed for purposes of creating a new holding company structure in which the Company would be a direct, wholly-owned subsidiary of CCI (the “Reorganization”). In order to implement the Reorganization, CCI entered into a Contribution Agreement, dated December 12, 2014 (the “Contribution Agreement”) with each of the Company’s stockholders pursuant to which each stockholder contributed all of its shares of the Company’s capital stock to CCI in exchange for an equal number of the corresponding class or series of CCI capital stock.
CCI’s capital structure, governance arrangements, stockholder arrangements and incentive compensation arrangements are substantially similar to those that were in effect with respect to the Company prior to the Reorganization. The Amended and Restated Certificate of Incorporation authorizes CCI to issue common stock, par value $0.00001 per share, Series 1 Preferred Stock, par value $0.00001 per share, and Series 2 Preferred Stock, par value $0.00001 per share. The terms of each class and series of CCI’s capital stock are identical to those of the corresponding class or series of the Company’s capital stock. CCI’s bylaws, which were adopted prior to the Reorganization, replicate the Company’s bylaws.
F-20
Table of Contents
Commercial Credit, Inc. and subsidiaries
Notes to unaudited condensed consolidated financial statements
In connection with the Reorganization, CCI also assumed from the Company, all of the Company’s rights and obligations under (i) the Company’s 2012 Equity Incentive Plan (the “2012 Plan”) and (ii) all restricted stock award agreements granted by the Company pursuant to the 2012 Plan. As a result, the terms of any restricted stock award agreements now apply to CCI’s common stock in the same manner and subject to the same terms that such agreements applied to the Company’s common stock prior to the Reorganization.
9 Share-based compensation
The Company recognized $37,534 and $65,334 of share-based compensation expense within compensation and benefits on the Company’s unaudited condensed consolidated income statement for the nine months ended December 31, 2013, and 2014, respectively. The 2012 Plan is a shareholder-approved plan, and was formed on November 7, 2012. Eligible participants include managerial and other key employees, directors and non-employee consultants. As of December 31, 2014, 33,713 restricted shares were granted to employees and 2,176 of those shares were vested. As of December 31, 2014, there are 1,287 shares available for future grants under the 2012 Plan, which has an expiration date of November 8, 2022.
No shares were granted or vested during the nine months ended December 31, 2013, and 2014. Cancellations were 986 and 1,287 shares for the nine months ended December 31, 2013, and 2014, respectively.
Service awards
Compensation expense for service awards is recognized on a straight-line basis over the vesting period, which is generally four or five years for the 2012 Plan, using the fair market value of the Company’s common stock on the date of grant. As of December 31, 2014, there was $300,567 of total unrecognized compensation cost related to service awards. This aggregate unrecognized cost for service awards is expected to be recognized over a weighted-average period of 3.3 years.
Performance awards
The Company’s performance-based restricted stock awards (“Performance Awards”) will vest in their entirety upon the following conditions: i) the occurrence of a liquidating event, a performance condition defined in the 2012 Plan document, ii) return on investment (“ROI”) satisfies an ROI target which ranges from 2.0x for investment periods less than 12 months to 4.0x for investment periods of greater than 72 months, a performance condition defined in the 2012 Plan document, and iii) such event occurs within 15 years after grant. If the liquidating event occurs within 15 years of grant but fails to reach the ROI target, then 25% of the Performance Awards shall vest if the Company’s compound annual growth rate of its finance receivable portfolio equals or exceeds 20% and another 25% of the Performance Awards shall vest if the Company’s cumulative average return on equity equals or exceeds 12.5%.
The Company recognizes expense for these Performance Awards based upon the estimated fair value of the Performance Award on the date of grant and the probability that the performance condition will be achieved. Because a liquidating event, as defined in the 2012 Plan document, is not probable until such an event has been approved and completed, no expense has been recognized for any Performance Awards granted since the 2012 Plan’s inception. As of December 31, 2014, there was $144,950 of total unrecognized compensation cost related to Performance Awards.
F-21
Table of Contents
Commercial Credit, Inc. and subsidiaries
Notes to unaudited condensed consolidated financial statements
10 Earnings per common share
The Company has issued a number of series of convertible preferred stock and unvested restricted common stock, which convey voting rights and the right to receive non-forfeitable cash dividends to the shareholder in the event the Company elects to distribute dividends. Accordingly, the Company’s convertible preferred and unvested restricted common stock shares are considered participating securities and the impact of their assumed conversion has been included in the calculation of earnings per common share using the two-class method for allocating income to both common shares and participating securities.
Basic earnings per common share is computed by dividing net income available to common stockholders, after being reduced by any dividend distributions, by the weighted average number of common shares outstanding for the period.
On May 10, 2012, pursuant to the Recapitalization, all then-outstanding shares of common stock were converted into Series 1 preferred stock. No shares of common stock were outstanding immediately after the completion of the Recapitalization and no shares of common stock were outstanding during the nine month period ended December 31, 2013. Therefore, the Company calculated earnings per share for this period based upon the weighted average shares outstanding for its participating securities, which consisted of convertible preferred stock and unvested restricted stock awards. The table below shows the calculation of earnings per participating share for the nine months ended December 31, 2013, which was also impacted by a distribution to a preferred shareholder during the same period:
| For the nine months ended December 31, 2013 |
||||
| Earnings per Participating Share |
||||
| Net income |
$ | 6,558,571 | ||
| Less distribution to preferred shareholder |
(1,262,103 | ) | ||
|
|
|
|||
| Income available to participating security shareholders |
5,296,468 | |||
|
|
|
|||
| Income allocated to participating security shareholders |
||||
| Convertible preferred stock Series 1 and 2 |
$ | 5,122,204 | ||
| Unvested restricted common stock |
174,264 | |||
|
|
|
|||
| Income allocated to participating securities |
$ | 5,296,468 | ||
|
|
|
|||
| Weighted average shares allocated to participating securities |
||||
| Convertible preferred stock Series 1 and 2 |
655,782 | |||
| Unvested restricted common stock |
22,311 | |||
|
|
|
|||
| Weighted average participating shares outstanding |
678,093 | |||
|
|
|
|||
| Basic earnings per participating share |
$ | 7.81 | ||
|
|
|
|||
| Diluted earnings per participating share |
$ | 7.81 | ||
|
|
||||
F-22
Table of Contents
Commercial Credit, Inc. and subsidiaries
Notes to unaudited condensed consolidated financial statements
For the nine months ended December 31, 2014, earnings per share was based upon the weighted average common share outstanding during the period. The following table provides a reconciliation of the net income and share amounts used in computing basic earnings per common share for the nine months ended December 31, 2014:
| For the nine months ended December 31, 2014 |
||||
| Earnings per Common Share |
||||
| Net income |
$ | 9,029,341 | ||
| Less income allocated to participating securities: |
||||
| Convertible preferred stock |
(8,572,802 | ) | ||
| Unvested restricted common stock |
(427,698 | ) | ||
|
|
|
|||
| Net income available to common shares |
$ | 28,841 | ||
|
|
|
|||
| Weighted average common shares and participating securities outstanding |
681,305 | |||
| Less shares allocated to participating securities: |
||||
| Convertible preferred stock |
(646,857 | ) | ||
| Unvested restricted common stock |
(32,272 | ) | ||
|
|
|
|||
| Weighted average common shares outstanding |
2,176 | |||
|
|
|
|||
| Basic earnings per common share |
$ | 13.25 | ||
|
|
|
|||
| Diluted earnings per common share |
$ | 13.25 | ||
|
|
||||
11 Fair value
The FASB establishes a fair value hierarchy for those instruments measured at fair value that distinguishes between assumptions based on market data (observable inputs) and the Company’s own assumptions (unobservable inputs). The hierarchy consists of three levels:
| Level 1 |
— |
Quoted market prices in active markets for identical assets or liabilities; | ||
| Level 2 |
— |
Inputs other than Level 1 inputs that are either directly or indirectly observable; and | ||
| Level 3 |
— |
Unobservable inputs developed using estimates and assumptions developed by the Company, which reflect those that a market participant would use. | ||
The following table presents the fair values of the Company’s financial assets and liabilities measured on a recurring and nonrecurring basis:
| As of March 31, 2014 | ||||||||||||||||
| Level 1 | Level 2 | Level 3 | Total | |||||||||||||
| Recurring basis: |
||||||||||||||||
| Derivative liabilities |
||||||||||||||||
| Interest rate swaps |
$ | — | $ | 679,661 | $ | — | $ | 679,661 | ||||||||
|
|
|
|||||||||||||||
| Total liabilities |
$ | — | $ | 679,661 | $ | — | $ | 679,661 | ||||||||
|
|
||||||||||||||||
F-23
Table of Contents
Commercial Credit, Inc. and subsidiaries
Notes to unaudited condensed consolidated financial statements
| Level 1 | Level 2 | Level 3 | Total | |||||||||||||
| Nonrecurring basis: |
||||||||||||||||
| Cash and cash equivalents |
$ | 990,656 | $ | — | $ | — | $ | 990,656 | ||||||||
| Restricted cash |
36,526,866 | — | — | 36,526,866 | ||||||||||||
| Finance receivables |
— | — | 501,042,435 | 501,042,435 | ||||||||||||
| Repossessed assets |
— | — | 5,942,062 | 5,942,062 | ||||||||||||
|
|
|
|||||||||||||||
| Total assets |
$ | 37,517,522 | $ | — | $ | 506,984,497 | $ | 544,502,019 | ||||||||
|
|
|
|||||||||||||||
| Long-term borrowings |
$ | — | $ | — | $ | 417,927,944 | $ | 417,927,944 | ||||||||
| Short-term borrowings |
— | — | 61,494,002 | 61,494,002 | ||||||||||||
|
|
|
|||||||||||||||
| Total liabilities |
$ | — | $ | — | $ | 479,421,946 | $ | 479,421,946 | ||||||||
|
|
||||||||||||||||
| As of December 31, 2014 | ||||||||||||||||
| Level 1 | Level 2 | Level 3 | Total | |||||||||||||
| Recurring basis: |
||||||||||||||||
| Derivative liabilities |
||||||||||||||||
| Interest rate swaps |
$ | — | $ | 594,671 | $ | — | $ | 594,671 | ||||||||
|
|
|
|||||||||||||||
| Total liabilities |
$ | — | $ | 594,671 | $ | — | $ | 594,671 | ||||||||
|
|
||||||||||||||||
| Level 1 | Level 2 | Level 3 | Total | |||||||||||||
| Nonrecurring basis: |
||||||||||||||||
| Cash and cash equivalents |
$ | 4,023,702 | $ | — | $ | — | $ | 4,023,702 | ||||||||
| Restricted cash |
33,294,034 | — | — | 33,294,034 | ||||||||||||
| Finance receivables |
— | — | 611,466,930 | 611,466,930 | ||||||||||||
| Repossessed assets |
— | — | 3,231,016 | 3,231,016 | ||||||||||||
|
|
|
|||||||||||||||
| Total assets |
$ | 37,317,736 | $ | — | $ | 614,697,946 | $ | 652,015,682 | ||||||||
|
|
|
|||||||||||||||
| Long-term borrowings |
$ | — | $ | — | $ | 479,259,439 | $ | 479,259,439 | ||||||||
| Short-term borrowings |
— | — | 98,072,722 | 98,072,722 | ||||||||||||
|
|
|
|||||||||||||||
| Total liabilities |
$ | — | $ | — | $ | 577,332,161 | $ | 577,332,161 | ||||||||
|
|
||||||||||||||||
Cash and cash equivalents and restricted cash. The carrying values of cash equivalents and restricted cash approximate fair value due to their short-term maturities.
Finance receivables. The fair value of finance receivables deemed collectible has been estimated using the present value of expected future cash flows, discounted at an interest rate giving consideration to estimated prepayment risk and credit loss factors. Finance receivables deemed to be impaired are recorded at fair value based on the estimated value of underlying collateral. The estimated fair value of the Company’s entire finance receivable portfolio as of March 31, 2014 and December 31, 2014 was not materially different than the carrying amount. The methods and assumptions used to determine the estimated fair value of the Company’s finance receivables are not based on the exit price concept of fair value required under ASC Topic 820, Fair Value Measurement.
F-24
Table of Contents
Commercial Credit, Inc. and subsidiaries
Notes to unaudited condensed consolidated financial statements
Repossessed assets. As of March 31, 2014 and December 31, 2014, the Company measured repossessed assets on a non-recurring basis using Level 3 inputs. Repossessed assets are initially recorded at fair value based on the estimated liquidation value of the collateral. The Company estimates the fair value of repossessed assets by evaluating their market value and condition based on recent sales of similar equipment, used equipment publications, the Company management’s market knowledge and information from equipment vendors. Assets received to satisfy finance receivables (repossessed equipment, included in other assets) are initially written-down to the Company’s estimate of fair value by a charge to the allowance for credit losses.
Accounts payable. The carrying amount of accounts payable, which is included within accrued interest, taxes and other liabilities in the unaudited condensed consolidated balance sheet, as of March 31, 2014 and December 31, 2014, approximates its fair value.
Derivative liabilities. The Company’s liabilities associated with its interest rate swap agreements are carried at fair value, determined based on the present value of the estimated future cash flows using implied rates in the applicable yield curve as of the valuation date. The following table provides a reconciliation of the opening and ending balances as of March 31, 2014 and December 31, 2014:
| For the nine months ended December 31, |
||||||||
| 2013 | 2014 | |||||||
| Fair Value of Derivative Liabilities |
||||||||
| Beginning Balance |
$ | 1,510,694 | $ | 679,661 | ||||
| Unrealized gain recognized in other comprehensive income: cash flow hedges |
(853,097 | ) | (84,990 | ) | ||||
|
|
|
|
|
|||||
| Ending Balance, December 31 |
$ | 657,597 | $ | 594,671 | ||||
|
|
||||||||
Long and short term borrowings. The fair values of the Company’s borrowings under its senior credit and securitization facilities, as well as subordinated notes payable, are estimated by discounting expected future cash flows using current rates offered for similar financing arrangements with comparable maturities. As of March 31, 2014, and December 31, 2014, the estimated fair values of the Company’s senior credit and securitization facilities, as well as its subordinated notes payable, did not differ materially from their carrying amounts plus accrued interest. Certain of the Company’s senior credit facilities are revolving structures with variable rate interest payments that fluctuate at interest rates that are repriced frequently, at intervals of less than a year, with the then current interest rates. As such, the fair value of this type of facility reflects the principal amount of the loan outstanding at such time.
12 Related Party
Senior Subordinated Notes. As of March 31, 2014 and December 31, 2014, a preferred stock shareholder held $5,000,000 of the Company’s outstanding senior subordinated notes. The amount of interest expense associated with this related party debt was $478,125 and $478,125 for the nine months ended December 31, 2013 and 2014, respectively. As of March 31, 2014 and December 31, 2014, the amount of accrued interest associated with this related party debt was $159,375 and $159,375, respectively, which is included within accrued interest, taxes, and other liabilities on the unaudited condensed consolidated balance sheet.
Management Fee. The Company pays a fee to two preferred shareholders for management and consulting services. For the nine months ended December 31, 2013 and 2014, the amount of this fee charged to operating expenses was $187,500 and $187,500, respectively. As of March 31, 2014 and December 31, 2014, the amount of
F-25
Table of Contents
Commercial Credit, Inc. and subsidiaries
Notes to unaudited condensed consolidated financial statements
accrued expense associated with this related party was $62,500 and $62,500, which is included within accrued interest, taxes, and other liabilities on the unaudited condensed consolidated balance sheet.
13 Subsequent Events
In connection with the preparation of its unaudited condensed consolidated financial statements and notes to unaudited condensed consolidated financial statements as of and for the nine months ended December 31, 2014, the Company has evaluated subsequent events through March 19, 2015, the date the unaudited condensed consolidated financial statements were available to be issued, to determine whether any of these events required recognition or disclosure herein.
Establishment of Asset Backed Securitization - Revolving
The Company established a new Asset Backed Securitization-Revolving facility on February 23, 2015. The total amount of the commitment available under this facility is $100,000,000. The revolving period will be available through August 2016. There were no amounts outstanding under this facility at closing.
F-26
Table of Contents
Index to consolidated financial statements:
F-27
Table of Contents
Report of independent registered public accounting firm
The Board of Directors and Shareholders
Commercial Credit Group Inc.:
We have audited the accompanying consolidated balance sheets of Commercial Credit Group Inc. and subsidiaries as of March 31, 2013 and 2014, and the related consolidated statements of income, comprehensive income, shareholders’ equity, and cash flows for each of the years in the three-year period ended March 31, 2014. These consolidated financial statements are the responsibility of the Company’s management. Our responsibility is to express an opinion on these consolidated financial statements based on our audits.
We conducted our audits in accordance with the standards of the Public Company Accounting Oversight Board (United States). Those standards require that we plan and perform the audit to obtain reasonable assurance about whether the financial statements are free of material misstatement. An audit includes examining, on a test basis, evidence supporting the amounts and disclosures in the financial statements. An audit also includes assessing the accounting principles used and significant estimates made by management, as well as evaluating the overall financial statement presentation. We believe that our audits provide a reasonable basis for our opinion.
In our opinion, the consolidated financial statements referred to above present fairly, in all material respects, the financial position of Commercial Credit Group Inc. and subsidiaries as of March 31, 2013 and 2014, and the results of their operations and their cash flows for each of the years in the three-year period ended March 31, 2014, in conformity with U.S. generally accepted accounting principles.
/s/ KPMG LLP
Charlotte, North Carolina
February 3, 2015
F-28
Table of Contents
Commercial Credit Group Inc. and subsidiaries
Consolidated balance sheets
| As of March 31, | ||||||||
| 2013 | 2014 | |||||||
| ASSETS |
||||||||
| Finance receivables |
$ | 383,901,643 | $ | 501,042,435 | ||||
| Allowance for credit losses |
(5,389,451 | ) | (6,359,337 | ) | ||||
|
|
|
|||||||
| Finance receivables—net |
378,512,192 | 494,683,098 | ||||||
| Cash and cash equivalents |
1,000,000 | 990,656 | ||||||
| Restricted cash |
18,654,508 | 36,526,866 | ||||||
| Other assets |
6,792,009 | 9,795,644 | ||||||
|
|
|
|||||||
| TOTAL ASSETS |
$ | 404,958,709 | $ | 541,996,264 | ||||
|
|
|
|||||||
| LIABILITIES |
||||||||
| Long-term debt ($5,000,000 at March 31, 2013, and $5,000,000 at March 31, 2014, owed to related parties) |
$ | 309,587,344 | $ | 417,927,944 | ||||
| Short-term debt |
41,113,406 | 61,494,002 | ||||||
| Accrued interest, taxes and other liabilities ($62,500 at March 31, 2013, and $221,875 at March 31, 2014 owed to related parties) |
4,375,732 | 4,095,292 | ||||||
| Deferred income taxes |
5,494,206 | 5,888,139 | ||||||
|
|
|
|||||||
| TOTAL LIABILITIES |
360,570,688 | 489,405,377 | ||||||
|
|
|
|||||||
| SHAREHOLDERS’ EQUITY |
||||||||
| Series 1 Preferred stock ($.00001 par value; $8,159,000 and $7,230,600 liquidation value as of March 31, 2013 and 2014, respectively; 125,000 shares authorized; 81,590 and 72,306 shares issued and outstanding as of March 31, 2013, and 2014, respectively) |
108,634 | 96,273 | ||||||
| Series 2 Preferred stock ($.00001 par value; $57,962,000 and $57,455,100 liquidation value as of March 31, 2013, and 2014, respectively; 675,000 shares authorized; 579,620 and 574,551 shares issued and outstanding as of March 31, 2013, and 2014, respectively) |
51,516,970 | 51,066,434 | ||||||
| Common stock ($.00001 par value; 850,000 shares authorized; 0 and 2,176 shares issued and outstanding as of March 31, 2013, and 2014, respectively) |
— | — | ||||||
| Additional paid-in capital |
— | 64,564 | ||||||
| Accumulated other comprehensive loss, net of tax |
(753,822 | ) | (239,713 | ) | ||||
| (Accumulated deficit) retained earnings |
(6,483,761 | ) | 1,603,329 | |||||
|
|
|
|||||||
| TOTAL SHAREHOLDERS’ EQUITY |
44,388,021 | 52,590,887 | ||||||
|
|
|
|||||||
| TOTAL LIABILITIES AND SHAREHOLDERS’ EQUITY |
$ | 404,958,709 | $ | 541,996,264 | ||||
|
|
||||||||
See accompanying notes to consolidated financial statements
F-29
Table of Contents
Commercial Credit Group Inc. and subsidiaries
Consolidated statements of income
| For the fiscal years ended March 31, | ||||||||||||
| 2012 | 2013 | 2014 | ||||||||||
| Finance income |
$ | 33,205,685 | $ | 40,225,959 | $ | 45,806,189 | ||||||
| Interest expense ($375,000, $656,687, and $637,500 in interest incurred to related parties for the years ended March 31, 2012, 2013, and 2014, respectively) |
(15,353,491 | ) | (16,546,311 | ) | (15,586,056 | ) | ||||||
|
|
|
|||||||||||
| Net finance income before provision for credit losses on finance receivables |
17,852,194 | 23,679,648 | 30,220,133 | |||||||||
| Provision for credit losses on finance receivables |
1,975,000 | 1,825,000 | 2,347,730 | |||||||||
|
|
|
|||||||||||
| Net finance income |
15,877,194 | 21,854,648 | 27,872,403 | |||||||||
| Compensation and benefits |
4,348,208 | 6,724,002 | 8,009,008 | |||||||||
| Other operating expenses ($250,000, $243,852, and $250,000 in expenses incurred to related parties for the years ended March 31, 2012, 2013, and 2014, respectively) |
3,543,061 | 3,893,094 | 4,258,716 | |||||||||
|
|
|
|||||||||||
| Total operating expenses |
7,891,269 | 10,617,096 | 12,267,724 | |||||||||
| Income before income taxes |
7,985,925 | 11,237,552 | 15,604,679 | |||||||||
| Provision for income taxes |
3,124,439 | 4,380,104 | 6,255,486 | |||||||||
|
|
|
|||||||||||
| Net income |
$ | 4,861,486 | $ | 6,857,448 | $ | 9,349,193 | ||||||
|
|
|
|||||||||||
| Summary of Earnings per Share |
||||||||||||
| For fiscal year ended March 31, 2012 |
||||||||||||
| Net income |
$ | 4,861,486 | $ | — | $ | — | ||||||
| Income available to common shareholders |
$ | 312,949 | $ | — | $ | — | ||||||
| Basic and diluted earnings per common share |
$ | 1.28 | $ | — | $ | — | ||||||
| For the period April 1, 2012 through May 10, 2012: |
||||||||||||
| Pre-Recapitalization |
||||||||||||
| Net income |
$ | — | $ | 856,204 | $ | — | ||||||
| Distribution to preferred shareholders |
$ | — | $ | (23,681,849 | ) | $ | — | |||||
| Loss available to common shareholders |
$ | — | $ | (22,825,645 | ) | $ | — | |||||
| Basic and diluted loss per common share |
$ | — | $ | (86.74 | ) | $ | — | |||||
| For the period May 11, 2012 through March 31, 2013: |
||||||||||||
| Post-Recapitalization |
||||||||||||
| Net income |
$ | — | $ | 6,001,244 | $ | — | ||||||
| Income available to participating securities |
$ | — | $ | 6,001,244 | $ | — | ||||||
| Basic and diluted earnings per participating share (number of common shares outstanding was zero for the period from May 11, 2012 through March 31, 2013) |
$ | — | $ | 9.05 | $ | — | ||||||
| For fiscal year ended March 31, 2014 |
||||||||||||
| Net income |
$ | — | $ | — | $ | 9,349,193 | ||||||
| Distribution to preferred shareholders |
$ | — | $ | — | $ | (1,262,103 | ) | |||||
| Income available to common shareholders |
$ | — | $ | — | $ | 2,135 | ||||||
| Basic and diluted earnings per common share |
$ | — | $ | — | $ | 11.93 | ||||||
|
|
||||||||||||
See accompanying notes to consolidated financial statements
F-30
Table of Contents
Commercial Credit Group Inc. and subsidiaries
Consolidated statements of comprehensive income
| For the fiscal years ended March 31, | ||||||||||||
| 2012 | 2013 | 2014 | ||||||||||
| Net income |
$ | 4,861,486 | $ | 6,857,448 | $ | 9,349,193 | ||||||
| Other comprehensive income (loss), net of tax |
||||||||||||
| Unrealized (losses) gains of cash flow hedges |
(94,769 | ) | 166,139 | 831,033 | ||||||||
| Less: tax benefit (expense) |
34,993 | (61,851 | ) | (316,924 | ) | |||||||
|
|
|
|||||||||||
| Other comprehensive (loss) income, net |
(59,776 | ) | 104,288 | 514,109 | ||||||||
|
|
|
|||||||||||
| Comprehensive income |
$ | 4,801,710 | $ | 6,961,736 | $ | 9,863,302 | ||||||
|
|
||||||||||||
See accompanying notes to consolidated financial statements
F-31
Table of Contents
Commercial Credit Group Inc. and subsidiaries
Consolidated statements of changes in shareholders’ equity
| Series A-1 through Series F preferred stock |
Series 1 preferred stock |
Series 2 preferred stock |
Common stock | Additional paid-in capital |
Retained earnings/ (Accumulated deficit) |
Accumulated other comprehensive loss |
Total shareholders’ equity |
|||||||||||||||||||||||||||||||||||||||||
| shares | Amount | shares | Amount | shares | Amount | shares | Amount | |||||||||||||||||||||||||||||||||||||||||
| Balance, March 31, 2011 |
299,252 | $ | 26,521,594 | — | $ | — | — | $ | — | 235,050 | $ | 5 | $ | 88,128 | $ | 5,622,972 | $ | (798,334 | ) | $ | 31,434,365 | |||||||||||||||||||||||||||
| Net income |
— | — | — | — | — | — | — | — | — | 4,861,486 | — | 4,861,486 | ||||||||||||||||||||||||||||||||||||
| Change in accumulated other comprehensive loss |
— | — | — | — | — | — | — | — | — | — | (59,776 | ) | (59,776 | ) | ||||||||||||||||||||||||||||||||||
| Share-based compensation |
— | — | — | — | — | — | — | — | 3,344 | — | — | 3,344 | ||||||||||||||||||||||||||||||||||||
| Vesting of restricted common stock |
— | — | — | — | — | — | 21,655 | — | — | — | — | — | ||||||||||||||||||||||||||||||||||||
|
|
|
|||||||||||||||||||||||||||||||||||||||||||||||
| Balance, March 31, 2012 |
299,252 | 26,521,594 | — | — | — | — | 256,705 | 5 | 91,472 | 10,484,458 | (858,110 | ) | 36,239,419 | |||||||||||||||||||||||||||||||||||
| Net income |
— | — | — | — | — | — | — | — | — | 6,857,448 | — | 6,857,448 | ||||||||||||||||||||||||||||||||||||
| Change in accumulated other comprehensive loss |
— | — | — | — | — | — | — | — | — | — | 104,288 | 104,288 | ||||||||||||||||||||||||||||||||||||
| Share-based compensation |
— | — | — | — | — | — | — | — | 17,157 | — | — | 17,157 | ||||||||||||||||||||||||||||||||||||
| Vesting of restricted common stock |
— | — | — | — | — | — | 258,208 | — | — | — | — | — | ||||||||||||||||||||||||||||||||||||
| Issuance of preferred stock |
3,162,338 | 51,000,000 | 8,968 | 896,761 | — | — | — | — | — | 51,896,761 | ||||||||||||||||||||||||||||||||||||||
| Redemption of preferred stock |
(263,611 | ) | (23,650,208 | ) | — | — | — | — | — | — | — | (23,681,849 | ) | — | (47,332,057 | ) | ||||||||||||||||||||||||||||||||
| Exchange of preferred stock |
(3,197,979 | ) | (53,871,386 | ) | 570,652 | 53,871,386 | — | — | — | |||||||||||||||||||||||||||||||||||||||
| Exchange of common stock |
— | — | 81,590 | 108,634 | (505,913 | ) | (5 | ) | (108,629 | ) | — | — | — | |||||||||||||||||||||||||||||||||||
| Redemption of common stock |
— | — | — | — | — | — | (9,000 | ) | — | — | (143,818 | ) | — | (143,818 | ) | |||||||||||||||||||||||||||||||||
| Equity issuance costs (includes $1,456,581 paid to related party) |
— | — | — | — | — | (3,251,177 | ) | — | — | — | — | — | (3,251,177 | ) | ||||||||||||||||||||||||||||||||||
|
|
|
|||||||||||||||||||||||||||||||||||||||||||||||
| Balance, March 31, 2013 |
— | — | 81,590 | 108,634 | 579,620 | 51,516,970 | — | — | — | (6,483,761 | ) | (753,822 | ) | 44,388,021 | ||||||||||||||||||||||||||||||||||
| Net income |
— | — | — | — | — | — | — | — | — | 9,349,193 | — | 9,349,193 | ||||||||||||||||||||||||||||||||||||
| Change in accumulated other comprehensive loss |
— | — | — | — | — | — | — | — | — | — | 514,109 | 514,109 | ||||||||||||||||||||||||||||||||||||
| Share-based compensation |
— | — | — | — | — | — | — | — | 64,564 | — | — | 64,564 | ||||||||||||||||||||||||||||||||||||
| Redemption of preferred stock |
— | — | (9,284 | ) | (12,361 | ) | (5,069 | ) | (450,536 | ) | — | — | — | (1,262,103 | ) | — | (1,725,000 | ) | ||||||||||||||||||||||||||||||
| Vesting of restricted common stock |
— | — | — | — | — | — | 2,176 | — | — | — | — | — | ||||||||||||||||||||||||||||||||||||
|
|
|
|||||||||||||||||||||||||||||||||||||||||||||||
| Balance, March 31, 2014 |
— | — | 72,306 | $ | 96,273 | 574,551 | $ | 51,066,434 | 2,176 | — | $ | 64,564 | $ | 1,603,329 | $ | (239,713 | ) | $ | 52,590,887 | |||||||||||||||||||||||||||||
|
|
||||||||||||||||||||||||||||||||||||||||||||||||
See accompanying notes to consolidated financial statements
F-32
Table of Contents
Commercial Credit Group Inc. and subsidiaries
Consolidated statements of cash flows
| For the fiscal years ended March 31, | ||||||||||||
| 2012 | 2013 | 2014 | ||||||||||
| Cash flows from operating activities: |
||||||||||||
| Net income |
$ | 4,861,486 | $ | 6,857,448 | $ | 9,349,193 | ||||||
| Adjustments to reconcile net income to net cash provided by operating activities: |
||||||||||||
| Provision for credit losses on finance receivables |
1,975,000 | 1,825,000 | 2,347,730 | |||||||||
| Amortization of debt issuance and origination costs |
4,666,765 | 4,447,662 | 5,376,888 | |||||||||
| Depreciation |
154,557 | 165,508 | 274,890 | |||||||||
| Provision for deferred income taxes |
3,783,808 | 473,328 | 77,009 | |||||||||
| Share-based compensation |
3,344 | 17,157 | 64,564 | |||||||||
| Loss (gain) on repossessed assets |
(177,613 | ) | (816 | ) | 48,925 | |||||||
| Changes in operating assets and liabilities: |
||||||||||||
| (Increase) decrease in other assets |
(631,058 | ) | 1,417,541 | (291,252 | ) | |||||||
| Increase in accrued interest, taxes and other liabilities |
332,385 | 550,183 | 544,803 | |||||||||
|
|
|
|||||||||||
| Net cash provided by operating activities |
14,968,674 | 15,753,011 | 17,792,750 | |||||||||
|
|
|
|||||||||||
| Cash flows from investing activities: |
||||||||||||
| Finance receivables originated |
(185,773,261 | ) | (215,703,255 | ) | (303,056,449 | ) | ||||||
| Finance receivables collected |
106,294,609 | 150,062,568 | 182,716,321 | |||||||||
| Proceeds from repossessed asset sales |
2,764,710 | 2,991,692 | 1,409,327 | |||||||||
| Loan/lease origination costs |
(3,409,861 | ) | (2,847,036 | ) | (4,347,378 | ) | ||||||
| Increase in restricted cash |
(4,754,985 | ) | (242,837 | ) | (17,872,358 | ) | ||||||
| Purchase of property and equipment |
(142,192 | ) | (346,388 | ) | (512,402 | ) | ||||||
|
|
|
|||||||||||
| Net cash used in investing activities |
(85,020,980 | ) | (66,085,256 | ) | (141,662,939 | ) | ||||||
|
|
|
|||||||||||
| Cash flows from financing activities: |
||||||||||||
| Advances on senior credit facility |
222,801,817 | 302,826,226 | 164,745,770 | |||||||||
| Payments on senior credit facility |
(214,777,705 | ) | (300,076,738 | ) | (142,519,984 | ) | ||||||
| Advances on subordinated notes payable |
— | 11,000,000 | — | |||||||||
| Advances on securitization facilities |
218,196,138 | 142,236,362 | 445,195,000 | |||||||||
| Payments on securitization facilities |
(153,440,879 | ) | (105,541,934 | ) | (338,699,590 | ) | ||||||
| Proceeds from issuance of preferred stock |
— | 51,896,761 | — | |||||||||
| Redemption of common and preferred stock |
— | (47,475,875 | ) | (1,725,000 | ) | |||||||
| Equity issuance costs ($1,456,581 paid to related party) |
— | (3,251,177 | ) | — | ||||||||
| Debt issuance costs |
(2,727,065 | ) | (1,281,380 | ) | (3,135,351 | ) | ||||||
|
|
|
|||||||||||
| Net cash provided by financing activities |
70,052,306 | 50,332,245 | 123,860,845 | |||||||||
|
|
|
|||||||||||
| Net change in cash and cash equivalents |
— | — | (9,344 | ) | ||||||||
| Cash and cash equivalents, beginning of year |
1,000,000 | 1,000,000 | 1,000,000 | |||||||||
|
|
|
|||||||||||
| Cash and cash equivalents, end of year |
$ | 1,000,000 | $ | 1,000,000 | $ | 990,656 | ||||||
|
|
|
|||||||||||
| Supplemental disclosures of cash flow information: |
||||||||||||
| Income taxes paid |
$ | 1,298,582 | $ | 2,295,794 | $ | 6,078,462 | ||||||
| Interest paid ($375,000, $656,687, and $478,125 paid to related parties in years ended March 31, 2012, 2013, and 2014, respectively) |
$ | 12,497,076 | $ | 13,689,306 | $ | 12,289,485 | ||||||
|
|
||||||||||||
See accompanying notes to consolidated financial statements
F-33
Table of Contents
Commercial Credit Group Inc. and subsidiaries
Notes to consolidated financial statements
1 Description of business
Commercial Credit Group Inc. (the “Company”) was organized as a Delaware corporation on June 1, 2004, and commenced operations in October 2004. The Company offers financing and leasing arrangements of commercial equipment for middle market companies operating throughout the United States and Canada. The Company’s primary area of focus is to provide purchase money and refinance transactions within the construction, fleet transportation and waste industries. Financing transactions primarily are sourced through end-users, equipment vendors and manufacturers with typical transaction sizes ranging from $50,000 to $2,500,000. The Company is headquartered in Charlotte, North Carolina, operates satellite offices in Naperville, Illinois and Buffalo, New York and operates a Canadian office in Hamilton, Ontario.
2 Summary of significant accounting principles
Basis of presentation and principles of consolidation
The consolidated financial statements reflect the consolidated financial position, results of operations and cash flows of the Company and its wholly-owned subsidiaries, which include a Canadian subsidiary and special purpose entities for the Company’s on-balance sheet asset securitization borrowing facilities. All significant intercompany balances and transactions have been eliminated in consolidation. The Company operates as a single reportable segment.
Use of estimates
The preparation of the consolidated financial statements in conformity with accounting principles generally accepted in the U.S. requires management to make estimates and assumptions that affect the reported amounts of assets and liabilities and disclosure of assets and liabilities at the date of the consolidated financial statements and the reported amounts of revenues and expenses during the reporting period. Such estimates and assumptions include the allowance for credit losses on finance receivables, non-performing assets, residual values, income taxes, and share-based compensation. Actual results could differ from those estimates significantly.
Cash and cash equivalents
Cash and cash equivalents include cash and short-term, interest-bearing investments with an original maturity date of 90 days or less.
Restricted cash
Certain financing facilities maintained by the Company require that funds received from obligors be retained in a specific account related to that particular financing facility. Funds in this account are distributed on a monthly basis in accordance with the provisions related to that facility. As such, these amounts are categorized as restricted cash on the Company’s consolidated balance sheet.
F-34
Table of Contents
Commercial Credit Group Inc. and subsidiaries
Notes to consolidated financial statements
Finance receivable
The Company’s finance receivable portfolio is comprised of finance loans and leases. Finance loans consist of installment loans which are made on a discounted basis, whereby interest and other charges are generally added to the amount advanced to arrive at the face amount of the note. The discount, called unearned finance income, is netted against the face of the note on the accompanying balance sheet and amortized into finance income using the effective interest method. Leases, which account for less than 8.0% of the entire portfolio as of March 31, 2014, are accounted for as direct financing leases where total lease payments plus any residual values less unearned interest income is reported in the aggregate as finance receivables. The Company records residual values at the lowest of (i) any stated purchase option, (ii) the present value at the end of the initial lease term of rentals due under any renewal options or (iii) the Company’s projection of the equipment’s fair value at the end of the lease.
Revenue recognition
Finance income includes interest and fee income earned on finance receivables less the amortization of capitalized costs related to the origination of finance receivables, such as allocation of employee compensation and other direct origination costs, involved in loan processing. Finance income is recognized using the effective interest method over the term of the contract.
Recognition of interest income is suspended upon the determination by management that collection of the outstanding receivable is not probable. Receivables may be removed from nonaccrual status and recognition of interest income resumes when collection of any outstanding contractual amounts due is deemed probable. The Company accounts for any interest received on receivables on nonaccrual status on the cost recovery method. As of March 31, 2013, and 2014, there were no nonaccrual status finance receivables still accruing interest. Nonaccrual finance receivables represent the Company’s impaired finance receivables and no amount of interest income for these receivables was recognized within the years ended March 31, 2012, 2013 and 2014.
Allowance for credit losses on finance receivables
The allowance for credit losses on finance receivables is the Company’s estimate of losses inherent in the outstanding receivables. The Company estimates this allowance based upon several quantitative and qualitative factors, including, among others, the amount of total finance receivables, net charge-off experience, impaired and delinquent receivables, the Company’s current assessment of the risks from national and regional economic conditions, the financial condition of customers and guarantors, historical collection experience, and collateral values. Actual losses may vary from current estimates. These estimates are reviewed periodically, and no less frequently than quarterly, and as adjustments become necessary, they are recorded against earnings in the period in which they become known.
The Company will evaluate a finance receivable for impairment at the earliest of the date at which (i) it becomes more than 91 days past due, (ii) when and if it is placed on nonaccrual status, (iii) in the event the underlying customer files a bankruptcy petition, or (iv) management becomes aware of circumstances that would indicate that the loan may not be repaid according to its terms and should be evaluated for potential impairment. In addition, the Company will evaluate the level of any impairment of a finance receivable on a quarterly or more frequent basis until there is no evidence of impairment.
F-35
Table of Contents
Commercial Credit Group Inc. and subsidiaries
Notes to consolidated financial statements
Impaired finance receivables are written down to their estimated fair value, based on the estimated liquidation value of the underlying collateral, and charged against the allowance for credit losses when a loss is considered imminent. Charge-offs subsequently recovered are credited to the allowance for credit losses.
Repossessed assets
All contract receivables whose collateral becomes subject to foreclosure are removed from finance receivables and are reclassified once title clears to the Company as repossessed assets, which are included within other assets in the Company’s consolidated balance sheets. Repossessed assets are initially recorded at fair value based on the estimated liquidation value of the collateral. We estimate the fair value of repossessed assets by evaluating their market value and condition based on recent sales of similar equipment, used equipment publications, our market knowledge and information from equipment vendors. Assets received to satisfy finance receivables (repossessed equipment, included in other assets) are initially written-down to the Company’s estimate of fair value by a charge to the allowance for credit losses. Subsequent to foreclosure, valuations are periodically performed by management and the assets are carried at the lower of the carrying amount or fair value. Any subsequent recoveries or write-downs are recorded in income.
Debt issuance costs
The Company capitalizes debt issuance costs, including legal and other fees, and amortizes them using the effective interest method over the initial term of the facilities. Unamortized debt issuance costs are included within other assets in the Company’s consolidated balance sheets. Amortization of debt issuance costs of $1,914,600, $2,152,040 and $2,376,486, is included within interest expense for the years ended March 31, 2012, 2013, and 2014, respectively.
Property and equipment, net
Property and equipment, net are recorded at cost. Depreciation is computed using the straight-line method over the estimated useful lives of the assets ranging from three to five years. Maintenance and repair costs that do not improve or extend the useful lives of assets are charged to expense as incurred.
As of March 31, 2013 and 2014, respectively, the Company’s property and equipment, net, which are included within other assets in the Company’s consolidated balance sheets, were as follows:
| As of March 31, | ||||||||
| 2013 | 2014 | |||||||
| Equipment and software |
$ | 817,153 | $ | 1,158,739 | ||||
| Furniture and fixtures |
368,054 | 495,777 | ||||||
| Leasehold improvements |
42,660 | 62,441 | ||||||
|
|
|
|||||||
| Property and equipment |
1,227,867 | 1,716,957 | ||||||
| Less: Accumulated depreciation |
(725,441 | ) | (977,019 | ) | ||||
|
|
|
|||||||
| Property and equipment, net |
$ | 502,426 | $ | 739,938 | ||||
|
|
||||||||
For the years ended March 31, 2013, and 2014, depreciation expense totaled $165,508 and $274,890, respectively.
F-36
Table of Contents
Commercial Credit Group Inc. and subsidiaries
Notes to consolidated financial statements
Interest expense
Interest expense is comprised of interest expense on the Company’s outstanding indebtedness, unused facility fees, amortization of capitalized debt issuance costs, payments under hedging agreements and other ancillary fees associated with the maintenance of credit facilities.
Income taxes
Income taxes are accounted for using the asset and liability method. A current liability is recognized for the estimated taxes payable for the current year. Deferred tax assets and liabilities are recognized based on the future tax consequences attributable to differences between financial statement carrying amounts of existing assets and liabilities and their respective tax bases. Deferred tax assets and liabilities are measured using enacted tax rates expected to be applied to taxable income in years in which those temporary differences are expected to be recovered or settled. The effect on deferred tax assets and liabilities of a change in tax rate is recognized in income in the period that includes the enactment date. The Company recognizes the effect of income tax positions only if those positions are more likely than not of being sustained. Changes in recognition or measurement are reflected in the period in which the change in judgment occurs. The Company records interest and penalties related to unrecognized tax benefits within the provision for income taxes.
Derivative financial instruments
The Company manages its exposure to market interest rate movements through the use of interest-rate swap contracts. These derivative financial instruments are carried at fair value in accrued interest, taxes and other liabilities in the accompanying consolidated balance sheet. The Company does not enter into derivative financial instruments for trading or speculative purposes. To qualify as an accounting hedge under the hedge accounting rules, a derivative must be highly effective in offsetting the risk designated as being hedged. The hedge relationship must be formally documented at inception, detailing the particular risk management objective and strategy for the hedge. This includes the item and risk that is being hedged, the derivative that is being used and how effectiveness will be assessed and ineffectiveness measured. Periodically, as required, the Company assesses whether the derivative in each hedging relationship is expected to be and has been highly effective in offsetting changes in cash flows of the hedged item using regression analysis. Hedge ineffectiveness is measured and recorded in current earnings. If a hedge relationship is found to be ineffective, it no longer qualifies as an accounting hedge and hedge accounting would not be applied.
For the Company’s cash flow hedges, which use derivatives to hedge the variability of cash flows related to forecasted interest payments on floating-rate liabilities, the accounting treatment depends on the effectiveness of the hedge. To the extent these derivatives are effective in offsetting the variability of the forecasted cash flows, the effective portion of the changes in the derivatives’ fair values will not be included in current earnings, but is reported in accumulated other comprehensive income (loss) on the consolidated statements of comprehensive income. These changes in fair value will be included in earnings of future periods when the hedged cash flows impact earnings. To the extent these derivatives are not effective, changes in their fair values are immediately included in current earnings.
For those accounting hedge relationships that are terminated or when hedge designations are removed, the hedge accounting treatment described in the paragraphs above is no longer applied. For these cash flow hedges, any changes in fair value of the derivative remain in accumulated other comprehensive loss and are
F-37
Table of Contents
Commercial Credit Group Inc. and subsidiaries
Notes to consolidated financial statements
included in earnings of future periods when the hedged cash flows impact earnings. However, if it becomes probable that the hedged forecasted transaction will not occur, any amounts that remain in accumulated other comprehensive loss are immediately reflected in current earnings. See Note 5 to the Consolidated Financial Statements for a further discussion of the Company’s hedging and derivative activities.
Share-based compensation
The Company estimates the fair value of its restricted stock service awards on the date of grant and recognizes the expense over the vesting period of the award on a straight-line basis. For those restricted stock awards granted with a performance condition, the estimated fair value is estimated on the grant date and the expense is recognized over the vesting period based upon the probability that the performance condition will be achieved. The methodology employed by the Company to estimate the fair value of its restricted stock awards included the aggregation of multiple valuation approaches, using discounted cash flow analysis, public comparables, and specific terms and characteristics of the underlying restricted stock, as well as the liquidation preference associated with the value of the Company’s outstanding preferred stock.
Earnings per share
Basic earnings per share is computed in accordance with the two-class stock method by dividing net income available to common stockholders by the weighted average number of common shares outstanding for the period. The amount of net income available to common shareholders used in the earnings per share calculation is computed by deducting the amount of income allocated to participating securities plus any dividend distributions from net income. Diluted earnings per share is computed based on the weighted average number of common shares outstanding and the dilutive impact of the exercise or conversion of the remaining convertible equity securities, if any, into shares of common stock as if those securities were exercised or converted.
Translation of foreign currencies
The financial statements of the Company’s Canadian subsidiary are translated into U.S. dollars. Revenue and expenses are translated at average current exchange rates during each period and assets and liabilities are translated at the current rate as of the period end date. Net translation exchange gains or losses and the effect of exchange rate changes on intercompany transactions of a long-term nature are recorded in accumulated other comprehensive loss in stockholders’ equity. Gains and losses from translation of assets and liabilities denominated in other than the functional currency of the operation are recorded in income as incurred.
New accounting standards
In August 2014, the FASB issued ASU 2014-13 Consolidation, (“ASU 2014-13”) which states that the fair value of the financial assets of a collateralized financing entity, as determined under GAAP, may differ from the fair value of its financial liabilities even when the financial liabilities have recourse only to the financial assets. Before this update, there was no specific guidance in GAAP on how a reporting entity should account for that difference. The amendments in ASU 2014-13 provide an alternative to measuring the financial assets and the financial liabilities of a consolidated collateralized financing entity to eliminate that difference. When the measurement alternative is not elected for a consolidated collateralized financing entity within the scope of
F-38
Table of Contents
Commercial Credit Group Inc. and subsidiaries
Notes to consolidated financial statements
ASU 2014-13, the amendments clarify that (1) the fair value of the financial assets and/or liabilities of the consolidated collateralized financing entity should be measured using the requirements of ASC 820, Fair Value and (2) any differences in the fair value of the financial assets and/or liabilities of that consolidated collateralized financing entity should be reflected in earnings. This update is effective for fiscal years, and interim periods within those years, beginning after December 15, 2015, which will be April 1, 2016, for the Company. The Company is currently evaluating the impact the changes will have on the presentation of its financial position and results of operations.
In May 2014, the FASB issued ASU No. 2014-09, Revenue from Contracts with Customers (Topic 606), which supersedes the revenue recognition requirements in ASC 605, Revenue Recognition. This ASU is based on the principle that revenue is recognized to depict the transfer of goods or services to customers in an amount that reflects the consideration to which the entity expects to be entitled in exchange for those goods or services. The ASU also requires additional disclosure about the nature, amount, timing and uncertainty of revenue and cash flows arising from customer contracts, including significant judgments and changes in judgments and assets recognized from costs incurred to obtain or fulfill a contract. The effective date will be the first quarter of fiscal year 2018 using one of two retrospective application methods. The Company has not determined the potential effects on the consolidated financial statements.
3 Finance receivables
As of March 31, 2013, and 2014, the Company’s financing and leasing receivables were comprised of the following:
| As of March 31, | ||||||||
| 2013 | 2014 | |||||||
| Finance receivables, including unearned finance income |
$ | 447,862,222 | $ | 580,597,823 | ||||
| Estimated residual value of leased assets |
5,621,777 | 7,734,679 | ||||||
| Unearned finance income |
(72,274,086 | ) | (91,397,808 | ) | ||||
| Funds withheld from account proceeds |
(603,465 | ) | (534,441 | ) | ||||
| Net unamortized fees and costs |
3,295,195 | 4,642,182 | ||||||
|
|
|
|||||||
| Total finance receivables |
$ | 383,901,643 | $ | 501,042,435 | ||||
|
|
||||||||
| As of March 31, | ||||||||
| 2013 | 2014 | |||||||
| Nonaccrual Status—Finance Receivables |
||||||||
| Nonaccrual finance receivables |
$ | 11,372,069 | $ | 16,102,463 | ||||
|
|
|
|||||||
| Average investment in nonaccrual finance receivables |
$ | 9,339,211 | $ | 13,737,266 | ||||
|
|
|
|||||||
| Finance receivables past due 90 days or more and still accruing |
$ | 381,531 | $ | 69,944 | ||||
|
|
||||||||
The Company’s financing arrangements typically feature a fixed-interest rate. The portfolio yield was 11.4% and 10.4% for the fiscal years ending March 31, 2013 and 2014, respectively. The Company periodically evaluates the contracts in its portfolio for impairment on an individual basis and records a specific allowance for those receivables that are deemed to be uncollectible.
F-39
Table of Contents
Commercial Credit Group Inc. and subsidiaries
Notes to consolidated financial statements
When assessing a loan for impairment, the Company will consider the customer’s payment status, payment history, the expected potential recovery from underlying collateral in the event the equipment is repossessed and liquidated, as well as any other potential recovery available from other sources of repayment such as additional collateral securing the loan or recovery under any guarantees as may be applicable to each loan according to its individual circumstances.
Summary of impaired finance receivables and specific allowance
| Unpaid contractual principal balance |
Recorded Investment in impaired loans with no specific allowance |
Recorded investment in impaired loans with specific allowance |
Nonaccrued loans (total recorded investment in impaired loans) |
Specific allowance |
Specific allowance as percentage of impaired loans with specific allowance |
|||||||||||||||||||
| March 31, 2013 |
$ | 12,026,541 | $ | 8,646,843 | $ | 2,725,226 | $ | 11,372,069 | $ | 392,000 | 14.4% | |||||||||||||
| March 31, 2014 |
$ | 17,597,243 | $ | 15,120,831 | $ | 981,632 | $ | 16,102,463 | $ | 385,000 | 39.2% | |||||||||||||
|
|
||||||||||||||||||||||||
Summary of allowance for credit losses: specific and general allowances
| As of March 31, | ||||||||
| 2013 | 2014 | |||||||
| Specific allowance for finance receivables individually evaluated for impairment |
$ | 392,000 | $ | 385,000 | ||||
| General allowance for finance receivables collectively evaluated for impairment |
4,997,451 | 5,974,337 | ||||||
|
|
|
|||||||
| Allowance for credit losses for finance receivables |
$ | 5,389,451 | $ | 6,359,337 | ||||
|
|
||||||||
Finance receivables generally require monthly installments over two to seven years. Annual contractual maturities at March 31, 2014 follow:
| Year | Amount | |||
| 2015 |
$ | 203,488,674 | ||
| 2016 |
167,479,233 | |||
| 2017 |
120,432,326 | |||
| 2018 |
64,472,297 | |||
| 2019 |
21,676,708 | |||
| Thereafter |
3,048,585 | |||
|
|
|
|||
| Total |
$ | 580,597,823 | ||
|
|
||||
F-40
Table of Contents
Commercial Credit Group Inc. and subsidiaries
Notes to consolidated financial statements
Credit quality
The Company measures the delinquency of its finance receivables in the aggregate based on the number of days the customer’s oldest receivable is past due. The Company’s aging summary of its entire portfolio is as follows:
| Finance Receivables |
Current | 1 - 30 days Past Due |
31 - 60 days Past Due |
61 - 90 days Past Due |
91 - 120 Days Past Due |
120+ Days Past Due |
||||||||||||||||||||||
| March 31, 2013 |
$ | 383,901,643 | $ | 287,144,896 | $ | 64,542,765 | $ | 20,831,789 | $ | 5,134,164 | $ | 925,664 | $ | 5,322,365 | ||||||||||||||
| March 31, 2014 |
$ | 501,042,435 | $ | 354,557,050 | $ | 100,204,951 | $ | 35,439,399 | $ | 3,490,602 | $ | 4,401,976 | $ | 2,948,457 | ||||||||||||||
|
|
||||||||||||||||||||||||||||
| As of March 31, | ||||||||
| 2013 | 2014 | |||||||
| Collectively evaluated for impairment |
$ | 371,715,744 | $ | 484,737,106 | ||||
| Individually evaluated for impairment |
11,372,069 | 16,102,463 | ||||||
| Loans acquired with deteriorated credit quality |
813,830 | 202,866 | ||||||
|
|
|
|||||||
| Finance receivables |
$ | 383,901,643 | $ | 501,042,435 | ||||
|
|
||||||||
Concentrations of credit risk result when customers have similar economic characteristics that would cause their ability to meet contractual obligations to be affected by changes in economic or other conditions similarly. The Company does not have a significant concentration of credit risk with any customer.
Credit risk associated with finance receivables is concentrated in the following states:
| March 31, 2013 | March 31, 2014 | |||||||||||
| TX | 15 | % | TX | 14 | % | |||||||
| NC | 10 | % | NC | 10 | % | |||||||
| IL | 8 | % | GA | 7 | % | |||||||
| GA | 6 | % | IL | 6 | % | |||||||
| SC | 4 | % | SC | 5 | % | |||||||
| PA | 4 | % | CA | 5 | % | |||||||
| VA | 4 | % | PA | 4 | % | |||||||
| MI | 3 | % | VA | 3 | % | |||||||
| FL | 3 | % | FL | 3 | % | |||||||
| NJ | 3 | % | MI | 2 | % | |||||||
| Remaining states (40) | 40 | % | Remaining states | (40) | 41 | % | ||||||
|
|
||||||||||||
Allowance for credit losses
The Company maintains an allowance for credit losses at an amount sufficient to absorb losses inherent in its finance receivables for both its loan and leasing arrangements combined. The portfolio represents one class, commercial equipment financing, evaluated on a pooled basis, due to its composition of mid-sized balances of homogenous accounts with similar general credit risk characteristics. Impaired finance receivables are written down to their estimated net realizable value, based on the estimated liquidation value of the underlying
F-41
Table of Contents
Commercial Credit Group Inc. and subsidiaries
Notes to consolidated financial statements
collateral. Each impaired loan is assessed regularly to ensure its carrying value is appropriate given current market conditions and the value of the underlying collateral. Impaired finance receivables are charged against the allowance for credit losses when a loss appears imminent with recoveries of previous charge-offs credited to the allowance for credit losses.
The allowance for credit losses is established through provisions for credit losses charged to income. The Company maintains the allowance for credit losses based on a quarterly evaluation of a variety of factors. These factors include, but are not limited to: (i) historical credit loss experience, which includes the most recent three year historical period, and recent trends in that experience; (ii) historical loss discover periods, and (iii) qualitative factors such as changes in the composition of the Company’s finance receivable portfolio, seasonality, economic or business conditions and emerging trends, business practices or policies at the reporting date that are different from the periods used in the quantitative analysis, an evaluation of delinquent and non-performing loans and related collateral values, external factors such as regulatory, legal or competitive matters, interest rates, industry conditions, and used equipment values. Changes in economic conditions, the risk characteristics and composition of the portfolio, bankruptcy laws and other factors could impact the actual and projected net credit losses and the related allowance for credit losses. Actual losses may vary from current estimates.
The activity in the allowance for credit losses is summarized below for the years ended March 31, 2012, 2013, and 2014, respectively:
| For the year ended March 31, | ||||||||||||
| 2012 | 2013 | 2014 | ||||||||||
| Allowance, beginning of year |
$ | 3,540,387 | $ | 4,260,902 | $ | 5,389,451 | ||||||
| Provision |
1,975,000 | 1,825,000 | 2,347,730 | |||||||||
| Charge-offs |
(1,507,838 | ) | (856,131 | ) | (1,443,697 | ) | ||||||
| Recoveries |
253,353 | 159,680 | 65,853 | |||||||||
|
|
|
|||||||||||
| Allowance, end of year |
$ | 4,260,902 | $ | 5,389,451 | $ | 6,359,337 | ||||||
|
|
|
|||||||||||
| Allowance, end of year as a percentage of finance receivables |
1.33% | 1.40% | 1.27% | |||||||||
|
|
|
|||||||||||
| Net charge offs, as a percentage of average receivables |
0.44% | 0.20% | 0.31% | |||||||||
|
|
||||||||||||
Troubled debt restructurings
A troubled debt restructuring (“TDR”) is generally the modification of debt in which a creditor grants a concession it would not otherwise consider to an obligor that is experiencing financial difficulties. These modifications may include a reduction of the stated interest rate, an extension of the maturity dates, a reduction of the face amount of the debt, or a reduction of accrued interest.
For the fiscal years ending March 31, 2012, 2013 and 2014, the Company identified 10, 7 and 12 individual contracts, spread over 5, 5 and 3 obligors as TDRs with aggregate balances of $1,965,524, $1,578,632 and $1,994,162 pre-modification and $1,984,400, $1,581,141 and $1,992,650 post-modification, respectively. The nature of the Company’s receivable modifications qualifying as TDRs at March 31, 2012, 2013 and 2014 were comprised of payment deferrals and interest rate reductions. Payment deferrals result in lower net present value of cash flows, if not accompanied by additional interest or fees. The financial impact of these modifications is not significant given the limited number of such modifications as well as the length of deferral
F-42
Table of Contents
Commercial Credit Group Inc. and subsidiaries
Notes to consolidated financial statements
periods. Interest rate reductions result in lower amounts of interest being charged to the customer. The weighted average change in interest rates for all TDRs occurring during the years ended March 31, 2012, 2013 and 2014 was not significant.
During these same periods, the Company had no commitments to lend additional funds to obligors whose accounts were identified as TDRs. The Company has not experienced any subsequent credit loss on any of the contracts that were identified as TDRs. All of the contracts identified as TDRs have been paid off or are performing satisfactorily and are monitored and treated in accordance with the Company’s credit and collection policy.
Loans classified as TDRs are considered impaired loans. Impaired finance receivables are written down to their estimated net realizable value, based on the estimated liquidation value of the underlying collateral. Each impaired loan is assessed regularly to ensure its carrying value is appropriate given current market conditions and the value of the underlying collateral. Impaired finance receivables are charged against the allowance for credit losses when a loss appears imminent with recoveries of previous charge-offs credited to the allowance for credit losses.
Loans acquired with deteriorated credit quality
The Company acquired certain loans in a prior period which had evidence of credit deterioration since their origination and for which it was probable that at the date of acquisition the Company would not collect all contractually required principal and interest payments. The loans were not significant relative to the size of the Company’s overall loan portfolio and as of March 31, 2014, approximately 85% of the original loan balance has been paid off with minimal charge-offs. The loans were recorded at fair value at the date of acquisition, and the historical allowance for credit losses related to these loans was not carried over to the Company’s balance sheet. The excess of cash flows expected to be collected over the carrying value of these loans is referred to as the accretable yield and is recognized in interest income using an effective yield method over the remaining life of the loan. The accretable yield is affected by several factors including changes in prepayment assumptions which affect the estimated remaining life of the loan, interest income and possibly principal expected to be collected.
F-43
Table of Contents
Commercial Credit Group Inc. and subsidiaries
Notes to consolidated financial statements
The following information for the Company’s loans acquired with deteriorated credit quality is presented for the years ended March 31, 2013, and 2014:
| As of March 31, | ||||||||
| 2013 | 2014 | |||||||
| Outstanding balance, beginning |
$ | 3,340,857 | $ | 2,592,529 | ||||
| Outstanding balance, ending |
$ | 2,592,529 | $ | 1,278,837 | ||||
| Carrying amount, beginning |
$ | 883,727 | $ | 813,830 | ||||
| Carrying amount, ending |
$ | 813,830 | $ | 202,866 | ||||
|
|
||||||||
| For the year ended March 31, | ||||||||
| 2013 | 2014 | |||||||
| Accretable yield, beginning |
$ | 1,788,958 | $ | 1,260,193 | ||||
| Accretion into interest income(1) |
(631,408 | ) | (702,729 | ) | ||||
| Reclassifications |
102,643 | 262,739 | ||||||
|
|
|
|||||||
| Accretable yield, ending |
$ | 1,260,193 | $ | 820,203 | ||||
|
|
||||||||
| (1) | Includes accretable yield released as a result of settlements with obligors, which is included in interest income |
4 Debt
As of March 31, 2013, and 2014, the Company’s debt was comprised of the following:
| As of March 31, | ||||||||
| 2013 | 2014 | |||||||
| Long Term Debt: |
||||||||
| Bank Borrowings(1) |
$ | 25,761,143 | $ | 47,986,929 | ||||
| Asset Securitization Borrowings: Revolving(1) |
209,929,819 | 241,492,817 | ||||||
| Asset Securitization Borrowings: Term(2) |
40,896,382 | 95,448,198 | ||||||
| Subordinate Debt |
33,000,000 | 33,000,000 | ||||||
|
|
|
|||||||
| Total Long Term Debt |
$ | 309,587,344 | $ | 417,927,944 | ||||
|
|
|
|||||||
| Short Term Debt: |
||||||||
| Asset Securitization Borrowings: Term(2) |
$ | 22,750,068 | $ | 61,494,002 | ||||
| Asset Securitization Borrowings: Revolving, due within one year(1) |
18,363,338 | — | ||||||
|
|
|
|||||||
| Total Short Term Debt |
$ | 41,113,406 | $ | 61,494,002 | ||||
|
|
||||||||
| (1) | Amounts outstanding amortize in proportion to the underlying contracts starting at the facility renewal date through final maturity. |
| (2) | Amounts outstanding amortize in proportion to the underlying contracts; amortization is based on a projected schedule of contractual payments. |
The weighted average interest rate of the Company’s short term debt as of March 31, 2013 and 2014, was 2.76% and 1.55%, respectively.
F-44
Table of Contents
Commercial Credit Group Inc. and subsidiaries
Notes to consolidated financial statements
Bank Borrowings:
Bank Borrowings include amounts outstanding under a $50,000,000 revolving full recourse bank credit facility. Amounts on the bank borrowings may be borrowed and repaid up to the facility limit and are subject to a borrowing base and are secured by the finance receivable contracts pledged to that facility. The facility also permits the Company to increase the commitment by an additional $30,000,000 up to a total commitment of $80,000,000, provided that the additional or existing lender(s) advances a sufficient amount that after giving the effect of the increase allows each existing lender to maintain their percentage of revolving loans outstanding under the total commitment. This facility has a renewal date of January 2017, and is followed by a one year amortization period if not renewed. The $47,986,929 outstanding on this facility at March 31, 2014, would amortize on January 2017, with a final maturity of January 2018. Amortization of the amount outstanding would be dependent upon the actual amount outstanding at the beginning of the amortization period and would amortize in proportion to the underlying contracts pledged to the facility.
At March 31, 2014, the interest rate on the revolving facility was 2.40% and the Company incurs a fee on the unused portion. The bank facility contains certain financial covenants which, among other things, require the Company to maintain minimum debt-to-net worth ratios, interest coverage ratios and minimum net worth. In addition, the agreement contains certain restrictions which, among other things, limit the incurrence of additional indebtedness and limitations on the payment of dividends or distributions. As of March 31, 2013 and 2014, the Company was in compliance with these covenants and restrictions. The bank facility was put in place on January 8, 2014, as a replacement for a previously existing facility which provided $40,000,000 in revolving capacity and had an interest rate of 3.04% at March 31, 2013.
Asset securitization borrowings—revolving:
These facilities are structured to account for securitization proceeds as secured debt and not as sales of receivables. Therefore, the Company does not record gains on sales of securitized receivables and the Company’s debt and the receivables remain on the balance sheet.
Asset Securitization Borrowings-Revolving includes amounts outstanding on three revolving non-recourse credit facilities provided by three different lenders to three wholly-owned, consolidated special purpose entities. The facilities provide for committed revolving financing during their revolving period and the Company can convert them to amortizing debt if they are not renewed. The outstanding balance at the time of amortization would be repaid monthly through collection of the underlying receivables for a specific period, and then any remaining amount outstanding would be due. Finance receivable contracts transferred to the special purposes entities serve as security for the loans as determined and subject to a borrowing base. The Company acts as servicer on these contracts and is the primary beneficiary for these special purpose entities, which were designed and created for the Company’s financing operations. The total amount committed on these three facilities was $330,000,000 at March 31, 2014. The interest rate on one facility is based on commercial paper issued, one is based on 30-day LIBOR rates and one is based on 90-day LIBOR rates. The interest rates on these facilities ranged from 1.97% to 3.03% as of March 31, 2013, and 1.48% to 1.95% as of March 31, 2014. The Company incurs a fee on the unused portion. Each facility provides for eighteen month revolving periods which are followed by an amortization period, if not renewed, which range from one to three years depending on the facility.
As of March 31, 2014, the renewal dates for the revolving periods are staggered and range from September 2014, to December 2015. Final maturity dates are also staggered for each facility. Of the total $241,492,817
F-45
Table of Contents
Commercial Credit Group Inc. and subsidiaries
Notes to consolidated financial statements
outstanding on these facilities, $97,133,847 would amortize as of March 2015 with a final maturity of March 2017, $83,238,970 would amortize as of December 2015, with a final maturity of December 2016, and $61,120,000 would amortize as of July 2015, with a final maturity of July 2018. Amortization of each of these amounts would be dependent upon the actual amounts outstanding at the beginning of the amortization period and would amortize in proportion to the underlying finance receivable contracts included in the facility.
At March 31, 2014, finance receivables included $263,220,211 of securitized receivables which are pledged as collateral for these facilities. In addition, the facilities had $11,789,546 of restricted cash in collection account balances that served as collateral for repayment of the debt on the next scheduled payment date the following month. The finance receivables that are contributed to this facility and serve as collateral for the loans outstanding are subject to a specific security interest and are restricted to that facility. As such, these finance receivables may not be re-sold or transferred without the lender’s permission and all collections received on these finance receivables must be directed to a specific account for each facility.
One of the facilities included here, totaling $100,000,000 was put in place on January 8, 2014 as a replacement for a previously existing facility totaling $100,000,000, which was terminated by the Company. In addition, on February 11, 2014, one of the facilities was increased from $100,000,000 to $130,000,000 and the revolving period of this facility was renewed and extended on March 31, 2014.
The Asset Securitization Borrowings-Revolving facilities contain certain financial covenants and servicing rights, including interest coverage, total senior debt to capital, and minimum net worth, and performance measures, including pool performance characteristics related to delinquency and losses experienced on the finance receivables included in the specific facility. In addition, these facilities include certain net loss and delinquency limits on each individual pool of finance receivables contract performance. If the limits are exceeded, the facilities terminate and the amounts outstanding are repaid as the underlying finance receivable contracts amortize on a monthly basis. The Company was in compliance with all of these covenants as of March 31, 2013 and 2014.
Asset securitization borrowing—term:
These facilities are structured to account for securitization proceeds as secured debt and not as sales of receivables. Therefore, the Company does not record gains on sales of securitized receivables and the Company’s debt and the receivables remain on the balance sheet.
Asset Securitization Borrowings-Term includes amounts outstanding on two term asset-backed securities. The facilities are non-recourse to the Company, which acts as servicer on the contracts included in these facilities. The principal amount on these facilities amortizes in relation to the amortization of the contracts, which serve as security for the notes. Of the total $156,942,200 of term asset-backed security amounts outstanding at March 31, 2014, $31,268,538 has a final maturity of December 2019, and $125,673,662 has a final maturity of August 2020.
The weighted average interest rates on the notes for the 2012-1 and 2013-1 facilities are fixed and were 3.13% and 1.56%, respectively, as of March 31, 2014. The fixed rates on the notes in these facilities do not change from period to period. On April 17, 2013 the Company issued $194,470,000 of term asset-backed securities which have amortized throughout the fiscal year and the remaining amounts outstanding on the notes are included in the total amounts shown as of March 31, 2014. These facilities contain certain financial covenants that govern the servicing rights of the Company and performance measures that govern the repayment priority of the cash flows collected thereunder. The Company was in compliance with those requirements as of March 31, 2013 and 2014.
F-46
Table of Contents
Commercial Credit Group Inc. and subsidiaries
Notes to consolidated financial statements
At March 31, 2014, finance receivables included $154,304,436 of securitized receivables which are pledged as collateral for these facilities. In addition, the facilities had $14,519,727 of restricted cash in collection and reserve account balances that serve as collateral for repayment of the debt on the next scheduled payment date the following month. The finance receivables that are contributed to this facility and serve as collateral for the notes outstanding under an indenture and are subject to a specific security interest and are restricted to that facility. As such, these finance receivables may not be re-sold or transferred and all collections received on these finance receivables must be directed to a specific account for each facility.
Senior subordinated notes:
Senior Subordinate Notes includes the amount outstanding on subordinate indebtedness. The notes are unsecured, mature in May 2018 and have an interest rate of 12.75%. A related party holds $5,000,000 of the notes. The senior notes contain certain financial covenants which, among other things, require the Company to maintain minimum interest coverage ratios, senior debt to capitalization ratios and portfolio delinquency. The Company was in compliance with the debt covenants as of March 31, 2013 and 2014.
The following table summarizes certain elements of the debt facilities:
| As of March 31, 2014 | Interest rate | Revolving period End |
Final maturity | |||||||||
| Bank borrowings |
2.40% | Jan ’17 | Jan ’18 | |||||||||
| Asset securitization borrowings: revolving |
1.48%-1.95% | Mar ’15 - Jul ’15 | Dec ’16 - Jul ’18 | |||||||||
| Asset securitization borrowings: term |
1.0%-3.13% | N/A | Dec ’19 - Aug ’20 | |||||||||
| Senior subordinate notes |
12.75% | N/A | May ’18 | |||||||||
|
|
||||||||||||
Long term debt at March 31, 2014 expires or matures as follows:
| As of March 31, 2014 fiscal |
2016 | 2017 | 2018 | 2019 | 2020 | Total | ||||||||||||||||||
| Long Term Debt Maturity |
$ | 105,785,304 | $ | 189,308,019 | $ | 107,534,483 | $ | 16,103,402 | $ | 836,517 | $ | 419,567,725 | ||||||||||||
|
|
||||||||||||||||||||||||
The following table shows the scheduled repayment of the contracts which serve as collateral for the facilities:
| Contractual maturities as of March 31, 2014 |
Total | |||||||||||||||||||
| 2015 | 2016-2017 | 2018-2019 | Thereafter | |||||||||||||||||
| Finance receivables subject to debt facilities |
$ | 149,260,001 | $ | 240,224,559 | $ | 77,924,085 | $ | 3,595,274 | $ | 471,003,919 | ||||||||||
|
|
||||||||||||||||||||
5 Derivatives
The Company accounts for its hedging activities in accordance with ASC 815, Derivatives and Hedging (formerly SFAS 133). As a general rule, hedge accounting is permitted where the Company is exposed to a particular risk, such as interest-rate risk, that causes changes in the variability in the expected future cash flows of an existing asset, liability or a forecasted transaction that may affect earnings. Movement in interest rates creates a degree of risk by directly affecting the amount of interest incurred and paid by the Company on its Bank Credit Facilities,
F-47
Table of Contents
Commercial Credit Group Inc. and subsidiaries
Notes to consolidated financial statements
which are computed at variable rates, compared with the interest payments earned and received from customer financing and leasing arrangements, which are typically based upon fixed-interest rates. The Company has entered into interest rate swap agreements to manage a portion of this interest rate risk. The derivatives are measured at fair value and were included in accrued interest, taxes and other liabilities in the accompanying consolidated balance sheet. At March 31, 2013 and 2014, a summary of the Company’s derivative hedging instruments, which have all been designated as cash flow hedges, is presented below:
| March 31, 2013 | March 31, 2014 | |||||||||||||||||||||||
| Notional amount |
Fair value | Notional amount |
Fair value | |||||||||||||||||||||
| Asset derivatives |
Liability derivatives |
Asset derivatives |
Liability derivatives |
|||||||||||||||||||||
| Interest rate swaps |
$ | 152,880,812 | $ | — | $ | 1,510,694 | $ | 169,712,304 | $ | — | $ | 679,661 | ||||||||||||
|
|
||||||||||||||||||||||||
Key aspects of achieving ASC 815 hedge accounting are documentation of hedging strategy and hedge effectiveness at the hedge inception and substantiating hedge effectiveness on an ongoing basis. A derivative must be highly effective in accomplishing the hedge objective of offsetting changes in cash flows of the hedged item for the risk being hedged. Any ineffectiveness in the hedge relationship is recognized in current earnings. The assessment of effectiveness excludes changes in the value of the hedged item that are unrelated to the risks being hedged.
The Company hedges variability of cash flows resulting from forecasted interest rate payments on floating-rate liabilities, with the longest period of time for a forecasted interest rate payment to occur of April 21, 2021. Variable cash flows from those forecasted interest rate payments are converted to fixed-rate cash flows by entering into receive-variable, pay-fixed interest rate swaps. These cash flow hedging relationships use regression analysis to assess whether the hedging relationships are highly effective at inception and on an ongoing basis. Since efforts are made to match the terms of the derivatives to those of the hedged forecasted cash flows as closely as possible, the amount of hedge ineffectiveness is not significant. The effective portion of cash flow hedges included in accumulated other comprehensive loss at March 31, 2013 and 2014 was $753,822 and $239,713, respectively. Based on the Company’s ineffectiveness assessment, no amounts were recorded in net income related to ineffectiveness for the years ended March 31, 2012, 2013, and 2014. Amounts accumulated in other comprehensive income are recognized in earnings (interest expense) as periodic settlements of the hedging instruments (interest rate swaps) occur and the fair value of the interest rate swaps decline to zero. Net settlements paid by the Company related to such interest rate swaps for the years ended March 31, 2012, 2013 and 2014 were $1,771,245, $1,348,248, and $1,126,951, respectively. The Company has forecasted net settlement payments for the 12 month period ended March 31, 2015, of approximately $775,211, based on the notional amount of the interest rate swaps and market rates existing at March 31, 2014.
F-48
Table of Contents
Commercial Credit Group Inc. and subsidiaries
Notes to consolidated financial statements
6 Other assets
As of March 31, 2013, and 2014, the amounts shown in other assets were comprised of the following components:
| As of March 31, | ||||||||
| 2013 | 2014 | |||||||
| Repossessed assets |
$ | 4,231,833 | $ | 5,942,062 | ||||
| Debt issuance costs, net |
1,709,993 | 2,468,845 | ||||||
| Other |
850,183 | 1,384,737 | ||||||
|
|
|
|||||||
| Total |
$ | 6,792,009 | $ | 9,795,644 | ||||
|
|
||||||||
The Company repossessed assets to satisfy $10,792,384, $9,353,334 and $9,220,937 of finance receivables for the years ended March 31, 2012, 2013 and 2014, respectively.
7 Income taxes
The provision for income taxes is based on income recognized for consolidated financial statement purposes and includes the effects of permanent and temporary differences between such income and income recognized for income tax return purposes. The components of income before income tax expense and a reconciliation of the statutory federal income tax expense to the reported income tax expense for the years ended March 31, 2012, 2013, and 2014, are as follows:
| For the year ended March 31, | ||||||||||||
| 2012 | 2013 | 2014 | ||||||||||
| Income (loss) before income tax: |
||||||||||||
| U.S. |
$ | 7,985,925 | $ | 11,237,552 | $ | 15,969,318 | ||||||
| International |
— | — | (364,639 | ) | ||||||||
|
|
|
|||||||||||
| Total |
7,985,925 | 11,237,552 | 15,604,679 | |||||||||
|
|
|
|||||||||||
| Income tax expense (benefit): |
||||||||||||
| Current: |
||||||||||||
| U.S. |
(695,375 | ) | 3,132,429 | 5,295,786 | ||||||||
| State, local and foreign |
36,006 | 774,347 | 882,691 | |||||||||
|
|
|
|||||||||||
| Total |
(659,369 | ) | 3,906,776 | 6,178,477 | ||||||||
|
|
|
|||||||||||
| Deferred: |
||||||||||||
| U.S. |
3,359,163 | 357,774 | 50,504 | |||||||||
| State, local and foreign |
424,645 | 115,554 | 26,505 | |||||||||
|
|
|
|||||||||||
| Total |
3,783,808 | 473,328 | 77,009 | |||||||||
|
|
|
|||||||||||
| Provision for income taxes |
$ | 3,124,439 | $ | 4,380,104 | $ | 6,255,486 | ||||||
|
|
|
|||||||||||
| U.S. statutory rate |
34.0% | 34.0% | 34.0% | |||||||||
| Income tax expense at U.S. statutory rate |
$ | 2,715,215 | $ | 3,820,768 | $ | 5,305,591 | ||||||
| State income taxes, net of federal benefit |
304,029 | 587,334 | 600,069 | |||||||||
| Other |
105,195 | (27,998 | ) | 349,826 | ||||||||
|
|
|
|||||||||||
| Provision for income taxes |
$ | 3,124,439 | $ | 4,380,104 | $ | 6,255,486 | ||||||
|
|
|
|||||||||||
| Effective tax rate |
39.1% | 39.0% | 40.1% | |||||||||
|
|
||||||||||||
F-49
Table of Contents
Commercial Credit Group Inc. and subsidiaries
Notes to consolidated financial statements
The significant components of the Company’s deferred tax assets and liabilities are as follows:
| As of March 31, | ||||||||
| 2013 | 2014 | |||||||
| Deferred tax assets |
||||||||
| Allowance for credit losses |
$ | 2,006,438 | $ | 2,425,207 | ||||
| Unrealized net loss on cash flow hedges in accumulated other comprehensive loss |
562,416 | 259,197 | ||||||
| Net operating loss carryforward |
— | 91,583 | ||||||
| Other |
277,746 | 237,019 | ||||||
|
|
|
|||||||
| Total deferred tax assets |
2,846,600 | 3,013,006 | ||||||
|
|
|
|||||||
| Deferred tax liabilities |
||||||||
| Financing leases |
(6,940,661 | ) | (6,903,922 | ) | ||||
| Origination costs |
(1,226,767 | ) | (1,766,522 | ) | ||||
| Other |
(173,378 | ) | (230,701 | ) | ||||
|
|
|
|||||||
| Total deferred tax liabilities |
(8,340,806 | ) | (8,901,145 | ) | ||||
|
|
|
|||||||
| Net deferred tax liabilities |
$ | (5,494,206 | ) | $ | (5,888,139 | ) | ||
|
|
||||||||
Included in the Company’s deferred tax assets are tax benefits related to net operating loss carry forwards attributable to our foreign operations. At March 31, 2014, we had $364,639 of net operating losses that are available to offset future taxable income through 2034. Management believes that it is more likely than not that the results of future operations will generate sufficient taxable income to realize all deferred tax assets.
The following table summarizes the activity related to the Company’s unrecognized tax benefits as of March 31, 2013 and 2014:
| For the year ended March 31, |
||||||||
| 2013 | 2014 | |||||||
| Beginning balance |
$ | 144,232 | $ | 111,597 | ||||
| Decreases related to lapse in statute of limitations |
(32,635 | ) | (24,375 | ) | ||||
| Increases related to tax positions taken in the current period |
— | 75,919 | ||||||
|
|
|
|||||||
| Ending balance |
$ | 111,597 | $ | 163,141 | ||||
|
|
||||||||
If recognized, $3,615 of unrecognized tax benefits would reduce the Company’s effective tax rate in future periods. Management determined it is reasonably possible that certain unrecognized tax benefits as of March 31, 2014, will decrease by approximately $3,300 during the subsequent 12 months due to the expiration of statutes of limitations. Based on management analysis, the Company does not believe any remaining unrecognized tax liabilities will significantly change in the next fiscal year.
The Company accrues and recognizes potential interest and penalties within the provision for income taxes where, under relevant tax law, interest and penalties would be assessed if the uncertain tax position ultimately were not sustained. As of March 31, 2013 and 2014, the Company has recorded a liability for potential interest and penalties of $10,503 and $10,946, respectively. The amount of interest and penalties recognized within the consolidated income statements for the years ended March 31, 2012, 2013 and 2014 was $5,051, $3,525 and $2,883, respectively.
F-50
Table of Contents
Commercial Credit Group Inc. and subsidiaries
Notes to consolidated financial statements
As of March 31, 2014, the Company’s open tax years include fiscal 2010 through 2014. As of March 31, 2013 and 2014, the Company recorded $44,023 and $146,755, respectively, as an income taxes payable, which is included in accrued interest, taxes and other liabilities in the accompanying consolidated balance sheets.
8 Commitments and contingencies
The Company is involved, from time to time, in litigation and proceedings arising out of the ordinary course of business. Legal costs for services rendered in the course of these proceedings are charged to expense as they are incurred.
The Company leases office space under non-cancelable, escalating operating leases expiring in fiscal 2017. Due to the escalating provisions inherent in the leases, rent expense is recognized on a straight-line basis over the lease term. The deferred rent liability outstanding as of March 31, 2013, and 2014, was $22,400 and $45,837, respectively, and was included in accrued interest, taxes and other liabilities in the accompanying consolidated balance sheet. Total rent expense charged to operations related to operating leases was $393,755, $410,311 and $498,590 for the years ended March 31, 2012, 2013, and 2014, respectively.
As of March 31, 2014, future minimum lease payments under long-term non-cancelable operating leases are as follows:
| As of March 31, | Amount | |||
| 2015 |
$ | 410,708 | ||
| 2016 |
369,859 | |||
| 2017 |
316,077 | |||
| 2018 |
— | |||
| 2019 |
— | |||
| Thereafter |
— | |||
|
|
|
|||
| Total |
$ | 1,096,644 | ||
|
|
||||
9 Shareholders’ equity
Series 1 and series 2 preferred stock
As of March 31, 2014, the Company held two classes of convertible preferred stock, the terms of which grant the holder both voting rights and participation rights to receive nonforfeitable dividends at the same per share rate as common shareholders. Each series 1 and series 2 preferred shareholder is entitled to the number of votes equal to the number of shares of common stock into which such holder’s shares are convertible. Each share of series 2 preferred stock (“Series 2”) and series 1 preferred stock (“Series 1”) is convertible into shares of the Company’s common stock at any time at the option of the holder and automatically converts to common stock in the event of an initial public offering.
In the event of any liquidation, dissolution or winding up of the Company, the holders of Series 2 are entitled to receive distributions prior to, and in preference to, any distribution to holders of Series 1 and common shareholders. The holders of Series 1 are entitled to receive distributions prior to, and in preference to, any distribution to common shareholders. Such distributions shall be equal to the greater of $100 per share, subject to certain stock split, dividend and other adjustments or such amount per share as would have been payable
F-51
Table of Contents
Commercial Credit Group Inc. and subsidiaries
Notes to consolidated financial statements
had each such series been converted into common stock. In the event Company assets available for liquidation are not sufficient to pay both preferred and common shareholders the equivalent of $100.00 per share, the Series 2 and Series 1 shareholders would receive payment in full of the $100.00 liquidation value and the remaining assets of the Company would be distributed ratably between the Series 2 shareholders, Series 1 shareholders, and all issued and outstanding common shareholders. In the event that Company assets available for liquidation are sufficient to pay all shareholders the equivalent of not less than $100.00 per share, all shareholders would share ratably in any such distribution.
The following table provides additional conversion feature information for Series 2 and Series 1:
| As of March 31, 2014 | ||||||||||||||||
| Preferred stock | Number of shares |
Amount | Conversion ratio per |
Liquidation value per share |
||||||||||||
| Series 2 |
574,551 | $ | 51,066,434 | 1 to 1 | $ | 100.00 | ||||||||||
| Series 1 |
72,306 | 96,273 | 1 to 1 | $ | 100.00 | |||||||||||
|
|
|
|||||||||||||||
| Shares outstanding |
646,857 | $ | 51,162,707 | |||||||||||||
|
|
||||||||||||||||
On September 18, 2013, the Company re-purchased 5,069 preferred shares of Series 2 and 9,284 preferred shares of Series 1 from a related party using the value of the most recent sale of new shares in each class as a basis for the then market value. The redemption price of $1,725,000 exceeded the aggregate carrying value of the re-purchased shares, which was $462,897 at the time of the repurchase. The difference of $1,262,103 was recognized as a distribution to preferred shareholders within (accumulated deficit) retained earnings in the accompanying consolidated balance sheet as of March 31, 2014.
Recapitalization
On May 9, 2012, pursuant to the Sixth Amended and Restated Certificate of Incorporation, the Company authorized the issuance of 3,469,591 shares of preferred stock. On May 10, 2012, pursuant to the Purchase and Redemption agreement, the Company issued 3,162,338 shares of Series F preferred stock, par value $.00001 per share, for a total consideration of $51,000,000. The Company then utilized a portion of the proceeds received from the issuance of Series F preferred stock to redeem certain Series A-1, Series A-2, Series B, Series C, Series D, and Series E held by selling preferred shareholders for $47,332,057.
The following table summarizes the details for the portion of each class of preferred stock that was redeemed:
| Preferred stock | Number of shares redeemed |
Carrying value of shares redeemed |
||||||
| Series F |
— | $ | — | |||||
| Series E |
152,685 | 10,388,687 | ||||||
| Series D |
9,978 | 3,078,132 | ||||||
| Series C |
32,500 | 3,496,148 | ||||||
| Series B |
25,000 | 2,946,775 | ||||||
| Series A-2 |
3,448 | 300,000 | ||||||
| Series A-1 |
40,000 | 3,440,466 | ||||||
|
|
|
|||||||
| 263,611 | $ | 23,650,208 | ||||||
|
|
||||||||
F-52
Table of Contents
Commercial Credit Group Inc. and subsidiaries
Notes to consolidated financial statements
The redemption price exceeded the carrying value of the redeemed shares. The difference between the carrying value and the fair value of the redeemed shares of $23,681,849 is recognized as a distribution to preferred shareholders within (accumulated deficit) retained earnings in the accompanying consolidated balance sheet as of March 31, 2013, and 2014. All redeemed shares of Series A-1, Series A-2, Series B, Series C, Series D, Series E, Series F and common shares were cancelled.
On May 10, 2012, pursuant to the Seventh Amended and Restated Certificate of Incorporation, the Company entered into a recapitalization agreement (the “Recapitalization”) with certain continuing shareholders, and converted all then-outstanding preferred stock classes, including Series A-2, Series D, Series E and Series F into Series 2 preferred stock shares according to their conversion rates. The conversion ratios utilized preserved the relative value and proportion of ownership of the Series A-2, Series D, Series E and Series F post Recapitalization.
The following table summarizes the details for the portion of each class of preferred stock that was converted into Series 2 preferred stock shares:
| Preferred stock | Number of shares exchanged |
Carryng value of exchanged shares |
Conversion ratio per share |
Converted number of series 2 shares |
||||||||||||
| Series F |
3,162,338 | $ | 51,000,000 | 0.161273 | 510,000 | |||||||||||
| Series E |
26,373 | 1,794,409 | 1.612731 | 42,533 | ||||||||||||
| Series D |
1,222 | 376,977 | 3.733155 | 4,562 | ||||||||||||
| Series C |
— | — | — | — | ||||||||||||
| Series B |
— | — | — | — | ||||||||||||
| Series A-2 |
8,046 | 700,000 | 1.684963 | 13,557 | ||||||||||||
| Series A-1 |
— | — | — | — | ||||||||||||
|
|
|
|
|
|||||||||||||
| 3,197,979 | $ | 53,871,386 | 570,652 | |||||||||||||
|
|
||||||||||||||||
F-53
Table of Contents
Commercial Credit Group Inc. and subsidiaries
Notes to consolidated financial statements
Prior to Recapitalization
In the event of any liquidation, dissolution or winding up of the Company, the holders of Series E preferred stock were entitled to receive, in addition to a liquidation preference, cumulative dividends at 8% in preference to any dividends declared on Series A-1, Series A-2, Series B, Series C, and Series D preferred stock and common stock. The holders of Series D preferred stock were entitled to receive, in addition to a liquidation preference, dividends in preference to any dividends declared on Series A-1, Series A-2, Series B, and Series C preferred stock and common stock. The holders of Series A-1, Series A-2, Series B, and Series C preferred stock shares were entitled to receive, in addition to a liquidation preference, dividends in preference to any dividends declared on common stock. Prior to the completion of the Recapitalization, the terms of the preferred shares associated with Series A-1, Series A-2, Series B, Series C, Series D, and Series E granted the holder participation rights to receive nonforfeitable dividends according to their relative conversion rates. These preferred shares were convertible at any time, at the option of the holder, into shares of common stock pursuant to the following ratios, subject to certain stock split, stock dividend, and other adjustments:
| Preferred stock | Conversion ratio per common share |
Original issuance price per share |
||||
| Series E |
10.00 to 1 | $ | 72.04 | |||
| Series D |
23.15 to 1 | $ | 312.50 | |||
| Series C |
12.08 to 1 | $ | 120.00 | |||
| Series B |
12.08 to 1 | $ | 120.00 | |||
| Series A-2 |
11.16 to 1 | $ | 87.00 | |||
| Series A-1 |
10.45 to 1 | $ | 100.00 | |||
|
|
||||||
Common stock
As of March 31, 2014, the Company had 2,176 shares of common stock. The voting, dividend and liquidation rights of the holders of the Company’s common stock are junior to the rights, powers, and preferences of Series 2 and Series 1 preferred stock. On May 10, 2012, pursuant to the Recapitalization, certain restricted common shares vested and were either redeemed utilizing proceeds from the issuance of Series F preferred stock or exchanged for Series 1 preferred stock. For further detail regarding these transactions, see the accompanying consolidated statement of changes in shareholders’ equity.
10 Share-based compensation
The Company recognized $3,344, $17,157 and $64,564 of share-based compensation expense within compensation and benefits on the Company’s consolidated income statement for the years ended March 31, 2012, 2013, and 2014, respectively. The Commercial Credit Group Inc. 2012 Equity Incentive Plan (the “2012 Plan”), is a shareholder-approved plan, and was formed on November 7, 2012. Eligible participants include managerial and other key employees, directors and non-employee consultants. For the year ended March 31, 2013, the Company granted 22,748 shares of restricted stock awards at a weighted average grant date fair value per share of $16.24 and for the year ended March 31, 2014, the Company granted 13,238 shares of restricted stock awards at a weighted average grant date fair value per share of $18.23. As of March 31, 2014, there are no shares available for future grants under the 2012 Plan, which has an expiration date of
F-54
Table of Contents
Commercial Credit Group Inc. and subsidiaries
Notes to consolidated financial statements
November 8, 2022. However, the 2012 Plan does allow restricted stock shares that fail to vest be made available for future grants.
The Commercial Credit Group Inc. 2004 Equity Incentive Plan (the “2004 Plan”) was formed on October 1, 2004. As of March 31, 2014, 380,863 restricted shares were granted to employees under the program and as of May 10, 2012, all underlying restricted shares were fully vested. As of March 31, 2014, there are no shares available for future grants under the 2004 Plan, which on May 10, 2012 was terminated in conjunction with the Recapitalization.
The Company’s policy for issuing shares upon the vesting of its restricted stock awards under all of the Company’s plans is to issue new shares of common stock, unless treasury stock is available at the time of vesting.
The methodology employed by the Company to estimate the fair value of its restricted stock awards included the aggregation of multiple valuation approaches, using discounted cash flow analysis, public comparables, and specific terms and characteristics of the underlying restricted stock, as well as the liquidation preference associated with the value of the Company’s outstanding preferred stock.
Service awards
The Company’s service-based restricted stock awards (“Service Awards”) generally vest in equal annual installments over four or five years, and for any unvested awards, expire without vesting if the employee is no longer employed by the Company. The 2012 and 2004 Plans provide for accelerated vesting of the Company’s Service Awards upon a liquidating event or a change in control.
Compensation expense for service awards is recognized on a straight-line basis over the vesting period using the fair market value of the Company’s common stock on the date of grant. As of March 31, 2014, there was $379,967 of total unrecognized compensation cost related to service awards. This aggregate unrecognized cost for service awards is expected to be recognized over a weighted-average period of 4.3 years.
Performance awards
2012 Plan Performance Awards. The Company’s performance-based restricted stock awards (“Performance Awards”) expire without vesting if the employee is no longer employed by the Company. For Performance Awards granted under the 2012 Plan, the awards will vest in their entirety upon the following conditions: i) the occurrence of a liquidating event, a performance condition defined in the 2012 Plan document, ii) return on investment ratio (“ROI”) satisfies an ROI target which ranges from 2.0x for investment periods less than 12 months to 4.0x for investment periods of greater than 72 months, and iii) such event occurs within 15 years after grant. If the liquidating event occurs within 15 years of grant but fails to reach the ROI target range, then 25% of the Performance Awards shall vest if the Company’s compound annual growth rate of its finance receivable portfolio equals or exceeds 20% and another 25% of the Performance Awards shall vest if the Company’s cumulative average return on equity equals or exceeds 12.5%.
The Company recognizes expense for these Performance Awards based upon the estimated fair value of the Performance Award on the date of grant and the probability that the performance condition will be achieved. Because a liquidating event, as defined in the 2012 Plan document, is not probable until such an event has been
F-55
Table of Contents
Commercial Credit Group Inc. and subsidiaries
Notes to consolidated financial statements
approved and completed, no expense has been recognized for any Performance Awards granted since the 2012 Plan’s inception. As of March 31, 2014, there was $150,921 of total unrecognized compensation cost related to Performance Awards.
2004 Plan Performance Awards. For the 2004 Plan, the underlying Performance Awards vested on an accelerated basis in conjunction with a May 10, 2012, liquidating event which satisfied the related performance targets.
Summary of nonvested restricted stock awards
| Service awards | Performance awards | |||||||||||||||
| Number of shares |
Grant date fair value per share |
Number of shares |
Grant date fair value per share |
|||||||||||||
| March 31, 2013 |
11,374 | $ | 23.89 | 11,374 | $ | 8.59 | ||||||||||
| Grants |
6,619 | $ | 27.77 | 6,619 | $ | 8.68 | ||||||||||
| Vestings |
(2,176 | ) | $ | 23.89 | — | $ | — | |||||||||
| Cancellations |
(493 | ) | $ | 23.89 | (493 | ) | $ | 8.59 | ||||||||
|
|
|
|
|
|||||||||||||
| March 31, 2014 |
15,324 | $ | 25.57 | 17,500 | $ | 8.62 | ||||||||||
|
|
||||||||||||||||
11 Earnings per common share
The Company has issued a number of series of convertible preferred stock and unvested restricted common stock awards, which convey voting rights and the right to receive non-forfeitable cash dividends to the shareholder in the event the Company elects to distribute dividends. Accordingly, the Company’s convertible preferred stock and unvested restricted common stock shares are considered participating securities and the impact of their assumed conversion has been included in the calculation of earnings per common share using the two-class method for allocating income to both common shares and participating securities.
Basic earnings per common share is computed by dividing net income available to common stockholders, after being reduced by any dividend distributions, by the weighted average number of common shares outstanding for the period. All of the Company’s potentially dilutive securities are considered participating securities and their impact has been included in the calculation of the Company’s basic earnings per common share.
F-56
Table of Contents
Commercial Credit Group Inc. and subsidiaries
Notes to consolidated financial statements
The following table provides a reconciliation of the net income and share amounts used in computing basic and diluted earnings per common share for the year ended March 31, 2012:
| For the year ended March 31, 2012 | 2012 | |||
| Earnings per Common Share |
||||
| Net income |
$ | 4,861,486 | ||
| Less income allocated to participating securities: |
||||
| Convertible preferred stock |
(4,230,468 | ) | ||
| Unvested restricted common stock |
(318,069 | ) | ||
|
|
|
|||
| Net income available to common shares |
$ | 312,949 | ||
|
|
|
|||
| Weighted average common shares and participating securities outstanding |
793,117 | |||
| Less shares allocated to participating securities: |
||||
| Convertible preferred stock |
(299,252 | ) | ||
| Unvested restricted common stock |
(248,936 | ) | ||
|
|
|
|||
| Weighted average common shares outstanding |
244,929 | |||
|
|
|
|||
| Basic earnings per common share |
$ | 1.28 | ||
|
|
|
|||
| Diluted earnings per common share |
$ | 1.28 | ||
|
|
||||
On May 10, 2012, pursuant to the Recapitalization, all then-outstanding shares of common stock were converted into Series 1 preferred stock. To show the impact of the Recapitalization on earnings per share for the year, the Company calculated earnings per share separately for the 40-day period prior to Recapitalization beginning April 1, 2012 to May 10, 2012 (“pre-Recapitalization”) and the 325-day period after Recapitalization beginning May 11, 2012 to March 31, 2013 (“post-Recapitalization).
For the pre-Recapitalization period, net income used in calculating earnings per share was determined based upon actual earnings for the period including the impact of certain expenses directly related to the Recapitalization, such as the acceleration of the share-based compensation for the unvested shares that were converted pursuant to the Recapitalization. In addition to net income for the period, the earnings per share calculation for the pre-Recapitalization period was impacted by the distribution to preferred shareholders. The table below shows the calculation of earnings per common share for the period April 1, 2012 through May 10, 2012:
| For the period April 1, 2012 through May 10, 2012-pre-recapitalization | Apr 1 - May 10, 2012 |
|||
| Earnings per Common Share |
||||
| Net income |
$ | 856,204 | ||
| Less distribution to preferred shareholders |
(23,681,849 | ) | ||
|
|
|
|||
| Undistributed loss to common shareholders |
$ | (22,825,645 | ) | |
|
|
|
|||
| Weighted average common shares outstanding |
263,160 | |||
| Basic loss per common share: pre-Recapitalization |
$ | (86.74 | ) | |
|
|
|
|||
| Diluted loss per common share: pre-Recapitalization |
$ | (86.74 | ) | |
|
|
||||
F-57
Table of Contents
Commercial Credit Group Inc. and subsidiaries
Notes to consolidated financial statements
For the post-Recapitalization period, earnings per share was determined based upon actual earnings for the period, excluding the impact of certain Recapitalization expenses previously discussed. On May 10, 2012, pursuant to the Recapitalization, all then-outstanding shares of common stock were converted into Series 1 preferred stock. No shares of common stock were outstanding immediately after the completion of the Recapitalization and no shares of common stock were outstanding during the post-Recapitalization period ended March 31, 2013. Therefore, the Company calculated earnings per share for the post-Recapitalization period based upon the weighted average shares outstanding for its participating securities, which consisted of convertible preferred stock and unvested restricted stock awards. The table below shows the calculation of earnings per participating share for the post-Recapitalization period beginning May 11, 2012 to March 31, 2013:
| For the period May 11, 2012 through March 31, 2013-post-recapitalization | May 11, 2012 - March 31, 2013 |
|||
| Earnings per Participating Share |
||||
| Income allocated to participating securities: |
||||
| Convertible preferred stock Series 1 and 2 |
$ | 5,982,235 | ||
| Unvested restricted common stock |
19,009 | |||
|
|
|
|||
| Total net income allocated to participating securities |
$ | 6,001,244 | ||
|
|
|
|||
| Weighted average participating securities: |
||||
| Convertible preferred stock Series 1 and 2 |
660,831 | |||
| Unvested restricted common stock |
2,100 | |||
|
|
|
|||
| Weighted average participating securities outstanding |
662,931 | |||
|
|
|
|||
| Basic earnings per participating share: post-Recapitalization |
$ | 9.05 | ||
|
|
|
|||
| Diluted earnings per participating share: post-Recapitalization |
$ | 9.05 | ||
|
|
|
|
||
The following table provides a reconciliation of the net income and share amounts used in computing basic and diluted earnings per common share for the year ended March 31, 2014:
| For the year ended March 31, 2014 | 2014 | |||
| Earnings per Common Share |
||||
| Net income |
$ | 9,349,193 | ||
| Less distribution to preferred shareholder |
(1,262,103 | ) | ||
|
|
|
|||
| Income available to common shareholders and participating security shareholders |
8,087,090 | |||
| Less income allocated to participating securities: |
||||
| Convertible preferred stock Series 1 and 2 |
(7,797,434 | ) | ||
| Unvested restricted common stock |
(287,521 | ) | ||
|
|
|
|||
| Net income available to common shares |
$ | 2,135 | ||
|
|
|
|||
| Weighted average common shares and participating securities outstanding |
677,860 | |||
| Less shares allocated to participating securities: |
||||
| Convertible preferred stock Series 1 and 2 |
(653,581 | ) | ||
| Unvested restricted common stock |
(24,100 | ) | ||
|
|
|
|||
| Weighted average common shares outstanding |
179 | |||
|
|
|
|||
| Basic earnings per common share |
$ | 11.93 | ||
|
|
|
|||
| Diluted earnings per common share |
$ | 11.93 | ||
|
|
||||
F-58
Table of Contents
Commercial Credit Group Inc. and subsidiaries
Notes to consolidated financial statements
12 Related party
Senior Subordinated Notes. As of March 31, 2014, a preferred stock shareholder held $5,000,000 of the Company’s outstanding senior subordinated notes. The amount of interest expense associated with this related party debt was $375,000, $656,687 and $637,500 for the years ended March 31, 2012, 2013, and 2014, respectively. As of March 31, 2014, the amount of accrued interest associated with this related party debt was $159,375, which is included within accrued interest, taxes, and other liabilities on the consolidated balance sheet.
Management Fee. The Company pays a fee to two preferred shareholders for management and consulting services. For the years ended March 31, 2012, 2013, and 2014, the amount of this fee charged to operating expenses was $250,000, $243,852, and $250,000, respectively. As of March 31, 2013 and 2014, the amount of accrued expense associated with this related party was $62,500 and $62,500, which is included within accrued interest, taxes, and other liabilities on the consolidated balance sheet.
Equity Transaction Costs. Upon completion of the May 10, 2012 Recapitalization, the Company paid $1,456,581 in equity transaction costs to a preferred shareholder who participated in the Company’s exchange of Series A-2, Series D, Series E and Series F preferred stock shares for Series 2 preferred stock shares. These costs are included within the $3,251,177 total amount of equity issuance costs recognized in the Company’s consolidated statement of changes in shareholders’ equity for the year ended March 31, 2013.
13 Benefit plan
The Company has a 401(k) defined contribution plan (the “Plan”) for all eligible employees. Full-time employees are eligible to become participants after completing three full continuous calendar months of service. Employees are then eligible to participate at the beginning of the quarter following their first three full calendar months. Each plan participant may elect to have up to the maximum amount allowable under IRS guidelines withheld from salaries and wages as contributions to the Plan. The Company contributes matching contributions of 50% of the first 6% contributed by each participant. Participants become 100% vested in any employer contribution on a ratable basis over six years. Total contributions made by the Company to the Plan were $80,456, $119,260 and $169,343 for the years ended March 31, 2012, 2013, and 2014, respectively.
14 Fair value
The FASB establishes a fair value hierarchy for those instruments measured at fair value that distinguishes between assumptions based on market data (observable inputs) and the Company’s own assumptions (unobservable inputs). The hierarchy consists of three levels:
| Level 1 — |
Quoted market prices in active markets for identical assets or liabilities; | |
| Level 2 — |
Inputs other than Level 1 inputs that are either directly or indirectly observable; and | |
| Level 3 — |
Unobservable inputs developed using estimates and assumptions developed by the Company, which reflect those that a market participant would use. | |
F-59
Table of Contents
Commercial Credit Group Inc. and subsidiaries
Notes to consolidated financial statements
The following table presents the fair values of the Company’s financial assets and liabilities measured on a recurring and nonrecurring basis:
| As of March 31, 2013 | ||||||||||||||||
| Level 1 | Level 2 | Level 3 | Total | |||||||||||||
| Recurring basis: |
||||||||||||||||
| Derivative liabilities |
||||||||||||||||
| Interest rate swaps |
$ | — | $ | 1,510,694 | $ | — | $ | 1,510,694 | ||||||||
|
|
|
|||||||||||||||
| Total liabilities |
$ | — | $ | 1,510,694 | $ | — | $ | 1,510,694 | ||||||||
|
|
|
|
|
|
|
|
|
|||||||||
| Level 1 | Level 2 | Level 3 | Total | |||||||||||||
| Nonrecurring basis: |
||||||||||||||||
| Cash and cash equivalents |
$ | 1,000,000 | $ | — | $ | — | $ | 1,000,000 | ||||||||
| Restricted cash |
18,654,508 | — | — | 18,654,508 | ||||||||||||
| Finance receivables |
— | — | 383,901,643 | 383,901,643 | ||||||||||||
| Repossessed assets |
— | — | 4,231,833 | 4,231,833 | ||||||||||||
|
|
|
|||||||||||||||
| Total assets |
$ | 19,654,508 | $ | — | $ | 388,133,476 | $ | 407,787,984 | ||||||||
|
|
|
|||||||||||||||
| Long-term borrowings |
$ | — | $ | — | $ | 309,587,344 | $ | 309,587,344 | ||||||||
| Short-term borrowings |
— | — | 41,113,406 | 41,113,406 | ||||||||||||
|
|
|
|||||||||||||||
| Total liabilities |
$ | — | $ | — | $ | 350,700,750 | $ | 350,700,750 | ||||||||
|
|
||||||||||||||||
| As of March 31, 2014 | ||||||||||||||||
| Level 1 | Level 2 | Level 3 | Total | |||||||||||||
| Recurring basis: |
||||||||||||||||
| Derivative liabilities |
||||||||||||||||
| Interest rate swaps |
$ | — | $ | 679,661 | $ | — | $ | 679,661 | ||||||||
|
|
|
|||||||||||||||
| Total liabilities |
$ | — | $ | 679,661 | $ | — | $ | 679,661 | ||||||||
|
|
|
|||||||||||||||
| Level 1 | Level 2 | Level 3 | Total | |||||||||||||
| Nonrecurring basis: |
||||||||||||||||
| Cash and cash equivalents |
$ | 990,656 | $ | — | $ | — | $ | 990,656 | ||||||||
| Restricted cash |
36,526,866 | — | — | 36,526,866 | ||||||||||||
| Finance receivables |
— | — | 501,042,435 | 501,042,435 | ||||||||||||
| Repossessed assets |
— | — | 5,942,062 | 5,942,062 | ||||||||||||
|
|
|
|||||||||||||||
| Total assets |
$ | 37,517,522 | $ | — | $ | 506,984,497 | $ | 544,502,019 | ||||||||
|
|
|
|||||||||||||||
| Long-term borrowings |
$ | — | $ | — | $ | 417,927,944 | $ | 417,927,944 | ||||||||
| Short-term borrowings |
— | — | 61,494,002 | 61,494,002 | ||||||||||||
|
|
|
|||||||||||||||
| Total liabilities |
$ | — | $ | — | $ | 479,421,946 | $ | 479,421,946 | ||||||||
|
|
||||||||||||||||
F-60
Table of Contents
Commercial Credit Group Inc. and subsidiaries
Notes to consolidated financial statements
Cash and cash equivalents and restricted cash. The carrying values of cash equivalents and restricted cash approximate fair value due to their short-term maturities.
Finance receivables. The fair value of finance receivables deemed collectible has been estimated using the present value of expected future cash flows, discounted at an interest rate giving consideration to estimated prepayment risk and credit loss factors. Finance receivables deemed to be impaired are recorded at fair value based on the estimated value of underlying collateral. The estimated fair value of the Company’s entire finance receivable portfolio as of March 31, 2013, and 2014, was not materially different than the carrying amount. The methods and assumptions used to determine the estimated fair value of the Company’s finance receivables are not based on the exit price concept of fair value required under ASC Topic 820, Fair Value Measurement.
Repossessed assets. As of March 31, 2013 and 2014, the Company measured repossessed assets on a non-recurring basis using Level 3 inputs. Repossessed assets are initially recorded at fair value based on the estimated liquidation value of the collateral. We estimate the fair value of repossessed assets by evaluating their market value and condition based on recent sales of similar equipment, used equipment publications, our market knowledge and information from equipment vendors. Assets received to satisfy finance receivables (repossessed equipment, included in other assets) are initially written-down to the Company’s estimate of fair value by a charge to the allowance for credit losses.
Accounts payable. The carrying amount of accounts payable, which is included within accrued interest, taxes and other liabilities in the consolidated balance sheet, as of March 31, 2013, and 2014, approximates its fair value.
Derivative liabilities. The Company’s liabilities associated with its interest rate swap agreements are carried at fair value, determined based on the present value of the estimated future cash flows using implied rates in the applicable yield curve as of the valuation date. The following table provides a reconciliation of the opening and ending balances as of March 31, 2013, and 2014:
| 2013 | 2014 | |||||||
| Fair Value of Derivative Liabilities |
||||||||
| Beginning Balance |
$ | 1,676,833 | $ | 1,510,694 | ||||
| Unrealized gain recognized in other comprehensive income: cash flow hedges |
(166,139 | ) | (831,033 | ) | ||||
|
|
|
|||||||
| Ending Balance, March 31 |
$ | 1,510,694 | $ | 679,661 | ||||
|
|
||||||||
Long and short term borrowings. The fair values of the Company’s borrowings under its fixed rate senior credit and securitization facilities, as well as subordinated notes payable, are estimated by discounting expected future cash flows using current rates offered for similar financing arrangements with comparable maturities. As of March 31, 2013, and 2014, the estimated fair values of the Company’s fixed rate senior credit and securitization facilities, as well as its subordinated notes payable, did not differ materially from their carrying amounts plus accrued interest. Certain of the Company’s senior credit facilities are revolving structures with variable rate interest payments that fluctuate at interest rates that are repriced frequently, at intervals of less than a year, with the then current interest rates. As such, the fair value of this type of facility reflects the principal amount of the loan outstanding at such time.
F-61
Table of Contents
Commercial Credit Group Inc. and subsidiaries
Notes to consolidated financial statements
15 Accumulated other comprehensive loss
Accumulated other comprehensive loss and the related activity for the years ended March 31, 2012, 2013 and 2014 were comprised of the following:
| For the years ended March 31, | ||||||||||||
| 2012 | 2013 | 2014 | ||||||||||
| Beginning balance |
$ | (798,334 | ) | $ | (858,110 | ) | $ | (753,822 | ) | |||
| Other comprehensive (loss) income, net |
||||||||||||
| (Loss) gains on cash flow hedges |
(94,769 | ) | 166,139 | 831,033 | ||||||||
| Less: tax benefit (expense) |
34,993 | (61,851 | ) | (316,924 | ) | |||||||
|
|
|
|||||||||||
| Other comprehensive (loss) income, net |
(59,776 | ) | 104,288 | 514,109 | ||||||||
|
|
|
|||||||||||
| Ending Balance |
$ | (858,110 | ) | $ | (753,822 | ) | $ | (239,713 | ) | |||
|
|
||||||||||||
Based on the Company’s ineffectiveness assessment, no amounts were recorded in net income related to ineffectiveness for the years ended March 31, 2012, 2013, and 2014. Amounts accumulated in other comprehensive income are recognized in earnings (interest expense) as periodic settlements of the hedging instruments (interest rate swaps) occur and the fair value of the interest rate swaps decline to zero. Net settlements paid by the Company related to such interest rate swaps for the years ended March 31, 2012, 2013 and 2014 were $1,771,245, $1,348,248, and $1,126,951, respectively. The Company has forecasted net settlement payments for the 12 month period ended March 31, 2015, of approximately $775,211, based on the notional amount of the interest rate swaps and market rates existing at March 31, 2014.
16 Subsequent events
In connection with the preparation of its consolidated financial statements and notes to consolidated financial statements as of and for the years ended March 31, 2013, and 2014, the Company has evaluated subsequent events through February 3, 2015 to determine whether any of these events required recognition or disclosure in the fiscal 2014 financial statements.
May 2014 debt issuance
On May 14, 2014, the Company issued $265,380,000 of fixed-rate asset-backed non-recourse securities. A portion of the proceeds from the issuance were used to pay down amounts outstanding under the Bank Facility and Revolving Securitization borrowings. The term debt, which was issued as asset-backed non-recourse securities, consists of three classes of notes which had a weighted average interest rate of .91% at inception. The final maturity of the latest maturing note is November 2021. The Company retains the right, as an option, to redeem the remaining amount of the notes when the pool of receivables, which serve as security for the notes comprising the debt, has reached 15.0% of its original amount.
Renewal of Asset Backed Securitization - Revolving
The Company renewed and increased the commitment of one of its Asset Backed Securitization-Revolving facilities from $100,000,000 to $125,000,000 on December 23, 2014 and extended the revolving commitment period to January 2017. Additionally, the Company renewed and increased the commitment of one of its Asset
F-62
Table of Contents
Commercial Credit Group Inc. and subsidiaries
Notes to consolidated financial statements
Backed Securitization-Revolving facilities from $100,000,000 to $125,000,000 on December 31, 2014 and extended the revolving commitment period to June 2016.
Formation of Commercial Credit Inc.
Commercial Credit, Inc. (“CCI”) was formed for purposes of creating a new holding company structure in which the Company would be a direct, wholly-owned subsidiary of CCI (the “Reorganization”). In order to implement the Reorganization, CCI entered into a Contribution Agreement, dated December 12, 2014 (the “Contribution Agreement”) with each of the Company’s stockholders pursuant to which each stockholder contributed all of its shares of the Company’s capital stock to CCI in exchange for an equal number of the corresponding class or series of CCI capital stock.
CCI’s capital structure, governance arrangements, stockholder arrangements and incentive compensation arrangements are substantially similar to those that were in effect with respect to the Company prior to the Reorganization. The Amended and Restated Certificate of Incorporation authorizes CCI to issue common stock, par value $0.00001 per share, Series 1 Preferred Stock, par value $0.00001 per share, and Series 2 Preferred Stock, par value $0.00001 per share. The terms of each class and series of CCI’s capital stock are identical to those of the corresponding class or series of the Company’s capital stock. CCI’s bylaws, which were adopted prior to the Reorganization, replicate the Company’s bylaws.
In connection with the Reorganization, CCI also assumed from the Company, all of the Company’s rights and obligations under (i) the Company’s 2012 Equity Incentive Plan (the “2012 Plan”) and (ii) all restricted stock award agreements granted by the Company pursuant to the 2012 Plan. As a result, the terms of any restricted stock award agreements now apply to CCI’s common stock in the same manner and subject to the same terms that such agreements applied to the Company’s common stock prior to the Reorganization.
As the final step of the Company’s corporate reorganization, the Company filed an Eighth Amended and Restated Certificate of Incorporation with the Secretary of State of the State of Delaware on January 5, 2015. The filing of the Eighth Amended and Restated Certificate of Incorporation of the Company provided for the retirement of the previously authorized Series 1 Preferred Shares and Series 2 Preferred Shares of the Company.
F-63
Table of Contents
shares
Commercial Credit, Inc.
Common stock
Preliminary Prospectus
| J.P. Morgan | Keefe, Bruyette & Woods | |
A Stifel Company
| BMO Capital Markets | SunTrust Robinson Humphrey | Wells Fargo Securities | BB&T Capital Markets |
Through and including , 2015 (the 25th day after the date of this prospectus), all dealers that effect transactions in these securities, whether or not participating in this offering, may be required to deliver a prospectus. This is in addition to the dealers’ obligations to deliver a prospectus when acting as underwriters and with respect to their unsold allotments or subscriptions.
, 2015
Table of Contents
Part II
Information not required in prospectus
Item 13. Other expenses of issuance and distribution.
The following table sets forth the estimated expenses payable by us in connection with the sale and distribution of the securities registered hereby, other than underwriting discounts or commissions. All amounts are estimates except for the SEC registration fee and the Financial Industry Regulatory Authority filing fee.
| SEC Registration Fee |
$ | 11,620 | ||
| Financial Industry Regulatory Authority, Inc. Filing Fee |
15,500 | |||
| NYSE Listing Fee |
125,000 | |||
| Printing and Engraving |
* | |||
| Legal Fees and Expenses |
* | |||
| Accounting Fees and Expenses |
* | |||
| Transfer Agent and Registrar Fees |
* | |||
| Miscellaneous |
* | |||
|
|
|
|||
| Total |
$ | * | ||
|
|
||||
| * | To be completed by amendment. |
Item 14. Indemnification of directors and officers.
The Registrant is governed by the Delaware General Corporation Law, or DGCL. Section 145 of the DGCL provides that a corporation may indemnify any person, including an officer or director, who was or is, or is threatened to be made, a party to any threatened, pending or completed legal action, suit or proceeding, whether civil, criminal, administrative or investigative (other than an action by or in the right of such corporation), by reason of the fact that such person was or is an officer, director, employee or agent of such corporation or is or was serving at the request of such corporation as a director, officer, employee or agent of another corporation or enterprise. The indemnity may include expenses (including attorneys’ fees), judgments, fines and amounts paid in settlement actually and reasonably incurred by such person in connection with such action, suit or proceeding, provided such officer, director, employee or agent acted in good faith and in a manner such person reasonably believed to be in, or not opposed to, the corporation’s best interest and, for criminal proceedings, had no reasonable cause to believe that such person’s conduct was unlawful. A Delaware corporation may indemnify any person, including an officer or director, who was or is, or is threatened to be made, a party to any threatened, pending or contemplated action or suit by or in the right of such corporation, under the same conditions, except that such indemnification is limited to expenses (including attorneys’ fees) actually and reasonably incurred by such person, and except that no indemnification is permitted without judicial approval if such person is adjudged to be liable to such corporation. Where an officer or director of a corporation is successful, on the merits or otherwise, in the defense of any action, suit or proceeding referred to above, or any claim, issue or matter therein, the corporation must indemnify that person against the expenses (including attorneys’ fees) which such officer or director actually and reasonably incurred in connection therewith.
The Registrant’s amended and restated bylaws will authorize the indemnification of its officers and directors, consistent with Section 145 of the Delaware General Corporation Law, as amended. Our employment agreements with our current executive officers provide, and similar agreements entered into with any new executive officers will provide, for indemnification of such executive officer by the Company. These agreements, among other things, will require the Registrant to indemnify each director and executive officer to the fullest extent permitted by Delaware law, including advancement of expenses such as attorneys’ fees, judgments, fines
II-1
Table of Contents
and settlement amounts incurred by the director or executive officer in any action or proceeding, including any action or proceeding by or in right of the Registrant, arising out of the person’s services as a director or executive officer.
Reference is made to Section 102(b)(7) of the DGCL, which enables a corporation in its original certificate of incorporation or an amendment thereto to eliminate or limit the personal liability of a director for violations of the director’s fiduciary duty, except (i) for any breach of the director’s duty of loyalty to the corporation or its stockholders, (ii) for acts or omissions not in good faith or that involve intentional misconduct or a knowing violation of law, (iii) pursuant to Section 174 of the DGCL, which provides for liability of directors for unlawful payments of dividends or unlawful stock purchases or redemptions or (iv) for any transaction from which a director derived an improper personal benefit.
The Registrant expects to maintain standard policies of insurance that provide coverage (i) to its directors and officers against loss arising from claims made by reason of breach of duty or other wrongful act and (ii) to the Registrant with respect to indemnification payments that it may make to such directors and officers.
The proposed form of Underwriting Agreement to be filed as Exhibit 1.1 to this Registration Statement provides for indemnification to the Registrant’s directors and officers by the underwriters against certain liabilities.
Item 15. Recent sales of unregistered securities.
Since January 1, 2012, we have issued and sold the following securities:
In October 2011, we issued an aggregate of 36,583 shares of restricted stock to certain executive officers. The fair market value of such issuance was $4,918.83 in aggregate consideration, which consisted of 10,263 shares at $0.21 per share and 26,320 shares at $0.105 per share.
In May 2012, we issued an aggregate of 81,590 shares of Series S-1 preferred stock to certain executive officers and key employees. The fair market value of such issuance was $100 per share, or $8,159,000 in aggregate consideration.
In May 2012, we issued an aggregate of 560,000 shares of Series S-2 preferred stock to Lovell Minnick Equity Partners III LP, Lovell Minnick Equity Partners III – A LP, A/B Partners X LLC and certain executive officers and key employees. The fair market value of such issuance was $100 per share, or $56,000,000 in aggregate consideration.
In July 2012, we issued 1,500 shares of Series S-2 preferred stock to one of our directors. The fair market value of such issuance was $100 per share, or $150,000 in aggregate consideration.
In March 2013, we issued an aggregate of 22,748 shares of restricted stock to certain executive officers and key employees. The fair market value of such issuance was $202,912.16 in aggregate consideration, which consisted of 11,374 shares at $13.40 per share and 11,374 shares at $4.44 per share.
In February 2014, we issued an aggregate of 13,238 shares of restricted stock to certain executive officers and key employees. The fair market value of such issuance was $156,473.16 in aggregate consideration, which consisted of 6,619 shares at $17.34 per share and 6,619 shares at $6.30 per share.
In connection with our corporate reorganization in December 2014, we issued 33,713 shares of our common stock, 72,306 shares of Series S-1 preferred stock, 574,551 shares of Series S-2 preferred stock to the stockholders of CCG in exchange for an equal number of CCG shares.
The issuances of preferred stock and restricted stock described above were deemed exempt from registration under Section 4(a)(2) or Regulation D of the Securities Act, and in certain circumstances, in reliance on Rule 701
II-2
Table of Contents
promulgated thereunder as transactions pursuant to compensatory benefit plans and contracts relating to compensation. All of the foregoing securities are deemed restricted securities for purposes of the Securities Act. The recipients of securities in the transactions exempt under Section 4(a)(2) or Regulation D of the Securities Act represented their intention to acquire the securities for investment purposes only and not with a view to or for sale in connection with any distribution thereof and appropriate legends were affixed to the stock certificates and instruments issued in such transactions. No underwriter or underwriting discount or commission was involved in any of the issuances set forth in this Item 15.
Item 16. Exhibits and financial statement schedules.
(a) Exhibits
| Exhibit number |
Description of exhibits | |||
| 1.1 | Form of Underwriting Agreement | |||
| 3.1 | Amended and Restated Certificate of Incorporation of Commercial Credit, Inc.† | |||
| 3.2 | Bylaws of Commercial Credit, Inc.† | |||
| 4.1 | Form of Common Stock Certificate* | |||
| 5.1 | Opinion of Mayer Brown LLP* | |||
| 10.1 | Indenture, dated as of May 14, 2014, between CCG Receivables Trust 2014-1 and U.S. Bank National Association† | |||
| 10.2 | Purchase Agreement, dated as of May 14, 2014, by and between Commercial Credit Group Inc. and CCG Receivables IV, LLC† | |||
| 10.3 | Sale and Servicing Agreement, dated as of May 14, 2014, by and among CCG Receivables IV, LLC, CCG Receivables Trust 2014-1, Commercial Credit Group Inc., Portfolio Financial Servicing Company and U.S. Bank National Association† | |||
| 10.4 | Credit Agreement, dated as of January 8, 2014, among Commercial Credit Group Inc., the Guarantors from time to time party thereto, the Lenders from time to time party thereto and BMO Harris Bank N.A.† | |||
| 10.5 | Security Agreement, dated as of January 8, 2014, by and among Commercial Credit Group Inc. and BMO Harris Bank N.A.† | |||
| 10.6 | Loan and Administration Agreement, dated as of January 8, 2014, by and among CCG Receivables VI, LLC, Commercial Credit Group Inc., Portfolio Financial Servicing Company, Jupiter Securitization Company LLC and JPMorgan Chase Bank, N.A.† | |||
| 10.7 | First Amendment to Loan and Administration Agreement, dated as of December 12, 2014, by and among CCG Receivables VI, LLC, Commercial Credit Group Inc., Portfolio Financial Servicing Company, Jupiter Securitization Company LLC and JPMorgan Chase, N.A.† | |||
| 10.8 | Second Amendment to Loan and Administration Agreement, dated as of December 23, 2014, by and among CCG Receivables VI, LLC, Commercial Credit Group Inc., Portfolio Financial Servicing Company, Jupiter Securitization Company LLC and JPMorgan Chase, N.A.† | |||
| 10.9 | Sale Agreement, dated as of January 8, 2014, by and between Commercial Credit Group Inc. and CCG Receivables VI, LLC† | |||
| 10.10 | Indenture, dated as of April 24, 2013, between CCG Receivables Trust 2013-1 and U.S. Bank National Association† | |||
II-3
Table of Contents
| Exhibit number |
Description of exhibits | |||
| 10.11 | Purchase Agreement, dated as of April 24, 2013, by and between Commercial Credit Group Inc. and CCG Receivables IV, LLC† | |||
| 10.12 | Sale and Servicing Agreement, dated as of April 24, 2013, by and among CCG Receivables IV, LLC, CCG Receivables Trust 2013-1, Commercial Credit Group Inc., Portfolio Financial Servicing Company and U.S. Bank National Association† | |||
| 10.13 | Commercial Credit Group Inc. 2012 Equity Incentive Plan, dated November 7, 2012† | |||
| 10.14 | Indenture, dated as of February 15, 2012, between CCG Receivables Trust 2012-1 and U.S. Bank National Association† | |||
| 10.15 | Purchase Agreement, dated as of February 15, 2012, by and between Commercial Credit Group Inc. and CCG Receivables IV, LLC† | |||
| 10.16 | Sale and Servicing Agreement, dated as of February 15, 2012, by and among CCG Receivables IV, LLC, CCG Receivables Trust 2012-1, Commercial Credit Group Inc., Portfolio Financial Servicing Company and U.S. Bank National Association† | |||
| 10.17 | Loan and Administration Agreement, dated as of June 13, 2011, by and among CCG Receivables V, LLC, Commercial Credit Group Inc., Portfolio Financial Servicing Company, Fairway Finance Company, LLC, BMO Capital Markets Corp. and the other Lenders and Administrators from time to time parties thereto† | |||
| 10.18 | Sale Agreement, dated as of June 13, 2011, by and between Commercial Credit Group Inc. and CCG Receivables V, LLC† | |||
| 10.19 | Amended and Restated Loan and Administration Agreement, dated as of December 31, 2014, by and among CCG Receivables III, LLC, Commercial Credit Group Inc., Portfolio Servicing Company, SunTrust Bank, SunTrust Robinson Humphrey, Inc. and the other Lenders and Administrators from time to time parties thereto† | |||
| 10.20 | Sale Agreement, dated as of March 31, 2010, by and between Commercial Credit Group Inc. and CCG Receivables III, LLC† | |||
| 10.21 | Loan and Administration Agreement, dated as of February 23, 2015, by and among CCG Receivables VII, LLC, CCG Canada Funding 2 LP, Commercial Credit Group Inc., CCG Equipment Finance Limited, Portfolio Financial Servicing Company, Wells Fargo Bank, National Association and the other Lenders and Administrators from time to time parties thereto† | |||
| 10.22 | Sale Agreement, dated as of February 23, 2015, by and between Commercial Credit Group Inc. and CCG Receivables VII, LLC† | |||
| 10.23 | Canadian Sale Agreement, dated as of February 23, 2015, by and between CCG Equipment Finance Limited and CCG Canada Funding 2 LP, by its general partner 1020973 B.C. Ltd.† | |||
| 10.24 | Form of Employment Agreement† | |||
| 10.25 | Commercial Credit, Inc. 2015 Stock Incentive Plan | |||
| 16.1 | Letter from Grant Thornton LLP, dated March 18, 2015† | |||
| 21.1 | Subsidiaries of the Registrant† | |||
| 23.1 | Consent of KPMG LLP | |||
| 23.3 | Consent of Mayer Brown LLP (included in the opinion to be filed as Exhibit 5.1 hereto)* | |||
| 24.1 | Power of Attorney† | |||
|
|
| |||
| * | To be filed by amendment. |
| † | Previously filed. |
II-4
Table of Contents
(b) Financial statement schedules
All financial statement schedules have been omitted because the information required to be set forth therein is not applicable or is shown in the financial statements or notes thereto.
Item 17. Undertakings.
The undersigned Registrant hereby undertakes to provide to the underwriters at the closing specified in the underwriting agreement, certificates in such denominations and registered in such names as required by the underwriters to permit prompt delivery to each purchaser.
Insofar as indemnification for liabilities arising under the Securities Act may be permitted to directors, officers and controlling persons of the Registrant pursuant to the foregoing provisions, or otherwise, the Registrant has been advised that in the opinion of the SEC such indemnification is against public policy as expressed in the Securities Act and is, therefore, unenforceable. In the event that a claim for indemnification against such liabilities (other than the payment by the Registrant of expenses incurred or paid by a director, officer or controlling person of the Registrant in the successful defense of any action, suit or proceeding) is asserted by such director, officer or controlling person in connection with the securities being registered, the Registrant will, unless in the opinion of its counsel the matter has been settled by controlling precedent, submit to a court of appropriate jurisdiction the question whether such indemnification by it is against public policy as expressed in the Securities Act and will be governed by the final adjudication of such issue.
The undersigned Registrant hereby undertakes that:
(1) For purposes of determining any liability under the Securities Act, the information omitted from the form of prospectus filed as part of this registration statement in reliance upon Rule 430A and contained in a form of prospectus filed by the Registrant pursuant to Rule 424(b)(1) or (4) or 497(h) under the Securities Act shall be deemed to be part of this registration statement as of the time it was declared effective.
(2) For the purpose of determining any liability under the Securities Act, each post-effective amendment that contains a form of prospectus shall be deemed to be a new registration statement relating to the securities offered therein, and the offering of such securities at that time shall be deemed to be the initial bona fide offering thereof.
(3) For the purpose of determining liability of the registrant under the Securities Act to any purchaser in the initial distribution of the securities, the undersigned registrant undertakes that in a primary offering of securities of the undersigned registrant pursuant to this registration statement, regardless of the underwriting method used to sell the securities to the purchaser, if the securities are offered or sold to such purchaser by means of any of the following communications, the undersigned registrant will be a seller to the purchaser and will be considered to offer or sell such securities to such purchaser:
(a) Any preliminary prospectus or prospectus of the undersigned registrant relating to the offering required to be filed pursuant to Rule 424 under the Securities Act;
(b) Any free writing prospectus relating to the offering prepared by or on behalf of the undersigned registrant or used or referred to by the undersigned registrant;
(c) The portion of any other free writing prospectus relating to the offering containing material information about the undersigned registrant or its securities provided by or on behalf of the undersigned registrant; and
(d) Any other communication that is an offer in the offering made by the undersigned registrant to the purchaser.
II-5
Table of Contents
Signatures
Pursuant to the requirements of the Securities Act of 1933, the registrant has duly caused this registration statement to be signed on its behalf by the undersigned, thereunto duly authorized, in the City of Charlotte, State of North Carolina, on April 16, 2015.
| COMMERCIAL CREDIT, INC. |
| By: |
/s/ Daniel McDonough | |
| Name: |
Daniel McDonough | |
| Title: |
President and Chief Executive Officer | |
Pursuant to the requirements of the Securities Act of 1933, this registration statement has been signed by the following persons in the capacities held on April 16, 2015.
| Name | Position | |
| /s/ Daniel McDonough Daniel McDonough |
President and Chief Executive Officer (Principal Executive Officer) | |
| /s/ Roger Gebhart Roger Gebhart |
Senior Vice President and Chief Financial Officer (Principal Financial Officer) | |
| /s/ Rebecca Sabo Rebecca Sabo |
Vice President and Chief Accounting Officer (Principal Accounting Officer) | |
| * W. Bradford Armstrong |
Director | |
| * John Cochran II |
Director | |
| * John Fruehwirth |
Director | |
| * Steven Groth |
Director | |
| * By: |
/s/ Angelo Garubo | |
| Angelo Garubo Attorney-in-Fact | ||
Table of Contents
Exhibit index
| Exhibit number |
Description of exhibits | |
| 1.1 | Form of Underwriting Agreement | |
| 3.1 | Amended and Restated Certificate of Incorporation of Commercial Credit, Inc.† | |
| 3.2 | Bylaws of Commercial Credit, Inc.† | |
| 4.1 | Form of Common Stock Certificate* | |
| 5.1 | Opinion of Mayer Brown LLP* | |
| 10.1 | Indenture, dated as of May 14, 2014, between CCG Receivables Trust 2014-1 and U.S. Bank National Association† | |
| 10.2 | Purchase Agreement, dated as of May 14, 2014, by and between Commercial Credit Group Inc. and CCG Receivables IV, LLC† | |
| 10.3 | Sale and Servicing Agreement, dated as of May 14, 2014, by and among CCG Receivables IV, LLC, CCG Receivables Trust 2014-1, Commercial Credit Group Inc., Portfolio Financial Servicing Company and U.S. Bank National Association† | |
| 10.4 | Credit Agreement, dated as of January 8, 2014, among Commercial Credit Group Inc., the Guarantors from time to time party thereto, the Lenders from time to time party thereto and BMO Harris Bank N.A. † | |
| 10.5 | Security Agreement, dated as of January 8, 2014, by and among Commercial Credit Group Inc. and BMO Harris Bank N.A.† | |
| 10.6 | Loan and Administration Agreement, dated as of January 8, 2014, by and among CCG Receivables VI, LLC, Commercial Credit Group Inc., Portfolio Financial Servicing Company, Jupiter Securitization Company LLC and JPMorgan Chase Bank, N.A. † | |
| 10.7 | First Amendment to Loan and Administration Agreement, dated as of December 12, 2014, by and among CCG Receivables VI, LLC, Commercial Credit Group Inc., Portfolio Financial Servicing Company, Jupiter Securitization Company LLC and JPMorgan Chase, N.A.† | |
| 10.8 | Second Amendment to Loan and Administration Agreement, dated as of December 23, 2014, by and among CCG Receivables VI, LLC, Commercial Credit Group Inc., Portfolio Financial Servicing Company, Jupiter Securitization Company LLC and JPMorgan Chase, N.A.† | |
| 10.9 | Sale Agreement, dated as of January 8, 2014, by and between Commercial Credit Group Inc. and CCG Receivables VI, LLC† | |
| 10.10 | Indenture, dated as of April 24, 2013, between CCG Receivables Trust 2013-1 and U.S. Bank National Association† | |
| 10.11 | Purchase Agreement, dated as of April 24, 2013, by and between Commercial Credit Group Inc. and CCG Receivables IV, LLC† | |
| 10.12 | Sale and Servicing Agreement, dated as of April 24, 2013, by and among CCG Receivables IV, LLC, CCG Receivables Trust 2013-1, Commercial Credit Group Inc., Portfolio Financial Servicing Company and U.S. Bank National Association† | |
| 10.13 | Commercial Credit Group Inc. 2012 Equity Incentive Plan, dated November 7, 2012† | |
| 10.14 | Indenture, dated as of February 15, 2012, between CCG Receivables Trust 2012-1 and U.S. Bank National Association† | |
Table of Contents
| Exhibit number |
Description of exhibits | |
| 10.15 | Purchase Agreement, dated as of February 15, 2012, by and between Commercial Credit Group Inc. and CCG Receivables IV, LLC† | |
| 10.16 | Sale and Servicing Agreement, dated as of February 15, 2012, by and among CCG Receivables IV, LLC, CCG Receivables Trust 2012-1, Commercial Credit Group Inc., Portfolio Financial Servicing Company and U.S. Bank National Association† | |
| 10.17 | Loan and Administration Agreement, dated as of June 13, 2011, by and among CCG Receivables V, LLC, Commercial Credit Group Inc., Portfolio Financial Servicing Company, Fairway Finance Company, LLC, BMO Capital Markets Corp. and the other Lenders and Administrators from time to time parties thereto† | |
| 10.18 | Sale Agreement, dated as of June 13, 2011, by and between Commercial Credit Group Inc. and CCG Receivables V, LLC† | |
| 10.19 | Amended and Restated Loan and Administration Agreement, dated as of December 31, 2014, by and among CCG Receivables III, LLC, Commercial Credit Group Inc., Portfolio Servicing Company, SunTrust Bank, SunTrust Robinson Humphrey, Inc. and the other Lenders and Administrators from time to time parties thereto.† | |
| 10.20 | Sale Agreement, dated as of March 31, 2010, by and between Commercial Credit Group Inc. and CCG Receivables III, LLC† | |
| 10.21 | Loan and Administration Agreement, dated as of February 23, 2015, by and among CCG Receivables VII, LLC, CCG Canada Funding 2 LP, Commercial Credit Group Inc., CCG Equipment Finance Limited, Portfolio Financial Servicing Company, Wells Fargo Bank, National Association and the other Lenders and Administrators from time to time parties thereto.† | |
| 10.22 | Sale Agreement, dated as of February 23, 2015, by and between Commercial Credit Group Inc. and CCG Receivables VII, LLC.† | |
| 10.23 | Canadian Sale Agreement, dated as of February 23, 2015, by and between CCG Equipment Finance Limited and CCG Canada Funding 2 LP, by its general partner 1020973 B.C. Ltd.† | |
| 10.24 | Form of Employment Agreement† | |
| 10.25 | Commercial Credit, Inc. 2015 Stock Incentive Plan | |
| 16.1 | Letter from Grant Thornton LLP, dated March 18, 2015† | |
| 21.1 | Subsidiaries of the Registrant† | |
| 23.1 | Consent of KPMG LLP | |
| 23.3 | Consent of Mayer Brown LLP (included in the opinion to be filed as Exhibit 5.1 hereto)* | |
| 24.1 | Power of Attorney† | |
|
| ||
| * | To be filed by amendment. |
| † | Previously filed. |