Attached files
| file | filename |
|---|---|
| 8-K - 8-K - ASSOCIATED BANC-CORP | d908589d8k.htm |
| EX-99.1 - EX-99.1 - ASSOCIATED BANC-CORP | d908589dex991.htm |
 ASSOCIATED BANC-CORP
1Q 2015 EARNINGS PRESENTATION
APRIL 16, 2015
Exhibit 99.2
*
*
*
*
* |
 FORWARD-LOOKING STATEMENTS
Important note regarding forward-looking statements:
1
Statements made in this presentation which are not purely historical are
forward-looking statements, as defined in the Private Securities
Litigation Reform Act of 1995. This includes any statements regarding
management’s plans, objectives, or goals for future operations, products or
services, and forecasts of its revenues, earnings, or other measures of
performance. Such
forward-looking
statements
may
be
identified
by
the
use
of
words
such
as
“believe”,
“expect”,
“anticipate”,
“plan”,
“estimate”,
“should”,
“will”,
“intend”,
“outlook”,
or
similar
expressions.
Forward-
looking statements are based on current management expectations and, by their
nature, are subject to risks and uncertainties. Actual results may differ
materially from those contained in the forward-looking statements.
Factors which may cause actual results to differ materially from those
contained in such forward-looking statements include those identified in the
Company’s most recent Form 10-K and subsequent SEC filings.
Such factors are incorporated herein by reference. |
 2015
FIRST QUARTER HIGHLIGHTS 2
Solid Earnings Despite Continued Margin Compression
•
Average loans of $17.8 billion were up $428 million, or 2% from the fourth
quarter —
Total average commercial loans grew $309 million from the fourth
quarter
—
Average mortgage loans grew 4% from the fourth quarter
•
Average deposits of $19.1 billion were up $523 million, or 3% from the fourth
quarter •
Net interest income of $168 million was up $3 million from last year
—
Net interest margin of 2.89% compared to 3.12% in the first quarter 2014
•
Quarterly dividend of $0.10 / common share
•
Repurchased approximately 1.7 million shares of common stock during the first
quarter •
Capital ratios remain strong with a Tier 1 common equity ratio of 9.39%
•
Noninterest income of $80 million was up $10 million compared to
the fourth quarter
—
Insurance commissions increased $9 million from the fourth quarter
•
Noninterest expense of $174 million was up $2 million from the fourth
quarter •
Net income available to common shareholders of $45 million or $0.30 per
share •
Pretax income of $69 million was up $2 million, or 2% from the fourth
quarter •
Return on average Tier 1 Common Equity of 10.22%
Net Interest Income
&
Net Interest Margin
Noninterest Income
&
Expenses
Capital
Balance Sheet
Net Income
&
ROT1CE |
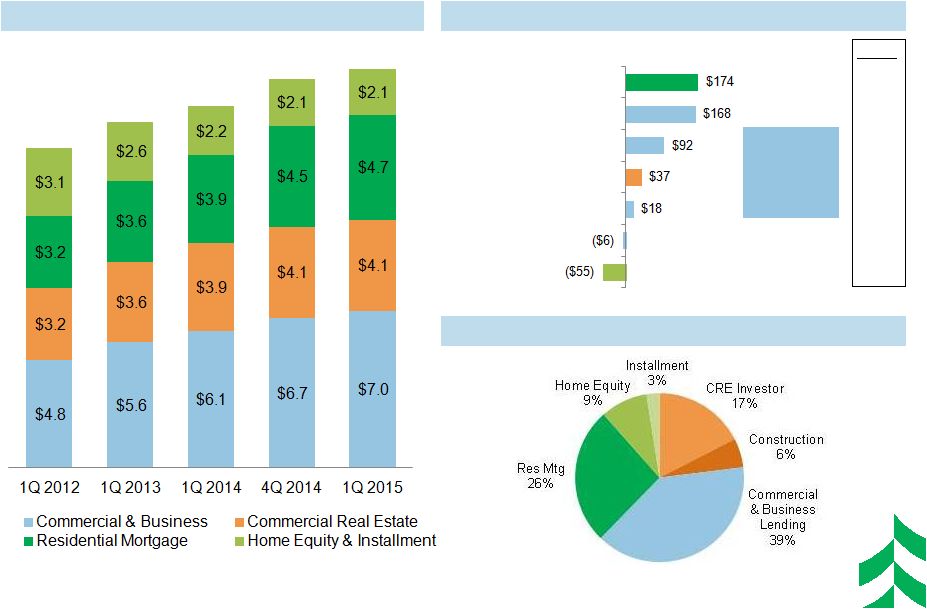 LOAN
PORTFOLIO – TREND AND MIX
3
1Q 2015 Average Net Loan Change (+$428 mln)
Loan Mix –
1Q 2015 (Average)
($ in millions)
Home Equity & Installment
Commercial Real Estate
Residential Mortgage
Power & Utilities
Oil & Gas
Mortgage Warehouse
General Commercial Loans
Average Quarterly Loans ($ in billions)
$17.8
+4%
% Chg
+3%
+13%
+1%
$16.2
+5%
$17.4
$15.4
$14.3
Total
Commercial
& Business
Lending
+4%
(3%)
(1%) |
 COMMERCIAL LINE UTILIZATION TRENDS
4
Line utilization increased in Commercial & Business Lending
Change from 4Q 14
Commercial Real
Estate (including
construction)
-
40 bps
Commercial &
Business Lending
+200 bps |
 5
Yield on Interest-earning Assets
Cost of Interest-bearing Liabilities
Net Interest Income & Net Interest Margin
($ in millions)
Net Interest Margin
Total Loan Yield
Total Interest-earning Yield
+8 bps
NET INTEREST INCOME AND MARGIN TRENDS |
 NONINTEREST INCOME TRENDS
($ IN MILLIONS)
Core
Fee-based
Revenue
Mortgage Banking (net) Income
Total Noninterest Income
Other
Noninterest
Income
6
1
–
Core
Fee-based
Revenue
=
Trust
service
fees
plus
Service
charges
on
deposit
accounts
plus
Card-based
and
other
nondeposit
fees
plus
Insurance
commissions
plus
Brokerage
and
annuity
commissions.
This
is
a
non-GAAP
measure.
Please
refer
to
the
press
release
tables
for
a
reconciliation
to
noninterest
income.
2
–
Other
Noninterest
Income
=
Total
Noninterest
Income
minus
net
Mortgage
Banking
Income
minus
Core
Fee-based
Revenue.
This
is
a
non-GAAP
measure.
Please
refer
to
the
press
release
tables
for
a
reconciliation
to
noninterest
income.
1
2 |
 NONINTEREST EXPENSE TRENDS
($ IN MILLIONS)
Technology
Spend
Total Noninterest Expense
Other Non-Personnel Spend
Personnel Spend / FTE Trend
1
–
Efficiency
ratio
=
Noninterest
expense,
excluding
other
intangible
amortization,
divided
by
sum
of
taxable
equivalent
net
interest
income
plus
noninterest
income,
excluding
investment
securities
gains/losses,
net,
and
asset
gains/losses,
net.
This
is
a
non-GAAP
financial
measure.
Please
refer
to
the
appendix
for
a
reconciliation
of
this
measure.
2
–
FTE
=
Average
Full
Time
Equivalent
Employees
3
–
Technology
Spend
=
Technology
and
Equipment
expenses
4
–
Other
Non-Personnel
Spend
=
Total
Noninterest
Expense
less
Personnel
and
Technology
spend
Efficiency Ratio
69%
68%
69%
70%
69%
7
2
3
4
1 |
 OIL AND
GAS LENDING UPDATE 8
•
Exclusively
focused
on
the
upstream
sector
(‘Exploration
and
Production’
or
‘E&P’
sector).
—
Focused on the small to mid-size independent segment, both public and private
companies. —
Asset-based loans collateralized by a lien on oil and gas reserves.
—
Generally, we are a participant in a syndicated loan.
•
January 2015 stress test indicated adequate specific reserves for this
portfolio. —
NYMEX price strip at end of 1Q 2015 was similar to 4Q 2014.
—
Most of this underlying portfolio is hedged into 2016 at higher than current
prices. —
Loan loss reserves increased for this portfolio during the quarter.
•
New engineering reports will largely be completed in second quarter
—
Will drive borrowing base redetermination and trigger pay-downs if
needed. —
Commodity prices are continuously monitored.
($ in Millions)
4Q 2014
1Q 2015
Balance End of Period (EOP)
$754
$780
Total Reserves
$17
$27
Reserve/EOP Loans
2.26%
3.46%
* Note: Oil & Gas balances at 1Q 2015 are approximately 4% of total loan
portfolio |
 CREDIT
QUALITY INDICATORS ($ IN MILLIONS)
9
Potential Problems Loans & PPLs to Total Loans
Nonaccruals & NA / Total Loans
ALL to Nonaccruals and Total Loans
Net Charge Offs & NCOs to Avg Loans |
 2015
FULL YEAR OUTLOOK 10
Balance Sheet
•
High single digit annual average loan growth
•
Maintain Loan/Deposit ratio under 100%
Margin
•
Modest compression throughout the year from the first
quarter
Noninterest
Income
•
Up mid to upper single digits from 2014
Noninterest
Expense
•
Up low single digits from 2014 with a continued focus on
efficiency initiatives
Capital
•
Continue to follow stated corporate priorities for capital
deployment
Provision
•
Expected to increase with loan growth and changes in risk
grade or other indications of credit quality
1
–
Outlook
incorporates
effects
of
Ahmann
&
Martin
Co.
acquisition.
1
1 |
 APPENDIX
11
*
*
*
*
*
* |
 RECONCILIATION AND DEFINITIONS OF
NON-GAAP ITEMS
1Q 2014
2Q 2014
3Q 2014
4Q 2014
1Q 2015
Efficiency Ratio Reconciliation:
Efficiency ratio (1)
70.41%
69.70%
69.44%
70.33%
70.30%
Taxable equivalent adjustment
(1.35)
(1.32)
(1.36)
(1.40)
(1.42)
Asset gains, net
0.22
0.26
1.36
1.05
0.30
Other intangible amortization
(0.42)
(0.41)
(0.40)
(0.32)
(0.32)
Efficiency ratio, fully taxable equivalent (1)
68.86%
68.23%
69.04%
69.66%
68.86%
(1)
Efficiency
ratio
is
defined
by
the
Federal
Reserve
guidance
as
noninterest
expense
divided
by
the
sum
of
net
interest
income
plus
noninterest
income, excluding investment securities gains / losses, net. Efficiency
ratio, fully taxable equivalent, is noninterest expense, excluding other
intangible amortization, divided by the sum of taxable equivalent net interest
income plus noninterest income, excluding investment securities gains /
losses, net and asset gains / losses, net. This efficiency ratio is presented on a taxable equivalent basis, which adjusts net interest
income for the tax-favored status of certain loans and investment
securities. Management believes this measure to be the preferred industry
measurement of net interest income as it enhances the comparability of net interest
income arising from taxable and tax-exempt sources and it excludes
certain specific revenue items (such as investment securities gains / losses, net and asset gains / losses, net).
Tier
1
common
equity,
a
non-GAAP
financial
measure,
is
used
by
banking
regulators,
investors
and
analysts
to
assess
and
compare
the
quality
and composition of our capital with the capital of other financial services
companies. Management uses Tier 1 common equity, along with other capital
measures, to assess and monitor our capital position. Tier 1 common equity (period end and average) is Tier 1 capital excluding
qualifying perpetual preferred stock and qualifying trust preferred
securities. The Corporation adopted the Basel III regulatory standards during
the first quarter of 2015; all prior periods presented are disclosed under Basel I
regulatory standards. 12 |