Attached files
| file | filename |
|---|---|
| 8-K - FORM 8-K - Federal Home Loan Bank of New York | d910157d8k.htm |
Exhibit 99.1
Federal Home Loan Bank of New York Stockholders’ Meetings
April 2015
© 2015 FEDERAL HOME LOAN BANK OF NEW YORK • 101 PARK AVENUE • NEW YORK, NY 10178 • WWW.FHLBNY.COM
FHLBNY: Strong Performance for Customers and Shareholders
Stockholders’ Meetings
April 2015
© 2015 FEDERAL HOME LOAN BANK OF NEW YORK • 101 PARK AVENUE • NEW YORK, NY 10178 • WWW.FHLBNY.COM
Key Messages
» “Advances Bank” strategy
» Strong performance record for customers and shareholders
» Conservatively positioned balance sheet
» FHLBank System’s financial results have improved since the financial crisis
FHLBNY
| 3 |
|
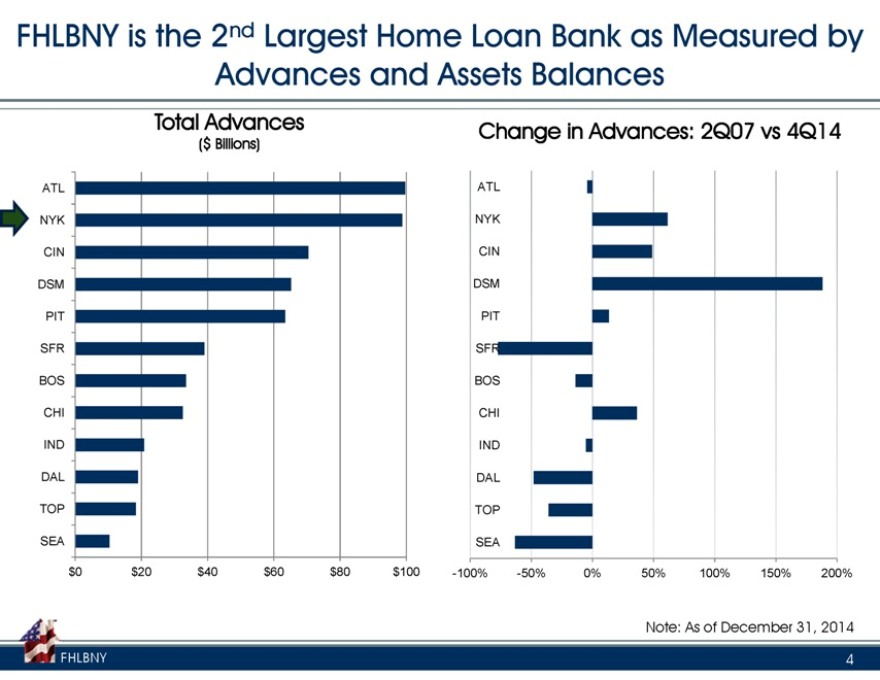
FHLBNY is the 2nd Largest Home Loan Bank as Measured by Advances and Assets Balances
Total Advances
Change in Advances:
2Q07
vs
4Q14
($ Billions)
ATL
ATL
NYK
NYK
CIN
CIN
DSM
DSM
PIT
PIT
SFR
SFR
BOS
BOS
CHI
CHI
IND
IND
DAL
DAL
TOP
TOP
SEA
SEA
$0
$20
$40
$60
$80
$100
-100%
-50%
0%
50%
100%
150%
200%
Note: As of December 31, 2014
FHLBNY
4
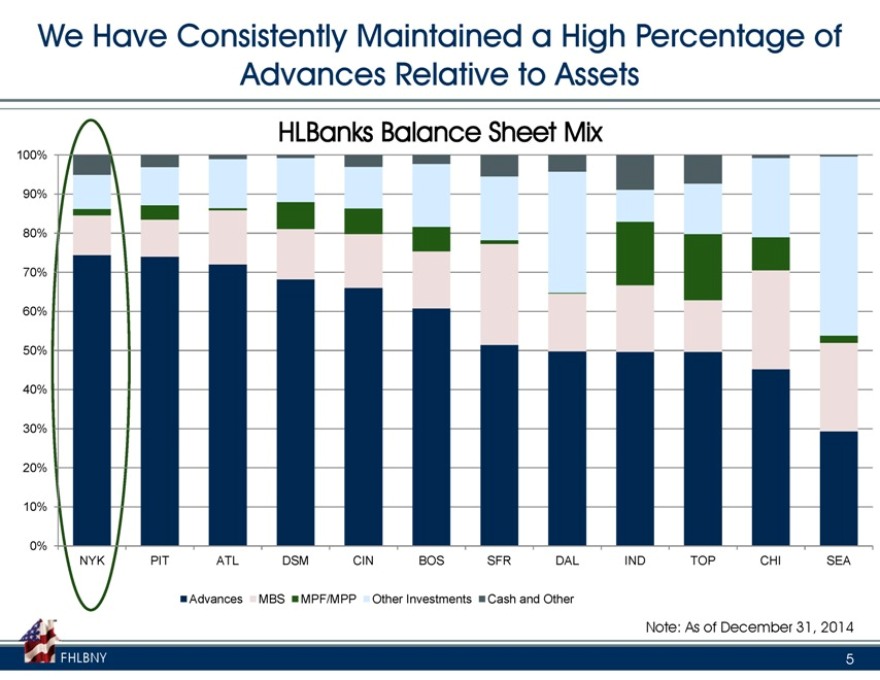
We Have Consistently Maintained a High Percentage of Advances Relative to Assets
100% 90% 80% 70% 60% 50% 40% 30% 20% 10% 0%
HLBanks Balance Sheet Mix
NYK PIT ATL DSM CIN BOS SFR DAL IND TOP CHI SEA
Advances MBS MPF/MPP Other Investments Cash and Other
Note: As of December 31, 2014
FHLBNY 5
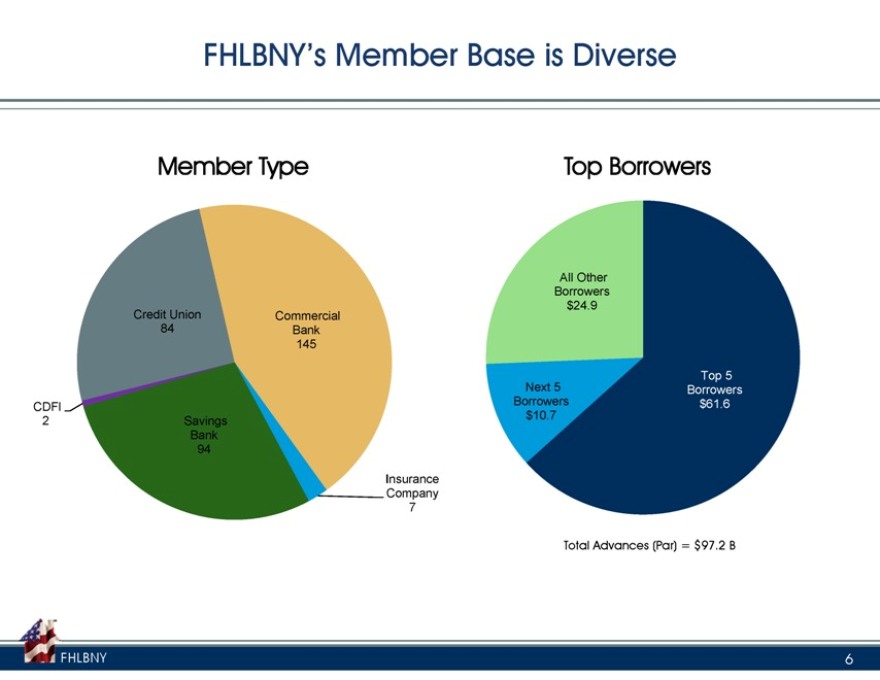
FHLBNY’s Member Base is Diverse
Member Type
Top Borrowers
All Other Borrowers
$24.9 Credit Union Commercial
84 Bank 145
Next 5 Top 5 Borrowers Borrowers CDFI $10.7 $61.6
| 2 |
|
Savings Bank 94 |
Insurance Company 7
Total Advances (Par) = $97.2 B
FHLBNY
| 6 |
|
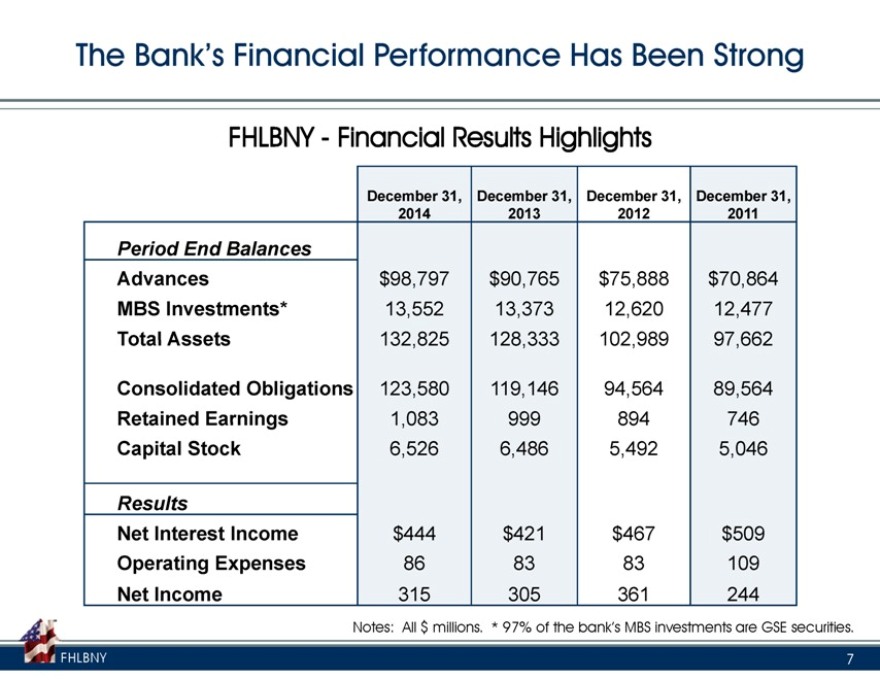
The Bank’s Financial Performance Has Been Strong
FHLBNY—Financial Results Highlights
December 31,
December 31,
December 31,
December 31,
2014
2013
2012
2011
Period End Balances
Advances
$98,797
$90,765
$75,888
$70,864
MBS Investments*
13,552
13,373
12,620
12,477
Total Assets
132,825
128,333
102,989
97,662
Consolidated Obligations
123,580
119,146
94,564
89,564
Retained Earnings
1,083
999
894
746
Capital Stock
6,526
6,486
5,492
5,046
Results
Net Interest Income
$444
$421
$467
$509
Operating Expenses
86
83
83
109
Net Income
315
305
361
244
Notes: All $ millions. * 97% of the bank’s MBS investments are GSE securities.
FHLBNY
7
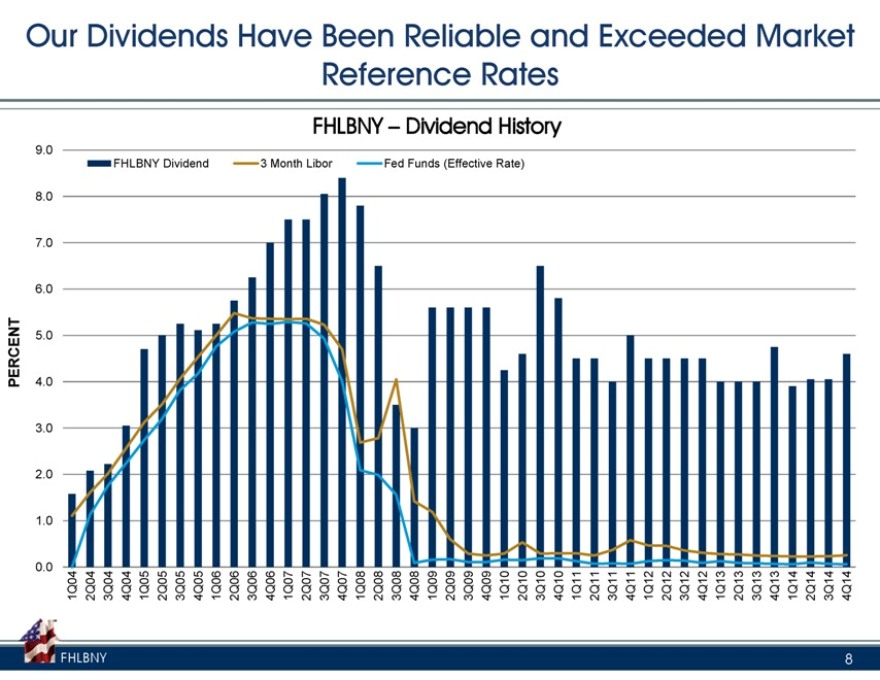
PERCENT
. 0 1 . 2 . 3 . 4 . . 5 . 6 . 7 . 9 .
0 0 0 0 0 0 0 0 80 0
1Q04 Our 2Q04
FHLBNY 3Q04 4Q04
1Q05 FHLBNY
2Q05 3Q05 4Q05 Dividend
1Q06 Dividends
2Q06
3Q06 4Q063
1Q07 Month
2Q07 Have
3Q07 Libor
4Q07
1Q08 FHLBNY
2Q08
–
3Q08 Fed Been 4Q08
1Q09 Funds
2Q09 Reference
3Q09
4Q09 (Effective
Dividend
1Q10 Rate)
2Q10Reliable 3Q10 Rates
4Q10
1Q11 History and
2Q11 3Q11 4Q11 1Q12 2Q12 3Q12 4Q12
1Q13 Exceeded
2Q13 3Q13 4Q13 1Q14 2Q14
3Q14 Market
| 8 |
|
4Q14 |
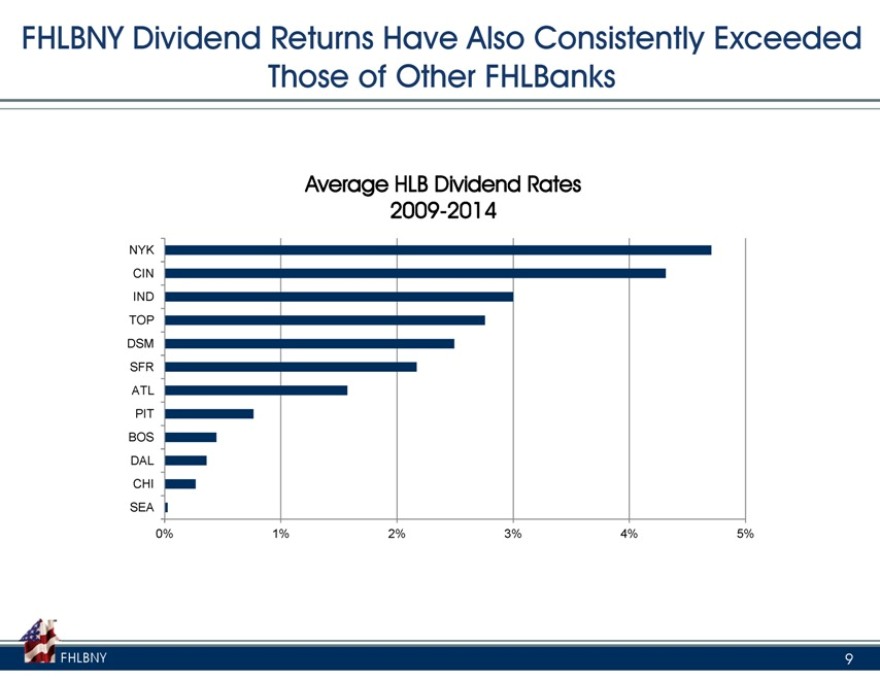
FHLBNY Dividend Returns Have Also Consistently Exceeded Those of Other FHLBanks
Average HLB Dividend Rates
2009-2014
NYK
CIN
IND
TOP
DSM
SFR
ATL
PIT
BOS
DAL
CHI
SEA
0%
1%
2%
3%
4%
5%
FHLBNY
9
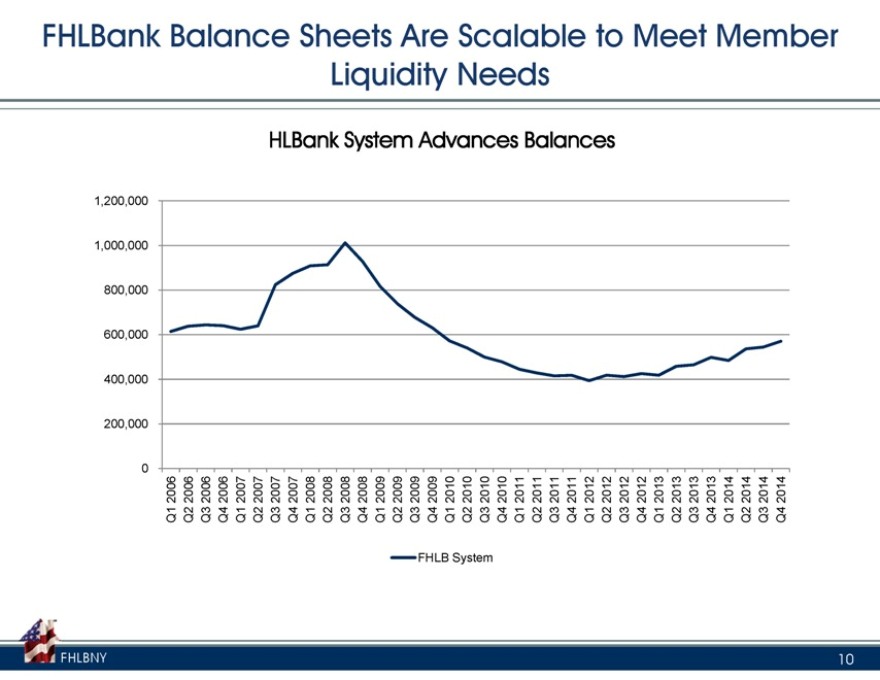
System Advances Have Grown in Recent Quarters
System Quarterly Change in Advances
FHLBNY 800 ,
0 200,000 400,000600,0000001,000,0001,200,000
Q1 2006 FHLBank Q2 2006 Q3 2006 Q4 2006 Q1 2007 Q2 2007 Q3 2007 Q4 2007 Balance Q1 2008 Q2 2008 Q3 2008 HLBank Q4 2008 Q1 2009 Q2 2009 Sheets Q3 2009 System FHLB Q4 2009 Liquidity Q1 2010 Are Q2 2010 System Q3 2010 Q4 2010 Q1 2011
Q2 2011 Advances Needs
Q3 2011 Q4 2011
Q1 2012 Scalable
Q2 2012 Q3 2012 to
Q4 2012 Balances
Q1 2013 Q2 2013
Q3 2013 Meet Q4 2013 Q1 2014 Q2 2014 Q3 2014 Q4 2014 Member
10
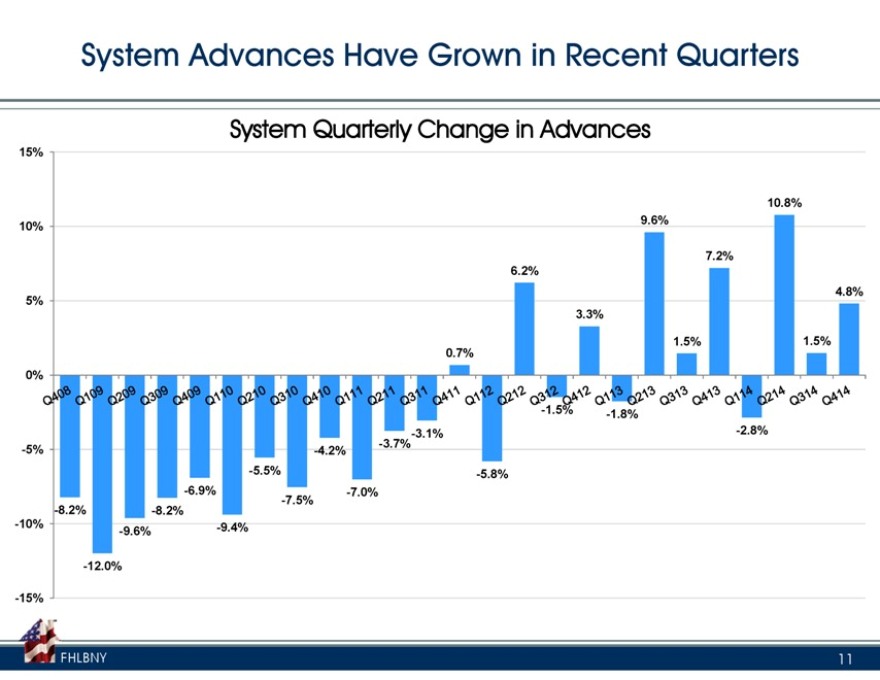
System Advances Have Grown in Recent Quarters
System Quarterly Change in Advances
15%
10.8%
9.6%
10%
7.2%
6.2%
.
5%
3.3%
1.5% 1.5%
0.7%
0%
-1.5% -1.8%
-3.1% -2.8%
-3.7%
-5% -4.2%
-5.5% -5.8%
-6.9% -7.0%
-7.5%
-8.2% -8.2%
-10% -9.4%
-9.6%
-12.0%
-15%
11
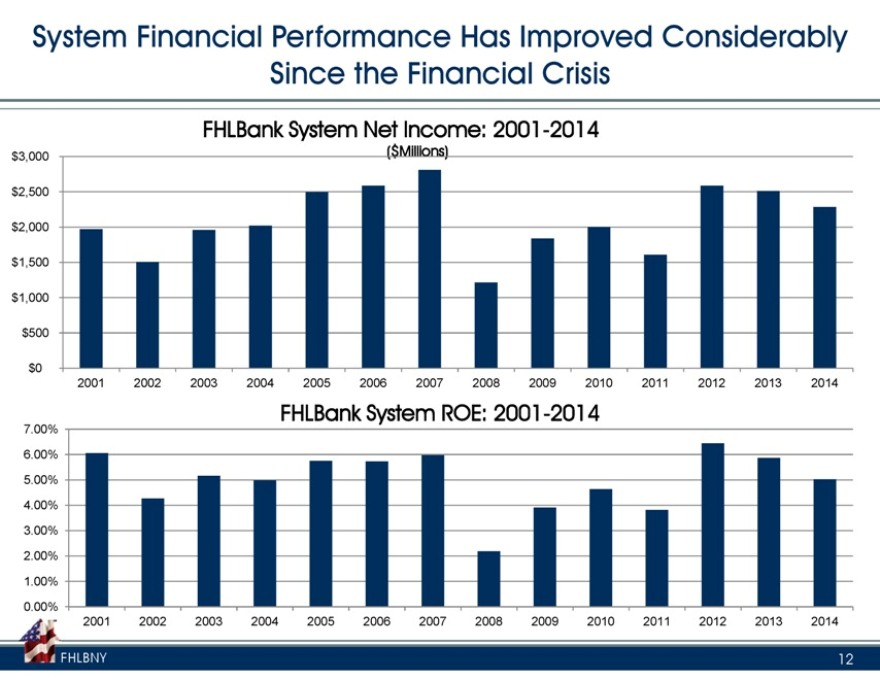
System Financial Performance Has Improved Considerably Since the Financial Crisis
FHLBank System Net Income: 2001-2014
$3,000
($Millions)
$2,500
$2,000
$1,500
$1,000
$500
$0
2001 2002 2003 2004 2005 2006 2007 2008 2009 2010 2011 2012 2013 2014
FHLBank System ROE: 2001-2014
7.00%
6.00%
5.00%
4.00%
3.00%
2.00%
1.00%
0.00%
2001 2002 2003 2004 2005 2006 2007 2008 2009 2010 2011 2012 2013 2014
FHLBNY 12
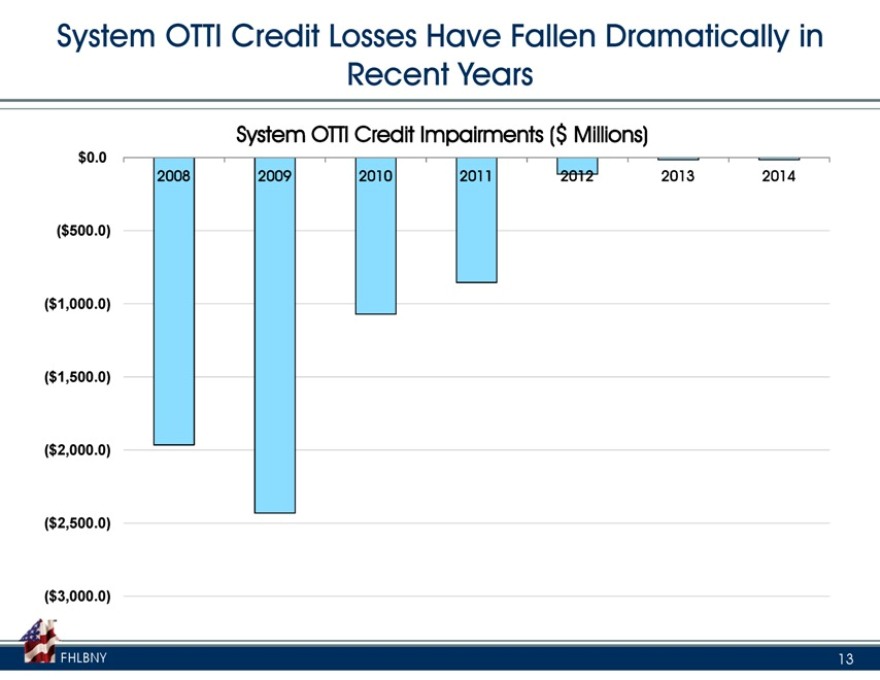
System OTTI Credit Losses Have Fallen Dramatically in Recent Years
System OTTI Credit Impairments ($ Millions)
$0.0
($500.0)
($1,000.0)
($1,500.0)
($2,000.0)
($2,500.0)
($3,000.0)
2008
2009
2012
2013
2014
FHLBNY
13
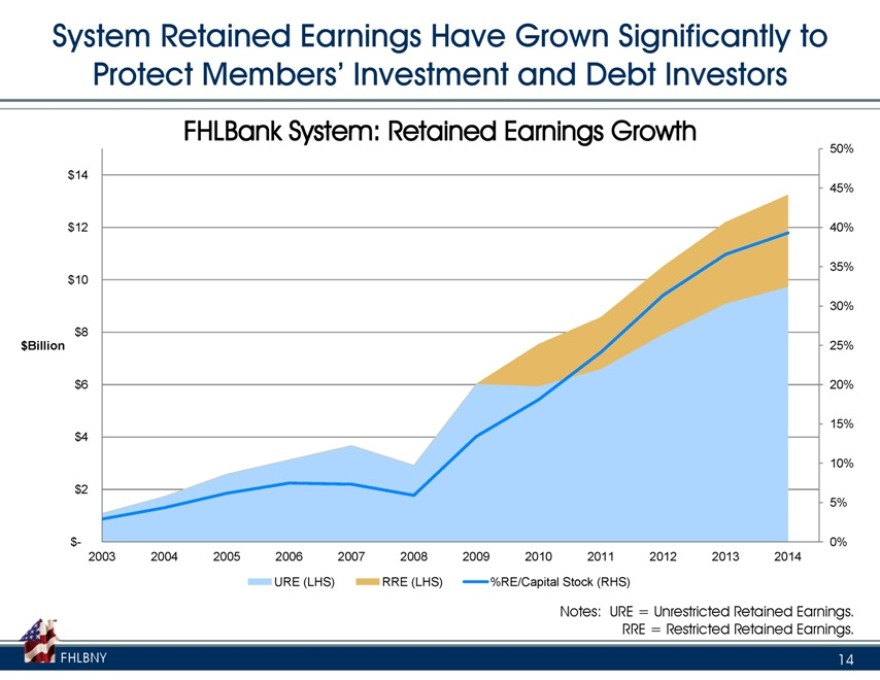
System Retained Earnings Have Grown Significantly to Protect Members’ Investment and Debt Investors
FHLBank System: Retained Earnings Growth
50%
$14
45%
$12 40%
35% $10
30%
$8 $Billion 25%
$6 20%
15% $4
10%
$2
5%
$- 0% 2003 2004 2005 2006 2007 2008 2009 2010 2011 2012 2013 2014
URE (LHS) RRE (LHS) %RE/Capital Stock (RHS)
Notes: URE = Unrestricted Retained Earnings. RRE = Restricted Retained Earnings.
FHLBNY 14
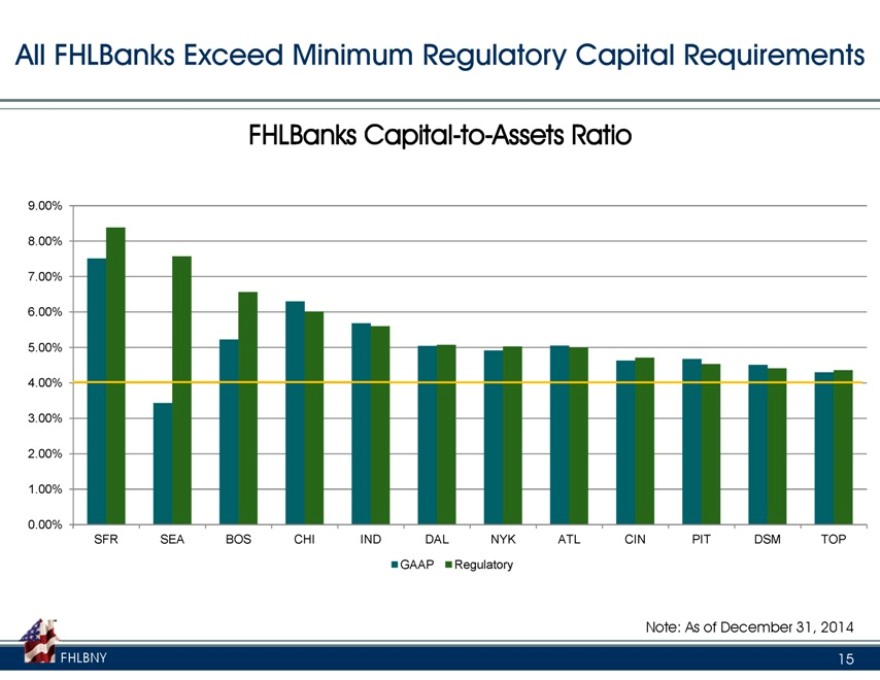
All FHLBanks Exceed Minimum Regulatory Capital Requirements
FHLBanks Capital-to-Assets Ratio
9.00%
8.00%
7.00%
6.00%
5.00%
4.00%
3.00%
2.00%
1.00%
0.00%
SFR SEA BOS CHI IND DAL NYK ATL CIN PIT DSM TOP
GAAP Regulatory
Note: As of December 31, 2014
FHLBNY 15
FHLBNY Business Update
Stockholders’ Meetings
April 2015
© 2015 FEDERAL HOME LOAN BANK OF NEW YORK • 101 PARK AVENUE • NEW YORK, NY 10178 • WWW.FHLBNY.COM
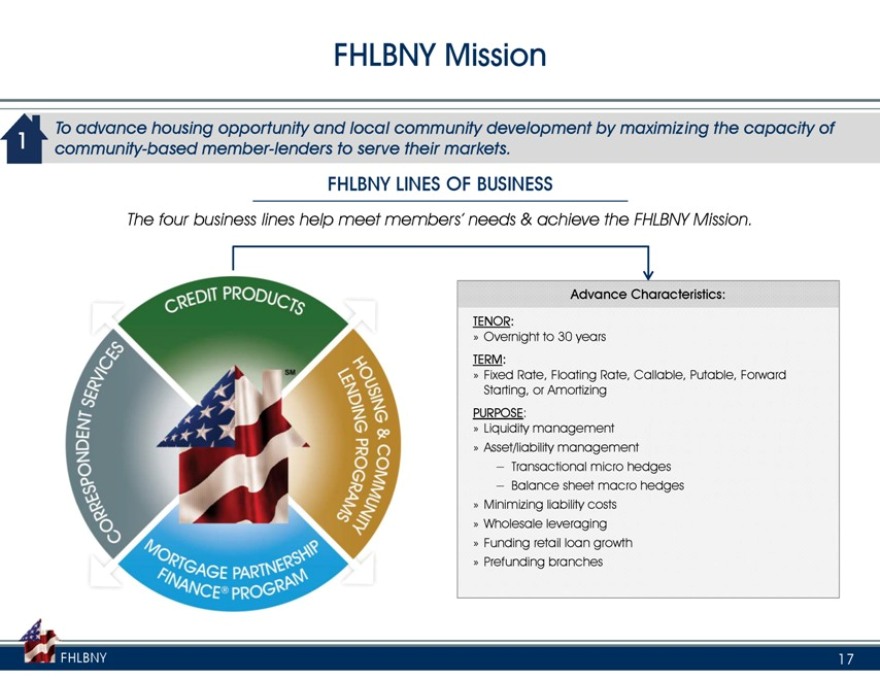
FHLBNY Mission
To advance housing opportunity and local community development by maximizing the capacity of 1 community-based member-lenders to serve their markets.
FHLBNY LINES OF BUSINESS
The four business lines help meet members’ needs & achieve the FHLBNY Mission.
Advance Characteristics:
TENOR:
» Overnight to 30 years
TERM:
» Fixed Rate, Floating Rate, Callable, Putable, Forward Starting, or Amortizing
PURPOSE:
» Liquidity management
» Asset/liability management
- Transactional micro hedges
- Balance sheet macro hedges
» Minimizing liability costs
» Wholesale leveraging
» Funding retail loan growth
» Prefunding branches
FHLBNY
17
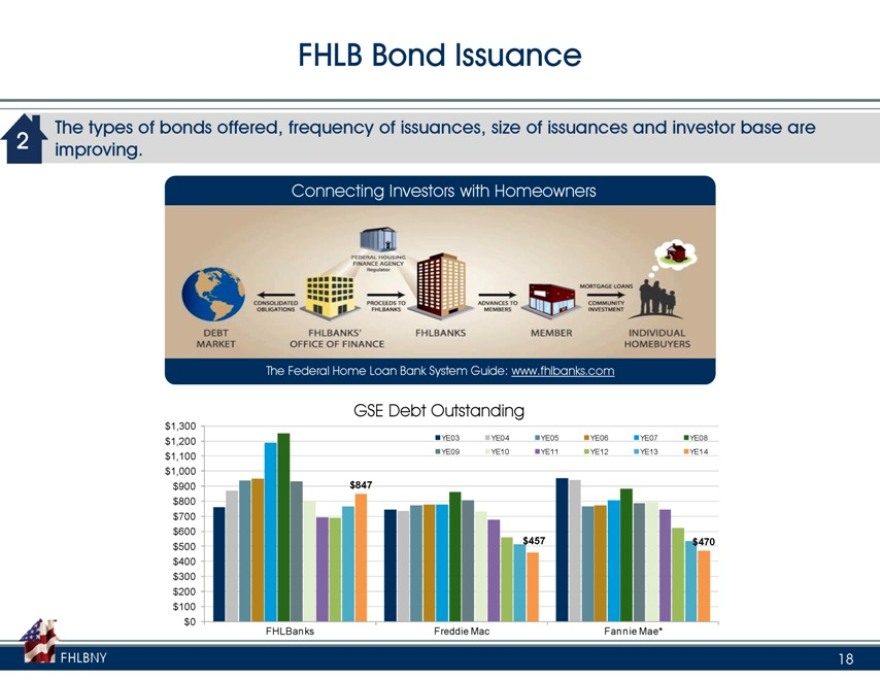
FHLB Bond Issuance
The types of bonds offered, frequency of issuances, size of issuances and investor base are 2 improving.
Connecting Investors with Homeowners
The Federal Home Loan Bank System Guide: www.fhlbanks.com
GSE Debt Outstanding
$1,300
$1,200 YE03 YE04 YE05 YE06 YE07 YE08 $1,100 YE09 YE10 YE11 YE12 YE13 YE14
$1,000 $900 $847 $800 $700 $600 $457 $470 $500 $400 $300 $200 $100
$0 FHLBanks Freddie Mac Fannie Mae*
FHLBNY 18
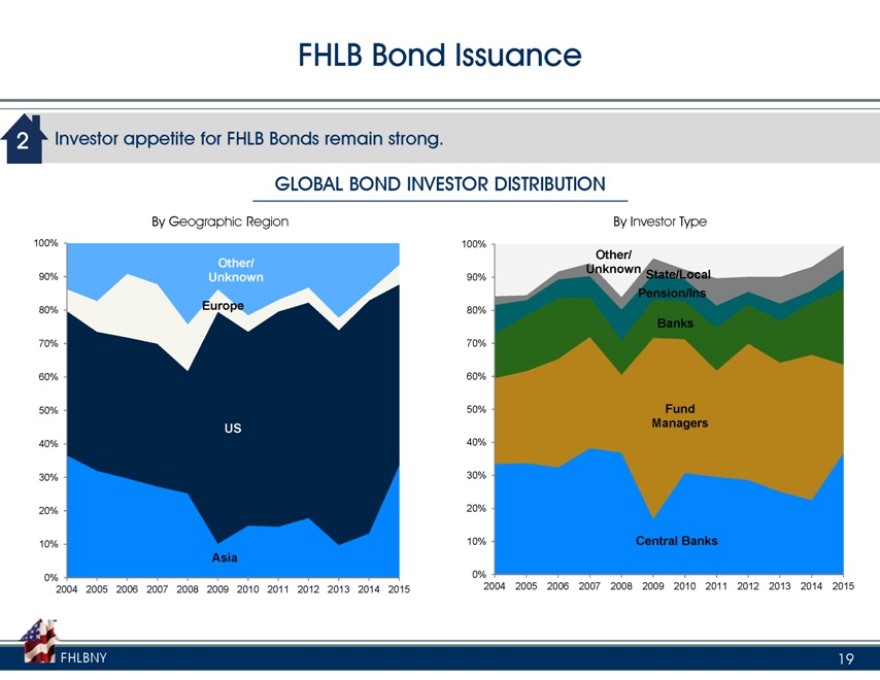
FHLB Bond Issuance
2 Investor appetite for FHLB Bonds remain strong.
GLOBAL BOND INVESTOR
By Geographic Region DISTRIBUTION By Investor Type
100% 100%
Other/ Other/
Unknown State/Local 90% Unknown 90% Pension/Ins
80% Europe 80%
Banks
70% 70%
60% 60%
50% 50% Fund
US Managers
40% 40%
30% 30%
20% 20%
10% 10% Central Banks Asia
0% 0%
2004 2005 2006 2007 2008 2009 2010 2011 2012 2013 2014 2015 2004 2005 2006 2007 2008 2009 2010 2011 2012 2013 2014 2015
FHLBNY
19
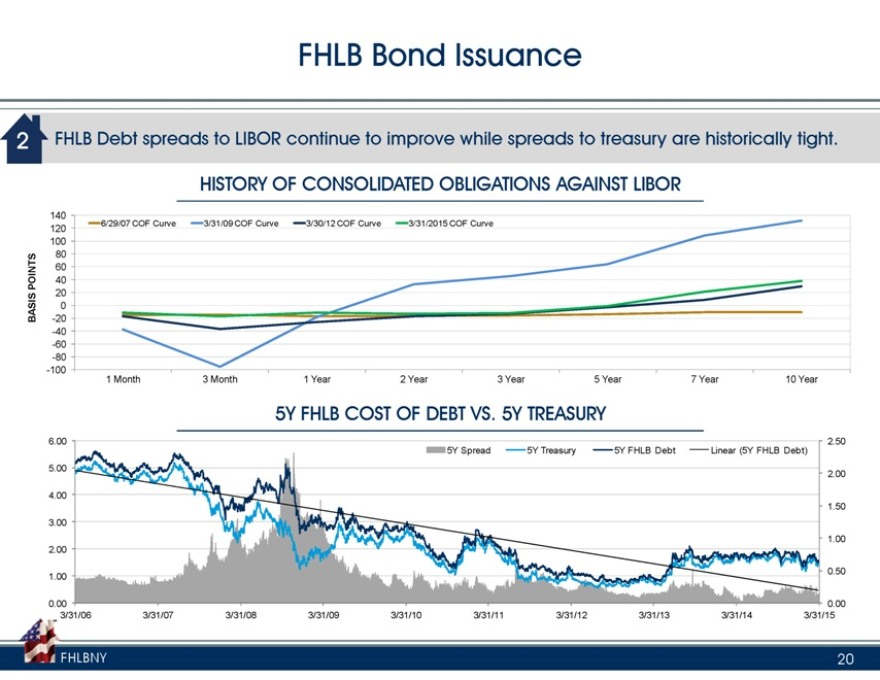
FHLB Bond Issuance
2 FHLB Debt spreads to LIBOR continue to improve while spreads to treasury are historically tight.
HISTORY OF CONSOLIDATED OBLIGATIONS AGAINST LIBOR
140 6/29/07 COF Curve 3/31/09 COF Curve 3/30/12 COF Curve 3/31/2015 COF Curve
120 100 80 60
POINTS 40
20 0
BASIS -20 -40 -60 -80
-100 1 Month 3 Month 1 Year 2 Year 3 Year 5 Year 7 Year 10 Year
5Y FHLB COST OF DEBT VS. 5Y TREASURY
6.00 2.50
5Y Spread 5Y Treasury 5Y FHLB Debt Linear (5Y FHLB Debt)
5.00
2.00
4.00
1.50
3.00
1.00
2.00
0.50 1.00
0.00 0.00 3/31/06 3/31/07 3/31/08 3/31/09 3/31/10 3/31/11 3/31/12 3/31/13 3/31/14 3/31/15
FHLBNY 20
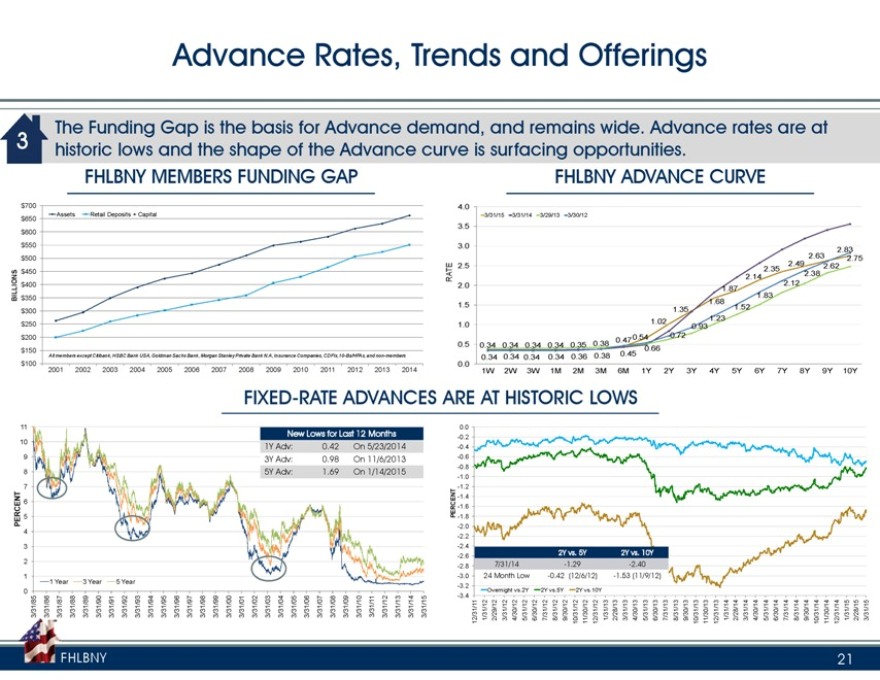
Advance Rates, Trends and Offerings
The Funding Gap is the basis for Advance demand, and remains wide. Advance rates are at historic 3 lows and the shape of the Advance curve is surfacing opportunities.
FHLBNY MEMBERS FUNDING GAP FHLBNY ADVANCE CURVE
$700 4.0
Assets Retail Deposits + Capital 3/31/15 3/31/14 3/29/13 3/30/12 $650
3.5 $600 $550 3.0
2.83 $500 2.63 2.75
2.5 2.49 2.62 $450 2.35
2.38 RATE 2.14 2.12 $400 2.0
LLIONS 1.87 1.83
BI $350
1.68
1.5 1.52 $300 1.35 $250 1.0 1.02 1.23
0.93 $200 0.54 0.72
0.47
0.5 0.34 0.34 0.34 0.34 0.35 0.38 $150 0.66
All members except Citibank, HSBC Bank USA, Goldman Sachs Bank, Morgan Stanley Private Bank N.A, Insurance Companies, CDFIs,10-Bs/HFAs, and non-members 0.34 0.34 0.34 0.34 0.36 0.38 0.45 $100 2001 2002 2003 2004 2005 2006 2007 2008 2009 2010 2011 2012 2013 2014 0.0
1W 2W 3W 1M 2M 3M 6M 1Y 2Y 3Y 4Y 5Y 6Y 7Y 8Y 9Y 10Y
FIXED-RATE ADVANCES ARE AT HISTORIC
11 LOWS 0.0
New Lows for Last 12 Months -0.2
10
1Y Adv: 0.42 On 5/23/2014 -0.4
9 3Y Adv: 0.98 On 11/6/2013 -0.6 -0.8
8 5Y Adv: 1.69 On 1/14/2015
-1.0
7 -1.2
6 -1.4
PERCENT -1.6
PERCENT 5 -1.8
4 -2.0 -2.2
3 -2.4 2Y vs. 5Y 2Y vs. 10Y
2 -2.6
-2.8 7/31/14 -1.29 -2.40
1 1 Year 3 Year 5 Year -30 . 24 Month Low -0.42 (12/6/12) -1.53 (11/9/12)
-3.2
0 -3.4 Overnight vs.2Y 2Y vs.5Y 2Y vs.10Y
3/31/85 3/31/86 3/31/87 3/31/88 3/31/89 3/31/90 3/31/91 3/31/92 3/31/93 3/31/94 3/31/95 3/31/96 3/31/97 3/31/98 3/31/99 3/31/00 3/31/01 3/31/02 3/31/03 3/31/04 3/31/05 3/31/06 3/31/07 3/31/08 3/31/09 3/31/10 3/31/11 3/31/12 3/31/13 3/31/14 3/31/15 12/31/11 1/31/12 2/29/12 3/31/12 4/30/12 5/31/12 6/30/12 7/31/12 8/31/12 9/30/12 10/31/12 11/30/12 12/31/12 1/31/13 2/28/13 3/31/13 4/30/13 5/31/13 6/30/13 7/31/13 8/31/13 9/30/13 10/31/13 11/30/13 12/31/13 1/31/14 2/28/14 3/31/14 4/30/14 5/31/14 6/30/14 7/31/14 8/31/14 9/30/14 10/31/14 11/30/14 12/31/14 1/31/15 2/28/15 3/31/15
FHLBNY 21
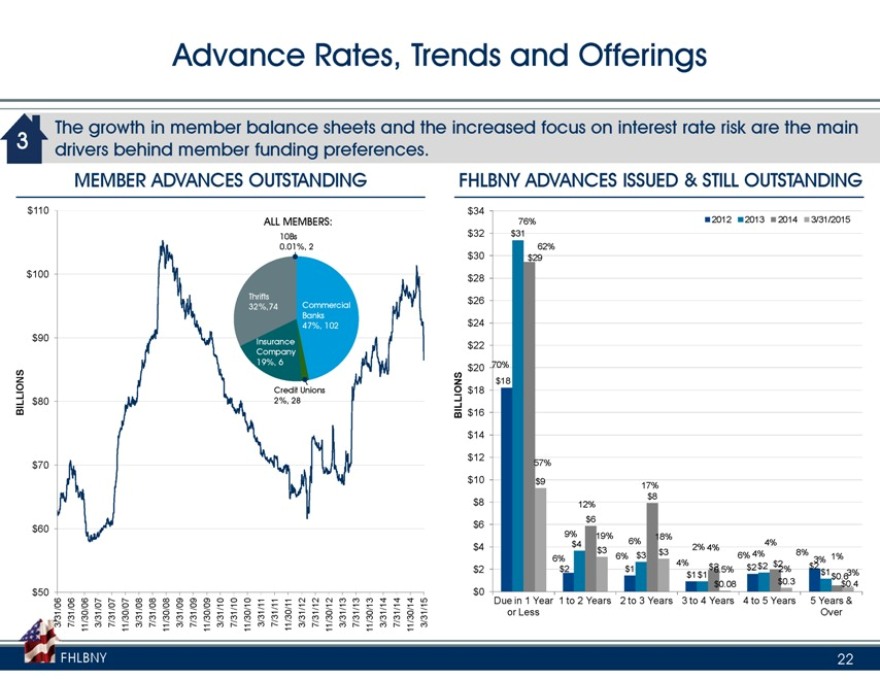
Advance Rates, Trends and Offerings
The growth in member balance sheets and the increased focus on interest rate risk are the main 3 drivers behind member funding preferences.
MEMBER ADVANCES OUTSTANDING
$110 $34
ALL MEMBERS:
10Bs $32
0.01%, 2 $30 $100 $28
Thrifts $26 32%,74 Commercial Banks 47%, 102 $24
$90 Insurance $22
Company 19%, 6 $20
NS NS
Credit Unions $18
BILLIO $80 2%, 28
BILLIO $16 $14
$12 $70 $10
$8
$60 $6 $4
$2
$50 $0
3/31/06 7/31/06 11/30/06 3/31/07 7/31/07 11/30/07 3/31/08 7/31/08 11/30/08 3/31/09 7/31/09 11/30/09 3/31/10 7/31/10 11/30/10 3/31/11 7/31/11 11/30/11 3/31/12 7/31/12 11/30/12 3/31/13 7/31/13 11/30/13 3/31/14 7/31/14 11/30/14 3/31/15
FHLBNY ADVANCES ISSUED & STILL OUTSTANDING
76% 2012 2013 2014 3/31/2015 $31
62%
$29
70%
$18
57%
$9
17% 12% $8 $6
9% 19% 6% 18%
$4 4%
$3 2% 4%
$3 $3 6% 4% 8%
6% 6% 3% 1%
4% $2 $2 $2
$2 $1 $0 2.5% $2 2%
$1 $1 $1 3% $0.6 $0.08 $0.3 $0.4
Due in 1 Year 1 to 2 Years 2 to 3 Years 3 to 4 Years 4 to 5 Years 5 Years & or Less Over
FHLBNY
22
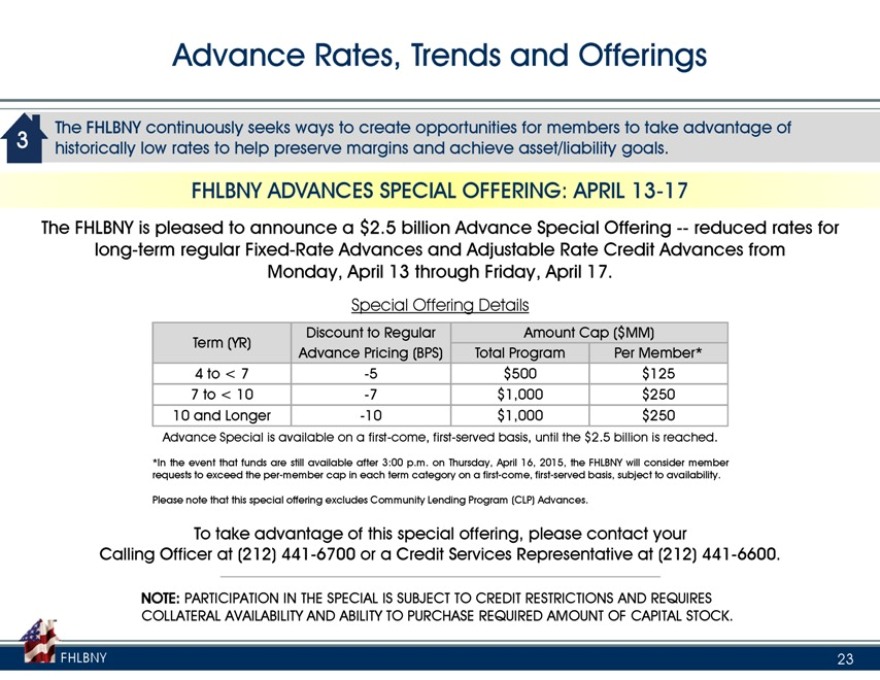
Advance Rates, Trends and Offerings
The FHLBNY continuously seeks ways to create opportunities for members to take advantage of historically 3 low rates to help preserve margins and achieve asset/liability goals.
FHLBNY ADVANCES SPECIAL OFFERING: APRIL 13-17
The FHLBNY is pleased to announce a $2.5 billion Advance Special Offering — reduced rates for long-term regular Fixed-Rate Advances and Adjustable Rate Credit Advances from Monday, April 13 through Friday, April 17.
Special Offering Details
Discount to Regular Amount Cap ($MM) Term (YR) Advance Pricing (BPS) Total Program Per Member* 4 to < 7 -5 $500 $125 7 to < 10 -7 $1,000 $250 10 and Longer -10 $1,000 $250
Advance Special is available on a first-come, first-served basis, until the $2.5 billion is reached.
*In the event that funds are still available after 3:00 p.m. on Thursday, April 16, 2015, the FHLBNY will consider member requests to exceed the per-member cap in each term category on a first-come, first-served basis, subject to availability.
Please note that this special offering excludes Community Lending Program (CLP) Advances.
To take advantage of this special offering, please contact your
Calling Officer at (212) 441-6700 or a Credit Services Representative at (212) 441-6600.
FHLBNY
NOTE: PARTICIPATION IN THE SPECIAL IS SUBJECT TO CREDIT RESTRICTIONS AND REQUIRES COLLATERAL AVAILABILITY AND ABILITY TO PURCHASE REQUIRED AMOUNT OF CAPITAL STOCK.
23
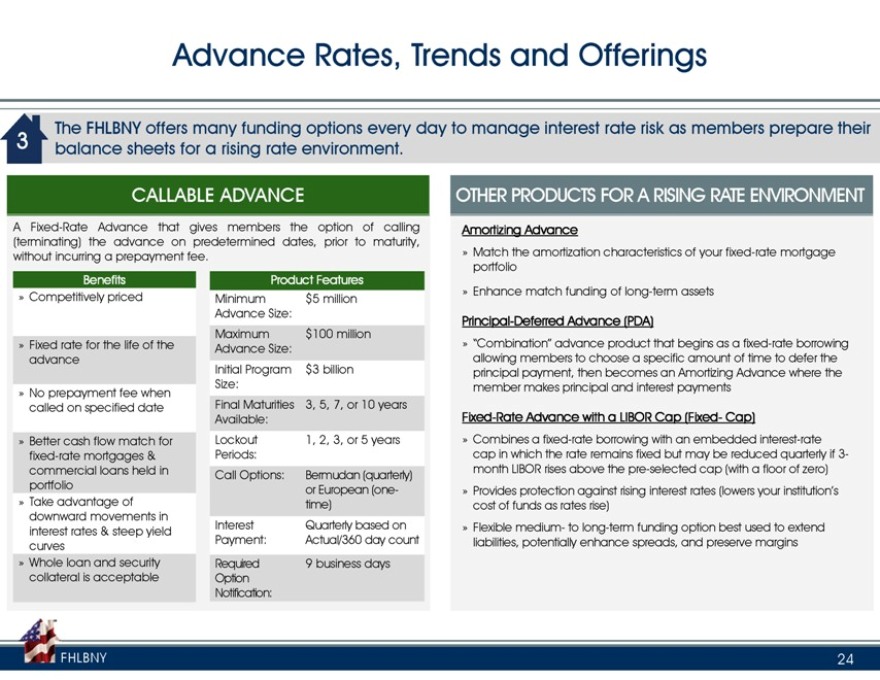
Advance Rates, Trends and Offerings
The FHLBNY offers many funding options every day to manage interest rate risk as members prepare their 3 balance sheets for a rising rate environment.
CALLABLE ADVANCE
A Fixed-Rate Advance that gives members the option of calling (terminating) the advance on predetermined dates, prior to maturity, without incurring a prepayment fee.
Benefits
» Competitively priced
» Fixed rate for the life of the advance
» No prepayment fee when called on specified date
» Better cash flow match for fixed-rate mortgages & commercial loans held in portfolio
» Take advantage of downward movements in interest rates & steep yield curves
» Whole loan and security collateral is acceptable
Product Features
Minimum $5 million Advance Size: Maximum $100 million Advance Size: Initial Program $3 billion Size: Final 3, 5, 7, or 10 years Maturities Available: Lockout 1, 2, 3, or 5 years Periods: Call Options: Bermudan (quarterly) or European (onetime) Interest Quarterly based on Payment: Actual/360 day count Required Option 9 business days Notification:
OTHER PRODUCTS FOR A RISING RATE ENVIRONMENT
Amortizing Advance
» Match the amortization characteristics of your fixed-rate mortgage portfolio
» Enhance match funding of long-term assets
Principal-Deferred Advance (PDA)
» “Combination” advance product that begins as a fixed-rate borrowing allowing members to choose a specific amount of time to defer the principal payment, then becomes an Amortizing Advance where the member makes principal and interest payments
Fixed-Rate Advance with a LIBOR Cap (Fixed- Cap)
» Combines a fixed-rate borrowing with an embedded interest-rate cap in which the rate remains fixed but may be reduced quarterly if 3-month LIBOR rises above the pre-selected cap (with a floor of zero)
» Provides protection against rising interest rates (lowers your institution’s cost of funds as rates rise)
» Flexible medium- to long-term funding option best used to extend liabilities, potentially enhance spreads, and preserve margins
24
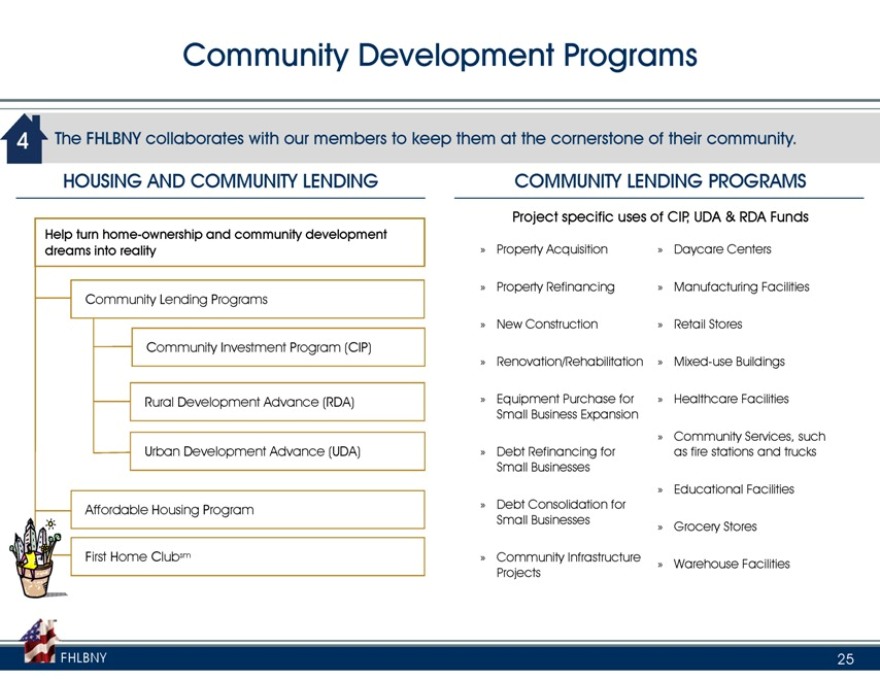
Community Development Programs
4 The FHLBNY collaborates with our members to keep them at the cornerstone of their community.
HOUSING AND COMMUNITY LENDING COMMUNITY LENDING PROGRAMS
Project specific uses of CIP, UDA & RDA
Help turn home-ownership and community development dreams Funds into reality » Property Acquisition » Daycare Centers
» Property Refinancing » Manufacturing Facilities
Community Lending Programs
» New Construction » Retail Stores
Community Investment Program (CIP)
» Renovation/Rehabilitation » Mixed-use Buildings
Rural Development Advance (RDA) » Equipment Purchase for » Healthcare Facilities Small Business Expansion
» Community Services, such Urban Development Advance (UDA) » Debt Refinancing for as fire stations and trucks Small Businesses
» Educational Facilities
Affordable Housing Program » Debt Consolidation for Small Businesses
» Grocery Stores
First Home Clubsm » Community Infrastructure
» Warehouse Facilities Projects
FHLBNY
25
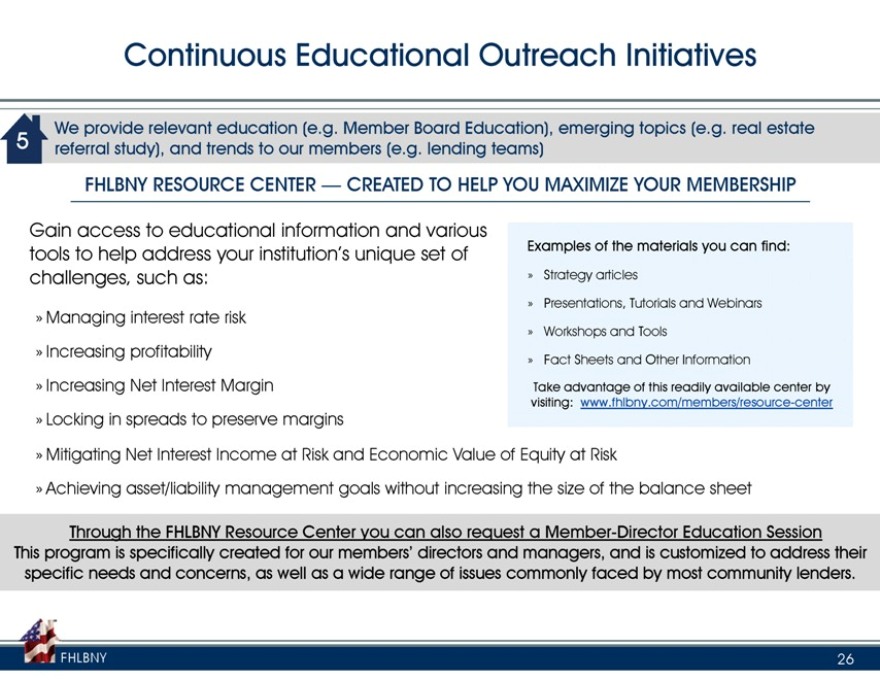
Continuous Educational Outreach Initiatives
We provide relevant education (e.g. Member Board Education), emerging topics (e.g. real estate referral 5 study), and trends to our members (e.g. lending teams)
FHLBNY RESOURCE CENTER — CREATED TO HELP YOU MAXIMIZE YOUR MEMBERSHIP
Gain access to educational information and various tools to help address your institution’s unique set of challenges,Examples of the materials you can find:
such as: » Strategy articles
»Managing interest rate risk » Presentations, Tutorials and Webinars
» Workshops and Tools
»Increasing profitability
» Fact Sheets and Other Information
»Increasing Net Interest Margin Take advantage of this readily available center by visiting: www.fhlbny.com/members/resource-center
»Locking in spreads to preserve margins
»Mitigating Net Interest Income at Risk and Economic Value of Equity at Risk
»Achieving asset/liability management goals without increasing the size of the balance sheet
Through the FHLBNY Resource Center you can also request a Member-Director Education Session This program is specifically created for our members’ directors and managers, and is customized to address their specific needs and concerns, as well as a wide range of issues commonly faced by most community lenders.
FHLBNY
26
Advancing Housing and Community Growth
212-681-6000
www.fhlbny.com
The information provided by the Federal Home Loan Bank of New York (FHLBNY) in this communications is set forth for informational purposes only. The information should not be construed as an opinion, recommendation or solicitation regarding the use of any financial strategy and/or the purchase or sale of any financial instrument. All customers are advised to conduct their own independent due diligence before making any financial decisions. Please note that the past performance of any FHLBNY service or product should not be viewed as a guarantee of future results. Also, the information presented here and/or the services or products provided by the FHLBNY may change at any time without notice.
101 PARK AVENUE • NEW YORK, NY 10178 • WWW.FHLBNY.COM