Attached files
| file | filename |
|---|---|
| 8-K - 8-K - CHARTER COMMUNICATIONS, INC. /MO/ | chtr413158k.htm |
| EX-99.1 - EXHIBIT 99.1 - CHARTER COMMUNICATIONS, INC. /MO/ | exh991chtr413158k.htm |

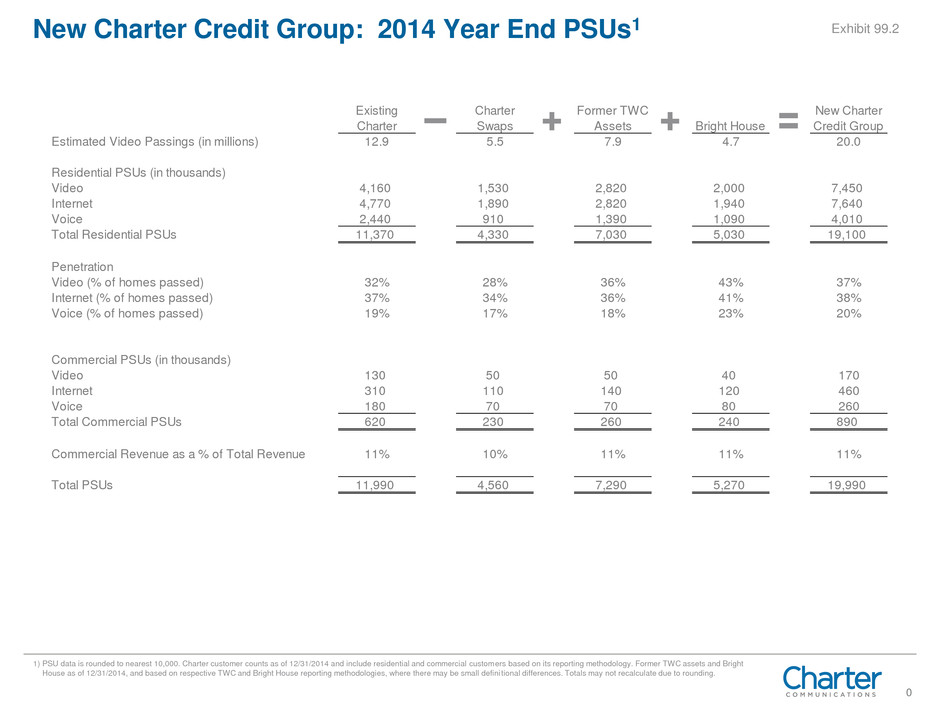
0 Existing Charter Charter Swaps Former TWC Assets Bright House New Charter Credit Group Estimated Video Passings (in millions) 12.9 5.5 7.9 4.7 20.0 Residential PSUs (in thousands) Video 4,160 1,530 2,820 2,000 7,450 Internet 4,770 1,890 2,820 1,940 7,640 Voice 2,440 910 1,390 1,090 4,010 Total Residential PSUs 11,370 4,330 7,030 5,030 19,100 Penetration Video (% of homes passed) 32% 28% 36% 43% 37% Internet (% of homes passed) 37% 34% 36% 41% 38% Voice (% of homes passed) 19% 17% 18% 23% 20% Commercial PSUs (in thousands) Video 130 50 50 40 170 Internet 310 110 140 120 460 Voice 180 70 70 80 260 Total Commercial PSUs 620 230 260 240 890 Commercial Revenue as a % of Total Revenue 11% 10% 11% 11% 11% Total PSUs 11,990 4,560 7,290 5,270 19,990 New Charter Credit Group: 2014 Year End PSUs1 1) PSU data is rounded to nearest 10,000. Charter customer counts as of 12/31/2014 and include residential and commercial customers based on its reporting methodology. Former TWC assets and Bright House as of 12/31/2014, and based on respective TWC and Bright House reporting methodologies, where there may be small defini tional differences. Totals may not recalculate due to rounding. Exhibit 99.2

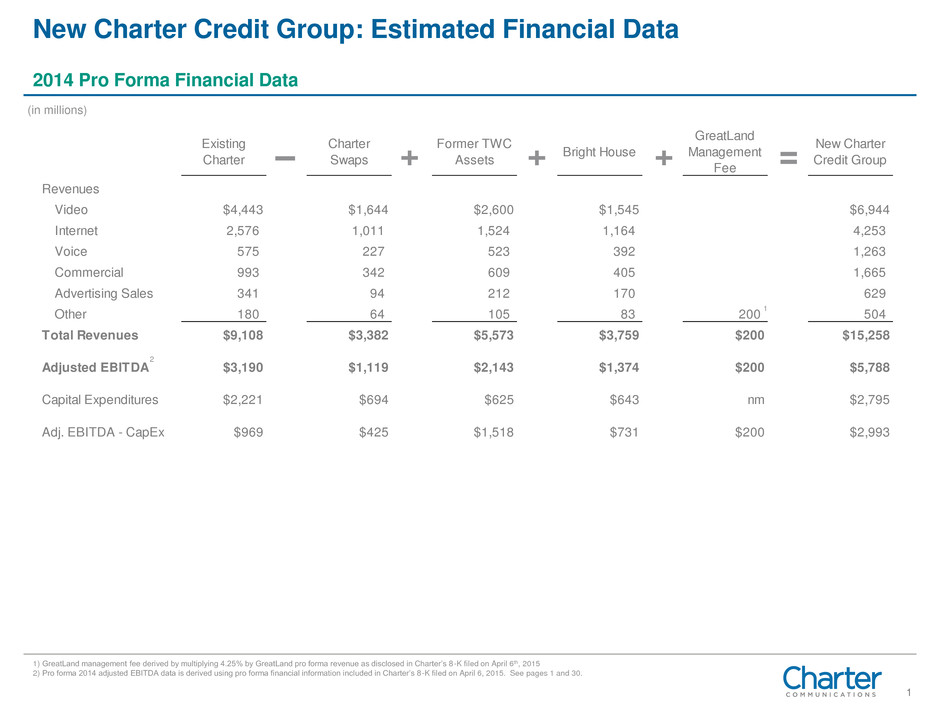
1 Existing Charter Charter Swaps Former TWC Assets Bright House GreatLand Management Fee New Charter Credit Group Revenues Video $4,443 $1,644 $2,600 $1,545 $6,944 Internet 2,576 1,011 1,524 1,164 4,253 Voice 575 227 523 392 1,263 Commercial 993 342 609 405 1,665 Advertising Sales 341 94 212 170 629 Other 180 64 105 83 200 504 Total Revenues $9,108 $3,382 $5,573 $3,759 $200 $15,258 Adjusted EBITDA $3,190 $1,119 $2,143 $1,374 $200 $5,788 Capital Expenditures $2,221 $694 $625 $643 nm $2,795 Adj. EBITDA - CapEx $969 $425 $1,518 $731 $200 $2,993 New Charter Credit Group: Estimated Financial Data 1) GreatLand management fee derived by multiplying 4.25% by GreatLand pro forma revenue as disclosed in Charter’s 8-K filed on April 6th, 2015 2) Pro forma 2014 adjusted EBITDA data is derived using pro forma financial information included in Charter’s 8-K filed on April 6, 2015. See pages 1 and 30. 2014 Pro Forma Financial Data 1 2 (in millions)

2 GAAP Reconciliations - + + + + + = Existing Charter Former Pro Forma (1) Pro Forma (1) GreatLand New Charter Charter Swaps TWC Assets Adjustments Bright House Adjustments Management Fee Credit Group Consolidated net income (loss) (183) (178) 757 (324) 751 (248) 200 775 Plus: Interest expense, net 911 (1) - 297 38 37 - 1,282 Income tax expense (benefit) 236 (119) 467 (208) - - - 376 Depreciation and amortization 2,102 (724) 724 294 416 377 - 3,189 Shared asset charge - (52) 115 - - - - 63 Stock compenation expense 55 (21) 29 - 5 - - 68 Loss on extinguishment of debt - - - - - - - - Equity in income of investee - - - (35) - - - (35) (Gain) loss on deriviative instruments, net 7 - - - - - - 7 Other, net 62 (24) 1 26 (5) 3 - 63 Adjusted EBITDA(2) 3,190$ (1,119)$ 2,093$ 50$ 1,205$ 169$ 200$ 5,788$ UNAUDITED RECONCILIATION OF NON-GAAP MEASURES TO GAAP MEASURES (DOLLARS IN MILLIONS) (1) Pro forma results reflect certain acquisitions of cable systems as if they occurred as of January 1, 2012. (2) Adjusted EBITDA is defined as net loss plus net interest expense, income taxes, depreciation and amortization, stock compensation expense, loss on extinguishment of debt, (gain) loss on derivative instruments, net, and other operating expenses, such as merger and acquisition costs, special charges and (gain) loss on sale or retirement of assets. As such, it eliminates the significant non-cash depreciation and amortization expense that results from the capital-intensive nature of our businesses as well as other non-cash or non-recurring items, and is unaffected by our capital structure or investment activities. The above schedules are presented in order to reconcile adjusted EBITDA, a non-GAAP measure, to the most directly comparable GAAP measure in accordance with Section 401(b) of the Sarbanes-Oxley Act.
