Attached files
| file | filename |
|---|---|
| EX-5.1 - Mr. Amazing Loans Corp | ex5-1.htm |
| EX-3.4 - Mr. Amazing Loans Corp | ex3-4.htm |
| EX-10.7 - Mr. Amazing Loans Corp | ex10-7.htm |
| EX-23.1 - Mr. Amazing Loans Corp | ex23-1.htm |
As filed with the Securities and Exchange Commission April 9, 2015
Registration Statement No. 333-200918
UNITED STATES
SECURITIES AND EXCHANGE COMMISSION
WASHINGTON, D.C. 20549
Amendment No. 2
to
FORM S-1
REGISTRATION STATEMENT UNDER THE SECURITIES ACT OF 1933
IEG Holdings Corporation
(Exact name of registrant as specified in its charter)
| Florida | 6141 | 65-0888146 | ||
| (State or other jurisdiction of incorporation or organization) |
(Primary Standard Industrial Classification Code Number) |
(I.R.S. Employer Identification No.) |
6160 West Tropicana Ave, Suite E-13
Las Vegas, NV 89103
(702) 227-5626
(Address, including zip code, and telephone number, including area code, of registrant’s principal executive offices)
Paul Mathieson
Chief Executive Officer
6160 West Tropicana Ave, Suite E-13
Las Vegas, NV 89103
(702) 227-5626
(Name, address and telephone number of agent for service)
With copies to:
Laura Anthony, Esq.
Legal & Compliance, LLC
330 Clematis Street, Suite 217
West Palm Beach, FL 33401
Phone: (800) 341-2684
Approximate date of proposed sale to public: As soon as practicable after this registration statement becomes effective.
If any of the securities being registered on the Form are to be offered on a delayed or continuous basis pursuant to Rule 415 under the Securities Act of 1933, check the following box: [X]
If this Form is filed to register additional securities for an offering pursuant to Rule 462(b) under the Securities Act, please check the following box and list the Securities Act registration statement number of the earlier effective registration statement for the same offering: [ ]
If this Form is a post-effective amendment filed pursuant to Rule 462(c) under the Securities Act, please check the following box and list the Securities Act registration statement number of the earlier registration statement for the same offering: [ ]
If this Form is a post-effective amendment filed pursuant to Rule 462(d) under the Securities Act, check the following box and list the Securities Act registration statement number of the earlier registration statement for the same offering: [ ]
Indicate by check mark whether registrant is a large accelerated filer, an accelerated filer, a non-accelerated filer, or a smaller reporting company. See definitions of “large accelerated filer,” “accelerated filer,” and “smaller reporting company” in Rule 12b-2 of the Exchange Act. (Check one):
| Large accelerated filer | [ ] | Accelerated filer | [ ] |
| Non-accelerated filer | [X] (Do not check if a smaller reporting company) | Smaller reporting company | [ ] |
The registrant hereby amends this registration statement on such date or dates as may be necessary to delay its effective date until the registrant shall file a further amendment which specifically states that this registration statement shall thereafter become effective in accordance with Section 8(a) of the Securities Act of 1933 or until the registration statement shall become effective on such date as the Commission, acting pursuant to Section 8(a) may determine.
The information in this prospectus is not complete and may be changed. The selling stockholders may not sell these securities until the registration statement filed with the Securities and Exchange Commission is effective. This prospectus is not an offer to sell these securities and is not soliciting an offer to buy these securities in any state where the offer or sale is not permitted.
| PRELIMINARY PROSPECTUS | SUBJECT TO COMPLETION, DATED APRIL 9, 2015 |
170,290,274 Shares
IEG Holdings Corporation
Common Stock
This prospectus relates to the resale of up to 170,290,274 shares of our common stock by the selling stockholders named in this prospectus. This prospectus may be used by the selling stockholders named herein to resell, from time to time, those shares of our common stock included herein. For information about the selling stockholders see “Principal and Selling Stockholders” on page 27 . Our common stock is presently quoted on the Pink Current Information tier of the OTC Markets Group, Inc. under the trading symbol “IEGH”. On March 13, 2015, the last sale price of our common stock as reported by the OTC Markets was $0.51 per share with respect to an insignificant volume of shares.
We will not receive any of the proceeds from the sale of the shares of common stock by the selling stockholders. The selling stockholders will sell their shares at a fixed price of $0.50 per share; provided, however, that (i) if and when our common stock is quoted on the OTCQB Marketplace or the OTCQX Marketplace, or is traded on The Nasdaq Stock Market, Inc. (“ Nasdaq ”) or another exchange, the selling stockholders may sell their shares at prevailing market prices or privately negotiated prices; and (ii) to the extent that we effect a reverse stock split after the date of this prospectus, the per share fixed price of the selling stockholders’ shares offered hereby will be adjusted in accordance with the reverse stock split ratio. See “Determination of Offering Price” and “Plan of Distribution.”
The selling stockholders, and any participating broker-dealers, may be deemed to be “underwriters” within the meaning of the Securities Act of 1933, as amended (the “Securities Act”), and any commissions or discounts given to any such broker-dealer may be regarded as underwriting commissions or discounts under the Securities Act. The selling stockholders have informed us that they do not have any agreement or understanding, directly or indirectly, with any person to distribute their common stock. We will be responsible for all fees and expenses incurred in connection with the preparation and filing of the registration statement of which this prospectus is a part; provided, however, that we will not be required to pay any underwriters’ discounts or commissions relating to the securities covered by the registration statement.
We have applied to list our common stock on NASDAQ under the symbol “IEGH” There is no assurance that this application will be approved. In order to meet the minimum share price listing requirement for our common stock on NASDAQ, we expect to effect a reverse stock split of our common stock subsequent to the effective date of the registration statement of which this prospectus is a part. No reverse stock split may be effected without board and stockholder approval. If we do not meet NASDAQ’s minimum share price or other listing requirements, our listing application will not be approved by NASDAQ.
We are an “emerging growth company” as defined in the Securities and Exchange Commission (“SEC”) rules and we will be subject to reduced public reporting requirements. See “Emerging Growth Company Status.” Our common stock is subject to the “penny stock” rules of the SEC.
Persons effecting transactions in the shares should confirm the registration of these securities under the securities laws of the states in which transactions occur or the existence of applicable exemptions from such registration.
THE SHARES BEING OFFERED ARE HIGHLY SPECULATIVE AND INVOLVE A HIGH DEGREE OF RISK. THEY SHOULD BE CONSIDERED ONLY BY PERSONS WHO CAN AFFORD THE LOSS OF THEIR ENTIRE INVESTMENT. SEE “RISK FACTORS” BEGINNING ON PAGE 7 OF THIS PROSPECTUS FOR A DISCUSSION OF INFORMATION THAT SHOULD BE CONSIDERED IN CONNECTION WITH AN INVESTMENT IN OUR SECURITIES.
NEITHER THE SECURITIES AND EXCHANGE COMMISSION NOR ANY STATE SECURITIES COMMISSION HAS APPROVED OR DISAPPROVED OF THESE SECURITIES OR PASSED UPON THE ADEQUACY OR ACCURACY OF THIS PROSPECTUS. ANY REPRESENTATION TO THE CONTRARY IS A CRIMINAL OFFENSE.
You should rely only on the information contained in this prospectus. We have not, and the selling stockholders have not, authorized anyone to provide you with different information from that contained in this prospectus or in any free writing prospectus that we may authorize. The information contained in this prospectus is accurate only as of the date of this prospectus, regardless of the time of delivery of this prospectus or of any sale of our common stock. This prospectus does not constitute an offer to sell, or a solicitation of an offer to buy the securities in any circumstances under which the offer or solicitation is unlawful. Neither the delivery of this prospectus nor any distribution of securities in accordance with this prospectus shall, under any circumstances, imply that there has been no change in our affairs since the date of this prospectus.
The date of this prospectus is ______________, 2015.
| i |
TABLE OF CONTENTS
No dealer, salesperson or other individual has been authorized to give any information or to make any representation other than those contained in this prospectus in connection with the offer made by this prospectus and, if given or made, such information or representations must not be relied upon as having been authorized by us or the selling stockholders. This prospectus does not constitute an offer to sell or a solicitation of an offer to buy any securities in any jurisdiction in which such an offer or solicitation is not authorized or in which the person making such offer or solicitation is not qualified to do so, or to any person to whom it is unlawful to make such offer or solicitation. Neither the delivery of this prospectus nor any sale made hereunder shall, under any circumstances, create any implication that there has been no change in our affairs or that information contained herein is correct as of any time subsequent to the date hereof.
For investors outside the United States: We have not and the selling stockholders have not done anything that would permit this offering or possession or distribution of this prospectus in any jurisdiction where action for that purpose is required, other than in the United States. Persons outside the United States who come into possession of this prospectus must inform themselves, and observe any restrictions relating to, the offering of the shares of our common stock and the distribution of this prospectus outside the United States.
| 2 |
CAUTIONARY STATEMENT REGARDING FORWARD-LOOKING STATEMENTS
This prospectus includes “forward-looking statements” within the meaning of the federal securities laws that involve risks and uncertainties. Forward-looking statements include statements we make concerning our plans, objectives, goals, strategies, future events, future revenues or performance, capital expenditures, financing needs and other information that is not historical information. Some forward-looking statements appear under the headings “Prospectus Summary,” “Risk Factors,” “Management’s Discussion and Analysis of Financial Condition and Results of Operations’” and “Business.” When used in this prospectus, the words “estimates,” “expects,” “anticipates,” “projects,” “forecasts,” “plans,” “intends,” “believes,” “foresees,” “seeks,” “likely,” “may,” “might,” “will,” “should,” “goal,” “target” or “intends” and variations of these words or similar expressions (or the negative versions of any such words) are intended to identify forward-looking statements. All forward-looking statements are based upon information available to us on the date of this prospectus.
These forward-looking statements are subject to risks, uncertainties and other factors, many of which are outside of our control, that could cause actual results to differ materially from the results discussed in the forward-looking statements, including, among other things, the matters discussed in this prospectus in the sections captioned “Prospectus Summary,” “Risk Factors,” “Management’s Discussion and Analysis of Financial Condition and Results of Operations’” and “Business.” Some of the factors that we believe could affect our results include:
| ● | limitations on our ability to continue operations and implement our business plan; | |
| ● | our history of operating losses; | |
| ● | the timing of and our ability to obtain financing on acceptable terms; | |
| ● | the effects of changing economic conditions; | |
| ● | the loss of members of the management team or other key personnel; | |
| ● | competition from larger, more established companies with greater economic resources than we have; | |
| ● | costs and other effects of legal and administrative proceedings, settlements, investigations and claims, which may not be covered by insurance; | |
| ● | costs and damages relating to pending and future litigation; | |
| ● | control by our principal equity holders; and | |
| ● | the other factors set forth herein, including those set forth under “Risk Factors.” |
There are likely other factors that could cause our actual results to differ materially from the results referred to in the forward-looking statements. All forward-looking statements attributable to us in this prospectus apply only as of the date of this prospectus and are expressly qualified in their entirety by the cautionary statements included in this prospectus. We undertake no obligation to publicly update or revise forward-looking statements to reflect events or circumstances after the date made or to reflect the occurrence of unanticipated events, except as required by law.
We are responsible for the disclosure in this prospectus. However, this prospectus includes industry data that we obtained from internal surveys, market research, publicly available information and industry publications. The market research, publicly available information and industry publications that we use generally state that the information contained therein has been obtained from sources believed to be reliable. The information therein represents the most recently available data from the relevant sources and publications and we believe remains reliable. We did not fund and are not otherwise affiliated with any of the sources cited in this prospectus. Forward-looking information obtained from these sources is subject to the same qualifications and additional uncertainties regarding the other forward-looking statements in this prospectus.
| 3 |
This summary highlights material information concerning our business and this offering. This summary does not contain all of the information that you should consider before making your investment decision. You should carefully read the entire prospectus and the information incorporated by reference into this prospectus, including the information presented under the section entitled “Risk Factors” and the financial data and related notes, before making an investment decision. This summary contains forward-looking statements that involve risks and uncertainties. Our actual results may differ significantly from future results contemplated in the forward-looking statements as a result of factors such as those set forth in “Risk Factors” and “Cautionary Statement Regarding Forward-Looking Statements.” All historical information in this prospectus has been adjusted to reflect the 1-for-6 reverse stock split of our common stock that was effective February 22, 2013.
In this prospectus, unless the context indicates otherwise, “IEG Holdings,” the “Company,” “we,” “our,” “ours” or “us” refer to IEG Holdings Corporation, a Florida corporation, and its subsidiaries.
Our Company
We were organized as a Florida corporation on January 21, 1999, under the name Interact Technologies, Inc. (“Interact”). Interact was formed for the purpose of acquiring certain medical technology. On February 18, 1999, we changed our name to Fairhaven Technologies, Inc. (“Fairhaven”). Fairhaven’s business plan continued to involve the acquisition of certain medical technology. By June 1999, Fairhaven abandoned its business plan and had no operations until December 2001. On December 14, 2001, we changed our name to Ideal Accents, Inc. Ideal Accents, Inc. was engaged primarily in the business of accessorizing cars and trucks at the new vehicle dealer level. Ideal Accents, Inc. ceased operations in 2005. We changed our name to IEG Holdings Corporation in February 2013. Since March 2013, we have been engaged in the business of providing unsecured consumer loans ranging from $2,000 - $10,000 and offer loans online under the consumer brand “Mr. Amazing Loans”. Beginning in 2014, the Company changed its loan terms, such that it offers loans ranging from $5,000 to $10,000. The Company is headquartered in Las Vegas, Nevada and currently originates direct consumer loans in the states of Arizona, Florida, Georgia, Illinois, Missouri, New Jersey, Nevada, Oregon, Pennsylvania, Texas, Utah and Virginia via its website and online distribution network. The Company is a fully licensed consumer installment loan provider in the 12 states in which it operates and offers all loans within the prevailing statutory rates.
We have five wholly owned subsidiaries, each of which is described below:
| ● | Investment Evolution Global Corporation (“IEGC”): Our subsidiary that holds our intellectual property and global rights to the Mr. Amazing Loans business. | |
| ● | Investment Evolution Corporation (“IEC”): Our U.S. operating entity that holds all state licenses, leases, employee contracts and other operating and administrative expenses. | |
| ● | IEC SPV, LLC (“SPV”): A bankruptcy remote special purpose vehicle that holds the Company’s U.S. loan receivables. | |
| ● | Investment Evolution Philippines Corporation (“IE Philippines ”): Our wholly owned subsidiary that currently has no operations. We are considering expansion into the Philippines in 2015 or 2016. To the extent we go forward with this expansion, we expect that IE Philippines will be our operating entity for Philippine operations. | |
| ● | Investment Evolution Canada Corporation (“IE Canada”): Our Canadian operating entity formed on January 2, 2015. The entity is currently dormant, with plans to be used upon establishing online operations for Canada. |
In 2005, Paul Mathieson, our Chief Executive Officer and a member of our Board of Directors, founded IEG Holdings Limited (“IEG”) in Sydney, Australia. IEG launched the Amazing Loans business in Australia in 2005 and the Mr. Amazing Loans business in the United States via IEGC in 2010. From 2005 until 2012, Mr. Mathieson operated the Amazing Loans business through IEG in Australia. During that time, IEG lent approximately $48 million to over 11,500 borrowers in Australia. IEG ceased doing business in Australia in 2012. On January 28, 2013, IEGC entered into a stock exchange agreement (the “Stock Exchange Agreement”) among IEGC, its sole shareholder, IEG, and our company. Under the terms of the Stock Exchange Agreement, we agreed to acquire a 100% interest in IEGC for 272,447,137 shares of our common stock after giving effect to a 1-for-6 reverse stock split. On February 14, 2013, we filed amended articles of incorporation (the “Amended Articles”) with the Secretary of State of Florida which had the effect of:
| ● | changing our name from Ideal Accents, Inc. to IEG Holdings Corporation, | |
| ● | increasing the number of shares of our authorized common stock to 1,000,000,000, $.001 par value, | |
| ● | creating 50,000,000 shares of “blank-check” preferred stock, and | |
| ● | effecting a 1-for-6 reverse stock split of our issued and outstanding common stock (the “Reverse Stock Split”) pursuant to the terms of the Stock Exchange Agreement. |
FINRA approved our Amended Articles on March 11, 2013.
On March 13, 2013, we completed the acquisition of IEGC under the terms of the Stock Exchange Agreement and issued to IEG 272,447,137 shares of our common stock after giving effect to the Reverse Stock Split whereby we acquired a 100% interest in IEGC. The stock exchange agreement between IEGC, IEG and the Company resulted in a reverse acquisition with a public shell, with IEGC being the accounting acquirer. The Company issued 90,815 shares of its common stock to the shareholders of IEG (IEG transferred its ownership in IEGC to its shareholders, which is why the shares were issued to the ultimate shareholders of IEG rather than to IEG itself) for each share of IEGC, in exchange for 100% ownership interest in IEGC. We determined that IEGC was the accounting acquirer because of the following facts and circumstances:
| 1. | After consummation of the transaction, the ultimate shareholders of IEGC own 99.1% of the outstanding shares of the Company; | |
| 2. | The board of directors of the Company immediately after the transaction is comprised exclusively of former directors of IEGC; and | |
| 3. | The operations of the Company immediately after the transaction are those of IEGC. |
During 2013, we issued 12,491,916 shares of our common stock at a price of $0.02 and $0.03 per share, and 664,299,127 shares at $0.005 per share in private placements to pre-merger existing stockholders of the Company.
During the fiscal year ended December 31, 2014, we generated revenue of $529,225, and had a net loss of $5,401,754 . Our accountants have raised substantial doubt regarding our ability to continue as a going concern. As noted in our consolidated financial statements, we had an accumulated stockholders’ deficit of approximately $14.7 million and recurring losses from operations as of December 31, 2014 . See “Risk Factors—Our accountants have raised substantial doubt regarding our ability to continue as a going concern.”
Emerging Growth Company Status
We are an “emerging growth company” as defined in Section 2(a)(19) of the Securities Act, as modified by the Jumpstart Our Business Startups Act of 2012 (the “JOBS Act”). As such, we are eligible to take advantage of certain exemptions from various reporting requirements that are applicable to other public companies that are not “emerging growth companies” including, but not limited to, not being required to comply with the auditor attestation requirements of Section 404 of the Sarbanes-Oxley Act of 2002 (the “Sarbanes-Oxley Act”), reduced disclosure obligations regarding executive compensation in our periodic reports and proxy statements, and exemptions from the requirements of holding a non-binding advisory vote on executive compensation and stockholder approval of any golden parachute payments not previously approved. We intend to take advantage of all of these exemptions.
In addition, Section 107 of the JOBS Act also provides that an “emerging growth company” can take advantage of the extended transition period provided in Section 7(a)(2)(B) of the Securities Act for complying with new or revised accounting standards, and delay compliance with new or revised accounting standards until those standards are applicable to private companies. We have elected to take advantage of the benefits of this extended transition period.
| 4 |
We could be an emerging growth company until the last day of the first fiscal year following the fifth anniversary of our first common equity offering, although circumstances could cause us to lose that status earlier if our annual revenues exceed $1.0 billion, if we issue more than $1.0 billion in non-convertible debt in any three-year period or if we become a “large accelerated filer” as defined in Rule 12b-2 under the Securities Exchange Act of 1934, as amended (the “Exchange Act”).
Company Information
Our principal office is located at 6160 West Tropicana Ave, Suite E-13, Las Vegas, NV 89103 and our phone number is (702) 227-5626. Our corporate website address is www.investmentevolution.com. Information contained on, or accessible through, our website is not a part of, and is not incorporated by reference into, this prospectus.
The Offering
| Issuer | IEG Holdings Corporation | |
| Common stock offered by the selling stockholders | 170,290,274 shares | |
| Common stock outstanding before this offering | 2,158,110,323 shares | |
| Common stock to be outstanding after this offering | 2,158,110,323 shares | |
| Offering price per share | $0.50; provided, however, that (i) if and when our common stock is quoted on the OTCQB Marketplace or the OTCQX Marketplace, or is traded on Nasdaq or another exchange, and upon the filing by us of, and the effectiveness of, a post-effective amendment to the registration statement of which this prospectus forms a part that provides for the sale of common stock in this offering at prevailing market prices or privately negotiated prices, the selling stockholders may sell their shares at prevailing market prices or privately negotiated prices; and (ii) to the extent that we effect a reverse stock split after the date of this prospectus, the per share fixed price of the selling stockholders’ shares offered hereby will be adjusted in accordance with the reverse stock split ratio. See “Determination of Offering Price” and “Plan of Distribution.” | |
| Use of proceeds | We will not receive any proceeds from the sale of common stock by the selling stockholders in this offering. See “Use of Proceeds” and “Principal and Selling Stockholders.” | |
| Risk factors | See “Risk Factors” beginning on page 7 of this prospectus for a discussion of some of the factors you should carefully consider before deciding to invest in our common stock. | |
| OTC trading symbol | IEGH |
| 5 |
SUMMARY HISTORICAL FINANCIAL DATA
The following table presents our summary historical financial data for the periods indicated. The summary historical financial data for the years ended December 31, 2014 and 2013 and the balance sheet data as of December 31, 2014 and 2013 are derived from the audited financial statements.
Historical results are included for illustrative and informational purposes only and are not necessarily indicative of results we expect in future periods, and results of interim periods are not necessarily indicative of results for the entire year. You should read the following summary financial data in conjunction with “Management’s Discussion and Analysis of Financial Condition and Results of Operations” and our financial statements and related notes appearing elsewhere in this prospectus.
| Year Ended December 31, | ||||||||
| 2014 | 2013 | |||||||
| Statement of Operations Data | ||||||||
| Total revenues | $ | 529,225 | $ | 62,949 | ||||
| Total operating expenses | 5,381,671 | 4,345,539 | ||||||
| Loss from operations | (4,852,446 | ) | (4,282,590 | ) | ||||
| Total other income (expense) | (549,308 | ) | (195,385 | ) | ||||
| Net loss | $ | (5,401,754 | ) | $ | (4,477,975 | ) | ||
| Net loss per share, basic and diluted | $ | (0.00 | ) | $ | (0.01 | ) | ||
| Balance Sheet Data (at period end) | ||||||||
| Cash and cash equivalents | $ | 433,712 | $ | 281,879 | ||||
| Working capital (1) | 719,602 | (280,786 | ) | |||||
| Total assets | 4,929,120 | 922,140 | ||||||
| Total liabilities | (2,537,156 | ) | (2,923,596 | ) | ||||
| Stockholders’ equity (deficit) | 2,391,964 | (2,001,456 | ) |
(1) Working capital represents total current assets less total current liabilities.
| 6 |
Investment in our common stock involves a number of substantial risks. You should not invest in our stock unless you are able to bear the complete loss of your investment. In addition to the risks and investment considerations discussed elsewhere in this prospectus, the following factors should be carefully considered by anyone purchasing the securities offered through this prospectus. The risks and uncertainties described below are not the only ones we face. Additional risks and uncertainties not presently known to us or that we currently deem immaterial also may impair our business operations. If any of the following risks actually occur, our business could be harmed. In such case, the trading price of our common stock could decline and investors could lose all or a part of the money paid to buy our common stock.
Risks Related to Our Business and Industry
If our involvement in a December 11, 2014 article published in the Examiner or any other publicity regarding our company or the offering during the waiting period, including our December 2, 2014 press release, were held to be in violation of federal or state securities laws, we could incur monetary damages, fines or other damages that could have a material adverse effect on our financial condition and prospects.
On December 11, 2014, information about our company was published in an article by the Examiner. Despite the appearance in the December 11th article, our chief executive officer, Mr. Mathieson, did not participate in an interview with the author of the Examiner article. Rather, the author included certain quotations from Mr. Mathieson that were contained in prior press releases by us and summarized statements previously made by Mr. Mathieson that were contained in a prior article published by the Opportunist Magazine. Prior to its publication, the author of the December 11th article provided Mr. Mathieson a copy of the article.
In addition, we issued a press release on December 2, 2014 in which we referenced, among other things, our intention to file a registration statement on Form S-1, of which this prospectus forms a part, and to list our securities on Nasdaq. The December 2nd press release presented certain statements about our company in isolation and did not disclose many of the related risks and uncertainties described in this prospectus.
If it were determined that the December 11th article, the December 2nd press release or any of our other publicity-related activities could be held to be a violation of Section 5 of the Securities Act, the SEC and relevant state regulators could impose monetary fines or other sanctions as provided under relevant federal and state securities laws. Such regulators could also require us to make a rescission offer, which is an offer to repurchase the securities, to our stockholders that purchased shares in this offering. This could also give rise to a private right of action to seek a rescission remedy under Section 12(a)(2) of the Securities Act.
We are unable to quantify the extent of any monetary damages that we might incur if monetary fines were imposed, rescission were required or one or more other claims were successful. As of the date of this filing, we are not aware of any pending or threatened claims that we violated any federal or state securities laws. However, there can be no assurance that any such claim will not be asserted in the future or that the claimant in any such action will not prevail. The possibility that such claims may be asserted in the future will continue until the expiration of the applicable federal and state statutes of limitations, which generally vary from one to three years from the date of sale. Claims under the anti-fraud provisions of the federal securities laws, if relevant, would generally have to be brought within two years of discovery, but not more than five years after occurrence. If the payment of damages or fines is significant, it could have a material adverse effect on our cash flow, financial condition or prospects.
Our limited operating history and our failure since inception to achieve an operating profit makes our future prospects and financial performance unpredictable, and the current scale of our operations is insufficient to achieve profitability.
We commenced operations in 2010 and as a result, we have a limited operating history upon which a potential investor can evaluate our prospects and the potential value of an investment in our company. In addition, we have not made an operating profit since our incorporation. We remain subject to the risks inherently associated with new business enterprises in general and, more specifically, the risks of a new financial institution and, in particular, a new Internet-based financial institution. Our prospects are subject to the risks and uncertainties frequently encountered by companies in their early stages of development, including the risk that we will not be able to implement our business strategy. The current scale of our operations is insufficient to achieve profitability. If we are unable to implement our business strategy and grow our business, our business will be materially adversely affected.
We are highly dependent on our credit facility.
We are highly dependent on our credit facility with BFG Loan Holdings, LLC to execute on our growth plans and operate our business. An amendment to the credit facility loan agreement was made effective on June 30, 2014 which extended the Term Conversion Date past June 30, 2014 and allows us to continue drawing down from the facility to fund our loan originations. Under the amended agreement, the Term Conversion Date is at the discretion of the lender and there is no guarantee when the lender will convert the facility to a term loan. It would be very difficult to find a financing source to replace our current lender if it elected not to lend any additional amounts in our company. The loss of our credit facility or future renewals of that financing arrangement could have a material adverse effect on our business. Upon conversion to a term loan, monthly principal and interest payments equal to 100% of the consumer loan proceeds will be due. This credit facility terminates on June 1, 2016.
Because our officers and board of directors will make all management decisions, you should only purchase our common stock if you are comfortable entrusting our directors to make all decisions.
Our board of directors will have the sole right to make all decisions with respect to our management. Investors will not have an opportunity to evaluate the specific projects that will be financed with future operating income. You should not purchase our common stock unless you are willing to entrust all aspects of our management to our officers and directors.
We may not be able to implement our plans for growth successfully, which could adversely affect our future operations.
Since launching online lending in July 2013, the amount we have lent to borrowers (our loan book) has grown 2,600% from $237,000 at June 30, 2013 to $6,399,023 at March 31, 2015 . We expect to continue to grow our loan book and number of customers at an accelerated rate following completion of this offering. Our future success will depend in part on our continued ability to manage our growth. We may not be able to achieve our growth plans, or sustain our historical growth rates or grow at all. Various factors, such as economic conditions, regulatory and legislative considerations and competition, may also impede our ability to expand our market presence. If we are unable to grow as planned, our business and prospects could be adversely affected.
Our inability to manage our growth could harm our business.
We anticipate that our loan book and customer base will continue to grow significantly over time. To manage the expected growth of our operations and personnel, we will be required to, among other things:
| ● | improve existing and implement new transaction processing, operational and financial systems, procedures and controls; | |
| ● | maintain effective credit scoring and underwriting guidelines; and | |
| ● | increase our employee base and train and manage this growing employee base. |
If we are unable to manage growth effectively, our business, prospects, financial condition and results of operations could be adversely affected.
| 7 |
We may need to raise additional capital that may not be available, which could harm our business.
Our growth will require that we generate additional capital either through retained earnings or the issuance of additional debt or equity securities. Additional capital may not be available on terms acceptable to us, if at all. Any equity financings could result in dilution to our stockholders or reduction in the earnings available to our common stockholders. If adequate capital is not available or the terms of such capital are not attractive, we may have to curtail our growth and our business, and our business, prospects, financial condition and results of operations could be adversely affected.
As an online consumer loan company whose principal means of delivering personal loans is the Internet, we are subject to risks particular to that method of delivery.
We are predominantly an online consumer loan company and there are a number of unique factors that Internet-based loan companies face. These include concerns for the security of personal information, the absence of personal relationships between lenders and customers, the absence of loyalty to a conventional hometown branch, customers’ difficulty in understanding and assessing the substance and financial strength of an online loan company, a lack of confidence in the likelihood of success and permanence of online loan companies and many individuals’ unwillingness to trust their personal details and financial future to a relatively new technological medium such as the Internet. As a result, some potential customers may be unwilling to establish a relationship with us.
Conventional “brick and mortar” consumer loan companies, in growing numbers, are offering the option of Internet-based lending to their existing and prospective customers. The public may perceive conventional established loan companies as being safer, more responsive, more comfortable to deal with and more accountable as providers of their lending needs. We may not be able to offer Internet-based lending that has sufficient advantages over the Internet-based lending services and other characteristics of conventional “brick and mortar” consumer loan companies to enable us to compete successfully.
We may not be able to make technological improvements as quickly as some of our competitors, which could harm our ability to compete with our competitors and adversely affect our results of operations, financial condition and liquidity.
Both the Internet and the financial services industry are undergoing rapid technological changes, with frequent introductions of new technology-driven products and services. In addition to improving the ability to serve customers, the effective use of technology increases efficiency and enables financial institutions to reduce costs. Our future success will depend in part upon our ability to address the needs of our customers by using technology to provide products and services that will satisfy customer demands, as well as to create additional efficiencies in our operations. We may not be able to effectively implement new technology-driven products and services or be successful in marketing these products and services to our customers. If we are unable, for technical, legal, financial or other reasons, to adapt in a timely manner to changing market conditions, customer requirements or emerging industry standards, our business, prospects, financial condition and results of operations could be adversely affected.
A significant disruption in our computer systems or a cyber security breach could adversely affect our operations.
We rely extensively on our computer systems to manage our loan origination and other processes. Our systems are subject to damage or interruption from power outages, computer and telecommunications failures, computer viruses, cyber security breaches, vandalism, severe weather conditions, catastrophic events and human error, and our disaster recovery planning cannot account for all eventualities. If our systems are damaged, fail to function properly or otherwise become unavailable, we may incur substantial costs to repair or replace them, and may experience loss of critical data and interruptions or delays in our ability to perform critical functions, which could adversely affect our business and results of operations. Any compromise of our security could also result in a violation of applicable privacy and other laws, significant legal and financial exposure, damage to our reputation, loss or misuse of the information and a loss of confidence in our security measures, which could harm our business.
Our subprime and unsecured loans generally have delinquency and default rates higher than prime and secured loans, which could result in higher loan losses.
We are in the business of originating unsecured personal loans. As of March 30, 2015, approximately 7% of our customers are subprime borrowers, which we define as borrowers having credit scores below 601 on the credit risk scale developed by VantageScore Solutions, LLC. Unsecured personal loans and subprime loans generally have higher delinquency and default rates than secured loans and prime loans. Subprime borrowers have lower collection rates and are subject to higher loss rates than prime borrowers. Subprime borrowers have historically been, and may in the future become, more likely to be affected, or more severely affected, by adverse macroeconomic conditions, particularly unemployment. If our borrowers default under an unsecured loan, we will bear a risk of loss of principal, which could adversely affect our cash flow from operations. Delinquency interrupts the flow of projected interest income from a loan, and default can ultimately lead to a loss. We attempt to manage these risks with risk-based loan pricing and appropriate management policies. However, we cannot assure you that such management policies will prevent delinquencies or defaults and, if such policies and methods are insufficient to control our delinquency and default risks and do not result in appropriate loan pricing, our business, financial condition, liquidity and results of operations could be harmed. If aspects of our business, including the quality of our borrowers, are significantly affected by economic changes or any other conditions in the future, we cannot be certain that our policies and procedures for underwriting, processing and servicing loans will adequately adapt to such changes. If we fail to adapt to changing economic conditions or other factors, or if such changes affect our borrowers’ capacity to repay their loans, our results of operations, financial condition and liquidity could be materially adversely affected.
If our estimates of loan receivable losses are not adequate to absorb actual losses, our provision for loan receivable losses would increase, which would adversely affect our results of operations.
We maintain an allowance for loans receivable losses. To estimate the appropriate level of allowance for loan receivable losses, we consider known and relevant internal and external factors that affect loan receivable collectability, including the total amount of loan receivables outstanding, historical loan receivable charge-offs, our current collection patterns, and economic trends. If customer behavior changes as a result of economic conditions and if we are unable to predict how the unemployment rate, housing foreclosures, and general economic uncertainty may affect our allowance for loan receivable losses, our provision may be inadequate. Our allowance for loan receivable losses is an estimate, and if actual loan receivable losses are materially greater than our allowance for loan receivable losses, our financial position, liquidity, and results of operations could be adversely affected.
| 8 |
Our risk management efforts may not be effective.
We could incur substantial losses and our business operations could be disrupted if we are unable to effectively identify, manage, monitor, and mitigate financial risks, such as credit risk, interest rate risk, prepayment risk, liquidity risk, and other market-related risks, as well as operational risks related to our business, assets and liabilities. Our risk management policies, procedures, and techniques, including our scoring methodology, may not be sufficient to identify all of the risks we are exposed to, mitigate the risks we have identified or identify additional risks to which we may become subject in the future.
We face strong competition for customers and may not succeed in implementing our business strategy.
Our business strategy depends on our ability to remain competitive. There is strong competition for customers from personal loan companies and other types of consumer lenders, including those that use the Internet as a medium for lending or as an advertising platform. Our competitors include:
| ● | large, publicly-traded, state-licensed personal loan companies such as SpringLeaf Holdings, World Acceptance Corporation, and OneMain Financial, a subsidiary of CitiGroup; | |
| ● | peer-to-peer lending companies such as Lending Club and Prosper | |
| ● | recent startup state-licensed personal loan companies such as Avant Credit; | |
| ● | “brick and mortar” personal loan companies, including those that have implemented websites to facilitate online lending; and | |
| ● | payday lenders, tribal lenders and other online consumer loan companies. |
Some of these competitors have been in business for a long time and have name recognition and an established customer base. Most of our competitors are larger and have greater financial and personnel resources. In order to compete profitably, we may need to reduce the rates we offer on loans, which may adversely affect our business, prospects, financial condition and results of operations. To remain competitive, we believe we must successfully implement our business strategy. Our success depends on, among other things:
| ● | having a large and increasing number of customers who use our loans for financing needs; | |
| ● | our ability to attract, hire and retain key personnel as our business grows; | |
| ● | our ability to secure additional capital as needed; | |
| ● | our ability to offer products and services with fewer employees than competitors; | |
| ● | the satisfaction of our customers with our customer service; | |
| ● | ease of use of our websites; and | |
| ● | our ability to provide a secure and stable technology platform for providing personal loans that provides us with reliable and effective operational, financial and information systems. |
If we are unable to implement our business strategy, our business, prospects, financial condition and results of operations could be adversely affected.
We depend on third-party service providers for our core operations including online lending and loan servicing, and interruptions in or terminations of their services could materially impair the quality of our services.
We rely substantially upon third-party service providers for our core operations, including online web lending and marketing and vendors that provide systems that automate the servicing of our loan portfolios which allow us to increase the efficiency and accuracy of our operations. These systems include tracking and accounting of our loan portfolio as well as customer relationship management, collections, funds disbursement, security and reporting. This reliance may mean that we will not be able to resolve operational problems internally or on a timely basis, which could lead to customer dissatisfaction or long-term disruption of our operations. If these service arrangements are terminated for any reason without an immediately available substitute arrangement, our operations may be severely interrupted or delayed. If such interruption or delay were to continue for a substantial period of time, our business, prospects, financial condition and results of operations could be adversely affected.
If we lose the services of any of our key management personnel, our business could suffer.
Our future success significantly depends on the continued service and performance of our Chief Executive Officer, Paul Mathieson and our Chief Operating Officer, Carla Cholewinski. Competition for these employees is intense and we may not be able to attract and retain key personnel. We do not maintain any “key man” or other related insurance. The loss of the service of our Chief Executive Officer or our Chief Operating Officer, or the inability to attract additional qualified personnel as needed, could materially harm our business.
| 9 |
We will incur increased costs as a result of being a public reporting company.
Once the registration statement, of which this prospectus forms a part, is declared effective by the SEC, we will be a public reporting company. As a public reporting company, we will incur significant legal, accounting and other expenses that we did not incur as a non-reporting company, including costs associated with our SEC reporting requirements. We expect that the additional reporting and other obligations imposed on us under the Securities Exchange Act of 1934, as amended (the “Exchange Act”) will increase our legal and financial compliance costs and the costs of our related legal, accounting and administrative activities significantly. Management estimates that compliance with the Exchange Act reporting requirements as a reporting company will cost in excess of $150,000 annually. Given our current financial resources, these additional compliance costs could have a material adverse impact on our financial position and ability to achieve profitable results. These increased costs will require us to divert money that we could otherwise use to expand our business and achieve our strategic objectives.
We operate in a highly competitive market, and we cannot ensure that the competitive pressures we face will not have a material adverse effect on our results of operations, financial condition and liquidity.
The consumer finance industry is highly competitive. Our success depends, in large part, on our ability to originate consumer loan receivables. We compete with other consumer finance companies as well as other types of financial institutions that offer similar products and services in originating loan receivables. Some of these competitors may have greater financial, technical and marketing resources than we possess. Some competitors may also have a lower cost of funds and access to funding sources that may not be available to us. While banks and credit card companies have decreased their lending to non-prime customers in recent years, there is no assurance that such lenders will not resume those lending activities. Further, because of increased regulatory pressure on payday lenders, many of those lenders are starting to make more traditional installment consumer loans in order to reduce regulatory scrutiny of their practices, which could increase competition in markets in which we operate.
Our business is subject to extensive regulation in the jurisdictions in which we conduct our business.
Our operations are subject to regulation, supervision and licensing under various federal, state and local statutes, ordinances and regulations. In most states in which we operate, a consumer credit regulatory agency regulates and enforces laws relating to consumer lenders such as us. These rules and regulations generally provide for licensing as a consumer lender, limitations on the amount, duration and charges, including interest rates, for various categories of loans, requirements as to the form and content of finance contracts and other documentation, and restrictions on collection practices and creditors’ rights. In certain states, we are subject to periodic examination by state regulatory authorities. Some states in which we operate do not require special licensing or provide extensive regulation of our business.
We are also subject to extensive federal regulation, including the Truth in Lending Act, the Equal Credit Opportunity Act and the Fair Credit Reporting Act. These laws require us to provide certain disclosures to prospective borrowers and protect against discriminatory lending and leasing practices and unfair credit practices. The principal disclosures required under the Truth in Lending Act include the terms of repayment, the total finance charge and the annual percentage rate charged on each contract or loan. The Equal Credit Opportunity Act prohibits creditors from discriminating against credit applicants on the basis of race, color, religion, national origin, sex, age or marital status. According to Regulation B promulgated under the Equal Credit Opportunity Act, creditors are required to make certain disclosures regarding consumer rights and advise consumers whose credit applications are not approved of the reasons for the rejection. In addition, the credit scoring system used by us must comply with the requirements for such a system as set forth in the Equal Credit Opportunity Act and Regulation B. The Fair Credit Reporting Act requires us to provide certain information to consumers whose credit applications are not approved on the basis of a report obtained from a consumer reporting agency and to respond to consumers who inquire regarding any adverse reporting submitted by us to the consumer reporting agencies. Additionally, we are subject to the Gramm-Leach-Bliley Act, which requires us to maintain the privacy of certain consumer data in our possession and to periodically communicate with consumers on privacy matters. We are also subject to the Service members Civil Relief Act, which requires us, in most circumstances, to reduce the interest rate charged to customers who have subsequently joined, enlisted, been inducted or called to active military duty.
A material failure to comply with applicable laws and regulations could result in regulatory actions, lawsuits and damage to our reputation, which could have a material adverse effect on our results of operations, financial condition and liquidity.
Our accountants have raised substantial doubt regarding our ability to continue as a going concern.
As noted in our consolidated financial statements, we had an accumulated stockholders’ deficit of approximately $9.28 million and recurring losses from operations as of December 31, 2014 . We intend to fund operations through raising additional capital through debt financing and equity issuances and increased lending activities which may be insufficient to fund our capital expenditures, working capital or other cash requirements for the year ending December 31, 2015 . We are continuing to seek additional funds to finance our immediate and long term operations. The successful outcome of future financing activities cannot be determined at this time and there is no assurance that if achieved, we will have sufficient funds to execute our intended business plan or generate positive operating results. These factors, among others, raise substantial doubt about our ability to continue as a going concern. The audit report of Rose, Snyder & Jacobs LLP for the fiscal years ended December 31, 2014 and 2013 contain a paragraph that emphasizes the substantial doubt as to our continuance as a going concern. This is a significant risk that we may not be able to remain operational for an indefinite period of time.
| 10 |
Risks Relating to the Offering
Provisions of our articles of incorporation and bylaws may delay or prevent a take-over which may not be in the best interests of our shareholders.
Provisions of our articles of incorporation and bylaws may be deemed to have anti-takeover effects, which include when and by whom special meetings of our shareholders may be called, and may delay, defer or prevent a takeover attempt. In addition, certain provisions of the Florida Business Corporations Act also may be deemed to have certain anti-takeover effects which include that control of shares acquired in excess of certain specified thresholds will not possess any voting rights unless these voting rights are approved by a majority of a corporation’s disinterested shareholders. Further, our articles of incorporation authorizes the issuance of up to 50,000,000 shares of preferred stock with such rights and preferences as may be determined from time to time by our board of directors in their sole discretion. Our board of directors may, without shareholder approval, issue series of preferred stock with dividends, liquidation, conversion, voting or other rights that could adversely affect the voting power or other rights of the holders of our common stock.
The tradability of our common stock is limited under the penny stock regulations which may cause the holders of our common stock difficulty should they wish to sell the shares.
Because the quoted price of our common stock is less than $5.00 per share, our common stock is considered a “penny stock,” and trading in our common stock is subject to the requirements of Rule 15g-9 under the Exchange Act. Under this rule, broker-dealers who recommend low-priced securities to persons other than established customers and accredited investors must satisfy special sales practice requirements. The broker-dealer must make an individualized written suitability determination for the purchaser and receive the purchaser’s written consent prior to the transaction. SEC regulations also require additional disclosure in connection with any trades involving a “penny stock,” including the delivery, prior to any penny stock transaction, of a disclosure schedule explaining the penny stock market and its associated risks. These requirements severely limit the liquidity of securities in the secondary market because few broker or dealers are likely to undertake these compliance activities and this limited liquidity will make it more difficult for an investor to sell his shares of our common stock in the secondary market should the investor wish to liquidate the investment. In addition to the applicability of the penny stock rules, other risks associated with trading in penny stocks could also be price fluctuations and the lack of a liquid market.
As an “emerging growth company” under the JOBS Act, we are permitted to rely on exemptions from certain disclosure requirements.
We qualify as an “emerging growth company” under the JOBS Act. As a result, we are permitted to, and intend to, rely on exemptions from certain disclosure requirements. For so long as we are an emerging growth company, we will not be required to:
| ● | have an auditor report on our internal controls over financial reporting pursuant to Section 404(b) of the Sarbanes-Oxley Act; | |
| ● | comply with any requirement that may be adopted by the Public Company Accounting Oversight Board regarding mandatory audit firm rotation or a supplement to the auditor’s report providing additional information about the audit and the consolidated financial statements (i.e., an auditor discussion and analysis); | |
| ● | submit certain executive compensation matters to stockholder advisory votes, such as “say-on-pay” and “say-on-frequency”; and | |
| ● | disclose certain executive compensation related items such as the correlation between executive compensation and performance and comparisons of the chief executive officer’s compensation to median employee compensation. |
In addition, Section 102 of the JOBS Act also provides that an emerging growth company can take advantage of the extended transition period provided in Section 7(a)(2)(B) of the Securities Act for complying with new or revised accounting standards. In other words, an emerging growth company can delay the adoption of certain accounting standards until those standards would otherwise apply to private companies. We have elected to take advantage of the benefits of this extended transition period. Our consolidated financial statements may therefore not be comparable to those of companies that comply with such new or revised accounting standards.
We will remain an “emerging growth company” for up to five years, or until the earliest of (i) the last day of the first fiscal year in which our total annual gross revenues exceed $1 billion, (ii) the date that we become a “large accelerated filer” as defined in Rule 12b-2 under the Exchange Act, which would occur if the market value of our ordinary shares that is held by non-affiliates exceeds $700 million as of the last business day of our most recently completed second fiscal quarter or (iii) the date on which we have issued more than $1 billion in non-convertible debt during the preceding three year period.
Until such time, however, we cannot predict if investors will find our common stock less attractive because we may rely on these exemptions. If some investors find our common stock less attractive as a result, there may be a less active trading market for our common stock and our stock price may be more volatile.
If the selling stockholders sell a substantial number of shares all at once or in large blocks, the market price of our shares would most likely decline.
The selling stockholders may offer and sell up to 170,290,274 shares of our common stock through this prospectus. As of the date of this prospectus, this represents approximately 7.9 % of our outstanding common stock. Our common stock is presently quoted on the OTC Markets and any sale of shares at a price below the current market price at which the common stock is trading will cause that market price to decline. Moreover, the offer or sale of a large number of shares at any price may cause the market price to fall. We cannot predict the effect, if any, that future sales of shares of our common stock into the market will have on the market price of our common stock. Sales of substantial amounts of common stock or the perception that such transactions could occur, may materially and adversely affect prevailing markets prices for our common stock.
Trading on the OTC Markets is volatile and sporadic, which could depress the market price of our common stock and make it difficult for our stockholders to resell their shares.
Our common stock is quoted on the Pink Current Information tier of the OTC Markets. Trading in stock quoted on the OTC Markets is often thin and characterized by wide fluctuations in trading prices, due to many factors, some of which may have little to do with our operations or business prospects. This volatility could depress the market price of our common stock for reasons unrelated to operating performance. Moreover, the OTC Markets is not a stock exchange, and trading of securities on the OTC Markets is often more sporadic than the trading of securities listed on a quotation system like NASDAQ or a stock exchange like the New York Stock Exchange. Although we have applied to list our common stock on NASDAQ, there is no assurance that this application will be approved. In addition, in order to meet the minimum share price listing requirement for our common stock on NASDAQ, we expect to effect a reverse stock split of our common stock subsequent to the effective date of the registration statement of which this prospectus is a part. No reverse stock split may be effected without board and stockholder approval. If we do not meet NASDAQ’s minimum share price or other listing requirements, our listing application will not be approved by NASDAQ. These factors may result in investors having difficulty reselling any shares of our common stock.
Our stock price is likely to be highly volatile because of several factors, including a limited public float.
The market price of our common stock has been volatile in the past and is likely to be highly volatile in the future because there has been a relatively thin trading market for our stock, which causes trades of small blocks of stock to have a significant impact on our stock price. You may not be able to resell shares of our common stock following periods of volatility because of the market’s adverse reaction to volatility.
| 11 |
Other factors that could cause such volatility may include, among other things:
| ● | actual or anticipated fluctuations in our operating results; | |
| ● | the absence of securities analysts covering us and distributing research and recommendations about us; | |
| ● | we may have a low trading volume for a number of reasons, including that a large portion of our stock is closely held; | |
| ● | overall stock market fluctuations; | |
| ● | announcements concerning our business or those of our competitors; | |
| ● | actual or perceived limitations on our ability to raise capital when we require it, and to raise such capital on favorable terms; | |
| ● | conditions or trends in the industry; | |
| ● | litigation; | |
| ● | changes in market valuations of other similar companies; | |
| ● | future sales of common stock; | |
| ● | departure of key personnel or failure to hire key personnel; and | |
| ● | general market conditions. |
Any of these factors could have a significant and adverse impact on the market price of our common stock. In addition, the stock market in general has at times experienced extreme volatility and rapid decline that has often been unrelated or disproportionate to the operating performance of particular companies. These broad market fluctuations may adversely affect the trading price of our common stock, regardless of our actual operating performance.
The arbitrary offering price of the shares being offered by the selling stockholders pursuant to this prospectus may result in a loss of value of shares of our common stock.
The offering price of the shares bears no relation to book value, assets, earnings or any other objective criteria of value. It has been arbitrarily determined by the selling stockholders. There can be no assurance that the shares will attain market values commensurate with the offering price.
We have never paid dividends on our common stock and have no plans to do so in the future.
Holders of shares of our common stock are entitled to receive such dividends as may be declared by our board of directors. To date, we have paid no cash dividends on our shares of common stock and we do not expect to pay cash dividends on our common stock in the foreseeable future. We intend to retain future earnings, if any, to provide funds for operations of our business. Therefore, any return investors in our common stock may have will be in the form of appreciation, if any, in the market value of their shares of common stock. See “Dividend Policy.”
We will not receive any proceeds from the sale of common stock by the selling stockholders in this offering. See “Principal and Selling Stockholders.”
DETERMINATION OF OFFERING PRICE
The shares being offered by the selling stockholders will be sold at a fixed price of $0.50; provided, however, that (i) if and when our common stock is quoted on the OTCQB Marketplace or the OTCQX Marketplace, or is traded on Nasdaq or another exchange, and upon the filing by us of, and the effectiveness of, a post-effective amendment to the registration statement of which this prospectus forms a part that provides for the sale of common stock in this offering at prevailing market prices or privately negotiated prices, the selling stockholders may sell their shares at prevailing market prices or privately negotiated prices; and (ii) to the extent that we effect a reverse stock split after the date of this prospectus, the per share fixed price of the selling stockholders’ shares offered hereby will be adjusted in accordance with the reverse stock split ratio. For example, if our board and our stockholders approve an amendment to our amended and restated articles of incorporation which effects a 1-for-100 reverse stock split, the fixed price for the shares of common stock offered by the selling stockholders pursuant to this prospectus would increase from $0.50 per share to $50.00 per share. As of the date of this prospectus, our board has not approved a reverse stock split, but may do so in the future. No reverse stock split may be effected without board and stockholder approval. There can be no assurance that our shares will be quoted on the OTCQB Marketplace or OTCQX Marketplace, or traded on an exchange, or, if quoted or traded, that a viable public market will materialize. The offering price of the shares bears no relation to book value, assets, earnings, or any other objective criteria of value. It has been arbitrarily determined by the selling stockholders.
This prospectus relates to 170,290,274 shares of our common stock offered by the selling stockholders. The selling stockholders and any of their respective pledges, donees, assignees and other successors-in-interest may, from time to time, sell any or all of their shares of common stock on any stock exchange, market or trading facility on which the shares are traded or in private transactions. These shares shall be sold at a fixed price of $0.50; provided, however, that (i) if and when our common stock is quoted on the OTCQB Marketplace or the OTCQX Marketplace, or is traded on Nasdaq or another exchange, and upon the filing by us of, and the effectiveness of, a post-effective amendment to the registration statement of which this prospectus forms a part that provides for the sale of common stock in this offering at prevailing market prices or privately negotiated prices, the selling stockholders may sell their shares at prevailing market prices or privately negotiated prices; and (ii) to the extent that we effect a reverse stock split after the date of this prospectus, the per share fixed price of the selling stockholders’ shares offered hereby will be adjusted in accordance with the reverse stock split ratio. For example, if our board and our stockholders approve an amendment to our amended and restated articles of incorporation which effects a 1-for-100 reverse stock split, the fixed price for the shares of common stock offered by the selling stockholders pursuant to this prospectus would increase from $0.50 per share to $50.00 per share. As of the date of this prospectus, our board has not approved a reverse stock split, but may do so in the future. No reverse stock split may be effected without board and stockholder approval. There can be no assurance that our shares will be quoted on the OTCQB Marketplace or OTCQX Marketplace, or traded on an exchange, or, if quoted or traded, that a viable public market will materialize. The offering price of the shares bears no relation to book value, assets, earnings, or any other objective criteria of value. It has been arbitrarily determined by the selling stockholders.
The selling stockholders may use any one or more of the following methods when selling shares:
| ● | ordinary brokerage transactions and transactions in which the broker-dealer solicits purchasers; | |
| ● | block trades in which the broker-dealer will attempt to sell the shares as agent, but may position and resell a portion of the block as principal to facilitate the transaction; | |
| ● | purchases by a broker-dealer as principal and resale by the broker-dealer for its account; | |
| ● | an exchange distribution in accordance with the rules of the applicable exchange; | |
| ● | privately negotiated transactions; | |
| ● | short sales after the registration statement of which this prospectus forms a part becomes effective; |
| 12 |
| ● | broker-dealers may agree with the selling stockholders to sell a specified number of such shares at a stipulated price per share; | |
| ● | through the writing of options on the shares; | |
| ● | a combination of any such methods of sale; and | |
| ● | any other method permitted pursuant to applicable law. |
The selling stockholders or any of their respective pledgees, donees, transferees or other successors-in-interest, may also sell the shares directly to market makers acting as principals and/or broker-dealers acting as agents for themselves or their customers. Such broker-dealers may receive compensation in the form of discounts, concessions or commissions from the selling stockholders and/or the purchasers of shares for whom such broker-dealers may act as agents or to whom they sell as principal or both, which compensation as to a particular broker-dealer might be in excess of customary commissions. Before any such agent, or broker-dealer sells any of the shares that are the subject of this prospectus, a post-effective amendment to the registration statement of which this prospectus forms a part will be filed to name anyone receiving compensation for selling the shares before any sales take place. Market makers and block purchasers purchasing the shares will do so for their own account and at their own risk. It is possible that a selling stockholder will attempt to sell shares of common stock in block transactions to market makers or other purchasers at a fixed price which may be below or above the then market price. The selling stockholders and any brokers, dealers or agents, upon effecting the sale of any of the shares offered in this prospectus, are “underwriters” as that term is defined under the Securities Act, or the Exchange Act or the rules and regulations under such acts. In such event, any commissions received by such broker-dealers or agents and any profit on the resale of the shares purchased by them may be deemed to be underwriting commissions or discounts under the Securities Act.
Discounts, concessions, commissions and similar selling expenses, if any, attributable to the sale of shares will be borne by the respective selling stockholder. A selling stockholder may agree to indemnify any agent, dealer or broker-dealer that participates in transactions involving sales of the shares if liabilities are imposed on that person under the Securities Act.
The selling stockholders may from time to time pledge or grant a security interest in some or all of the shares of common stock owned by them and, if a selling stockholder defaults in the performance of its secured obligations, the pledgee or secured parties may offer and sell the shares of common stock from time to time under this prospectus after we have filed an amendment to this prospectus under Rule 424(b)(3) or any other applicable provision of the Securities Act amending the list of selling stockholders to include the pledgee, transferee or other successors-in-interest as selling stockholders under this prospectus.
The selling stockholders also may transfer their shares of common stock in other circumstances, in which case the transferees, pledgees or other successors-in-interest will be the selling beneficial owners for purposes of this prospectus and may sell the shares of common stock from time to time under this prospectus after we have filed an amendment to this prospectus under Rule 424(b)(3) or other applicable provision of the Securities Act amending the list of selling stockholders to include the pledgee, transferee or other successors-in-interest as selling stockholders under this prospectus.
We are required to pay all fees and expenses incident to the registration of the shares of common stock. We have agreed to indemnify the selling stockholders against certain losses, claims, damages and liabilities, including liabilities under the Securities Act.
The selling stockholders acquired the securities offered hereby in the ordinary course of business and have advised us that they have not entered into any agreements, understandings or arrangements with any underwriters or broker-dealers regarding the sale of their shares of common stock, nor is there an underwriter or coordinating broker acting in connection with a proposed sale of shares of common stock by any selling stockholder. If we are notified by any selling stockholder that any material arrangement has been entered into with a broker-dealer for the sale of shares of common stock, if required, we will file a supplement to this prospectus.
If a selling stockholder uses this prospectus for any sale of the shares of common stock, it will be subject to the prospectus delivery requirements of the Securities Act.
The anti-manipulation rules of Regulation M under the Securities Exchange Act may apply to sales of our common stock and activities of the selling stockholders.
We have not paid any cash dividends on our common stock and do not currently anticipate paying cash dividends in the foreseeable future. The agreements into which we may enter in the future, including indebtedness, may impose limitations on our ability to pay dividends or make other distributions on our capital stock. Payment of future dividends on our common stock, if any, will be at the discretion of our board of directors and will depend on, among other things, our results of operations, cash requirements and surplus, financial condition, contractual restrictions and other factors that our board of directors may deem relevant. We intend to retain future earnings, if any, for reinvestment in the development and expansion of our business.
As of April 2 , 2015, we had 1,000,000 and 1,400,000 shares of Series A and Series F preferred stock, respectively, issued and outstanding, and no shares of Series B, Series C, Series D and Series E preferred stock issued and outstanding. Shares of Series A, Series B, Series C, Series D, Series E and Series F preferred stock accrue dividends at the rate of 12% per annum based on a stated value of $1.00 per preferred share and is paid monthly.
| 13 |
Business Overview
We provide online unsecured consumer loans ranging from $5,000 to $10,000 under the consumer brand Mr. Amazing Loans via our website and online application portal at www.mramazingloans.com. We commenced business in 2010, opening our first office in Las Vegas, Nevada. We have since obtained additional state lending licenses and are currently licensed and originating direct consumer loans in the states of Arizona, Florida, Georgia, Illinois, Missouri, New Jersey, Nevada, Oregon, Pennsylvania, Texas, Utah and Virginia. Loans are now provided to residents of these states via our online application and distribution network, with all loans originated, processed and serviced out of our centralized Las Vegas head office thereby eliminating the need for physical offices in the states where we are licensed to operate.
Our strategy is to address the market needs of underbanked consumers that tend to be ignored by mainstream institutional credit providers such as banks and credit unions, and charged excessive fees and interest by fringe lenders such as payday lenders. In the current global environment, we believe there is a substantial need and opportunity for the small personal loans we offer.
All of our personal loans are offered at prevailing statutory rates with fixed affordable repayments and no hidden fees or prepayment penalties. We conduct full underwriting on all applications including credit checks and review of bank statements to ensure customers have capacity to repay their loans, and have designed our loans to help customers reach a stronger financial position.
We plan to continue expanding our state coverage in early 2015 by obtaining state lending licenses in 13 additional states, increasing our coverage to 25 states and approximately 250 million people. As soon as we receive new state licenses we will turn on our existing online marketing and distribution channels which we expect will generate immediate business at a customer acquisition cost within our desired budget.
In addition, we are investigating options to expand our online operations into Canada, the Philippines and India in 2015 or 2016. As of the date of this prospectus, we have no operations in Australia, Canada, the Philippines or India, and have not provided any loans in Australia, Canada, the Philippines or India. However, in 2005, Mr. Mathieson, our Chief Executive Officer and a member of our Board of Directors, founded IEG in Sydney, Australia. IEG launched the Amazing Loans business in Australia in 2005 and the Mr. Amazing Loans business in the United States via IEGC in 2010. From 2005 until 2012, Mr. Mathieson operated the Amazing Loans business through IEG in Australia. During that time, IEG lent approximately $48 million to over 11,500 borrowers in Australia. IEG ceased doing business in Australia in 2012.
Market
We operate in the consumer finance industry serving the large and growing population of consumers who have limited access to credit from banks, credit card companies and other lenders. According to the Federal Deposit Insurance Corporation, there were approximately 51 million adults living in under-banked households in the United States in 2011, and one quarter of United States households had used at least one alternative financial services product in the past year. According to the Center for Financial Services Innovation’s 2011 Underbanked Market Sizing Study, the underbanked marketplace generated approximately $78 billion in fee and interest revenue in 2011 from a volume of $682 billion in principal loaned, funds transacted, deposits held and services rendered. The underbanked marketplace encompasses close to two dozen products across personal loans, vehicle loans and leases, credit cards, home equity lines of credit and student loans, and in 2011 comprised over 68 million consumers.
Installment lending to non-prime consumers is one of the most highly fragmented sectors of the consumer finance industry. We are a state-licensed Internet-based personal loan company serving in the consumer installment lending industry. Our online lending platform provides the distribution network to efficiently address this growing market of consumers without the significant costs and overhead associated with an extensive branch network. We believe we are well positioned to capitalize on the significant growth and expansion opportunity created by the continued shift of consumers to online services, such as online banking and in our case online personal loans.
We are currently licensed and providing loans online to residents of Arizona, Florida, Georgia, Illinois, Missouri, New Jersey, Nevada, Oregon, Pennsylvania, Texas, Utah and Virginia, with plans to continue to expand across the United States by acquiring additional state lending licenses. The following is a breakdown of our loan origination amounts in each licensed state for our current active loan portfolio as at December 31, 2014:
| State | Origination Volume ($) | Current Principal ($) | Number of Loans | |||||||||
| Arizona | 528,000 | 492,506 | 113 | |||||||||
| Florida | 1,263,000 | 1,206,138 | 277 | |||||||||
| Georgia | 530,021 | 517,179 | 106 | |||||||||
| Illinois | 621,000 | 596,336 | 127 | |||||||||
| Missouri | 143,000 | 135,960 | 28 | |||||||||
| Nevada | 887,000 | 829,829 | 192 | |||||||||
| New Jersey | 708,000 | 689,573 | 133 | |||||||||
| Oregon | 0 | 0 | 0 | |||||||||
| Pennsylvania | 0 | 0 | 0 | |||||||||
| Texas | 10,000 | 9,981 | 1 | |||||||||
| Utah | 0 | 0 | 0 | |||||||||
| Virginia | 447,000 | 435,778 | 85 | |||||||||
| 5,137,021 | 4,913,279 | 1,062 | ||||||||||
Note: Oregon, Pennsylvania and Utah are newly licensed states which went live in the first quarter of 2015, and Texas was the most recently licensed state before that which went live in December 2014.
We also have plans to expand internationally, with Canada, the Philippines and India being the next markets in which we expect to offer our loan products.
Business Strategy
Our business strategy is to lower the cost of providing consumer loans by leveraging our online lending platform and distribution network, while continuing to obtain additional state licenses to enable further loan book growth and portfolio diversification. Our strategy includes a number of key elements:
| ● | State-Licensed Model: Our state-licensed business model is a key element of our business strategy. We are currently licensed in Arizona, Florida, Georgia, Illinois, Missouri, New Jersey, Nevada, Oregon, Pennsylvania, Texas, Utah and Virginia and plan to continue expanding across the United States by acquiring additional state lending licenses. | |
| ● | Online Distribution: We launched online lending and commenced online advertising in July 2013. Upon fulfillment of state regulatory requirements, we received approval from the Arizona, Florida and Illinois state regulators to operate solely online in these states. We have also received regulatory approval from our five newly licensed states, Georgia, Missouri, New Jersey, Nevada, Oregon, Pennsylvania, Texas, Utah and Virginia to operate solely online. This allows us to fully service all 12 states from our centralized Las Vegas headquarters which we believe is a key competitive advantage over brick and mortar lenders. |
| 14 |
| ● | Cost-Effective Customer Acquisition: Our customer acquisition costs have been reduced significantly since we launched online lending and marketing. While traditional forms of direct advertising such as radio and television typically resulted in a 10% to 15% acquisition cost, online search engine advertising has averaged 2% to 10% with continued improvements expected from our new website. | |
| ● | Continue to Grow Loan Book: Total cumulative loan originations as of March 31, 2015 have increased 2,600% to $6,399,023 since our June 30, 2013 total of $237,000. This growth in lending is attributable to launching online lending and joint venturing with a number of new marketing partners. We also plan to obtain an additional 13 state lending licenses by late 2015. |
Competitive Strengths
We believe our competitive strengths are:
| ● | Large Market and Scope for Growth: Large personal and payday loan market in the United States of over $50 billion per annum presents opportunity for significant growth and expansion. | |
| ● | Proven Business Model: Our founder, Chairman and CEO, Paul Mathieson, established a similar business in Australia that lent approximately $48 million to over 11,500 customers which forms the foundation of our United States business model. | |
| ● | Regulation: We are fully compliant with state lending licenses in Arizona, Florida, Illinois and Nevada and are well positioned for current and future regulatory changes due to ongoing compliance and conservative business model. | |
| ● | Customer Proposition: Our unsecured installment loans range from $5,000 - $10,000 over five years and feature affordable weekly repayments. Rates range from 19.9% - 29.9% APR which make us a low cost alternative to payday loans which have an average APR of over 400%. | |
| ● | Senior Revolving Debt Facility: We have a $10 million revolving credit facility in place from a Florida based investment group BFG Investment Holdings, LLC to fund new loan originations. | |
| ● | Online Distribution: Special approval has been granted by the Arizona, Florida, Georgia, Illinois, Missouri, New Jersey, Nevada, Oregon, Pennsylvania, Texas, Utah and Virginia regulators to operate our business without a physical office location in each state. As a result, we have closed offices in Arizona, Illinois and Florida and moved to full online loan distribution, enabling us to offer loans to residents in all 12 of our licensed states from our Las Vegas headquarters. We will apply for the same regulatory approval for our 13 additional planned states in 2015. | |
| ● | Customer Acquisition: We launched online advertising in July 2013 with positive results from search engine cost per click advertising and online lead generation resulting in a 2,600% increase in our loan book from June 30, 2013 to March 31, 2015 . In addition we have engaged a number of new marketing partners in 2014 including online lead generators and direct mail. All of these avenues provide opportunities for strong growth at low customer acquisition costs. | |
| ● | Barriers to Entry: We believe that state licensure acts as a barrier to entry into our segment of the consumer loan market. We are strongly positioned with approval to operate under 12 state licenses from one centralized head office, and potential competitors would be required to obtain these licenses in order to compete with us. |
Products
We currently provide online consumer loans ranging from $5,000 to $10,000, unsecured over a five- year term with rates ranging from 19.9% to 29.9% annual percentage rate. Our current loan portfolio also includes loans remaining from our previous product offerings which were $2,000 to $10,000 loans unsecured over a three- to five-year term.
Our personal loan products are fully amortizing, fixed rate, unsecured installment loans and all loans are offered at prevailing statutory rates, with our standard loan product being a 29.9% interest rate and annual percentage rate, fully amortizing, five year unsecured personal loan. The variations from this standard loan product in certain states is due to individual state requirements and comply with our state lending licenses, for example Florida requires a blended rate which caps the maximum rate on a $10,000 loan at 21% and Texas requires a different blended rate which caps the maximum rate on a $10,000 loan at 26.01%.
The following is a breakdown of loan terms and interest rates for each currently licensed state:
| State | APR $5,000 loan | APR $10,000 loan | ||||||
| Arizona | 24.90 | % | 24.90 | % | ||||
| Florida | 23.90 | % | 19.90 | % | ||||
| Georgia | 29.90 | % | 29.90 | % | ||||
| Illinois | 29.90 | % | 29.90 | % | ||||
| Missouri | 29.90 | % | 29.90 | % | ||||
| Nevada | 29.90 | % | 29.90 | % | ||||
| New Jersey | 29.90 | % | 29.90 | % | ||||
| Oregon | 29.90 | % | 29.90 | % | ||||
| Pennsylvania | 29.90 | % | 29.90 | % | ||||
| Texas | 27.90 | % | 25.90 | % | ||||
| Utah | 29.90 | % | 29.90 | % | ||||
| Virginia | 29.90 | % | 29.90 | % | ||||
| 15 |
The following is an illustrative profile of our personal loans:
| Loan Product | - | Loans for $5,000 - $10,000 |
| - | 5 years | |
| - | $6,000 average loan amount | |
| - | 28% average APR | |
| - | Fixed rate, fully amortizing | |
| - | No hidden or additional fees | |
| - | No prepayment penalties | |
| Loans available for any purpose. Common uses include: | ||
| Loan Purpose | - | Debt consolidation |
| - | Medical expenses | |
| - | Home improvements | |
| - | Auto repairs | |
| - | Major purchase | |
| - | Discretionary spending | |
| Average Borrower Demographic | - | 625-720 credit score |
| - | $35,000 - $100,000 income | |
| - | 25 -65 years old | |
We commenced originating personal loans online in July 2013. Prior to that, we provided loans to customers via our branch network, which comprised one branch in each state as required by state licensing regulations. Our online loan origination platform now means that a qualifying customer can obtain a loan from us without having to come into a branch. We have maintained our full underwriting processes, identity verifications and fraud checks to ensure that online customers are verified to the same degree that customers were when they obtained a loan in a branch. Our new website and application portal was recently launched on www.mramazingloans.com and we expect this enhanced website with improved customer experience to be a key driver of customer conversions and loan book growth.
The following graphs depict our loan origination values and number of loans by month:
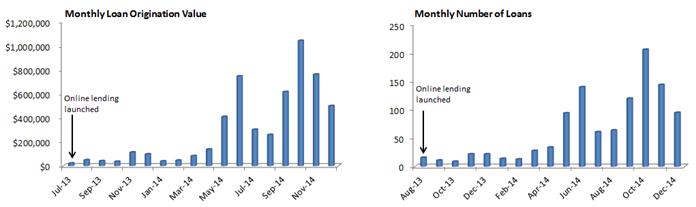
The following table sets forth the minimum, maximum and average credit score, income and age of our current borrowers as of December 31, 2014:
Average Borrower Demographic of Current Loan Portfolio as at December 31, 2014
| Demographic | Minimum | Maximum | Average | |||||||||
| Credit Score | 575 | 886 | 653 | |||||||||
| Income | $ | 24,000 | $ | 273,396 | $ | 59,834 | ||||||
| Age | 22 | 81 | 44 | |||||||||
Customer Acquisition
Since launching online lending in July 2013, our marketing efforts have been focused on online customer acquisition. We saw significant increases in loan applications and inquiries as a result of search engine advertising and commenced banner advertising, remarketing and search engine optimization in 2014. We have also engaged numerous online lead generators who provide personal loan leads on a daily basis. We are continuing to develop relationships with additional lead generation partners to drive further growth.
We plan to launch a customer referral program and merchant referral program in 2015 via our www.mramazingloans.com website. We will also supplement our online marketing efforts with traditional forms of advertising e.g. radio, television and direct mail offers to continue to drive further growth.
Loan Underwriting
Applicants apply online providing income, employment and banking information. The applicant is provided disclosures and privacy statements, and authorizes us to obtain a full credit report from Experian on the applicant and co-applicant and to verify employment prior to submitting the electronic application.
Once the application has been transmitted, a full credit report is obtained and the automated preliminary underwriting is completed based on stated income and expense data obtained from the credit report. The automated preliminary underwriting includes, but is not limited to, credit score, number of credit inquiries, outstanding unpaid collections, length of credit history, length of employment, internet protocol, or “IP,” address to verify location of applicant, and debt to income ratio.
The second step in the underwriting process for those applicants that are conditionally approved based on stated income, credit score, number of credit inquires, outstanding unpaid collections, length of credit history and length of employments, IP address, is to validate the actual income (current pay invoices and prior year W-2) and to obtain 60-90 day read only statements from the applicant’s primary bank. During this process the pay invoices are reviewed for garnishments, hardship loans and other legal liens allowed on wages. Bank statements are transmitted electronically directly to underwriting to ensure the integrity of the information. This process allows the underwriter to review the money management of every applicant and to assess the ability to take on additional expense. It also provides the underwriter with additional debt not found on traditional credit reports such as payday loans, title loans and IRS payments that could affect the ability of the applicant to assume additional debt. If all conditions are met as it relates to money management, maximum debt to income, minimum length of employment, and satisfactory credit history the underwriter recommends final approval and request to draw documents.
The final step in the underwriting process is to present the completed file to the Chief Credit Officer for final approval and order to draw documents. File is reviewed for any exceptions to policy, compliance with the underwriting policies and to ensure the loan system is reflective of what has been presented by the underwriter. Applicant is then approved for a specific loan amount ($5,000 or $10,000) based on income, ability to repay and credit strength. Rate and loan terms are fixed (fixed rate and fixed term can vary based on regulatory state maximums) as we do not utilize risk based variable pricing models eliminating the risk of discrimination and other compliance related issues.
The closing process is completed by contacting the applicant, communicating the lending decision and reviewing loan terms and conditions. Upon acceptance loan documents are emailed for electronic signature, and returned to the Company for final verifications, document review and funding.
Servicing
All of our loan servicing is handled in our centralized Las Vegas head office. All servicing and collection activity is conducted and documented using an industry standard loan service software system which handles and records all records and transactions of loan originations, loan servicing, collections and reporting.
Our primary third-party servicing arrangement is with CyberRidge, LLC, a company that licenses its consumer loan software to us. We use this software for our loan management system. We have a servicing agreement with CyberRidge, LLC which renews automatically unless either party notifies the other, at least 60 days prior to the end of the renewal term. We believe the risk of termination is low as we are a paying customer of CyberRidge, LLC and have maintained a positive working relationship since 2012. In the unlikely event that the agreement were terminated, we believe 60 days’ notice would be sufficient to find a suitable replacement with minimal disruption to our business.
Portfolio Ledger Stratification as at December 31, 2014
| Number | % | Current Unpaid Principal Balance | % | ||||||||||||||
| 0 - 15 days | 985 | 92.75 | % | $ | 4,601,538 | 93.66 | % | ||||||||||
| 16 - 30 days | 13 | 1.22 | % | $ | 53,319 | 1.09 | % | ||||||||||
| 31 - 60 days | 15 | 1.41 | % | $ | 57,827 | 1.18 | % | ||||||||||
| 61 - 90 days | 17 | 1.60 | % | $ | 76,198 | 1.55 | % | ||||||||||
| 91 - 120 days | 15 | 1.41 | % | $ | 55,672 | 1.13 | % | ||||||||||
| 121 - 184 days | 17 | 1.60 | % | $ | 68,725 | 1.40 | % | ||||||||||
| Total | 1062 | 100.00 | % | $ | 4,913,279 | 100.00 | % | ||||||||||
Past Due Loans
At December 31, 2014, we had 77 loans considered past due at 16+ days past due, representing 7.25% of the number of loans in our active portfolio.
Loans in Collections
At December 31, 2014, we had 49 loans that were eligible for legal collection action (loans become eligible for legal collection action at 60 days past due), representing 4.61% of the number of loans in our active portfolio. Collections are handled in house and are not outsourced.
Default Rates
At December 31, 2014, we had 32 loans in default (default is defined as 90 days past due), representing 3.01% of the number of loans in our active portfolio.
Regulation
Consumer loans in the United States are regulated at both the federal and state level. National oversight is provided by the Federal Trade Commission, which enforces the following credit laws that protect consumers’ rights to get, use and maintain credit:
| ● | The Truth in Lending Act promotes the informed use of consumer credit, by requiring disclosures about its terms and cost to standardize the manner in which costs associated with borrowing are calculated and disclosed. | |
| ● | The Fair Credit Reporting Act promotes the accuracy and privacy of information in the files of the nation’s credit reporting companies. If a company denies an application, under the Fair Credit Reporting Act consumers have the right to the name and address of the credit reporting company they contacted, provided the denial was based on information given by the credit reporting company. |
| 16 |
| ● | The Equal Opportunity Credit Act prohibits credit discrimination on the basis of sex, race, marital status, religion, national origin, age, or receipt of public assistance. Creditors may ask for this information (except religion) in certain situations, but they may not use it to discriminate against consumers when deciding whether to grant you credit. | |
| ● | The Fair Credit Billing Act and Electronic Fund Transfer Act establish procedures for resolving mistakes on credit billing and electronic fund transfer account statements. | |
| ● | The Fair Debt Collection Practices Act (the “FDCPA”) applies to personal, family, and household debts. The FDCPA prohibits debt collectors from engaging in unfair, deceptive, or abusive practices while collecting these debts. |
Consumer loans are also regulated at State level, and the regulatory requirements vary between states. We are licensed in the following states:
| ● | Arizona (Consumer Lender License, No. CL0918180, which commenced on May 20, 2011) | |
| ● | Florida (Consumer Finance Company License, No. CF9900865, which commenced on August 29, 2011) | |
| ● | Georgia (Certificate of Authority, No. 14021183, which commenced on March 4, 2014) | |
| ● | Illinois (Consumer Instalment Loan License, No. CI3095, which commenced on April 13, 2011) | |
| ● | Missouri (Consumer Instalment Loan License, No. 510-15-7308, which commenced on April 7, 2014) | |
| ● | New Jersey (Consumer Lender License, No. L066960, which commenced on April 24, 2014) | |
| ● | Nevada (Installment Loan License, No. II22748, which commenced on June 15, 2010) | |
| ● | Oregon (Consumer Finance License, No. 0407-001-C, which commenced on January 8, 2015) | |
| ● | Pennsylvania (Consumer Lender License, No. 49269, which commenced on December 23, 2014) | |
| ● | Texas (Regulated Lender License, No. 1400031843-150319, which commenced on November 14, 2014) | |
| ● | Utah (Consumer Lender License which commenced on February 5, 2015) | |
| ● | Virginia (Certificate of Authority, No. CIS0368, which commenced on March 5, 2014) |
We did not incur any costs in connection with the compliance with any federal, state, or local environmental laws.
Competition
We operate in a highly competitive environment. Several personal consumer loan companies operate in the United States. Our competitors include:
| ● | large, publicly-traded, state-licensed personal loan companies, | |
| ● | peer-to-peer lending companies, such as Lending Club and Prosper, | |
| ● | recent startup state-licensed personal loan companies, such as Avant Credit, | |
| ● | “brick and mortar” personal loan companies, including those that have implemented websites to facilitate online lending, and | |
| ● | payday lenders, tribal lenders and other online consumer loan companies. |
We believe we compete based on affordable repayment terms, favorable interest rates, significant financial resources from our revolving debt facility, low overhead due to on-line distribution. We believe that in the future we will face increased competition from these companies as we expand our operations. Most of the entities against which we compete, or may compete, are larger and have greater financial resources than us. No assurance can be given that increased competition will not have an adverse effect on our company.
Office Locations
Our executive offices, which also serve as our centralized operational headquarters and Nevada branch, are located at 6160 West Tropicana Ave, Suite E-13, Las Vegas, Nevada 89103. This facility occupies a total of approximately 2,125 square feet under a lease that expires in April 2015. Our annual rental for this facility is approximately $46,750 in the first year of the lease up to $56,215 in the final year of the term of the lease, plus a proportionate share of operating expenses of approximately $12,112 annually. We believe this facility is adequate for our current and near term future needs due to our online strategy.
We lease approximately 1,200 square feet in Chicago, Illinois under a lease expiring in July 2016. Our annual rental for this office is approximately $33,000 plus a proportionate share of operating expenses. We subleased this office in September 2014 for $19,200 annually and will continue to pay the remaining rent until expiration of the lease.
We lease approximately 1,400 square feet in Phoenix, Arizona under a lease expiring in April 2016. Our annual rental for this office is approximately $24,000, plus a proportionate share of operating expenses.
We lease approximately 4,024 square feet in West Palm Beach, Florida under a lease expiring in August 2016. Our annual rental for this office is approximately $96,000, plus a proportionate share of operating expenses.
We no longer use the offices located in Phoenix and West Palm Beach and we are currently attempting to sublease them.
| 17 |
Employees
As of April 2, 2015, we had five full-time employees and seven part-time employees. None of our employees is represented by a union.
Corporate History
We were organized as a Florida corporation on January 21, 1999, under the name Interact Technologies, Inc. (“Interact”). Interact was formed for the purpose of acquiring certain medical technology. On February 18, 1999, we changed our name to Fairhaven Technologies, Inc. (“Fairhaven”). Fairhaven’s business plan continued to involve the acquisition of certain medical technology. By June 1999, Fairhaven abandoned its business plan and had no operations until December 2001. On December 14, 2001, we changed our name to Ideal Accents, Inc. Ideal Accents, Inc. was engaged primarily in the business of accessorizing cars and trucks at the new vehicle dealer level. Ideal Accents, Inc. ceased operations in 2005. We changed our name to IEG Holdings Corporation in February 2013. Since March 2013, we have been engaged in the business of providing unsecured consumer loans ranging from $2,000 - $10,000 and offer loans online under the consumer brand “Mr. Amazing Loans”. Beginning in 2014, the Company changed its loan terms, such that it offers loans ranging from $5,000 to $10,000. The Company is headquartered in Las Vegas, Nevada and originates direct consumer loans in the states of Arizona, Florida, Georgia, Illinois, Missouri, New Jersey, Nevada, Oregon, Pennsylvania, Texas, Utah and Virginia via its website and online distribution network. The Company is a fully licensed consumer installment loan provider in the 12 states in which it operates and offers all loans within the prevailing statutory rates.
We have five wholly owned subsidiaries, each of which is described below:
| ● | IEGC: Our subsidiary that holds our intellectual property and global rights to the Mr. Amazing Loans business. | |
| ● | IEC: Our U.S. operating entity that holds all state licenses, leases, employee contracts and other operating and administrative expenses. | |
| ● | SPV: A bankruptcy remote special purpose vehicle that holds the Company’s U.S. loan receivables. | |
| ● | IE Philippines : Our wholly owned subsidiary that currently has no operations. We are considering expansion into the Philippines in 2015 or 2016. To the extent we go forward with this expansion, we expect that IE Philippines will be our operating entity for Philippine operations. | |
| ● | IE Canada: Our Canadian operating entity formed on January 2, 2015. The entity is currently dormant, with plans to be used upon establishing online operations for Canada. |
In 2005, Mr. Mathieson, our Chief Executive Officer and a member of our Board of Directors, founded IEG in Sydney, Australia. IEG launched the Amazing Loans business in Australia in 2005 and the Mr. Amazing Loans business in the United States via IEGC in 2010. From 2005 until 2012, Mr. Mathieson operated the Amazing Loans business through IEG in Australia. During that time, IEG lent approximately $48 million to over 11,500 borrowers in Australia. IEG ceased doing business in Australia in 2012. On January 28, 2013, IEGC entered into a stock exchange agreement (the “Stock Exchange Agreement”) among IEGC, its sole shareholder , IEG, and our company. Under the terms of the Stock Exchange Agreement, we agreed to acquire a 100% interest in IEGC for 272,447,137 shares of our common stock after giving effect to a 1-for-6 reverse stock split. On February 14, 2013 , we filed the Amended Articles with the Secretary of State of Florida which had the effect of:
| ● | changing our name from Ideal Accents, Inc. to IEG Holdings Corporation, | |
| ● | increasing the number of shares of our authorized common stock to 1,000,000,000, $.001 par value, | |
| ● | creating 50,000,000 shares of “blank-check” preferred stock, and | |
| ● | effecting the Reverse Stock Split pursuant to the terms of the Stock Exchange Agreement. |
FINRA approved our Amended Articles on March 11, 2013.
On March 13, 2013, we completed the acquisition of IEGC under the terms of the Stock Exchange Agreement and issued to IEG 272,447,137 shares of our common stock after giving effect to the Reverse Stock Split whereby we acquired a 100% interest in IEGC. The stock exchange agreement between IEGC, IEG and the Company resulted in a reverse acquisition with a public shell, with IEGC being the accounting acquirer. The Company issued 90,815 shares of its common stock to the shareholders of IEG (IEG transferred its ownership in IEGC to its shareholders, which is why the shares were issued to the ultimate shareholders of IEG rather than to IEG itself) for each share of IEGC, in exchange for 100% ownership interest in IEGC. We determined that IEGC was the accounting acquirer because of the following facts and circumstances:
| 1. | After consummation of the transaction, the ultimate shareholders of IEGC own 99.1% of the outstanding shares of the Company; | |
| 2. | The board of directors of the Company immediately after the transaction is comprised exclusively of former directors of IEGC; and | |
| 3. | The operations of the Company immediately after the transaction are those of IEGC. |
During 2013, we issued 12,491,916 shares of our common stock at a price of $0.02 and $0.03 per share, and 664,299,127 shares at $0.005 per share in private placements to pre-merger existing stockholders of the Company.
Legal Proceedings
We are not a party to any pending or threatened litigation.
MARKET PRICE FOR COMMON EQUITY AND RELATED STOCKHOLDER MATTERS
Market Information
Our common stock is currently quoted on the OTC Markets. The OTC Market is a network of security dealers who buy and sell stock. The dealers are connected by a computer network that provides information on current “bids” and “asks”, as well as volume information. Since March 11, 2013, our shares have been quoted on the Pink Current Information tier of the OTC Markets under the symbol “IEGH.”
The following table sets forth the range of high and low closing bid quotations for our common stock for each of the periods indicated as reported by the OTC Markets. These quotations reflect inter-dealer prices, without retail mark-up, mark-down or commission and may not necessarily represent actual transactions. As of February 22, 2013, we effected a 1-for-6 reverse stock split. All prices in the following table reflect post-reverse split prices.
Fiscal Year Ended December 31, 2013
| High | Low | |||||||
| Fiscal Quarter Ended: | ||||||||
| March 31, 2013 | $ | 0.05 | $ | 0.02 | ||||
| June 30, 2013 | $ | 0.12 | $ | 0.02 | ||||
| September 30, 2013 | $ | 0.10 | $ | 0.10 | ||||
| December 31, 2013 | $ | 0.15 | $ | 0.10 | ||||
Fiscal Year Ended December 31, 2014
| High | Low | |||||||
| Fiscal Quarter Ended: | ||||||||
| March 31, 2014 | $ | 0.10 | $ | 0.10 | ||||
| June 30, 2014 | $ | 0.13 | $ | 0.10 | ||||
| September 30, 2014 | $ | 0.45 | $ | 0.10 | ||||
| December 31, 2014 | $ | 1.00 | $ | 0.19 | ||||
On March 13, 2015, the closing price for our common stock on the OTC Markets was $0.51 per share with respect to an insignificant volume of shares.
The volume of shares traded on the OTC Markets was insignificant and therefore, does not represent a reliable indication of the fair market value of these shares. We sold shares of common stock in private placements during 2013 and 2014 at prices ranging from $0.005 per share to $0.03 per share.
| 18 |
Holders of Common Stock
As of March 30, 2015, there were approximately 2,261 record holders of our common stock. The number of record holders does not include beneficial owners of common stock whose shares are held in the names of banks, brokers, nominees or other fiduciaries.
We have no securities authorized for issuance under equity compensation plans.
MANAGEMENT’S DISCUSSION AND ANALYSIS OF FINANCIAL CONDITION
AND RESULTS OF OPERATIONS
The following discussion of our financial condition and results of operations should be read in conjunction with the consolidated financial statements and the notes to those financial statements that are included elsewhere in this prospectus. Our discussion includes forward-looking statements based upon current expectations that involve risks and uncertainties, such as our plans, objectives, expectations and intentions. Actual results and the timing of events could differ materially from those anticipated in these forward-looking statements as a result of a number of factors, including those set forth under the Risk Factors, Cautionary Notice Regarding Forward-Looking Statements and Business sections in this prospectus. We use words such as “anticipate,” “estimate,” “plan,” “project,” “continuing,” “ongoing,” “expect,” “believe,” “intend,” “may,” “will,” “should,” “could,” and similar expressions to identify forward-looking statements.
Overview
We are a consumer finance company providing responsible online personal loan products to customers in 12 states via our website and online application portal. We have a four year track record of high quality origination, underwriting and servicing of personal loans to underbanked consumers. We leverage our experience and knowledge in the consumer finance industry to achieve a meaningful return on our investment in the loan portfolio.
We have the ability to finance our businesses from a diversified source of capital and funding, including cash flow from operations and financings in the capital markets. During 2014, we demonstrated the ability to attract capital markets funding for our core personal loans by completing private placements of common stock and preferred stock that generated $5,379,485 investment into the Company.
As of December 31, 2014, we had one business segment: Consumer Loans.
Our Products and Services
We provide unsecured loans to individuals. Our loans range from $5,000-$10,000 with 19.9%-29.9% APR and all are unsecured over a five-year term.
Results of Operations
| 19 |
Year Ended December 31, 2014 Compared to the Year Ended December 31, 2013
Interest Revenue
For the year ended December 31, 2014, interest revenue increased to $521,018, compared to $56,585 for the year ended December 31, 2013. This increase was due to the significant growth in our interest-earning loan book of consumer receivables. We expect our interest revenue to grow significantly in future periods as we continue to grow our loan book.
Other Revenue
For the year ended December 31, 2014, other revenue increased to $8,207, compared to $6,364 for the year ended December 31, 2013. Other revenue consisted of application fees, late/dishonor fees, prepayment penalties, and other miscellaneous income in 2013, and late/dishonor fees, decline lead revenue and other miscellaneous income in 2014. Although we ceased charging application fees and prepayment penalties in November 2013, other revenue has increased in 2014 due to decline lead revenue, which we started generating via several new marketing partners in mid-2014 and expect to continue to grow in future periods.
| 20 |
Salaries and Wages Expenses
For the year ended December 31, 2014, salaries and wages expenses increased to $1,889,136, compared to $1,345,243 for the year ended December 31, 2013. The increase was primarily attributable to the additional $300,000 in total compensation paid to our Chief Executive Officer in 2014, as well as hiring additional staff in 2014 as required to manage growth in loan originations and servicing of our larger loan book.
Other Operating Expenses
For the year ended December 31, 2014, other operating expenses increased to $1,074,409, compared to $513,917 for the year ended December 31, 2013. The increase was attributable to the higher costs associated with a significantly higher volume of loan applications to process and larger loan book to service.
Consulting Fees
For the year ended December 31, 2014, consulting fees increased to $871,228, compared to $422,771 for the year ended December 31, 2013. The increase was primarily due to one-off capital raising fees resulting from the significant capital raised during the period for common and preferred shares, including multiple investor presentations and the extensive work involved in handling queries from over 500 individual investors.
Provision for Credit Losses
For the year ended December 31, 2014, the provision for credit losses increased to $614,684, compared to $63,573 for the year ended December 31, 2013. We carry a provision for credit losses which is estimated collectively based on our loan portfolio and general economic conditions. The increase in provision for credit losses from prior year was due to the significantly larger loans receivable outstanding balance of $4,913,279 at December 31, 2014 compared to loans receivable outstanding of $487,432 at December 31, 2013.
Advertising
For the year ended December 31, 2014, advertising expenses increased to $290,315, compared to $77,380 for the year ended December 31, 2013. This increase is attributable to the significant increase in customer acquisition costs incurred to grow the loan book, including online advertising, direct mail, and lead generation costs.
Rent Expense
For the year ended December 31, 2014, rent expense decreased to $250,744, compared to $290,985 for the year ended December 31, 2013. The reduction in rent is due to our disused Illinois office being subleased in 2014. We expect rental expense to reduce further in future periods as we are able to sublease our remaining disused offices in Florida and Arizona and as leases expire.
Travel, Meals and Entertainment
For the year ended December 31, 2014, travel, meals and entertainment expenses increased to $376,101, compared to $95,505 for the year ended December 31, 2013. Travel, meals and entertainment expenses include corporate travel for meetings and investor presentations, as well as other investor related expenses. The increase is attributable to costs incurred for multiple capital raisings in 2014, as well as allowing a number of older staff travel expenses to be submitted for reimbursement in 2014.
Depreciation and Amortization
For the year ended December 31, 2014, depreciation and amortization decreased to $15,054, compared to $36,885 for the year ended December 31, 2013. This decrease was due to reduced value of assets and intangible assets with minimal additions during the period.
Startup Costs
Startup costs were $0 for the year ended December 31, 2014, whereas for the year ended December 31, 2013 we incurred one-off startup costs of $1,500,000 for the purchase of Australian rights to conduct business throughout Australia.
Interest Expense
For the year ended December 31, 2014, interest expense increased to $558,257, compared to $195,895 for the year ended December 31, 2013. This increase was attributable to increased interest cost for the BFG Loan Holdings, LLC $10 million revolving debt facility, interest paid on working capital loans, and interest paid on deposits on preferred stock.
| 21 |
Financial Position
Cash and Cash Equivalents
We had cash and cash equivalents of $433,712 as of December 31, 2014, compared to $281,879 as of December 31, 2013. The increase was due to equity capital raised during 2014.
Loans Receivable
We had net loan receivables of $4,316,316 as of December 31, 2014, as compared to $426,113 as of December 31, 2013. The increase was due to our continued growth in loan originations throughout 2014.
Other Receivables
We had other receivables of $25,882 as of December 31, 2014, as compared to $0 as of December 31, 2013. Other receivables comprised outstanding invoices for decline lead revenue due from marketing partners and accrued interest receivable on our consumer loans at December 31, 2014.
Property and Equipment
Our net property and equipment decreased from $43,349 as of December 31, 2013 to $36,100 as of December 31, 2014 due to depreciation of existing assets and minimal fixed asset additions in 2014.
Loan Costs
Our net loan costs decreased from $131,470 as of December 31, 2013 to $77,781 as of December 31, 2014 due to amortization of capitalized loan costs.
Accounts Payable and Accrued Expenses
We had accounts payable and accrued expenses of $172,139 as of December 31, 2014 compared to $323,978 as of December 31, 2013. The decrease is due to amounts paid down during 2014 and timing of accrued expenses.
CEO Accrued Wages
We had accounts payable and accrued expenses of $106,588 as of December 31, 2014 compared to $0 as of December 31, 2013. These accrued wages are the remaining unpaid portion of compensation earned by our CEO in 2014, which will be paid in 2015.
Working Capital Loans
We had working capital loans of $140,000 as of December 31, 2013 which were paid down to $0 as of December 31, 2014.
Senior Debt
We had senior debt of $2,230,000 as of December 31, 2014, as compared to $500,000 as of December 31, 2013. This senior debt comprises advances from our $10 million revolving facility and the increase is due to additional funds drawn down from facility to fund new loan originations.
Deposit on Preferred Stock
We had deposit on preferred stock of $0 as of December 31, 2014 as compared to $1,910,774 as of December 31, 2013. The $1,910,774 was issued as Series A, B, C, and D preferred shares on March 31, 2014, and additional deposits received during 2014 were issued as Series E and Series F preferred shares on November 19, 2014.
| 22 |
Financial Condition, Liquidity and Capital Resources
We continue to incur operating expenses in excess of net revenue and will require capital infusions to sustain our operations until operating results improve. We may not be able to obtain such capital in a timely manner and as a result may incur liquidity imbalances.
Liquidity and Capital Resources
We used cash in operations of $3,302,159 during the year ended December 31, 2014, compared to $1,522,805 during the year ended December 31, 2013, and this increase is in line with the growth or our loan book and associated higher operating expenses. We used net cash from investing activities of $4,513,954 during the year ended December 31, 2014, compared to $1,593,541 during the year ended December 31, 2013. The increase in cash used in investing activities is primarily due to an increase in loans receivable originated from $403,000 in 2013 to $4,781,022 in 2014.
We were provided $7,967,946 of net cash from financing activities during the year ended December 31, 2014, compared to $3,219,624 during the same period in 2013. The increase is primarily due to the significant capital raisings conducted in 2014, which brought in $4,267,949 as proceeds from issuance of common stock and $1,834,112 as deposit on preferred stock. We also continued to receive funds from our $10 million senior debt facility, with an additional $1,730,000 drawn down from the facility in 2014.
At December 31, 2014, we had cash on hand of $433,712, which is not sufficient to meet our operating needs for the next 12 months. We plan to continue to raise the required capital to meet our operating needs via equity, preferred stock, and debt capital raisings. The Company has a credit facility that provides for borrowings of up to $10 million with $2,230,000 and $500,000 outstanding at December 31, 2014 and December 31, 2013, respectively, subject to a borrowing base formula. The Company may borrow, at its option, at the rate of 18% with a minimum advance of $25,000. As of December 31, 2014, the Company’s effective interest rate was 18% and the unused amount available under the credit line was $7.77 million. Proceeds from this credit facility are used to fund loans to consumers. The credit facility revolving period, during which interest only payments are due, was extended to June 2016 under an amendment to the loan agreement. Upon conversion to a term loan, monthly principal and interest payments equal to 100% of the consumer loan proceeds will be due. This note matures on June 1, 2016. Substantially all of the Company’s assets are pledged as collateral for borrowings under the revolving credit agreement.
Off-Balance Sheet Arrangements
As of the date of this prospectus, we do not have any off-balance sheet arrangements that have or are reasonably likely to have a current or future effect on our financial condition, changes in financial condition, revenues or expenses, results of operations, liquidity, capital expenditures or capital resources that are material to investors. The term “off-balance sheet arrangement” generally means any transaction, agreement or other contractual arrangement to which an entity unconsolidated with us is a party, under which we have any obligation arising under a guarantee contract, derivative instrument or variable interest or a retained or contingent interest in assets transferred to such entity or similar arrangement that serves as credit, liquidity or market risk support for such assets.
Going Concern
The consolidated financial statements have been prepared in conformity with accounting principles generally accepted in the United States of America, which contemplate continuation of the Company as a going concern. The Company has reported recurring losses and has not generated positive net cash flows from operations. These conditions raise substantial doubt about the Company’s ability to continue as a going concern. Management intends to raise capital funding sufficient to continue operations through January 2017 via a public offering of equity consisting of common stock and/or preferred stock. This additional working capital will enable the Company to increase loan volume utilizing its existing $10 million credit facility. If the Company is not successful in raising sufficient capital, it may have to delay or reduce expenses, or curtail operations. The accompanying consolidated financial statements do not include any adjustments to reflect the possible future effects on the recoverability and classification of assets or the amounts and classification of liabilities that could result should the Company not continue as a going concern.
| 23 |
Critical Accounting Policies and Estimates
Our analysis and discussion of our financial condition and results of operations is based upon our Consolidated Financial Statements that have been prepared in accordance with accounting principles generally accepted in the United States of America (“GAAP”). The preparation of financial statements in conformity with GAAP requires management to make estimates and assumptions that affect the reported amounts of assets and liabilities, disclosure of contingent assets and liabilities at the date of the financial statements, and the reported amounts of revenues and expenses during the reporting period. GAAP provides the framework from which to make these estimates, assumptions and disclosures. We have chosen accounting policies within GAAP that we believe are appropriate to accurately and fairly report our operating results and financial position in a consistent manner. We regularly assess these policies in light of current and forecasted economic conditions. Our accounting policies are described in Note 1 to the Consolidated Financial Statements included elsewhere in this prospectus.
Recent Accounting Pronouncements
The recent accounting standards that have been issued or proposed by the FASB or other standards-setting bodies that do not require adoption until a future date are not expected to have a material impact on the consolidated financial statements upon adoption.
Prior to engaging Rose, Snyder & Jacobs LLP as our independent registered public accounting firm, we did not, and our predecessor did not, have an independent registered public accounting firm to audit our or our predecessor’s financial statements.
On February 21, 2013, our board of directors appointed Rose, Snyder & Jacobs LLP as our independent registered public accounting firm. Rose, Snyder & Jacobs LLP audited our financial statements for the fiscal years ended December 31, 2014 and 2013 and has been engaged as our independent registered public accounting firm for our fiscal year ending December 31, 2015 . During our two most recent fiscal years and through the date of Rose, Snyder & Jacobs LLP’s appointment, we did not consult with Rose, Snyder & Jacobs LLP with respect to any of the matters or reportable events set forth in Item 304(a)(2)(i) and (ii) of Regulation S-K.
DIRECTORS AND EXECUTIVE OFFICERS
Board of Directors and Executive Officers
The following table sets forth the names, positions and ages of our directors and executive officers as of the date of this prospectus. Our directors are typically elected at each annual meeting and serve for one year and until their successors are elected and qualify. Officers are elected by our board of directors and their terms of office are at the discretion of our board.
| Name | Age | Position(s) | ||
| Paul Mathieson | 40 | Chief Executive Officer & Director | ||
| Carla Cholewinski | 60 | Chief Operating Officer and Chief Credit Officer | ||
| Matthew I. Banks | 38 | Director | ||
| Ian M. Gilmour | 68 | Director | ||
| Harold A. Hansen | 67 | Director |
Biographical information concerning the directors and executive officers listed above is set forth below.
Paul Mathieson. Mr. Mathieson has served as the Chief Executive Officer and member of our board of directors since 2012 and a member of the board of directors of our subsidiary since 2009. In 2005, Mr. Mathieson founded IEG Holdings Limited in Sydney, Australia which launched the Amazing Loans business in Australia in 2005 and the Mr. Amazing Loans business in the United States via IEGC in 2010 . In recognition of IEG Holdings Limited’s success, Mr. Mathieson was awarded Ernst & Young’s 2007 Australian Young Entrepreneur of the Year (Eastern Region). Mr. Mathieson has over 19 years finance industry experience in lending, funds management, stock market research and investment banking. His career has included positions as Financial Analyst/Institutional Dealer with Daiwa Securities from 1995 to 1995, Head of Research for Hogan & Partners from 1995 to 2000, and Stockbroker and Investment Banking Associate with ING Barings from 2000 to 2001. In addition, from 2002 to 2010, Mr. Mathieson was the Founder and Managing Director of IE Portfolio Warrants, a funds management business that offered high return and leveraged structured Australian equities products. Mr. Mathieson received a Bachelor of Commerce from Bond University, Queensland, Australia in 1994 and a Master’s Degree of Applied Finance from Macquarie University, New South Wales, Australia in 2000.
Carla Cholewinski. Ms. Cholewinski has served as our Chief Operating Officer since 2008 and has over 37 years’ experience in the finance industry including banking, credit union management, regulatory oversight, debt securitization and underwriting. Her career has included positions as Vice President and Branch Manager at Glendale Federal Bank from 1976 to 1986, Vice President and District Sales and Lending Manager with California Federal Bank from 1986 to 1992, Mortgage Banker with First Choice Financial Services from 1992 to 1995, Corporate Vice President of Lending and Collections with WesStar Credit Union from 1995 to 1999, Chief Lending Officer for American Corp & Funding from 1999 to 2000, Chief Credit Officer for Security State Savings Bank from 2000 to 2004, and Chief Credit Officer for Fifth Street Bank from 2004 to 2008. Since 2008, Ms. Cholewinski has served as our Chief Operating Officer and Chief Credit Officer and has utilized her extensive finance, banking and regulatory experience to grow the business from initial launch to our current level of operations.
Matthew I. Banks. Mr. Banks has served as a member of our board of directors since his appointment in January 2015. Mr. Banks has been a finance broker with Quantum Business Finance, an asset finance business, since 2010, and has been a founding director of Rumble Resources, a junior mining company, since 2011. In 2000, Mr. Banks founded ECG, a sports marketing company in Melbourne, Australia. He served as a director of ECG from 2000 to 2010.
Ian M. Gilmour. Mr. Gilmour was appointed as a member of our board of directors in January 2015. Mr. Gilmour has served as a director and company secretary for AQRB Pty Ltd. (formerly known as Audit Quality Review Board Limited), a company which provided reports on the independence and quality reviews of the four large audit firms in Australia (now dormant), since 2005, and for Gilmour & Co. Pty Ltd., a private company providing company secretarial and Director services through Mr. Gilmour), since June 2003. In addition, Mr. Gilmour has served as part-time company secretary for RedHill Education Limited, a company providing certain education courses and services, since 2011, for Property Exchange Australia Limited, a company formed to develop and run an electronic platform for property transactions in Australia, since 2010, for Optalert Holdings Pty Ltd., a company established to develop and sell a drowsiness detection product, since 2013 and for Sydney Institute of Marine Science, a company owned by four Sydney universities which conducts marine research and education primarily focused on Sydney Harbour, since 2013. Mr. Gilmour previously served as a part-time corporate secretary for Benthic Geotech Pty Ltd., a mining services company, and for Fluorotechnics Limited, a research company in the biotech sector, until 2012. Mr. Gilmour was an auditor for Coopers & Lybrand (now PricewaterhouseCoopers) from 1965 to 1975.
Harold A. Hansen. Mr. Hansen was appointed as a member of our board of directors in January 2015. Mr. Hansen has been a certified public accountant since 1971 and was a partner in an accounting firm for over 40 years. He has served as a part-time director and consultant for Hansens Accountants since 2010 and as a part-time director and company secretary for R & H Nominees Pty Ltd., a trustee company, since 1975.
| 24 |
Mr. Damien Mathieson resigned as a member of our board of directors on March 24, 2015.
There are no family relationships between any of the executive officers and directors. Each director is elected at our annual meeting of shareholders and holds office until the next annual meeting of shareholders, or until his successor is elected and qualified.
Director Qualifications
Mr. Mathieson was appointed to our board in March 2013 following the reverse merger with IEGC described in this prospectus. Given his role in the founding and/or operations of IEGC, we believe he remains a good fit for our current needs. Mr. Mathieson has significant operational experience in our industry and brings both a practical understanding of the industry and as well as hands-on experience in our business sector to our board and a greater understanding of certain of the challenges we face in executing our growth strategy.
Our board believes that Mr. Banks’ qualifications to serve on our board include extensive experience in investing, consulting and management.
Mr. Gilmour brings significant business, management and accounting experience to the board through his various positions as corporate secretary, as well as his experience as an auditor. We expect that his experience and perspective will be beneficial to the board, and his knowledge of accounting and financial reporting processes will assist the Company’s directors in understanding and overseeing the Company’s financial reporting and internal controls.
Mr. Hansen brings financial expertise to our board of directors. We expect that Mr. Hansen’s knowledge of accounting and financial reporting processes will assist our directors in understanding, advising and overseeing our financing and investing activities, financial reporting and internal control of such activities.
Board of Directors and Board Committees
Our board has established the following committees: an audit committee, a compensation committee and a nominating and corporate governance committee. Prior to the effectiveness of the registration statement of which this prospectus forms a part, we expect that our board will also form an enterprise risk and oversight committee. The composition and responsibilities of the audit committee, the compensation committee and the nominating and corporate governance committee are described below. Members serve on these committees until their resignation or until otherwise determined by our board.
The majority of our board members are independent. The board has determined that each of Messrs. Banks, Gilmour and Hansen is an independent director pursuant to the requirements of Nasdaq , and each of the members of the audit committee satisfies the additional conditions for independence for audit committee members required by Nasdaq . In addition, each of the members of the compensation committee satisfies the additional conditions for independence for compensation committee members required by Nasdaq .
Audit Committee
Messrs. Banks, Gilmour and Hansen, each an independent director, serve on our audit committee. Mr. Gilmour is the chair of the audit committee. The primary role of the audit committee is to oversee the financial reporting and disclosure process. The board has determined that Mr. Hansen qualifies as an “audit committee financial expert,” as that term is defined in Item 407(d)(5) of Regulation S-K, as promulgated by the SEC.
Compensation Committee
Messrs. Banks and Hansen, each an independent director, serve on our compensation committee. Mr. Hansen is the chair of the compensation committee. The committee is responsible for carrying out the responsibilities delegated by the board relating to review and determination of executive compensation. Each member of the committee is independent, a “non-employee director” for purposes of Rule 16b-3 under the Exchange Act, and an “outside director” for purposes of Section 162(m) of the Code.
Nominating and Corporate Governance Committee
Messrs. Banks, Gilmour and Hansen, each an independent director, serve on our nominating committee. Mr. Banks is the chair of this committee. The committee is responsible for carrying out the responsibilities delegated by the board relating to our director nominations process, developing and maintaining our corporate governance policies and any related matters required by federal securities laws.
Our nominating and corporate governance committee will consider any director candidates recommended by our shareholders. We do not have a policy regarding the minimum qualifications for director candidates, including candidates recommended by shareholders, nor do we have a policy regarding director diversity. We have not adopted a policy regarding the handling of any potential recommendation of director candidates by our shareholders, including the procedures to be followed. Our board has not considered or adopted any of these policies as we have never received a recommendation from any shareholder for any candidate to serve on our board of directors. Given our relative size, we do not anticipate that any of our shareholders will make such a recommendation in the near future. While there have been no nominations of additional directors proposed, in the event such a proposal is made, all members of our board will participate in the consideration of director nominees. In considering a director nominee, it is likely that our board will consider the professional and/or educational background of any nominee with a view toward how this person might bring a different viewpoint or experience to our board.
Board Oversight in Risk Management
Risk is inherent with every business, and how well a business manages risk can ultimately determine its success. We face a number of risks, including liquidity risk, operational risk, strategic risk and reputation risk. Our Chief Executive Officer also serves as one of our directors and we do not have a lead director. In the context of risk oversight, at the present stage of our operations we believe that our selection of one person to serve in both positions provides the board with additional perspective which combines the operational experience of a member of management with the oversight focus of a member of the board. The business and operations of our company are managed by our board as a whole, including oversight of various risks that our company faces.
| 25 |
Code of Ethics and Business Conduct
We have adopted a Code of Ethics and Business Conduct that applies to our board of directors, our executive officers and our employees. A copy of the Code of Ethics and Business Conduct is available on our corporate website at www.investmentevolution.com, and any amendments to the Code of Ethics and Business Conduct or any waivers of its requirement related to certain matters, will be disclosed on our website and reported to the SEC, as may be required.
Director Compensation
Historically, our directors have not received compensation for their service. In connection with this offering, we adopted a new director compensation program pursuant to which each of our non-employee directors will receive an annual cash retainer of $30,000. Our corporate governance committee reviews and makes recommendations to the board regarding compensation of directors, including equity-based plans. We reimburse our non-employee directors for reasonable travel expenses incurred in attending board and committee meetings. We also intend to allow our non-employee directors to participate in any equity compensation plans that we adopt in the future.
The following table summarizes all compensation recorded by us, including IEGH, in the past two fiscal years for:
| ● | our principal executive officer or other individual serving in a similar capacity, | |
| ● | our two most highly compensated executive officers other than our principal executive officer who were serving as executive officers at December 31, 2014 as that term is defined under Rule 3b-7 of the Exchange Act, and | |
| ● | up to two additional individuals for whom disclosure would have been required but for the fact that the individual was not serving as an executive officer at December 31, 2014. |
For definitional purposes, these individuals are sometimes referred to as the “named executive officers.”
2014 SUMMARY COMPENSATION TABLE
| Name and Principal Position | Year | Salary
($) | Bonus
($) | Stock Awards ($) | Option Awards ($) | Non-Equity Incentive Plan Compensation ($) | Non-Qualified Deferred Compensation Earnings ($) | All
Other Compensation ($) | Total
($) | |||||||||||||||||||||
| Paul Mathieson, | 2014 | 300,000 | (1) | 1,000,000 | (1) | 0 | 0 | 0 | 0 | 0 | 1,300,000 | |||||||||||||||||||
| Chief Executive Officer (2) | 2013 | 1,000,000 | (3) | 0 | 0 | 0 | 0 | 0 | 0 | 1,000,000 | ||||||||||||||||||||
| Carla Cholewinski, | 2014 | 200,000 | 10,000 | 0 | 0 | 0 | 0 | 0 | 210,000 | |||||||||||||||||||||
| Chief Operating Officer and Chief Credit Officer | 2013 | 200,000 | 10,000 | 0 | 0 | 0 | 0 | 0 | 210,000 | |||||||||||||||||||||
| (1) | In 2014, Mr. Mathieson agreed to defer receipt of a portion of his earned salary and bonus, if any. No interest was accrued or due on the deferred salary. The largest amount owed to Mr. Mathieson by us during 2014 was $522,415 as of June 30, 2014. Such amount represents (i) deferred salary, (ii) reimbursement amounts owed by us to Mr. Mathieson for certain business expenses incurred by Mr. Mathieson, and (iii) the dividend declared by us in 2014 on shares of Series A preferred stock owned by Mr. Mathieson, but not paid to Mr. Mathieson. On March 31, 2014, Mr. Mathieson purchased 1,000,000 shares of Series A preferred stock from us for an aggregate purchase price of $1,000,000. The full amount of the purchase price was offset by reimbursement amounts owed by us to Mr. Mathieson and the deferred salary owed to Mr. Mathieson by us. In addition, on June 30, 2014, Mr. Mathieson purchased 200,000,000 shares of common stock from us for an aggregate purchase price of $1,000,000. The full amount of the purchase price was offset by reimbursement amounts owed by us to Mr. Mathieson, the deferred salary owed to Mr. Mathieson by us, and the Series A preferred stock dividend owed by us to Mr. Mathieson. As of December 31, 2014, $113,799.93 in deferred salary and business expense reimbursement was due and owing to Mr. Mathieson. As of January 31, 2015, we owed Mr. Mathieson $81,741.06 in deferred salary and reimbursement amounts. | |
| (2) | Mr. Mathieson was appointed our Chief Executive Officer in March 2013. | |
| (3) | In 2013, Mr. Mathieson agreed to defer receipt of a portion of his earned salary. No interest was accrued or due on the deferred salary. The largest amount owed to Mr. Mathieson by us during 2013 was $1,640,672 as of June 30, 2013. Such amount represents (i) deferred salary, and (ii) reimbursement amounts owed by us to Mr. Mathieson for certain business expenses incurred by Mr. Mathieson. On June 30, 2013, Mr. Mathieson purchased 208,494,108 shares of common stock from us for an aggregate purchase price of $1,042,471. The full amount of the purchase price was offset by reimbursement amounts owed by us to Mr. Mathieson and the deferred salary owed to Mr. Mathieson by us. As of December 31, 2013, no deferred salary was due and owing to Mr. Mathieson. |
Compensation of Management
We have not entered into employment agreements with any of our executive officers. As business develops, we may enter into employment arrangements with our management personnel, on such terms as determined by our board of directors.
Outstanding Equity Awards at 2014 Fiscal Year-End
The following table provides information concerning unexercised options, stock that has not vested and equity incentive plan awards for each named executive officer outstanding as of December 31, 2014:
| OPTION AWARDS | STOCK AWARDS | |||||||||||||||||||||||||||||||||||
| Name | Number
of Securities Underlying Unexercised Options (#) Exercisable | Number
of Securities Underlying Unexercised Options (#) Unexercisable | Equity Incentive Plan Awards: Number of Securities Underlying Unexercised Unearned Options (#) | Option Exercise Price ($) | Option
Expiration Date | Number
of Shares or Units of Stock That Have Not Vested (#) | Market
Value of Shares or Units of Stock That Have Not Vested ($) | Equity
Incentive Plan Awards: Number of Unearned Shares, Units or Other Rights that Have Not Vested (#) | Equity
Incentive Plan Awards: Market or Payout Value of Unearned Shares, Units or Other Rights That Have Not Vested (#) | |||||||||||||||||||||||||||
| Paul Mathieson | 0 | 0 | 0 | 0 | 0 | 0 | 0 | 0 | 0 | |||||||||||||||||||||||||||
| Carla Cholewinski | 0 | 0 | 0 | 0 | 0 | 0 | 0 | 0 | 0 | |||||||||||||||||||||||||||
| 26 |
Limitation on Liability
The Florida Business Corporation Act permits the indemnification of directors, employees, officers and agents of Florida corporations. Our articles of incorporation and bylaws provide that we will indemnify our directors and officers to the fullest extent permitted by the Florida Business Corporation Act.
The provisions of the Florida Business Corporation Act that authorize indemnification do not eliminate the duty of care of a director, and in appropriate circumstances equitable remedies such as injunctive or other forms of non-monetary relief will remain available under Florida law. In addition, each director will continue to be subject to liability for:
| ● | violations of criminal laws, unless the director had reasonable cause to believe his conduct was lawful or had no reasonable cause to believe his conduct was unlawful, | |
| ● | deriving an improper personal benefit from a transaction, | |
| ● | voting for or assenting to an unlawful distribution, and | |
| ● | willful misconduct or conscious disregard for our best interests in a proceeding by or in the right of a shareholder. |
The statute does not affect a director’s responsibilities under any other law, such as the Federal securities laws. The effect of the foregoing is to require our company to indemnify our officers and directors for any claim arising against such persons in their official capacities if such person acted in good faith and in a manner that he reasonably believed to be in or not opposed to the best interests of the corporation and, with respect to any criminal action or proceeding, had no reasonable cause to believe his conduct was unlawful.
Insofar as the limitation of, or indemnification for, liabilities arising under the Securities Act may be permitted to directors, officers, or persons controlling us pursuant to the foregoing, or otherwise, we have been advised that, in the opinion of the SEC, such limitation or indemnification is against public policy as expressed in the Securities Act and is, therefore, unenforceable.
CERTAIN RELATIONSHIPS AND RELATED TRANSACTIONS
Effective June 30, 2013, the Company entered into a Rights Sales Agreement, under which the Company acquired the Australian rights to conduct business throughout Australia, from IEG Holdings Limited ACN 131 987 838, its parent (until its shares were distributed to the ultimate shareholders of IEG Holdings Limited ACN 131 987 838). The purchase price for the Rights Sales Agreement was $1,500,000 which was paid as follows:
| Paid through advances to (payments to third parties made on behalf of) IEG Holdings Limited ACN 131 987 838 | $ | 1,074,937 | ||
| Offset amounts owed from Company shareholders who are also creditors of IEG Holdings Limited ACN 131 987 838 | $ | 425,063 |
The amounts owed from Company shareholders who are also creditors of IEG Holdings Limited ACN 131 987 838 relate to unpaid consulting fees. Such shareholders are Damien Mathieson, a former member of our board of directors and a selling stockholder in this offering, Fenwick Corporation Pty Ltd. (“Fenwick”) and POTB Pty Ltd (“POTB”). Fenwick is the trustee for Fenwick Investment A/C. Clem Tacca, who is a selling stockholder in this offering, is the director of Fenwick and the beneficial owner of Fenwick Investment A/C. POTB is the trustee for Muda Jake Trust. Judith Patricia Willoughby and Wayne Robert Willoughby, who are selling stockholders in this offering, are beneficial owners of the Muda Jake Trust.
On January 28, 2013, IEGC entered into the Stock Exchange Agreement among IEGC, its sole shareholder IEG, and our company. Under the terms of the Stock Exchange Agreement, we agreed to acquire a 100% interest in IEGC for 272,447,137 shares of our common stock after giving effect to a 1-for-6 reverse stock split. On February 14, 2013, we filed the Amended Articles with the Secretary of State of Florida which had the effect of:
| ● | changing our name from Ideal Accents, Inc. to IEG Holdings Corporation, | |
| ● | increasing the number of shares of our authorized common stock to 1,000,000,000, $.001 par value, | |
| ● | creating 50,000,000 shares of “blank-check” preferred stock, and | |
| ● | effecting the Reverse Stock Split pursuant to the terms of the Stock Exchange Agreement. |
FINRA approved our Amended Articles on March 11, 2013.
On March 13, 2013, we completed the acquisition of IEGC under the terms of the Stock Exchange Agreement and issued to IEG 272,447,137 shares of our common stock after giving effect to the Reverse Stock Split whereby we acquired a 100% interest in IEGC. The stock exchange agreement between IEGC, IEG and the Company resulted in a reverse acquisition with a public shell, with IEGC being the accounting acquirer. The Company issued 90,815 shares of its common stock to the shareholders of IEG (IEG transferred its ownership in IEGC to its shareholders, which is why the shares were issued to the ultimate shareholders of IEG rather than to IEG itself) for each share of IEGC, in exchange for 100% ownership interest in IEGC. See “Description of Business—Corporate History.”
PRINCIPAL AND SELLING STOCKHOLDERS
At March 30, 2015, we had 2,158,110,323 shares of our common stock issued and outstanding. The following table sets forth information regarding the beneficial ownership of our common stock as of March 30, 2015, and as adjusted to reflect the sale of common stock offered by the selling stockholders in this offering, for:
| ● | each of our named executive officers, | |
| ● | each of our directors, | |
| ● | all of our directors and executive officers as a group, | |
| ● | each stockholder known by us to be the beneficial owner of more than 5% of our outstanding shares of common stock, and | |
| ● | all selling stockholders. |
Information on beneficial ownership of securities is based upon a record list of our shareholders and we have determined beneficial ownership in accordance with the rules of the SEC. We believe, based on the information furnished to us, that the persons and entities named in the table below have sole voting and investment power with respect to all shares of common stock that they beneficially own, subject to applicable community property laws. Based on the information provided to us by or on behalf of the selling stockholders, no selling stockholder is a broker-dealer or an affiliate of a broker-dealer.
All of the securities owned by the selling security holders may be offered hereby. The selling security holders may sell some or all of the securities owned by them, and there are currently no agreements, arrangements or understandings with respect to the sale of any of the securities. The table below assumes that the selling stockholders sell all of the shares offered for sale. The business address of each person listed is in care of IEG Holdings Corporation, 6160 West Tropicana Ave, Suite E-13, Las Vegas, NV 89103.
| 27 |
| Name of Beneficial Owner | No. of Shares Owned Prior to Offering | Percent of Shares Beneficially Owned Prior to Offering | No. of Shares Being Offered | No. of Shares Beneficially Owned After Offering | Percent of Shares Beneficially Owned After Offering | |||||||||||||||
| Named Executive Officers and Directors: | ||||||||||||||||||||
| PAUL MATHIESON | 477,992,144 | 22.15 | % | 23,994,607 | 453,997,537 | 21.04 | % | |||||||||||||
| CARLA CHOLEWINSKI | - | 0.00 | % | - | - | 0.00 | % | |||||||||||||
| MATTHEW I. BANKS | - | 0.00 | % | - | - | 0.00 | % | |||||||||||||
| IAN M. GILMOUR (1) | 10,168,302 | 0.47 | % | 603,415 | 9,564,887 | 0.44 | % | |||||||||||||
| HAROLD A. HANSEN (2) | 10,564,945 | 0.49 | % | 861,310 | 9,703,635 | 0.4 5 | % | |||||||||||||
| All executive officers and directors as a group (5 persons) | 498,725,391 | 23.11 | % | 25,316,269 | 473,409,122 | 21.94 | % | |||||||||||||
| Other 5% Holders: | ||||||||||||||||||||
| JUDITH PATRICIA WILLOUGHBY & WAYNE ROBERT WILLOUGHBY (3) | 215,314,492 | 9.98 | % | 10,955,725 | 204,358,767 | 9.47 | % | |||||||||||||
| CLEM TACCA (4) | 176,276,920 | 8.17 | % | 9,098,846 | 167,178,074 | 7.7 3 | % | |||||||||||||
| FRANCIS WRIGHT WILKIE (5) | 111,398,160 | 5.16 | % | 5,759,908 | 105,638,252 | 4.89 | % | |||||||||||||
| Other Selling Stockholders: | ||||||||||||||||||||
| AARON ANDREW BLISS | 444,143 | 0.02 | % | 117,207 | 326,936 | 0.02 | % | |||||||||||||
| ADAM BLUME | 1,403,758 | 0.07 | % | 165,188 | 1,238,570 | 0.06 | % | |||||||||||||
| ADAM MALONEY | 1,493 | 0.00 | % | 1,493 | - | 0.00 | % | |||||||||||||
| ADRIAN PETER COMMONS | 1,194 | 0.00 | % | 1,194 | - | 0.00 | % | |||||||||||||
| ADRIAN WYBORN | 1,800 | 0.00 | % | 1,800 | - | 0.00 | % | |||||||||||||
| ALAN BURNS | 19,044 | 0.00 | % | 19,044 | - | 0.00 | % | |||||||||||||
| ALAN BURNS | 778 | 0.00 | % | 778 | - | 0.00 | % | |||||||||||||
| ALAN GEOFFREY HARTLAND & ELEANOR JOYCE HARTLAND (6) | 755,979 | 0.04 | % | 132,799 | 623,180 | 0.03 | % | |||||||||||||
| ALAN GILLESPIE | 304,905 | 0.01 | % | 110,245 | 194,660 | 0.01 | % | |||||||||||||
| ALAN GILLESPIE | 303,270 | 0.01 | % | 110,164 | 193,107 | 0.01 | % | |||||||||||||
| ALAN LAMB & SANDRA GIVENS (7) | 2,987,856 | 0.14 | % | 244,393 | 2,743,463 | 0.13 | % | |||||||||||||
| ALAN THYNNE & JUDITH THYNNE (8) | 1,250 | 0.00 | % | 1,250 | - | 0.00 | % | |||||||||||||
| ALAN YOUNG | 19,620 | 0.00 | % | 19,620 | - | 0.00 | % | |||||||||||||
| ALBERT ANTHONY MACRI | 98,096 | 0.00 | % | 98,096 | - | 0.00 | % | |||||||||||||
| ALBERT ANTHONY MACRI & EST JANICE VERA MACRI | 30,655 | 0.00 | % | 30,655 | - | 0.00 | % | |||||||||||||
| ALDO SACCO (9) | 3,206,666 | 0.15 | % | 255,333 | 2,951,333 | 0.14 | % | |||||||||||||
| ALEX CAPOVILLA (10) | 1,485,834 | 0.07 | % | 169,292 | 1,316,542 | 0.06 | % | |||||||||||||
| ALEXANDER K ROLLEY & LANA T ROLLEY (11) | 1,322,265 | 0.06 | % | 256,113 | 1,066,152 | 0.05 | % | |||||||||||||
| ALEXANDER THOMAS COCKBURN-CAMPBELL & KERRY ANNE COCKBURN-CAMPBELL | 180,086 | 0.01 | % | 104,004 | 76,082 | 0.00 | % | |||||||||||||
| ALEXANDRA KATE WOOD | 429,299 | 0.02 | % | 116,465 | 312,834 | 0.01 | % | |||||||||||||
| ALFRED AZZOPARDI | 5,978 | 0.00 | % | 5,978 | - | 0.00 | % | |||||||||||||
| ALISTAIR LEGGE | 14,715 | 0.00 | % | 14,715 | - | 0.00 | % | |||||||||||||
| ALLAN DAVID SUTHERLAND & DULCIE MAE SUTHERLAND | 10,298 | 0.00 | % | 10,298 | - | 0.00 | % | |||||||||||||
| ALLEN CHARLES BRITTIAN | 18,393 | 0.00 | % | 18,393 | - | 0.00 | % | |||||||||||||
| ALLISON MARY FRIAR & RICHARD KEITH FRIAR | 264 | 0.00 | % | 264 | - | 0.00 | % | |||||||||||||
| ALWYN REGINALD DYER & KERRYN JEAN DYER (12) | 1,417,004 | 0.07 | % | 165,850 | 1,251,154 | 0.06 | % | |||||||||||||
| AMANDA HARGREAVES | 2,324,704 | 0.11 | % | 211,235 | 2,113,469 | 0.10 | % | |||||||||||||
| AMBER CORRIGAN | 61,566 | 0.00 | % | 61,566 | - | 0.00 | % | |||||||||||||
| AMY ALYCE WHITE | 36 | 0.00 | % | 36 | - | 0.00 | % | |||||||||||||
| ANDRE PAUL | 107 | 0.00 | % | 107 | - | 0.00 | % | |||||||||||||
| ANDREA KIRSTAN TURNER | 33,832 | 0.00 | % | 33,832 | - | 0.00 | % | |||||||||||||
| ANDREW ASKER & LEANNE ASKER (13) | 102,408 | 0.00 | % | 102,408 | - | 0.00 | % | |||||||||||||
| ANDREW CUNNINGHAM | 130 | 0.00 | % | 130 | - | 0.00 | % | |||||||||||||
| ANDREW DUC NGHIA TRAN | 3,991 | 0.00 | % | 3,991 | - | 0.00 | % | |||||||||||||
| ANDREW FLETCHER | 27,212 | 0.00 | % | 27,212 | - | 0.00 | % | |||||||||||||
| ANDREW FRASER HAMISH MURRAY (14) | 2,004,852 | 0.09 | % | 292,183 | 1,712,669 | 0.08 | % | |||||||||||||
| ANDREW FUDGE & KAREN FUDGE (15) | 625 | 0.00 | % | 625 | - | 0.00 | % | |||||||||||||
| ANDREW LEONARD SMITHERS | 400,736 | 0.02 | % | 115,037 | 285,699 | 0.01 | % | |||||||||||||
| ANDREW ROBERT NGUYEN THUAN | 250 | 0.00 | % | 250 | - | 0.00 | % | |||||||||||||
| ANDREW SCOTT NOBLE & CAROL MARGARET NOBLE | 326 | 0.00 | % | 326 | - | 0.00 | % | |||||||||||||
| ANDREW SCOTT WILLIS | 167,912 | 0.01 | % | 103,396 | 64,516 | 0.00 | % | |||||||||||||
| ANDREW SHAW & JOSEPHINE BURROWS | 981 | 0.00 | % | 981 | - | 0.00 | % | |||||||||||||
| ANDREW VINCENT SMART | 411,100 | 0.02 | % | 115,555 | 295,545 | 0.01 | % | |||||||||||||
| ANDREW ZIVANOVIC | 200,736 | 0.01 | % | 105,037 | 95,699 | 0.00 | % | |||||||||||||
| ANGELINA ROSALINE HEATH | 7,141 | 0.00 | % | 7,141 | - | 0.00 | % | |||||||||||||
| ANGELO MAGGIOTTO & MARIA MAGGIOTTO & SILVIA MAGGIOTTO (16) | 36,975,000 | 1.71 | % | 1,943,750 | 35,031,250 | 1.62 | % | |||||||||||||
| 28 |
| Name of Beneficial Owner | No. of Shares Owned Prior to Offering | Percent of Shares Beneficially Owned Prior to Offering | No. of Shares Being Offered | No. of Shares Beneficially Owned After Offering | Percent of Shares Beneficially Owned After Offering | |||||||||||||||
| ANGUS PYKE | 21,000 | 0.00 | % | 21,000 | - | 0.00 | % | |||||||||||||
| ANGUS SCOTT EMERSON WILKIE | 1,442,104 | 0.07 | % | 167,105 | 1,274,999 | 0.06 | % | |||||||||||||
| ANNA SII | 3,493 | 0.00 | % | 3,493 | - | 0.00 | % | |||||||||||||
| ANNE BIGELOW | 1,653 | 0.00 | % | 1,653 | - | 0.00 | % | |||||||||||||
| ANNE FIELD (17) | 1,403,000 | 0.07 | % | 165,150 | 1,237,850 | 0.06 | % | |||||||||||||
| ANNE LYNETTE HICKS | 30 | 0.00 | % | 30 | - | 0.00 | % | |||||||||||||
| ANNE RUYS (18) | 126 | 0.00 | % | 126 | - | 0.00 | % | |||||||||||||
| ANNEKE WOOD | 96 | 0.00 | % | 96 | - | 0.00 | % | |||||||||||||
| ANNETTE BUDARICK (19) | 416,916 | 0.02 | % | 116,621 | 300,295 | 0.01 | % | |||||||||||||
| ANNETTE PATRICIA RICHARDS | 103,000 | 0.00 | % | 100,150 | 2,850 | 0.00 | % | |||||||||||||
| ANNIKA DILLENBECK | 4,202 | 0.00 | % | 4,202 | - | 0.00 | % | |||||||||||||
| ANTHONY BADGER & LINDA KACHEL | 838,779 | 0.04 | % | 136,939 | 701,840 | 0.03 | % | |||||||||||||
| ANTHONY BENTLEY & CHERYL BENTLEY | 1,028 | 0.00 | % | 1,028 | - | 0.00 | % | |||||||||||||
| ANTHONY CICCARELLI | 1,892 | 0.00 | % | 1,892 | - | 0.00 | % | |||||||||||||
| ANTHONY CICCARELLI & CARLA CICCARELLI | 104,227 | 0.00 | % | 100,211 | 4,016 | 0.00 | % | |||||||||||||
| ANTHONY DEAN LAZENBY | 566,764 | 0.03 | % | 123,338 | 443,426 | 0.02 | % | |||||||||||||
| ANTHONY HOUSTON (20) | 53,250 | 0.00 | % | 53,250 | - | 0.00 | % | |||||||||||||
| ANTHONY JOHN DUNLOP | 1,878,970 | 0.09 | % | 188,949 | 1,690,022 | 0.08 | % | |||||||||||||
| ANTHONY JOHN TRETHEWAY & THANAPA TRETHEWAY (21) | 555,016 | 0.03 | % | 157,544 | 397,472 | 0.02 | % | |||||||||||||
| ANTHONY KOOY | 585,464 | 0.03 | % | 124,273 | 461,191 | 0.02 | % | |||||||||||||
| ANTHONY KOOY & ABIGAIL KOOY (22) | 421,636 | 0.02 | % | 116,082 | 305,554 | 0.01 | % | |||||||||||||
| ANTHONY LLOYD VAN COOTEN | 809,681 | 0.04 | % | 135,484 | 674,197 | 0.03 | % | |||||||||||||
| ANTHONY LUCI & MIREILLE LUCI | 10,559 | 0.00 | % | 10,559 | - | 0.00 | % | |||||||||||||
| ANTHONY MICHAEL KEATING | 1,962 | 0.00 | % | 1,962 | - | 0.00 | % | |||||||||||||
| ANTHONY PAUL BEUK (23) | 8,500 | 0.00 | % | 8,500 | - | 0.00 | % | |||||||||||||
| ANTHONY PAUL JUDSON | 10,834 | 0.00 | % | 10,834 | - | 0.00 | % | |||||||||||||
| ANTHONY PIZZOLATO | 191,000 | 0.01 | % | 104,550 | 86,450 | 0.00 | % | |||||||||||||
| ANTHONY TACCONE | 89,920 | 0.00 | % | 89,920 | - | 0.00 | % | |||||||||||||
| ANTHONY YOUNG & DEBRA YOUNG (24) | 1,643,676 | 0.08 | % | 177,184 | 1,466,492 | 0.07 | % | |||||||||||||
| ANTONIA AZZOPARDI | 5,978 | 0.00 | % | 5,978 | - | 0.00 | % | |||||||||||||
| ANTONY JAMES HING | 225 | 0.00 | % | 225 | - | 0.00 | % | |||||||||||||
| ARNOLD WILLIAM ROBERTSON | 700,000 | 0.03 | % | 130,000 | 570,000 | 0.03 | % | |||||||||||||
| ARTHUR KOULOURIS | 477,468 | 0.02 | % | 118,873 | 358,595 | 0.02 | % | |||||||||||||
| ASHLEY HUDSON | 61,310 | 0.00 | % | 61,310 | - | 0.00 | % | |||||||||||||
| ASHLEY HUDSON | 21,294 | 0.00 | % | 21,294 | - | 0.00 | % | |||||||||||||
| ATHENA TINA MCBRIDE | 9,000 | 0.00 | % | 9,000 | - | 0.00 | % | |||||||||||||
| ATTILIO IMPERATORI & CHRISTINE HELEN LOUISE IMPERATORI | 4,212 | 0.00 | % | 4,212 | - | 0.00 | % | |||||||||||||
| AUGUSTO TACCONE | 89,920 | 0.00 | % | 89,920 | - | 0.00 | % | |||||||||||||
| BARBARA ALICE PIESSE (25) | 556,765 | 0.03 | % | 217,838 | 338,927 | 0.02 | % | |||||||||||||
| BARBARA KENDRICK | 1,070,877 | 0.05 | % | 148,544 | 922,333 | 0.04 | % | |||||||||||||
| BARBARA MERREN BREMNER | 4,697 | 0.00 | % | 4,697 | - | 0.00 | % | |||||||||||||
| BARRIE HUDSON & CHRISTINE ANNE HUDSON (26) | 3,591,844 | 0.17 | % | 274,592 | 3,317,252 | 0.15 | % | |||||||||||||
| BARRIE HUGHES & ELIZABETH HUGHES | 474,967 | 0.02 | % | 118,748 | 356,219 | 0.02 | % | |||||||||||||
| BARRY ALAN ELMS | 10,025 | 0.00 | % | 10,025 | - | 0.00 | % | |||||||||||||
| BARRY CUTHBERT | 43 | 0.00 | % | 43 | - | 0.00 | % | |||||||||||||
| BARRY DAVIS | 13,969 | 0.00 | % | 13,969 | - | 0.00 | % | |||||||||||||
| BARRY EDWARD TANTON & ELIZABETH MARY TANTON (27) | 71,178,088 | 3.30 | % | 3,748,904 | 67,429,184 | 3.1 2 | % | |||||||||||||
| BARRY FREDERICK GEORGE LISTER & DEANNE ISOBEL AYLIFFE LISTER | 18,805 | 0.00 | % | 18,805 | - | 0.00 | % | |||||||||||||
| BARRY JAMES SILLETT & BEVERLEY ANN SILLETT | 270 | 0.00 | % | 270 | - | 0.00 | % | |||||||||||||
| BARRY JOHN GANT & BEVERLY LORRAINE GANT (28) | 13,640,731 | 0.63 | % | 872,037 | 12,768,694 | 0. 59 | % | |||||||||||||
| 29 |
| Name of Beneficial Owner | No. of Shares Owned Prior to Offering | Percent of Shares Beneficially Owned Prior to Offering | No. of Shares Being Offered | No. of Shares Beneficially Owned After Offering | Percent of Shares Beneficially Owned After Offering | |||||||||||||||
| BARRY JOHN OATES & ALEXANDRA OATES (29) | 4,718,653 | 0.22 | % | 425,933 | 4,292,720 | 0.20 | % | |||||||||||||
| BARRY NORMAN LAW | 873,248 | 0.04 | % | 138,662 | 734,586 | 0.03 | % | |||||||||||||
| BARRY NORMAN LAW & JENNIFER JOYCE SHEHADEH | 12,240 | 0.00 | % | 12,240 | - | 0.00 | % | |||||||||||||
| BARRY ROBERT BULLEN | 4,401,472 | 0.20 | % | 315,074 | 4,086,398 | 0.19 | % | |||||||||||||
| BARRY WATSON & JANET WATSON (30) | 3,290,704 | 0.15 | % | 259,535 | 3,031,169 | 0.14 | % | |||||||||||||
| BEATRICE SIDARI | 61,566 | 0.00 | % | 61,566 | - | 0.00 | % | |||||||||||||
| BEC MARSHALL | 229,242 | 0.01 | % | 106,462 | 122,780 | 0.01 | % | |||||||||||||
| BELINDA JONES & CHARLES JONES (31) | 1,461,032 | 0.07 | % | 168,052 | 1,292,980 | 0.06 | % | |||||||||||||
| BEN JONES | 4,231 | 0.00 | % | 4,231 | - | 0.00 | % | |||||||||||||
| BENEDICT CARL WILLIAM HOLLAND | 666,654 | 0.03 | % | 128,333 | 538,321 | 0.02 | % | |||||||||||||
| BENJAMIN ALAN YOUNG | 103,192 | 0.00 | % | 100,160 | 3,032 | 0.00 | % | |||||||||||||
| BENJAMIN JOHN THOMPSON | 1,530,381 | 0.07 | % | 171,519 | 1,358,862 | 0.06 | % | |||||||||||||
| BENJAMIN JOHN THOMPSON | 1,729,157 | 0.08 | % | 181,458 | 1,547,699 | 0.07 | % | |||||||||||||
| BENJAMIN MARTIN EDWARDS | 33 | 0.00 | % | 33 | - | 0.00 | % | |||||||||||||
| BENJAMIN MELLERS (32) | 1,731,176 | 0.08 | % | 276,559 | 1,454,617 | 0.07 | % | |||||||||||||
| BENJAMIN WILKIE | 764,192 | 0.04 | % | 133,210 | 630,982 | 0.03 | % | |||||||||||||
| BENJAMIN WILKIE | 692,990 | 0.03 | % | 129,650 | 563,341 | 0.03 | % | |||||||||||||
| BERKELEY MCLEISH WYNNE | 73,248 | 0.00 | % | 73,248 | - | 0.00 | % | |||||||||||||
| BERKELEY MCLEISH WYNNE | 3,299 | 0.00 | % | 3,299 | - | 0.00 | % | |||||||||||||
| BERNADETTE PICKERING & CAROL JOHNSON | 43 | 0.00 | % | 43 | - | 0.00 | % | |||||||||||||
| BETTY FREEMAN | 6,680 | 0.00 | % | 6,680 | - | 0.00 | % | |||||||||||||
| BETTY FREEMAN | 663 | 0.00 | % | 663 | - | 0.00 | % | |||||||||||||
| BEVERLEY GORDON | 528 | 0.00 | % | 528 | - | 0.00 | % | |||||||||||||
| BEVERLEY JUNE HILLIER | 34 | 0.00 | % | 34 | - | 0.00 | % | |||||||||||||
| BODO MAX PFAU & MARJORIE CLARE PFAU | 25,385 | 0.00 | % | 25,385 | - | 0.00 | % | |||||||||||||
| BONNIE JUNE GOODRICH (33) | 3,008,227 | 0.14 | % | 245,411 | 2,762,816 | 0.13 | % | |||||||||||||
| BREE CHRISTINA GRANT & DALE PHILIP ALAN GRANT | 166,772 | 0.01 | % | 103,339 | 63,433 | 0.00 | % | |||||||||||||
| BRENDAN COLVIN & JOAN COLVIN | 24,524 | 0.00 | % | 24,524 | - | 0.00 | % | |||||||||||||
| BRENDAN PROWSE (34) | 1,449,048 | 0.07 | % | 167,452 | 1,281,596 | 0.06 | % | |||||||||||||
| BRENDON JAMES O'LOUGHLIN & CHRISTINE LOUISE O'LOUGHLIN | 72 | 0.00 | % | 72 | - | 0.00 | % | |||||||||||||
| BRETT DURDIN | 836,660 | 0.04 | % | 136,833 | 699,827 | 0.03 | % | |||||||||||||
| BRETT HANSEN (35) | 771,431 | 0.04 | % | 218,056 | 553,375 | 0.03 | % | |||||||||||||
| BRETT HANSEN & JENNIFER HANSEN (36) | 1,032,045 | 0.05 | % | 241,602 | 790,443 | 0.04 | % | |||||||||||||
| BRETT JOHN CONROY & SUZANNA KASTELIC | 43 | 0.00 | % | 43 | - | 0.00 | % | |||||||||||||
| BRETT VAUGHAN RAMSEY | 20,509 | 0.00 | % | 20,509 | - | 0.00 | % | |||||||||||||
| BRETT VAUGHAN RAMSEY | 6,609 | 0.00 | % | 6,609 | - | 0.00 | % | |||||||||||||
| BRETT WARD (37) | 11,112 | 0.00 | % | 11,112 | - | 0.00 | % | |||||||||||||
| BRIAN & CHRISTINE PRICE | 36,624 | 0.00 | % | 36,624 | - | 0.00 | % | |||||||||||||
| BRIAN & SUSAN GARNETT (38) | 572,066 | 0.03 | % | 123,603 | 448,463 | 0.02 | % | |||||||||||||
| BRIAN & VALDA PHIPPS | 5,860 | 0.00 | % | 5,860 | - | 0.00 | % | |||||||||||||
| BRIAN ANDREW SMITH | 49,048 | 0.00 | % | 49,048 | - | 0.00 | % | |||||||||||||
| BRIAN HUDSON | 43 | 0.00 | % | 43 | - | 0.00 | % | |||||||||||||
| BRIAN JEFFREY PRICE & CHRISTINE LEE PRICE | 955 | 0.00 | % | 955 | - | 0.00 | % | |||||||||||||
| BRIAN JOHN HUDSON | 619 | 0.00 | % | 619 | - | 0.00 | % | |||||||||||||
| BRIAN MARTIN & CHERYL MARTIN (39) | 146,677 | 0.01 | % | 146,677 | - | 0.00 | % | |||||||||||||
| BRIAN PHIPPS & VALDA PHIPPS | 733 | 0.00 | % | 733 | - | 0.00 | % | |||||||||||||
| BRIAN PRICE & CHRISTINE PRICE | 400,767 | 0.02 | % | 115,038 | 285,729 | 0.01 | % | |||||||||||||
| BRIDIE NUGENT | 1,408 | 0.00 | % | 1,408 | - | 0.00 | % | |||||||||||||
| BRONWYN EDWARDS | 430,304 | 0.02 | % | 116,515 | 313,789 | 0.01 | % | |||||||||||||
| BRUCE ANTHONY ROBINSON & SHARA THERESE ROBINSON (40) | 4,126 | 0.00 | % | 4,126 | - | 0.00 | % | |||||||||||||
| 30 |
| Name of Beneficial Owner | No. of Shares Owned Prior to Offering | Percent of Shares Beneficially Owned Prior to Offering | No. of Shares Being Offered | No. of Shares Beneficially Owned After Offering | Percent of Shares Beneficially Owned After Offering | |||||||||||||||
| BRUCE GREENLAND (41) | 20,437 | 0.00 | % | 20,437 | - | 0.00 | % | |||||||||||||
| BRUCE HINCKFUSS (42) | 2,000,000 | 0.09 | % | 195,000 | 1,805,000 | 0.08 | % | |||||||||||||
| BRUCE JONES & LYNETTE JONES | 54 | 0.00 | % | 54 | - | 0.00 | % | |||||||||||||
| BRUCE REGINALD LUDEWIGS | 81 | 0.00 | % | 81 | - | 0.00 | % | |||||||||||||
| BRUCE ROBERT WHITE & KATHLEEN MARJORIE WHITE | 1,873,395 | 0.09 | % | 188,670 | 1,684,725 | 0.08 | % | |||||||||||||
| BRUCE ROSS HERIOT | 2,500 | 0.00 | % | 2,500 | - | 0.00 | % | |||||||||||||
| BYRON HARRIS MARK | 1,892 | 0.00 | % | 1,892 | - | 0.00 | % | |||||||||||||
| BYRON THANOPOULOS | 625 | 0.00 | % | 625 | - | 0.00 | % | |||||||||||||
| CAMERON JOHN WOODROW | 2,453 | 0.00 | % | 2,453 | - | 0.00 | % | |||||||||||||
| CAMERON TERRY | 111 | 0.00 | % | 111 | - | 0.00 | % | |||||||||||||
| CAMERON WOODROW | 9,524 | 0.00 | % | 9,524 | - | 0.00 | % | |||||||||||||
| CAMILLA PRENDERGAST | 406,868 | 0.02 | % | 115,343 | 291,525 | 0.01 | % | |||||||||||||
| CAMPBELL BLACK | 20,375 | 0.00 | % | 20,375 | - | 0.00 | % | |||||||||||||
| CARLA CICCARELLI | 1,892 | 0.00 | % | 1,892 | - | 0.00 | % | |||||||||||||
| CARLA PIA MARIA CROOKS | 554,497 | 0.03 | % | 122,725 | 431,772 | 0.02 | % | |||||||||||||
| CAROLINE JOY WELLS | 34 | 0.00 | % | 34 | - | 0.00 | % | |||||||||||||
| CAROLYN DOBAY | 10,385 | 0.00 | % | 10,385 | - | 0.00 | % | |||||||||||||
| CAROLYN JO-ANNE PAYNE | 233,208 | 0.01 | % | 106,660 | 126,548 | 0.01 | % | |||||||||||||
| CATHERINE BADDOCK | 31,500 | 0.00 | % | 31,500 | - | 0.00 | % | |||||||||||||
| CHARLES ANTHONY JONES & BELINDA MAREE JONES | 422,072 | 0.02 | % | 116,104 | 305,968 | 0.01 | % | |||||||||||||
| CHARLES JONES | 547,144 | 0.03 | % | 122,357 | 424,787 | 0.02 | % | |||||||||||||
| CHARLES STARKEY & ANNE STARKEY | 43 | 0.00 | % | 43 | - | 0.00 | % | |||||||||||||
| CHERYL HOLMES | 36,786 | 0.00 | % | 36,786 | - | 0.00 | % | |||||||||||||
| CHERYL K MCEVOY | 38 | 0.00 | % | 38 | - | 0.00 | % | |||||||||||||
| CHERYL MARGARET MITCHELL | 61,566 | 0.00 | % | 61,566 | - | 0.00 | % | |||||||||||||
| CHERYL MCEVOY | 30 | 0.00 | % | 30 | - | 0.00 | % | |||||||||||||
| CHING NG | 35 | 0.00 | % | 35 | - | 0.00 | % | |||||||||||||
| CHRIS BERGAMIN | 7,358 | 0.00 | % | 7,358 | - | 0.00 | % | |||||||||||||
| CHRIS LEEHANE & KAREN LEEHANE | 14,715 | 0.00 | % | 14,715 | - | 0.00 | % | |||||||||||||
| CHRISTINA DAVIDSON & RUSSELL DAVIDSON | 85 | 0.00 | % | 85 | - | 0.00 | % | |||||||||||||
| CHRISTINA MARY DUMARESG | 5,519 | 0.00 | % | 5,519 | - | 0.00 | % | |||||||||||||
| CHRISTINE ANN GILMOUR | 63,042 | 0.00 | % | 63,042 | - | 0.00 | % | |||||||||||||
| CHRISTINE FRANCES CAIN | 557,396 | 0.03 | % | 122,870 | 434,526 | 0.02 | % | |||||||||||||
| CHRISTINE HELEN KEMP | 5,860 | 0.00 | % | 5,860 | - | 0.00 | % | |||||||||||||
| CHRISTINE MARY SMITH | 101 | 0.00 | % | 101 | - | 0.00 | % | |||||||||||||
| CHRISTOPHER BERNARD OLDFIELD | 84,895 | 0.00 | % | 84,895 | - | 0.00 | % | |||||||||||||
| CHRISTOPHER BREGENHOJ & JULIE BREGENHOJ (43) | 419,774 | 0.02 | % | 115,989 | 303,785 | 0.01 | % | |||||||||||||
| CHRISTOPHER BUNNEY | 601 | 0.00 | % | 601 | - | 0.00 | % | |||||||||||||
| CHRISTOPHER CONSTANTINE ANTHONY & HELEN MICHAEL ANTHONY (44) | 2,310 | 0.00 | % | 2,310 | - | 0.00 | % | |||||||||||||
| CHRISTOPHER GERALD O'DWYER | 1,125 | 0.00 | % | 1,125 | - | 0.00 | % | |||||||||||||
| CHRISTOPHER HORACE ALDRIDGE & GERALDINE ALDRIDGE (45) | 98,096 | 0.00 | % | 98,096 | - | 0.00 | % | |||||||||||||
| CHRISTOPHER JOHN BUNNEY | 635 | 0.00 | % | 635 | - | 0.00 | % | |||||||||||||
| CHRISTOPHER MARY RUYS (46) | 920 | 0.00 | % | 920 | - | 0.00 | % | |||||||||||||
| CHRISTOPHER MARY RUYS & ANNE VERONICA RUYS (47) | 4,215 | 0.00 | % | 4,215 | - | 0.00 | % | |||||||||||||
| CHRISTOPHER R BRISTOW & MARGARET I BRISTOW (48) | 5,055 | 0.00 | % | 5,055 | - | 0.00 | % | |||||||||||||
| CHRISTOPHER RALPH GILMOUR | 345,000 | 0.02 | % | 112,250 | 232,750 | 0.01 | % | |||||||||||||
| CHUTIMA NIRANSITTIRAT (49) | 20,000,000 | 0.93 | % | 1,095,000 | 18,905,000 | 0.88 | % | |||||||||||||
| CINDY LOUISE HUPPATZ | 5,588 | 0.00 | % | 5,588 | - | 0.00 | % | |||||||||||||
| CLAIRE CAMPBELL | 750 | 0.00 | % | 750 | - | 0.00 | % | |||||||||||||
| CLAIRE MARGARET FLETCHER | 1,716 | 0.00 | % | 1,716 | - | 0.00 | % | |||||||||||||
| 31 |
| Name of Beneficial Owner | No. of Shares Owned Prior to Offering | Percent of Shares Beneficially Owned Prior to Offering | No. of Shares Being Offered | No. of Shares Beneficially Owned After Offering | Percent of Shares Beneficially Owned After Offering | |||||||||||||||
| CLAUDE HUMBERTO CONCHA | 19,132 | 0.00 | % | 19,132 | - | 0.00 | % | |||||||||||||
| CLIFFORD WIELAND & JOY WIELAND | 8,350 | 0.00 | % | 8,350 | - | 0.00 | % | |||||||||||||
| CLIFTON KEITH CRANE & GLENNIS ANN CRANE (50) | 1,159,516 | 0.05 | % | 152,976 | 1,006,540 | 0.05 | % | |||||||||||||
| CLIVE BALL | 43 | 0.00 | % | 43 | - | 0.00 | % | |||||||||||||
| CLIVE SEALY | 43 | 0.00 | % | 43 | - | 0.00 | % | |||||||||||||
| COLIN J DAMIANI & DIANE R DAMIANI | 123,328 | 0.01 | % | 101,166 | 22,162 | 0.00 | % | |||||||||||||
| COLIN JOHN DAMIANI | 989 | 0.00 | % | 989 | - | 0.00 | % | |||||||||||||
| COLIN JOHN THOMAS | 750 | 0.00 | % | 750 | - | 0.00 | % | |||||||||||||
| COLIN MANN & SUE MANN | 110 | 0.00 | % | 110 | - | 0.00 | % | |||||||||||||
| COLIN ROBERT FREEMAN | 7,325 | 0.00 | % | 7,325 | - | 0.00 | % | |||||||||||||
| COLLEEN MARY MILLER | 125 | 0.00 | % | 125 | - | 0.00 | % | |||||||||||||
| COLLEEN VLAHOS | 1,962 | 0.00 | % | 1,962 | - | 0.00 | % | |||||||||||||
| CON SFETSOS (51) | 9,052 | 0.00 | % | 9,052 | - | 0.00 | % | |||||||||||||
| CONRAD MARTIN (52) | 6,315,360 | 0.29 | % | 505,768 | 5,809,592 | 0.27 | % | |||||||||||||
| CONSTANCE ELIZABETH LEE-ANDERSON | 100,000 | 0.00 | % | 100,000 | - | 0.00 | % | |||||||||||||
| CORINNE SUETIN | 7,325 | 0.00 | % | 7,325 | - | 0.00 | % | |||||||||||||
| CORINNE SUETIN | 1,741 | 0.00 | % | 1,741 | - | 0.00 | % | |||||||||||||
| CORRIE MAY DE AZEVEDO | 125 | 0.00 | % | 125 | - | 0.00 | % | |||||||||||||
| COSTANZO TACCONE & ANGELA TACCONE | 1,230,924 | 0.06 | % | 156,546 | 1,074,378 | 0.05 | % | |||||||||||||
| CRAIG BUCHANAN BREMNER & MERREN BARBARA BREMNER | 61,881 | 0.00 | % | 61,881 | - | 0.00 | % | |||||||||||||
| CRAIG LEAK | 750 | 0.00 | % | 750 | - | 0.00 | % | |||||||||||||
| CRAIG MICHAEL DELAHUNTY | 1,503 | 0.00 | % | 1,503 | - | 0.00 | % | |||||||||||||
| CRAIG STEWART & TERESA STEWART | 2,055 | 0.00 | % | 2,055 | - | 0.00 | % | |||||||||||||
| CZESLAW MICHAEL KOZICKI & ANGELE DANNTE KOZICKI (53) | 4,109,464 | 0.19 | % | 395,473 | 3,713,991 | 0.1 7 | % | |||||||||||||
| DACE JOHNSON | 259 | 0.00 | % | 259 | - | 0.00 | % | |||||||||||||
| DAMIAN WILLIAM SCHAEFER | 500,000 | 0.02 | % | 120,000 | 380,000 | 0.02 | % | |||||||||||||
| DAMIEN CLARKE (54) | 2,921,271 | 0.14 | % | 336,064 | 2,585,207 | 0.12 | % | |||||||||||||
| DAMIEN MATHIESON | 10,729,726 | 0.50 | % | 631,486 | 10,098,240 | 0.47 | % | |||||||||||||
| DAMIEN PUGH (55) | 481,846 | 0.02 | % | 119,092 | 362,754 | 0.02 | % | |||||||||||||
| DAMON CROSBY RAMSEY | 2,143 | 0.00 | % | 2,143 | - | 0.00 | % | |||||||||||||
| DANH TRAN | 700 | 0.00 | % | 700 | - | 0.00 | % | |||||||||||||
| DANIEL DALZOTTO | 180,905 | 0.01 | % | 104,045 | 76,860 | 0.00 | % | |||||||||||||
| DANIEL ELLIDGE | 625 | 0.00 | % | 625 | - | 0.00 | % | |||||||||||||
| DANIEL EVERINGHAM | 3,092 | 0.00 | % | 3,092 | - | 0.00 | % | |||||||||||||
| DANIEL JOHN HOARE (56) | 12,614,314 | 0.58 | % | 820,716 | 11,793,598 | 0.55 | % | |||||||||||||
| DANIEL LIVINGSTON & MARGARET LIVINGSTON (57) | 6,304,366 | 0.29 | % | 410,218 | 5,894,148 | 0.27 | % | |||||||||||||
| DANIEL RILEY & NATASCHA RILEY (58) | 19,620 | 0.00 | % | 19,620 | - | 0.00 | % | |||||||||||||
| DANIELLE KILGOUR | 1,085 | 0.00 | % | 1,085 | - | 0.00 | % | |||||||||||||
| DANIELLE KILGOUR & TONI KILGOUR & KARLENE KILGOUR | 14,693 | 0.00 | % | 14,693 | - | 0.00 | % | |||||||||||||
| DANIELLE THERESE MCINTYRE | 529 | 0.00 | % | 529 | - | 0.00 | % | |||||||||||||
| DANNY JOHN MARSON | 925 | 0.00 | % | 925 | - | 0.00 | % | |||||||||||||
| DANNY PATRICK HEAL | 500,000 | 0.02 | % | 120,000 | 380,000 | 0.02 | % | |||||||||||||
| DARCY THOMAS BARNES & FLETCHER LLOYD BARNES & RILEY ARNOTT BARNES (59) | 2,350,000 | 0.11 | % | 212,500 | 2,137,500 | 0.10 | % | |||||||||||||
| DARREN EDWARDS | 875 | 0.00 | % | 875 | - | 0.00 | % | |||||||||||||
| DARREN HUTCHINSON (60) | 3,013,115 | 0.14 | % | 340,656 | 2,672,459 | 0.1 2 | % | |||||||||||||
| DARREN JAMES BELTON | 24,524 | 0.00 | % | 24,524 | - | 0.00 | % | |||||||||||||
| DARREN ROBERT PUTLAND | 3,066 | 0.00 | % | 3,066 | - | 0.00 | % | |||||||||||||
| DARREN STEVEN HUTCHINSON (61) | 400,000 | 0.02 | % | 115,000 | 285,000 | 0.01 | % | |||||||||||||
| DARRYL MURRAY LOCK | 1,401,962 | 0.06 | % | 165,098 | 1,236,864 | 0.06 | % | |||||||||||||
| 32 |
| Name of Beneficial Owner | No. of Shares Owned Prior to Offering | Percent of Shares Beneficially Owned Prior to Offering | No. of Shares Being Offered | No. of Shares Beneficially Owned After Offering | Percent of Shares Beneficially Owned After Offering | |||||||||||||||
| DARRYL MURRAY LOCK & BRONWYN KAY LOCK (62) | 4,978,732 | 0.23 | % | 438,937 | 4,539,795 | 0.21 | % | |||||||||||||
| DAVID ALLAN WALLACE | 14,014 | 0.00 | % | 14,014 | - | 0.00 | % | |||||||||||||
| DAVID ANDREW HENSLEY | 11,734 | 0.00 | % | 11,734 | - | 0.00 | % | |||||||||||||
| DAVID ARTHUR HOPE | 86 | 0.00 | % | 86 | - | 0.00 | % | |||||||||||||
| DAVID BAKER (63) | 481 | 0.00 | % | 481 | - | 0.00 | % | |||||||||||||
| DAVID BESSON & LIZ BESSON (64) | 85,849 | 0.00 | % | 85,849 | - | 0.00 | % | |||||||||||||
| DAVID BOOTH & KAY BOOTH | 11,635 | 0.00 | % | 11,635 | - | 0.00 | % | |||||||||||||
| DAVID BRUCE VIDLER & LISA MAREE VIDLER (65) | 611,300 | 0.03 | % | 125,565 | 485,735 | 0.02 | % | |||||||||||||
| DAVID CHARLES WARD & JULIE WARD (66) | 854,944 | 0.04 | % | 137,747 | 717,197 | 0.03 | % | |||||||||||||
| DAVID CROSSLEY | 8,741,748 | 0.41 | % | 532,087 | 8,209,661 | 0.38 | % | |||||||||||||
| DAVID FORCHETTI (67) | 278,480 | 0.01 | % | 108,924 | 169,556 | 0.01 | % | |||||||||||||
| DAVID FRANCIS BESSON (68) | 39,852 | 0.00 | % | 39,852 | - | 0.00 | % | |||||||||||||
| DAVID J PRICE | 13,352 | 0.00 | % | 13,352 | - | 0.00 | % | |||||||||||||
| DAVID J PRICE | 224 | 0.00 | % | 224 | - | 0.00 | % | |||||||||||||
| DAVID JAMES PRICE | 1,566 | 0.00 | % | 1,566 | - | 0.00 | % | |||||||||||||
| DAVID JOHN GRANTHAM | 31,350 | 0.00 | % | 31,350 | - | 0.00 | % | |||||||||||||
| DAVID JOHN GREGG (69) | 1,694,288 | 0.08 | % | 179,714 | 1,514,574 | 0.07 | % | |||||||||||||
| DAVID JOHN KADEN & CYNTHIA JOY KADEN | 823,903 | 0.04 | % | 136,195 | 687,708 | 0.03 | % | |||||||||||||
| DAVID JOHN PLEDGER | 17,431 | 0.00 | % | 17,431 | - | 0.00 | % | |||||||||||||
| DAVID JOHN PURKIS & JENNIFER LORRAINE PURKIS | 86,127 | 0.00 | % | 86,127 | - | 0.00 | % | |||||||||||||
| DAVID JOHN SMITHARD | 78 | 0.00 | % | 78 | - | 0.00 | % | |||||||||||||
| DAVID M PIOTROWSKI & LEXY A PIOTROWSKI | 400,000 | 0.02 | % | 115,000 | 285,000 | 0.01 | % | |||||||||||||
| DAVID MADDEN | 9,810 | 0.00 | % | 9,810 | - | 0.00 | % | |||||||||||||
| DAVID MANN (70) | 168,966 | 0.01 | % | 103,448 | 65,518 | 0.00 | % | |||||||||||||
| DAVID MARCON & RACHELA MARCON | 123,270 | 0.01 | % | 101,164 | 22,107 | 0.00 | % | |||||||||||||
| DAVID MICHAEL BOTHE & BELINDA CAROLINE BOTHE | 16,350 | 0.00 | % | 16,350 | - | 0.00 | % | |||||||||||||
| DAVID NEIL ROWAN & NADA ROWAN (71) | 27,892 | 0.00 | % | 27,892 | - | 0.00 | % | |||||||||||||
| DAVID NITSCHKE (72) | 1,027,892 | 0.05 | % | 157,074 | 870,818 | 0.04 | % | |||||||||||||
| DAVID PRICE | 42 | 0.00 | % | 42 | - | 0.00 | % | |||||||||||||
| DAVID RICHARD KUPFER | 12,500 | 0.00 | % | 12,500 | - | 0.00 | % | |||||||||||||
| DAVID ROBERT FYFFE JENKINSON & CATHERINE FRANCES JENKINSON | 2,667,944 | 0.12 | % | 228,397 | 2,439,547 | 0.11 | % | |||||||||||||
| DAVID SIMS | 375 | 0.00 | % | 375 | - | 0.00 | % | |||||||||||||
| DAVID SKINNER | 4,549 | 0.00 | % | 4,549 | - | 0.00 | % | |||||||||||||
| DAVID STANFORD & VICTORIA STANFORD (73) | 2,134 | 0.00 | % | 2,134 | - | 0.00 | % | |||||||||||||
| DAVID TAYLOR (74) | 986,878 | 0.05 | % | 263,957 | 722,921 | 0.0 3 | % | |||||||||||||
| DAVID TIN-SING LAU | 250 | 0.00 | % | 250 | - | 0.00 | % | |||||||||||||
| DAVID WALLACE | 3,924 | 0.00 | % | 3,924 | - | 0.00 | % | |||||||||||||
| DAVID WARREN & ANN JEFFERY (75) | 2,875 | 0.00 | % | 2,875 | - | 0.00 | % | |||||||||||||
| DAVID WATSON & RUTH WATSON | 684 | 0.00 | % | 684 | - | 0.00 | % | |||||||||||||
| DAVID WILLIAM VAN ROOYEN & TONI VAN ROOYEN (76) | 2,251,081 | 0.10 | % | 302,554 | 1,948,527 | 0.09 | % | |||||||||||||
| DAWN GEORGE | 33,401 | 0.00 | % | 33,401 | - | 0.00 | % | |||||||||||||
| DAWN LIPMAN | 1,695 | 0.00 | % | 1,695 | - | 0.00 | % | |||||||||||||
| DAWN UEBERGANG & LEE UEBERGANG | 86 | 0.00 | % | 86 | - | 0.00 | % | |||||||||||||
| DEAN DAVID MARCON | 477 | 0.00 | % | 477 | - | 0.00 | % | |||||||||||||
| DEAN GILCHRIST | 110 | 0.00 | % | 110 | - | 0.00 | % | |||||||||||||
| DEAN MARCON | 3,489,561 | 0.16 | % | 269,478 | 3,220,083 | 0.15 | % | |||||||||||||
| DEBBIE HANCOCK | 10 | 0.00 | % | 10 | - | 0.00 | % | |||||||||||||
| DEBORAH JAWE MOCK & FRANK JOSEPH MOCK | 700,000 | 0.03 | % | 130,000 | 570,000 | 0.03 | % | |||||||||||||
| DEBRA MANNERING | 1,194 | 0.00 | % | 1,194 | - | 0.00 | % | |||||||||||||
| DEIRK O'CONNOR & JOANNE WILLIAMS (77) | 1,485,834 | 0.07 | % | 169,292 | 1,316,542 | 0.06 | % | |||||||||||||
| 33 |
| Name of Beneficial Owner | No. of Shares Owned Prior to Offering | Percent of Shares Beneficially Owned Prior to Offering | No. of Shares Being Offered | No. of Shares Beneficially Owned After Offering | Percent of Shares Beneficially Owned After Offering | |||||||||||||||
| DELMARIE FLORENCE | 93,924 | 0.00 | % | 93,924 | - | 0.00 | % | |||||||||||||
| DENIS DURAND (78) | 514,812 | 0.02 | % | 121,382 | 393,340 | 0.02 | % | |||||||||||||
| DENISE MARGARET HONEY | 1,243 | 0.00 | % | 1,243 | - | 0.00 | % | |||||||||||||
| DENNIS TREGONNING HARRIS & KATHLEEN LORRAINE HARRIS | 1,267,276 | 0.06 | % | 158,364 | 1,108,912 | 0.05 | % | |||||||||||||
| DEREK HUTCHINSON JOHNSON | 1,919,598 | 0.09 | % | 190,980 | 1,728,618 | 0.08 | % | |||||||||||||
| DEREK HUTCHINSON JOHNSON & DACE JOHNSON (79) | 3,073,846 | 0.14 | % | 248,692 | 2,825,154 | 0.13 | % | |||||||||||||
| DESLEY HAWKINS | 43 | 0.00 | % | 43 | - | 0.00 | % | |||||||||||||
| DESLEY HAWKINS | 793 | 0.00 | % | 793 | - | 0.00 | % | |||||||||||||
| DESMOND CHARLES BUSHELL | 860,822 | 0.04 | % | 138,041 | 722,781 | 0.03 | % | |||||||||||||
| DESMOND RONALD HALL | 43 | 0.00 | % | 43 | - | 0.00 | % | |||||||||||||
| DESMOND RONALD HALL & KAY PATRICIA HALL | 55 | 0.00 | % | 55 | - | 0.00 | % | |||||||||||||
| DIANE CHENSEE | 403,984 | 0.02 | % | 115,199 | 288,785 | 0.01 | % | |||||||||||||
| DIANE KAYE ZIPPEL | 1,543 | 0.00 | % | 1,543 | - | 0.00 | % | |||||||||||||
| DIANE RUTH DAMIANI | 989 | 0.00 | % | 989 | - | 0.00 | % | |||||||||||||
| DIANE TWIGG | 11,429 | 0.00 | % | 11,429 | - | 0.00 | % | |||||||||||||
| DIANNA ZIVANOVIC | 1,349 | 0.00 | % | 1,349 | - | 0.00 | % | |||||||||||||
| DIANNA ZIVANOVIC | 406,357 | 0.02 | % | 115,318 | 291,039 | 0.01 | % | |||||||||||||
| DIANNE STEPHANDELLIS | 4,088 | 0.00 | % | 4,088 | - | 0.00 | % | |||||||||||||
| DICK JOHNSON (80) | 1,525,004 | 0.07 | % | 171,250 | 1,353,754 | 0.06 | % | |||||||||||||
| DICK THEO QUALLY (81) | 7,325 | 0.00 | % | 7,325 | - | 0.00 | % | |||||||||||||
| DIMITRA THANOPOULOS | 29,429 | 0.00 | % | 29,429 | - | 0.00 | % | |||||||||||||
| DIMITRA THANOPOULOS | 73,572 | 0.00 | % | 73,572 | - | 0.00 | % | |||||||||||||
| DIMITRA THANOPOULOS | 15,000 | 0.00 | % | 15,000 | - | 0.00 | % | |||||||||||||
| DIMITRIOS KATSOS | 123 | 0.00 | % | 123 | - | 0.00 | % | |||||||||||||
| DIMITRIOS KATSOS & MARIA MITROPOULOS | 1,595 | 0.00 | % | 1,595 | - | 0.00 | % | |||||||||||||
| DION VLAHOS | 1,962 | 0.00 | % | 1,962 | - | 0.00 | % | |||||||||||||
| DOMENIC CACCAMO | 1,012,916 | 0.05 | % | 145,646 | 867,270 | 0.04 | % | |||||||||||||
| DOMENIC TACCA (82) | 9,602,949 | 0.44 | % | 575,147 | 9,027,802 | 0.42 | % | |||||||||||||
| DOMINIC CHIARAVALLE & EVA CHIARAVALLE (83) | 1,139,375 | 0.05 | % | 151,969 | 987,406 | 0.05 | % | |||||||||||||
| DOMINIC CURCIO | 80,534 | 0.00 | % | 80,534 | - | 0.00 | % | |||||||||||||
| DOMINIC JOHN CURCIO | 245,239 | 0.01 | % | 107,262 | 137,977 | 0.01 | % | |||||||||||||
| DOMINIC JOHN CURCIO | 30,655 | 0.00 | % | 30,655 | - | 0.00 | % | |||||||||||||
| DONALD & SUSAN FAIRBROTHER (84) | 555 | 0.00 | % | 555 | - | 0.00 | % | |||||||||||||
| DONALD ALAN SAYERS | 230,791 | 0.01 | % | 106,540 | 124,251 | 0.01 | % | |||||||||||||
| DONALD ALAN SAYERS & MARILYN ANN SAYERS (85) | 774,287 | 0.04 | % | 133,714 | 640,573 | 0.03 | % | |||||||||||||
| DONALD ARTHUR PETERSON & WENDY ANNE PETERSON (86) | 11,445 | 0.00 | % | 11,445 | - | 0.00 | % | |||||||||||||
| DONALD FAIRBROTHES & SUSAN FAIRBROTHES (87) | 28,349 | 0.00 | % | 28,349 | - | 0.00 | % | |||||||||||||
| DONALD IAN PAYNE | 1,164 | 0.00 | % | 1,164 | - | 0.00 | % | |||||||||||||
| DONALD JAMES GIBSON & DAWN ELIZABETH GIBSON | 1,840 | 0.00 | % | 1,840 | - | 0.00 | % | |||||||||||||
| DONALD SWAIN & JOCELYN SWAIN & DONALD H SWAIN & JOULYS J SWAIN (88) | 613,000 | 0.03 | % | 125,650 | 487,350 | 0.02 | % | |||||||||||||
| DOROTHY JEAN ELLIS & JAMES E ELLIS (89) | 670,506 | 0.03 | % | 150,292 | 520,214 | 0.0 2 | % | |||||||||||||
| DOUGLAS ALLAN KILGOUR (90) | 134,247 | 0.01 | % | 101,712 | 32,535 | 0.00 | % | |||||||||||||
| DOUGLAS R DILLON & STEPHEN R WHAREKAWA | 1,758,022 | 0.08 | % | 182,901 | 1,575,121 | 0.07 | % | |||||||||||||
| DOUGLAS REID & ROSLYN REID | 14,650 | 0.00 | % | 14,650 | - | 0.00 | % | |||||||||||||
| DOUGLAS SMITH CUTHILL | 88 | 0.00 | % | 88 | - | 0.00 | % | |||||||||||||
| DR CAROLYN WILLIAMS | 406,603 | 0.02 | % | 115,330 | 291,273 | 0.01 | % | |||||||||||||
| DR FRANK JORDON | 605,000 | 0.03 | % | 125,250 | 479,750 | 0.02 | % | |||||||||||||
| DR LAKSHMAN PRASAD (91) | 65,056,872 | 3.01 | % | 3,442,844 | 61,614,028 | 2.8 5 | % | |||||||||||||
| DR PHILIP JOSEPH RUARAIGH MCDONALD MOORE | 35 | 0.00 | % | 35 | - | 0.00 | % | |||||||||||||
| DR ROBIN LORRAINE AMERENA | 6,663 | 0.00 | % | 6,663 | - | 0.00 | % | |||||||||||||
| 34 |
| Name of Beneficial Owner | No. of Shares Owned Prior to Offering | Percent of Shares Beneficially Owned Prior to Offering | No. of Shares Being Offered | No. of Shares Beneficially Owned After Offering | Percent of Shares Beneficially Owned After Offering | |||||||||||||||
| DR WILLIAM ALEXANDER MACLAURIN | 2,500 | 0.00 | % | 2,500 | - | 0.00 | % | |||||||||||||
| DUNCAN MELVILLE-SMITH & SHARAN MELVILLE-SMITH (92) | 30,586 | 0.00 | % | 30,586 | - | 0.00 | % | |||||||||||||
| DWAYNE DAVID SPARKES | 2,525 | 0.00 | % | 2,525 | - | 0.00 | % | |||||||||||||
| EDDIE ZODINS & KATIE ZODINS (93) | 911,669 | 0.04 | % | 140,583 | 771,086 | 0.04 | % | |||||||||||||
| EDITH BLEIER | 502 | 0.00 | % | 502 | - | 0.00 | % | |||||||||||||
| EDMOND MONSOUR & MARGARET MONSOUR | 1,653 | 0.00 | % | 1,653 | - | 0.00 | % | |||||||||||||
| EDWARD DAVID GALLOP | 7,325 | 0.00 | % | 7,325 | - | 0.00 | % | |||||||||||||
| EDWARD DAVID GALLOP | 474 | 0.00 | % | 474 | - | 0.00 | % | |||||||||||||
| EDWARD JOHN JEFFERY | 2,375 | 0.00 | % | 2,375 | - | 0.00 | % | |||||||||||||
| EDWARD LLEWELLYN MORGAN & LINDA JOAN MORGAN (94) | 2,564,413 | 0.12 | % | 223,221 | 2,341,192 | 0.11 | % | |||||||||||||
| EDWARD STARKY (95) | 105 | 0.00 | % | 105 | - | 0.00 | % | |||||||||||||
| ELISA CHIANDOTTO | 47,816 | 0.00 | % | 47,816 | - | 0.00 | % | |||||||||||||
| ELIZABETH AGNES CROSS | 14,650 | 0.00 | % | 14,650 | - | 0.00 | % | |||||||||||||
| ELIZABETH AGNES CROSS | 6,298 | 0.00 | % | 6,298 | - | 0.00 | % | |||||||||||||
| ELIZABETH ALISON THUAN | 3,000 | 0.00 | % | 3,000 | - | 0.00 | % | |||||||||||||
| ELIZABETH ALISON THUAN & NGUYEN KHAC THUAN | 7,500 | 0.00 | % | 7,500 | - | 0.00 | % | |||||||||||||
| ELIZABETH ANN HARDCASTLE | 770,803 | 0.04 | % | 133,540 | 637,263 | 0.03 | % | |||||||||||||
| ELIZABETH FLINTOFF | 28,572 | 0.00 | % | 28,572 | - | 0.00 | % | |||||||||||||
| ELIZABETH FLINTOFT | 19,048 | 0.00 | % | 19,048 | - | 0.00 | % | |||||||||||||
| ELIZABETH JOAN GREEN | 24,524 | 0.00 | % | 24,524 | - | 0.00 | % | |||||||||||||
| ELIZABETH RUTH WILLIAMS | 1,027 | 0.00 | % | 1,027 | - | 0.00 | % | |||||||||||||
| ELIZABETH SPENCER | 375 | 0.00 | % | 375 | - | 0.00 | % | |||||||||||||
| EMILIOUS GEORGIOU (96) | 1,010,000 | 0.05 | % | 240,500 | 769,500 | 0.04 | % | |||||||||||||
| ERIC BRIAN KELLY & MAREE GAYLE KELLY | 70,544 | 0.00 | % | 70,544 | - | 0.00 | % | |||||||||||||
| ERIC CHARLES DYER | 5,023,904 | 0.23 | % | 346,195 | 4,677,709 | 0.22 | % | |||||||||||||
| ERIC CHARLES DYER & OLENA DYER & ALWYN REGINALD DYER & KERRYN JEAN DYER (97) | 3,495,403 | 0.16 | % | 269,770 | 3,225,633 | 0.15 | % | |||||||||||||
| ERIC JAMES FREW & HEATHER JOY FREW | 1,410,620 | 0.07 | % | 165,531 | 1,245,089 | 0.06 | % | |||||||||||||
| ERIC JAMES FREW & HEATHER JOY FREW & LISA R FREW | 414,650 | 0.02 | % | 115,733 | 298,918 | 0.01 | % | |||||||||||||
| ERIC LLOYD VAN COOTEN & ENID CLARA VAN COOTEN | 400,092 | 0.02 | % | 115,005 | 285,087 | 0.01 | % | |||||||||||||
| ERNEST PETER OLDFIELD | 30,783 | 0.00 | % | 30,783 | - | 0.00 | % | |||||||||||||
| ERRYN STANSFIELD SMITH | 424 | 0.00 | % | 424 | - | 0.00 | % | |||||||||||||
| EST GEOFFREY DEREK WILSON | 1,437 | 0.00 | % | 1,437 | - | 0.00 | % | |||||||||||||
| ESTHER ANNE HAMELINK | 3,035 | 0.00 | % | 3,035 | - | 0.00 | % | |||||||||||||
| ESTHER LYNDAL BREEN | 33 | 0.00 | % | 33 | - | 0.00 | % | |||||||||||||
| ETHAN VLAHOS | 1,962 | 0.00 | % | 1,962 | - | 0.00 | % | |||||||||||||
| EUGENE KATSOS | 1,017,985 | 0.05 | % | 145,899 | 872,086 | 0.04 | % | |||||||||||||
| EUGENE LOW | 714 | 0.00 | % | 714 | - | 0.00 | % | |||||||||||||
| EVELYN GRIEVE | 400,731 | 0.02 | % | 115,037 | 285,694 | 0.01 | % | |||||||||||||
| FILIP TORTEVSKI | 5,003 | 0.00 | % | 5,003 | - | 0.00 | % | |||||||||||||
| FIONA PROWSE | 1,424,524 | 0.07 | % | 166,226 | 1,258,298 | 0.06 | % | |||||||||||||
| FRANCES CACCAMO | 1,010,627 | 0.05 | % | 145,531 | 865,096 | 0.04 | % | |||||||||||||
| FRANCES LAMBERT | 47,620 | 0.00 | % | 47,620 | - | 0.00 | % | |||||||||||||
| FRANCESCO MANZI | 4,905 | 0.00 | % | 4,905 | - | 0.00 | % | |||||||||||||
| FRANCESCO TACCA (98) | 4,180,960 | 0.19 | % | 304,048 | 3,876,912 | 0.18 | % | |||||||||||||
| FRANCIS JOSEPH TENNI | 1,063 | 0.00 | % | 1,063 | - | 0.00 | % | |||||||||||||
| FRANCIS WILLIAM DAVIS | 49 | 0.00 | % | 49 | - | 0.00 | % | |||||||||||||
| FRANK K SUTTON (99) | 86 | 0.00 | % | 86 | - | 0.00 | % | |||||||||||||
| FRANK L DAVIES | 1,577 | 0.00 | % | 1,577 | - | 0.00 | % | |||||||||||||
| 35 |
| Name of Beneficial Owner | No. of Shares Owned Prior to Offering | Percent of Shares Beneficially Owned Prior to Offering | No. of Shares Being Offered | No. of Shares Beneficially Owned After Offering | Percent of Shares Beneficially Owned After Offering | |||||||||||||||
| FRANK L DAVIES | 879 | 0.00 | % | 879 | - | 0.00 | % | |||||||||||||
| FRANK L DAVIES & MARGARET E DAVIES | 384 | 0.00 | % | 384 | - | 0.00 | % | |||||||||||||
| FRANK L DAVIES & MARGARET E DAVIES | 384 | 0.00 | % | 384 | - | 0.00 | % | |||||||||||||
| FRANK LAWRENCE | 1,000,000 | 0.05 | % | 145,000 | 855,000 | 0.04 | % | |||||||||||||
| FRASER HILL STEVENS & LORNA ROSE STEVENS | 43,949 | 0.00 | % | 43,949 | - | 0.00 | % | |||||||||||||
| FRASER HILL STEVENS & LORNA ROSE STEVENS | 3,025 | 0.00 | % | 3,025 | - | 0.00 | % | |||||||||||||
| FREDERICK JAMES PARK & THELMA LORNA PARK | 107,839 | 0.00 | % | 100,392 | 7,447 | 0.00 | % | |||||||||||||
| GABRIEL JOSEPH LABOUR & MARIE ARIADHNE LABOUR | 69,907 | 0.00 | % | 69,907 | - | 0.00 | % | |||||||||||||
| GARETH DAVID CHALKLEN & ROSEMARY DAWN CHALKLEN | 40 | 0.00 | % | 40 | - | 0.00 | % | |||||||||||||
| GARRY CROSS | 208 | 0.00 | % | 208 | - | 0.00 | % | |||||||||||||
| GARRY DUNSTAN (100) | 224 | 0.00 | % | 224 | - | 0.00 | % | |||||||||||||
| GARRY DUNSTAN & SELINA DUNSTAN (101) | 714 | 0.00 | % | 714 | - | 0.00 | % | |||||||||||||
| GARRY JOHN MCLEOD & ROBYN JOANNE MCLEOD (102) | 14,905 | 0.00 | % | 14,905 | - | 0.00 | % | |||||||||||||
| GARRY PHIPPS | 13,352 | 0.00 | % | 13,352 | - | 0.00 | % | |||||||||||||
| GARTH THOMAS SILVA | 131 | 0.00 | % | 131 | - | 0.00 | % | |||||||||||||
| GARY DAVID DOUGLAS | 1,032,442 | 0.05 | % | 146,622 | 885,820 | 0.04 | % | |||||||||||||
| GARY HOLMES & JULIE HOLMES | 855 | 0.00 | % | 855 | - | 0.00 | % | |||||||||||||
| GARY KENDRICK | 2,190,063 | 0.10 | % | 204,503 | 1,985,560 | 0.09 | % | |||||||||||||
| GARY STONE | 2,080 | 0.00 | % | 2,080 | - | 0.00 | % | |||||||||||||
| GAVIN DENTON (103) | 4,088,640 | 0.19 | % | 299,432 | 3,789,208 | 0.18 | % | |||||||||||||
| GAVIN GLENDINNING BARNES & DIANNE FAYE BARNES | 723 | 0.00 | % | 723 | - | 0.00 | % | |||||||||||||
| GAVIN JAMES BEATTIE | 14,185 | 0.00 | % | 14,185 | - | 0.00 | % | |||||||||||||
| GAVIN JAMES WOODROW | 3,219 | 0.00 | % | 3,219 | - | 0.00 | % | |||||||||||||
| GAVIN RAYMOND WOLSKI & JUNE ELLEN WOLSKI (104) | 5,277 | 0.00 | % | 5,277 | - | 0.00 | % | |||||||||||||
| GAY BURGE | 43 | 0.00 | % | 43 | - | 0.00 | % | |||||||||||||
| GAYLENE ANN DIAMOND | 836 | 0.00 | % | 836 | - | 0.00 | % | |||||||||||||
| GENEVIEVE SIMKISS | 434 | 0.00 | % | 434 | - | 0.00 | % | |||||||||||||
| GEOFF HOLMES | 14,286 | 0.00 | % | 14,286 | - | 0.00 | % | |||||||||||||
| GEOFF SPENCER | 423 | 0.00 | % | 423 | - | 0.00 | % | |||||||||||||
| GEOFF WHITTOME & LEONIE WHITTOME (105) | 1,332,985 | 0.06 | % | 161,649 | 1,171,336 | 0.05 | % | |||||||||||||
| GEOFFREY CHARLES ROSEVEAR | 798 | 0.00 | % | 798 | - | 0.00 | % | |||||||||||||
| GEOFFREY FRANCIS FONTAINE (106) | 6,189,544 | 0.29 | % | 499,477 | 5,690,067 | 0.2 6 | % | |||||||||||||
| GEOFFREY L HARDIE & SUSAN L HARDIE | 21,429 | 0.00 | % | 21,429 | - | 0.00 | % | |||||||||||||
| GEOFFREY LEWIS GODLEY & CAROLYN JOAN GODLEY (107) | 6,505,223 | 0.30 | % | 610,261 | 5,894,962 | 0.2 7 | % | |||||||||||||
| GEOFFREY LEWIS GODLEY & SEAN OTTO MANTA RASMUSSEN (108) | 1,588 | 0.00 | % | 1,588 | - | 0.00 | % | |||||||||||||
| GEOFFREY MALCOLM TAYLOR (109) | 1,888,306 | 0.09 | % | 189,415 | 1,698,891 | 0.08 | % | |||||||||||||
| GEOFFREY MALCOLM TAYLOR & SUZANNE JENNIFER TAYLOR & MILTON DOUGLAS TAYLOR (110) | 401,653 | 0.02 | % | 115,083 | 286,570 | 0.01 | % | |||||||||||||
| GEOFFREY ROBERT MILLS | 1,005,600 | 0.05 | % | 145,280 | 860,320 | 0.04 | % | |||||||||||||
| GEOFFREY RONALD SULLIVAN & PAMELA M SULLIVAN (111) | 2,124,908 | 0.10 | % | 296,245 | 1,828,663 | 0.0 8 | % | |||||||||||||
| GEOFFREY WALLIS ARUNDELL | 157,325 | 0.01 | % | 102,866 | 54,459 | 0.00 | % | |||||||||||||
| GEOFFREY WALLIS ARUNDELL | 79,716 | 0.00 | % | 79,716 | - | 0.00 | % | |||||||||||||
| GEOFFREY WALTON & LEE WALTON | 313 | 0.00 | % | 313 | - | 0.00 | % | |||||||||||||
| GEORGE ANDREW DEAN & LYNETTE FAITH DEAN | 324 | 0.00 | % | 324 | - | 0.00 | % | |||||||||||||
| GEORGE COSTOPOULOS | 8,893 | 0.00 | % | 8,893 | - | 0.00 | % | |||||||||||||
| GEORGE EDGAR BLAIR-WEST & MARJORIE RAY BLAIR-WEST (112) | 203,983 | 0.01 | % | 105,199 | 98,784 | 0.00 | % | |||||||||||||
| GEORGE EDGAR BLAIR-WEST & PENELOPE NERIDA BLAIR-WEST (113) | 1,420,821 | 0.07 | % | 166,041 | 1,254,780 | 0.06 | % | |||||||||||||
| GEORGE KARANTZIAS | 250 | 0.00 | % | 250 | - | 0.00 | % | |||||||||||||
| GEORGE LESLIE BLISS (114) | 9,690,540 | 0.45 | % | 769,527 | 8,921,013 | 0.4 1 | % | |||||||||||||
| GEORGE VASILIOS COMINO | 75 | 0.00 | % | 75 | - | 0.00 | % | |||||||||||||
| GEORGE VLAHOS | 70,254 | 0.00 | % | 70,254 | - | 0.00 | % | |||||||||||||
| GEORGE VLAHOS & COLLEEN VLAHOS (115) | 272,215 | 0.01 | % | 108,611 | 163,604 | 0.01 | % | |||||||||||||
| 36 |
| Name of Beneficial Owner | No. of Shares Owned Prior to Offering | Percent of Shares Beneficially Owned Prior to Offering | No. of Shares Being Offered | No. of Shares Beneficially Owned After Offering | Percent of Shares Beneficially Owned After Offering | |||||||||||||||
| GEORGE WILLIAM BLAIR-WEST (116) | 1,515,202 | 0.07 | % | 170,760 | 1,344,442 | 0.06 | % | |||||||||||||
| GERARD PATRICK CONSEDINE (117) | 26,250 | 0.00 | % | 26,250 | - | 0.00 | % | |||||||||||||
| GERARD DONALD LAFONTAINE | 14,715 | 0.00 | % | 14,715 | - | 0.00 | % | |||||||||||||
| GERARD LAVERY | 3 | 0.00 | % | 3 | - | 0.00 | % | |||||||||||||
| GERHARDUS JOHANNES NEL & HILLARY NEL (118) | 1,137,332 | 0.05 | % | 151,867 | 985,465 | 0.05 | % | |||||||||||||
| GERRIT HORCHNER | 326,272 | 0.02 | % | 111,314 | 214,958 | 0.01 | % | |||||||||||||
| GIANNI MASON | 490,125 | 0.02 | % | 119,506 | 370,619 | 0.02 | % | |||||||||||||
| GIANNI MASON & MARISSA MASON (119) | 12,202,267 | 0.57 | % | 800,113 | 11,402,154 | 0.53 | % | |||||||||||||
| GILLIAN MARY ALDRIDGE & ROBYN WILLIAM ALDRIDGE & CAROL MARGARET NOBLE & ANDREW SCOTT NOBLE (120) | 1,085 | 0.00 | % | 1,085 | - | 0.00 | % | |||||||||||||
| GINA LICATA & RENATO LICATA | 2,044 | 0.00 | % | 2,044 | - | 0.00 | % | |||||||||||||
| GINA STAMATELOPOULOS (121) | 4,079 | 0.00 | % | 4,079 | - | 0.00 | % | |||||||||||||
| GIULIANA DALL-ALBA | 1,892 | 0.00 | % | 1,892 | - | 0.00 | % | |||||||||||||
| GIULIO MINUZZO | 304 | 0.00 | % | 304 | - | 0.00 | % | |||||||||||||
| GIUSEPPE GIUSTI & MARIA GIUSTI (122) | 119,985 | 0.01 | % | 100,999 | 18,986 | 0.00 | % | |||||||||||||
| GIUSEPPE LAGANA & VINCENZA LAGANA (123) | 2,381 | 0.00 | % | 2,381 | - | 0.00 | % | |||||||||||||
| GLEN CHARLES HAWKINS & JANICE LORELLE HAWKINS (124) | 3,807 | 0.00 | % | 3,807 | - | 0.00 | % | |||||||||||||
| GLENN RAYMOND JOYCE & JUDITH THERESE JOYCE (125) | 2,257,736 | 0.10 | % | 302,887 | 1,954,849 | 0.09 | % | |||||||||||||
| GLENN ROBERT & JOANNA LUETCHFORD PRENDERGAST | 400,000 | 0.02 | % | 115,000 | 285,000 | 0.01 | % | |||||||||||||
| GLORIA HARTNEY & GRAHAM WORN (126) | 452,114 | 0.02 | % | 117,606 | 334,508 | 0.02 | % | |||||||||||||
| GLORIA KIRI WHITE | 37 | 0.00 | % | 37 | - | 0.00 | % | |||||||||||||
| GLORIA MARGARET HARTNEY | 418,291 | 0.02 | % | 115,915 | 302,376 | 0.01 | % | |||||||||||||
| GORDON HERIOT (127) | 3,672,540 | 0.17 | % | 468,627 | 3,203,913 | 0.1 5 | % | |||||||||||||
| GORDON J. MASLIN & CRISTINA MASLIN (128) | 1,015,001 | 0.05 | % | 145,750 | 869,251 | 0.04 | % | |||||||||||||
| GRAEME GEORGE LARFIELD | 1,543 | 0.00 | % | 1,543 | - | 0.00 | % | |||||||||||||
| GRAEME LEIGH SMITH (129) | 704,603 | 0.03 | % | 166,000 | 538,603 | 0.0 2 | % | |||||||||||||
| GRAHAM ASHLEY HARRIS & MARGARET MARY WILMINK | 211,566 | 0.01 | % | 105,578 | 105,988 | 0.00 | % | |||||||||||||
| GRAHAM EUGENE CROMB | 588 | 0.00 | % | 588 | - | 0.00 | % | |||||||||||||
| GRAHAM JOHN MILLS | 1,407,908 | 0.07 | % | 165,395 | 1,242,513 | 0.06 | % | |||||||||||||
| GRAHAM LEAKE | 750 | 0.00 | % | 750 | - | 0.00 | % | |||||||||||||
| GRAHAM RICHARD BENTLEY WILLIAMS | 764 | 0.00 | % | 764 | - | 0.00 | % | |||||||||||||
| GRAHAM ROWE & SO SHAN ROWE (130) | 129 | 0.00 | % | 129 | - | 0.00 | % | |||||||||||||
| GRAHAM WARDEN & MARION WARDEN (131) | 408,790 | 0.02 | % | 115,440 | 293,351 | 0.01 | % | |||||||||||||
| GRAHAM WORN & GLORIA HARTNEY (132) | 740,707 | 0.03 | % | 132,035 | 608,672 | 0.03 | % | |||||||||||||
| GRAND ALAN TURNER & ANDREA KIRSTAN TURNER (133) | 43 | 0.00 | % | 43 | - | 0.00 | % | |||||||||||||
| GRANT ALAN TURNER (134) | 35,035 | 0.00 | % | 35,035 | - | 0.00 | % | |||||||||||||
| GRANT DENNIS (135) | 2,000,000 | 0.09 | % | 195,000 | 1,805,000 | 0.08 | % | |||||||||||||
| GRANT JOSEPH TENNI (136) | 1,999,687 | 0.09 | % | 289,984 | 1,709,703 | 0.08 | % | |||||||||||||
| GRANT ROSS MUNDAY | 2,500 | 0.00 | % | 2,500 | - | 0.00 | % | |||||||||||||
| GRANT RUSSELL WOODROW | 953 | 0.00 | % | 953 | - | 0.00 | % | |||||||||||||
| GRANT WOODROW | 9,524 | 0.00 | % | 9,524 | - | 0.00 | % | |||||||||||||
| GREG GIARRATANA & BRIGIDA GIARRATANA (137) | 30,655 | 0.00 | % | 30,655 | - | 0.00 | % | |||||||||||||
| GREG MCADAM (138) | 4,448 | 0.00 | % | 4,448 | - | 0.00 | % | |||||||||||||
| GREG MCADAM & JENNIFER MCADAM (139) | 50,032,909 | 2.32 | % | 2,786,645 | 47,246,264 | 2.19 | % | |||||||||||||
| GREG PROSSER | 719 | 0.00 | % | 719 | - | 0.00 | % | |||||||||||||
| GREG WATSON (140) | 3,844,709 | 0.18 | % | 287,235 | 3,557,474 | 0.16 | % | |||||||||||||
| GREGORY GLYNDWR & MONIQUE GLYNDWR | 22,500 | 0.00 | % | 22,500 | - | 0.00 | % | |||||||||||||
| GREGORY HULBERT | 766,333 | 0.04 | % | 133,317 | 633,016 | 0.03 | % | |||||||||||||
| GREGORY JOHN LOCK | 418,393 | 0.02 | % | 115,920 | 302,473 | 0.01 | % | |||||||||||||
| GREGORY JOHN LOCK | 655,535 | 0.03 | % | 127,777 | 527,758 | 0.02 | % | |||||||||||||
| GREGORY JOHN RODERICK & JENNIFER ROBYN RODERICK (141) | 73,572 | 0.00 | % | 73,572 | - | 0.00 | % | |||||||||||||
| 37 |
| Name of Beneficial Owner | No. of Shares Owned Prior to Offering | Percent of Shares Beneficially Owned Prior to Offering | No. of Shares Being Offered | No. of Shares Beneficially Owned After Offering | Percent of Shares Beneficially Owned After Offering | |||||||||||||||
| GREGORY PAUL BUSS | 500 | 0.00 | % | 500 | - | 0.00 | % | |||||||||||||
| GREGORY VINCENT HARVEY | 435,035 | 0.02 | % | 116,752 | 318,283 | 0.01 | % | |||||||||||||
| GWYN CHAPLAIN | 17,964 | 0.00 | % | 17,964 | - | 0.00 | % | |||||||||||||
| HANNA NAJIB SOUSOU | 18,750 | 0.00 | % | 18,750 | - | 0.00 | % | |||||||||||||
| HARROLD ROTH MARTIN & KRISTENE BETTY MARTIN (142) | 55 | 0.00 | % | 55 | - | 0.00 | % | |||||||||||||
| HARRY FRANS MECHIELSEN & RIA MECHIELSEN (143) | 20,437 | 0.00 | % | 20,437 | - | 0.00 | % | |||||||||||||
| HAYDEN TRIM & KRISTEN TRIM (144) | 2,247,432 | 0.10 | % | 207,372 | 2,040,060 | 0.09 | % | |||||||||||||
| HEATHER DAWN BURNS | 13,185 | 0.00 | % | 13,185 | - | 0.00 | % | |||||||||||||
| HEATHER DAWN BURNS | 741 | 0.00 | % | 741 | - | 0.00 | % | |||||||||||||
| HEATHER HANCOCK | 54 | 0.00 | % | 54 | - | 0.00 | % | |||||||||||||
| HEATHER J FREW & LISA R TURNER | 400,043 | 0.02 | % | 115,002 | 285,041 | 0.01 | % | |||||||||||||
| HELEN D ANTHONY | 83 | 0.00 | % | 83 | - | 0.00 | % | |||||||||||||
| HELEN D ANTHONY | 3,890 | 0.00 | % | 3,890 | - | 0.00 | % | |||||||||||||
| HELEN WALSTAB | 8,025 | 0.00 | % | 8,025 | - | 0.00 | % | |||||||||||||
| HOAN LONG DU | 413 | 0.00 | % | 413 | - | 0.00 | % | |||||||||||||
| HOWARD JOHN GATELEY | 205 | 0.00 | % | 205 | - | 0.00 | % | |||||||||||||
| HOWARD ROSS (145) | 47,034 | 0.00 | % | 47,034 | - | 0.00 | % | |||||||||||||
| HOWARD ROSS & MARTHA ROSS (146) | 204 | 0.00 | % | 204 | - | 0.00 | % | |||||||||||||
| IAN BERNARD OLDFIELD | 33,726 | 0.00 | % | 33,726 | - | 0.00 | % | |||||||||||||
| IAN CROCKS & KARIN CROCKS (147) | 3,259,082 | 0.15 | % | 257,954 | 3,001,128 | 0.14 | % | |||||||||||||
| IAN DOYLE | 43 | 0.00 | % | 43 | - | 0.00 | % | |||||||||||||
| IAN FOSTER & DENISE FOSTER (148) | 1,825,838 | 0.08 | % | 186,292 | 1,639,546 | 0.08 | % | |||||||||||||
| IAN GRAEME PATTERSON (149) | 2,846,912 | 0.13 | % | 332,346 | 2,514,566 | 0.12 | % | |||||||||||||
| IAN HAROLD BANKS & SANDRA ELIZABETH BANKS (150) | 3,384,596 | 0.16 | % | 264,230 | 3,120,366 | 0.14 | % | |||||||||||||
| IAN HOMER & JANINE HOMER | 793 | 0.00 | % | 793 | - | 0.00 | % | |||||||||||||
| IAN LEACH | 499,164 | 0.02 | % | 119,958 | 379,206 | 0.02 | % | |||||||||||||
| IAN MATHIESON | 18,896,428 | 0.88 | % | 1,039,821 | 17,856,607 | 0.83 | % | |||||||||||||
| IAN MATHIESON & ANNA MATHIESON | 1,103,572 | 0.05 | % | 150,179 | 953,393 | 0.04 | % | |||||||||||||
| IAN MURRAY HARDCASTLE & ELIZABETH ANN HARDCASTLE (151) | 1,095,644 | 0.05 | % | 149,782 | 945,862 | 0.04 | % | |||||||||||||
| IAN SYNMAN (152) | 150,000 | 0.01 | % | 102,500 | 47,500 | 0.00 | % | |||||||||||||
| IAN VAN DER WERFF | 2,126 | 0.00 | % | 2,126 | - | 0.00 | % | |||||||||||||
| IAN VAN DER WERFF & LINDA LAYTON VAN DER WERFF (153) | 953,014 | 0.04 | % | 237,651 | 715,363 | 0.0 3 | % | |||||||||||||
| IAN WILLIAM FOSTER & DENISE MONICA FOSTER (154) | 45,426 | 0.00 | % | 45,426 | - | 0.00 | % | |||||||||||||
| IRENE O'SULLIVAN & HELEN O'SULLIVAN (155) | 775 | 0.00 | % | 775 | - | 0.00 | % | |||||||||||||
| IRENE PATRICIA KIMBER | 7,325 | 0.00 | % | 7,325 | - | 0.00 | % | |||||||||||||
| IRENE PATRICIA KIMBER | 5,715 | 0.00 | % | 5,715 | - | 0.00 | % | |||||||||||||
| IRMGARD JAUK | 100 | 0.00 | % | 100 | - | 0.00 | % | |||||||||||||
| JACKSON BLAIR-WEST | 200,000 | 0.01 | % | 105,000 | 95,000 | 0.00 | % | |||||||||||||
| JACQUELINE NICOLLS | 37 | 0.00 | % | 37 | - | 0.00 | % | |||||||||||||
| JACQUELINE RUTH WILLIAMS | 1,027 | 0.00 | % | 1,027 | - | 0.00 | % | |||||||||||||
| JAKE EMMERSON | 404,904 | 0.02 | % | 115,245 | 289,659 | 0.01 | % | |||||||||||||
| JAMES ALEXANDER GRANT (156) | 400,200 | 0.02 | % | 115,010 | 285,190 | 0.01 | % | |||||||||||||
| JAMES ALLAN GORDON | 455 | 0.00 | % | 455 | - | 0.00 | % | |||||||||||||
| JAMES GARRY MILLS & JEANETTE PATRICIA MILLS | 374,524 | 0.02 | % | 113,726 | 260,798 | 0.01 | % | |||||||||||||
| JAMES GERALD DIGBY | 1,000,000 | 0.05 | % | 145,000 | 855,000 | 0.04 | % | |||||||||||||
| JAMES LAWRENSON & ROSEMARIE LAWRENSON (157) | 12,398,645 | 0.57 | % | 715,954 | 11,682,691 | 0.54 | % | |||||||||||||
| JAMES MATTHEW CREAGH & CHRISTINE MARY CREAGH (158) | 6,127,004 | 0.28 | % | 495,350 | 5,631,654 | 0.2 6 | % | |||||||||||||
| 38 |
| Name of Beneficial Owner | No. of Shares Owned Prior to Offering | Percent of Shares Beneficially Owned Prior to Offering | No. of Shares Being Offered | No. of Shares Beneficially Owned After Offering | Percent of Shares Beneficially Owned After Offering | |||||||||||||||
| JAMES WARREN ALCORN | 54 | 0.00 | % | 54 | - | 0.00 | % | |||||||||||||
| JAMES WILLIAM SMITH (159) | 10,000 | 0.00 | % | 10,000 | - | 0.00 | % | |||||||||||||
| JAMIE MCLAUGHLIN | 1,250 | 0.00 | % | 1,250 | - | 0.00 | % | |||||||||||||
| JAN FREDRIKSSON | 1,440,000 | 0.07 | % | 167,000 | 1,273,000 | 0.06 | % | |||||||||||||
| JAN GREENE & CARDYN WADDINGTON & MEREDITH HOGENKEMP (160) | 123,132 | 0.01 | % | 101,157 | 21,975 | 0.00 | % | |||||||||||||
| JAN LOUISE GREENE | 123,132 | 0.01 | % | 101,157 | 21,975 | 0.00 | % | |||||||||||||
| JANE MARGOT MARTIN | 6,366,666 | 0.30 | % | 413,333 | 5,953,333 | 0.28 | % | |||||||||||||
| JANETTE ELIZABETH MOORE | 2,036,124 | 0.09 | % | 196,806 | 1,839,318 | 0.09 | % | |||||||||||||
| JANICE LYNETTE EATELL | 793 | 0.00 | % | 793 | - | 0.00 | % | |||||||||||||
| JANICE MARGARET OLDFIELD | 1,788 | 0.00 | % | 1,788 | - | 0.00 | % | |||||||||||||
| JANICE MARY MYERSCOUGH | 498,096 | 0.02 | % | 119,905 | 378,191 | 0.02 | % | |||||||||||||
| JANINA RATKEVICIUS | 4,750 | 0.00 | % | 4,750 | - | 0.00 | % | |||||||||||||
| JANINE LAHEY | 5,860 | 0.00 | % | 5,860 | - | 0.00 | % | |||||||||||||
| JANINE LAKEY | 43 | 0.00 | % | 43 | - | 0.00 | % | |||||||||||||
| JANIS ROWELL | 61,566 | 0.00 | % | 61,566 | - | 0.00 | % | |||||||||||||
| JANIS ROWELL | 1,137 | 0.00 | % | 1,137 | - | 0.00 | % | |||||||||||||
| JARROD SHANE SMITH | 250 | 0.00 | % | 250 | - | 0.00 | % | |||||||||||||
| JASON HAWORTH | 31,000 | 0.00 | % | 31,000 | - | 0.00 | % | |||||||||||||
| JASON LEE PATTERSON | 5,450 | 0.00 | % | 5,450 | - | 0.00 | % | |||||||||||||
| JASON RYAN | 1,432,135 | 0.07 | % | 166,607 | 1,265,528 | 0.06 | % | |||||||||||||
| JASON SOURASIS | 5,550 | 0.00 | % | 5,550 | - | 0.00 | % | |||||||||||||
| JEFFERIS HODSOLL HEATH | 6,866 | 0.00 | % | 6,866 | - | 0.00 | % | |||||||||||||
| JEFFERIS HODSOLL HEATH & ANGELINA ROSALINE HEATH | 14,650 | 0.00 | % | 14,650 | - | 0.00 | % | |||||||||||||
| JEFFERIS HODSOLL HEATH & ANGELINA ROSALINE HEATH | 7,051 | 0.00 | % | 7,051 | - | 0.00 | % | |||||||||||||
| JEFFREY MAXWELL STANDER | 750,000 | 0.03 | % | 132,500 | 617,500 | 0.03 | % | |||||||||||||
| JENNA BARBARA FORD & WILHELMINA FORD (161) | 86 | 0.00 | % | 86 | - | 0.00 | % | |||||||||||||
| JENNA FORD (162) | 3,219 | 0.00 | % | 3,219 | - | 0.00 | % | |||||||||||||
| JENNIFER MAREE BALL | 3,000,000 | 0.14 | % | 245,000 | 2,755,000 | 0.13 | % | |||||||||||||
| JENNIFER MARGARET ROSEVEAR | 7,325 | 0.00 | % | 7,325 | - | 0.00 | % | |||||||||||||
| JENNIFER MARGARET ROSEVEAR | 1,979 | 0.00 | % | 1,979 | - | 0.00 | % | |||||||||||||
| JENNIFER MARGARET ROSEVEAR & GEOFFREY CHARLES ROSEVEAR | 734 | 0.00 | % | 734 | - | 0.00 | % | |||||||||||||
| JENNIFER ROBYN RODERICK | 668 | 0.00 | % | 668 | - | 0.00 | % | |||||||||||||
| JENNIFER SHEHADEH | 406,581 | 0.02 | % | 115,329 | 291,252 | 0.01 | % | |||||||||||||
| JIE MING WOO | 2,453 | 0.00 | % | 2,453 | - | 0.00 | % | |||||||||||||
| JILL DIANA LOVETT & CRAIG DAVID LOVETT & EWAN JAMES LOVETT (163) | 8,398,675 | 0.39 | % | 514,934 | 7,883,741 | 0.37 | % | |||||||||||||
| JILL MURPHY | 277,500 | 0.01 | % | 108,875 | 168,625 | 0.01 | % | |||||||||||||
| JIM COMINO & KAY MAREE COMINO | 1,568,460 | 0.07 | % | 173,423 | 1,395,037 | 0.06 | % | |||||||||||||
| JOAN MARION BRADBURY | 125 | 0.00 | % | 125 | - | 0.00 | % | |||||||||||||
| JOANNA HOWE | 1,036,786 | 0.05 | % | 146,839 | 889,947 | 0.04 | % | |||||||||||||
| JOANNA HOWE & HAILEY HOWE & RIANNA PAGANO | 1,029,779 | 0.05 | % | 146,489 | 883,290 | 0.04 | % | |||||||||||||
| JOANNE CONSTANCE WIENERT | 75 | 0.00 | % | 75 | - | 0.00 | % | |||||||||||||
| JOANNE NICOLE HANSEN | 694,288 | 0.03 | % | 129,714 | 564,574 | 0.03 | % | |||||||||||||
| JOANNE OLIVER & KIRK OLIVER | 4,905 | 0.00 | % | 4,905 | - | 0.00 | % | |||||||||||||
| JODIE ANNE GROCOCK | 1,063 | 0.00 | % | 1,063 | - | 0.00 | % | |||||||||||||
| JODIE LEWIS | 43 | 0.00 | % | 43 | - | 0.00 | % | |||||||||||||
| JODIE MARGARET TALONE | 15,000 | 0.00 | % | 15,000 | - | 0.00 | % | |||||||||||||
| JODIE PENFOLD | 661 | 0.00 | % | 661 | - | 0.00 | % | |||||||||||||
| JOE ARDITA & TINA ARDITA | 599,916 | 0.03 | % | 124,996 | 474,920 | 0.02 | % | |||||||||||||
| JOHN BARR & RONICE BARR | 3,504 | 0.00 | % | 3,504 | - | 0.00 | % | |||||||||||||
| JOHN BEVAN MUTCH | 45,525 | 0.00 | % | 45,525 | - | 0.00 | % | |||||||||||||
| 39 |
| Name of Beneficial Owner | No. of Shares Owned Prior to Offering | Percent of Shares Beneficially Owned Prior to Offering | No. of Shares Being Offered | No. of Shares Beneficially Owned After Offering | Percent of Shares Beneficially Owned After Offering | |||||||||||||||
| JOHN BRUMTIS | 37,500 | 0.00 | % | 37,500 | - | 0.00 | % | |||||||||||||
| JOHN BRUMTIS | 15,000 | 0.00 | % | 15,000 | - | 0.00 | % | |||||||||||||
| JOHN CAMPBELL (164) | 984,998 | 0.05 | % | 144,250 | 840,748 | 0.04 | % | |||||||||||||
| JOHN CAMPBELL & WENDY CAMPBELL | 32,781 | 0.00 | % | 32,781 | - | 0.00 | % | |||||||||||||
| JOHN CASTLEDINE & DOROTHY CASTLEDINE | 70,240 | 0.00 | % | 70,240 | - | 0.00 | % | |||||||||||||
| JOHN CHARLES AGIUS | 686 | 0.00 | % | 686 | - | 0.00 | % | |||||||||||||
| JOHN CHRISTOPHER THWAITES (165) | 1,473,800 | 0.07 | % | 168,690 | 1,305,110 | 0.06 | % | |||||||||||||
| JOHN E SYMONS | 42 | 0.00 | % | 42 | - | 0.00 | % | |||||||||||||
| JOHN EDWARD HARTNEY & ALDONA OLGA HARTNEY | 402,752 | 0.02 | % | 115,138 | 287,614 | 0.01 | % | |||||||||||||
| JOHN EDWARD LA FRENTZ | 1,610 | 0.00 | % | 1,610 | - | 0.00 | % | |||||||||||||
| JOHN ELLIS | 43 | 0.00 | % | 43 | - | 0.00 | % | |||||||||||||
| JOHN FEDERICO | 403,697 | 0.02 | % | 115,185 | 288,512 | 0.01 | % | |||||||||||||
| JOHN FLYNN & MICHELLE CURRAN | 403,000 | 0.02 | % | 115,150 | 287,850 | 0.01 | % | |||||||||||||
| JOHN FRANCIS KELLY (166) | 7,325 | 0.00 | % | 7,325 | - | 0.00 | % | |||||||||||||
| JOHN FRANCIS KELLY & DOMINIQUE JOAN KELLY (167) | 54 | 0.00 | % | 54 | - | 0.00 | % | |||||||||||||
| JOHN GEOFFREY ADNAMS & ELIZABETH ANN ADNAMS | 1,373,333 | 0.06 | % | 163,667 | 1,209,666 | 0.06 | % | |||||||||||||
| JOHN GIORDMAINA | 4,622 | 0.00 | % | 4,622 | - | 0.00 | % | |||||||||||||
| JOHN H LLOYD & SUSAN A LLOYD | 43 | 0.00 | % | 43 | - | 0.00 | % | |||||||||||||
| JOHN HON MIN CHAU | 13,083 | 0.00 | % | 13,083 | - | 0.00 | % | |||||||||||||
| JOHN JAMES CAMPBELL & WENDY BEATRIX CAMPBELL | 116 | 0.00 | % | 116 | - | 0.00 | % | |||||||||||||
| JOHN JOSEPH GORTON & NOEL GAIL GORTON | 1,774,464 | 0.08 | % | 183,723 | 1,590,741 | 0.07 | % | |||||||||||||
| JOHN KINGSLEY RAUTENBACH & SHARON RAUTENBACH (168) | 548,500 | 0.03 | % | 122,425 | 426,075 | 0.02 | % | |||||||||||||
| JOHN MACRI | 265,410 | 0.01 | % | 108,271 | 157,140 | 0.01 | % | |||||||||||||
| JOHN MACRI & MARIA MACRI | 1,557,143 | 0.07 | % | 172,857 | 1,384,286 | 0.06 | % | |||||||||||||
| JOHN MACRI & NICHOLAS MACRI | 61,566 | 0.00 | % | 61,566 | - | 0.00 | % | |||||||||||||
| JOHN MARY CAUCHI | 3,132 | 0.00 | % | 3,132 | - | 0.00 | % | |||||||||||||
| JOHN MCELLIGOTT | 14,715 | 0.00 | % | 14,715 | - | 0.00 | % | |||||||||||||
| JOHN MCELLIGOTT & RENAE MCELLIGOTT (169) | 29,429 | 0.00 | % | 29,429 | - | 0.00 | % | |||||||||||||
| JOHN MICHAEL HEARMAN | 155,450 | 0.01 | % | 102,773 | 52,678 | 0.00 | % | |||||||||||||
| JOHN MOFFATT | 15,186 | 0.00 | % | 15,186 | - | 0.00 | % | |||||||||||||
| JOHN NEGHERBON & CARMEL NEGHERBON (170) | 14,553 | 0.00 | % | 14,553 | - | 0.00 | % | |||||||||||||
| JOHN NEGHERBON & CARMEL NEGHERBON | 957 | 0.00 | % | 957 | - | 0.00 | % | |||||||||||||
| JOHN O'DONOHUE & CAROLYN O'DONOHUE | 6,418 | 0.00 | % | 6,418 | - | 0.00 | % | |||||||||||||
| JOHN ORLANDO (171) | 1,375 | 0.00 | % | 1,375 | - | 0.00 | % | |||||||||||||
| JOHN OWEN PUGSLEY & SUSAN ELIZABETH PUGSLEY (172) | 661,592 | 0.03 | % | 128,080 | 533,512 | 0.02 | % | |||||||||||||
| JOHN PANKHURST | 244,647 | 0.01 | % | 107,232 | 137,415 | 0.01 | % | |||||||||||||
| JOHN ROAYLL | 400,000 | 0.02 | % | 115,000 | 285,000 | 0.01 | % | |||||||||||||
| JOHN ROGER WILSON | 54 | 0.00 | % | 54 | - | 0.00 | % | |||||||||||||
| JOHN ROSSY KNOX & DOROTHY MAY KNOX | 41 | 0.00 | % | 41 | - | 0.00 | % | |||||||||||||
| JOHN ROYALL (173) | 468,974 | 0.02 | % | 118,449 | 350,525 | 0.02 | % | |||||||||||||
| JOHN ROYALL | 30,164 | 0.00 | % | 30,164 | - | 0.00 | % | |||||||||||||
| JOHN SAULO & RUTH VIRGINIA SAULO | 88 | 0.00 | % | 88 | - | 0.00 | % | |||||||||||||
| JOHN STEPHEN FRY | 87,150 | 0.00 | % | 87,150 | - | 0.00 | % | |||||||||||||
| JOHN STEPHEN FRY & LYNETTE ROBYN FRY (174) | 26,083 | 0.00 | % | 26,083 | - | 0.00 | % | |||||||||||||
| JOHN STUART ELLIS | 1,969 | 0.00 | % | 1,969 | - | 0.00 | % | |||||||||||||
| JOHN THOMPSON | 13,185 | 0.00 | % | 13,185 | - | 0.00 | % | |||||||||||||
| JOHN THOMPSON | 7,650 | 0.00 | % | 7,650 | - | 0.00 | % | |||||||||||||
| JOHN THOMPSON & ROSEMARY ELIZABETH | 7,603 | 0.00 | % | 7,603 | - | 0.00 | % | |||||||||||||
| JOHN TOIGO & FIONA TOIGO (175) | 401,962 | 0.02 | % | 115,098 | 286,864 | 0.01 | % | |||||||||||||
| JOHN TURNBULL & SOMPONG TURNBULL (176) | 3,949,944 | 0.18 | % | 442,437 | 3,507,507 | 0.1 6 | % | |||||||||||||
| 40 |
| Name of Beneficial Owner | No. of Shares Owned Prior to Offering | Percent of Shares Beneficially Owned Prior to Offering | No. of Shares Being Offered | No. of Shares Beneficially Owned After Offering | Percent of Shares Beneficially Owned After Offering | |||||||||||||||
| JOHN WILLIAM REINKE | 43 | 0.00 | % | 43 | - | 0.00 | % | |||||||||||||
| JOSEPH BARBA | 557 | 0.00 | % | 557 | - | 0.00 | % | |||||||||||||
| JOSEPH SULTANA & ANTOINETTE SULTANA | 5,110 | 0.00 | % | 5,110 | - | 0.00 | % | |||||||||||||
| JOSEPHINE HEATHER HOWIE | 38 | 0.00 | % | 38 | - | 0.00 | % | |||||||||||||
| JUDITH PEARCE | 6,052 | 0.00 | % | 6,052 | - | 0.00 | % | |||||||||||||
| JUDY ELIZABETH GREEN | 81,287 | 0.00 | % | 81,287 | - | 0.00 | % | |||||||||||||
| JULIAN KIRZNER (177) | 470,068 | 0.02 | % | 118,503 | 351,565 | 0.02 | % | |||||||||||||
| JULIE BURNS & ROBERT BRIAN BURNS | 110,870 | 0.01 | % | 100,544 | 10,327 | 0.00 | % | |||||||||||||
| JULIE DIANE THOMAS | 401,962 | 0.02 | % | 115,098 | 286,864 | 0.01 | % | |||||||||||||
| JULIE GOWAN (178) | 150,038 | 0.01 | % | 102,502 | 47,536 | 0.00 | % | |||||||||||||
| JULIE ROBINSON | 908 | 0.00 | % | 908 | - | 0.00 | % | |||||||||||||
| JUSTIN ANTHONY CAMDEN | 4,980 | 0.00 | % | 4,980 | - | 0.00 | % | |||||||||||||
| JUSTIN BLUMFIELD | 310,944 | 0.01 | % | 110,547 | 200,397 | 0.01 | % | |||||||||||||
| JUSTIN NUICH | 802,325 | 0.04 | % | 135,116 | 667,209 | 0.03 | % | |||||||||||||
| KARA LIVINGSTON | 396,192 | 0.02 | % | 114,810 | 281,382 | 0.01 | % | |||||||||||||
| KAREN GODDARD | 33,317 | 0.00 | % | 33,317 | - | 0.00 | % | |||||||||||||
| KAREN LEE-ANNE PARKER | 1,778 | 0.00 | % | 1,778 | - | 0.00 | % | |||||||||||||
| KAREN MARIA LA FRENTZ | 19,170 | 0.00 | % | 19,170 | - | 0.00 | % | |||||||||||||
| KARIN HUNTER | 610,220 | 0.03 | % | 125,511 | 484,709 | 0.02 | % | |||||||||||||
| KARLENE KILGOUR | 123 | 0.00 | % | 123 | - | 0.00 | % | |||||||||||||
| KATE THERESE PENFOLD | 465 | 0.00 | % | 465 | - | 0.00 | % | |||||||||||||
| KATHLEEN JOAN BEDFORD | 7,325 | 0.00 | % | 7,325 | - | 0.00 | % | |||||||||||||
| KATHLEEN SALOMONS | 44 | 0.00 | % | 44 | - | 0.00 | % | |||||||||||||
| KATHRYN JEAN GAMBELL | 709,004 | 0.03 | % | 130,450 | 578,554 | 0.03 | % | |||||||||||||
| KATHY BEATRIX PERKINS | 750,000 | 0.03 | % | 132,500 | 617,500 | 0.03 | % | |||||||||||||
| KAY ELIZABETH ARMOUR | 625 | 0.00 | % | 625 | - | 0.00 | % | |||||||||||||
| KEITH ARNOLD VUICHOLD | 400,043 | 0.02 | % | 115,002 | 285,041 | 0.01 | % | |||||||||||||
| KEITH ARNOLD VUICHOUD & JOANNE VUICHOUD (179) | 2,367,749 | 0.11 | % | 213,387 | 2,154,362 | 0.10 | % | |||||||||||||
| KEITH CHARLES TRUSCOTT | 338 | 0.00 | % | 338 | - | 0.00 | % | |||||||||||||
| KEITH DYKE & SERENA DYKE | 42 | 0.00 | % | 42 | - | 0.00 | % | |||||||||||||
| KEITH EDWARD KIMBER | 21,974 | 0.00 | % | 21,974 | - | 0.00 | % | |||||||||||||
| KEITH EDWARD KIMBER | 13,802 | 0.00 | % | 13,802 | - | 0.00 | % | |||||||||||||
| KEITH FIEBIG & WENDY FIEBIG | 750 | 0.00 | % | 750 | - | 0.00 | % | |||||||||||||
| KEITH SMITH & KERYN BRUMPTON | 793 | 0.00 | % | 793 | - | 0.00 | % | |||||||||||||
| KEN RYAN & KAY RYAN | 215,090 | 0.01 | % | 105,755 | 109,336 | 0.01 | % | |||||||||||||
| KEN SAUL | 43 | 0.00 | % | 43 | - | 0.00 | % | |||||||||||||
| KEN STUCKEY (180) | 4,000,000 | 0.19 | % | 390,000 | 3,610,000 | 0.17 | % | |||||||||||||
| KENNETH ALAN LABONE | 1,000,032 | 0.05 | % | 145,002 | 855,030 | 0.04 | % | |||||||||||||
| KENNETH BASIL TYSON & CHRISTINE MICHELLE TYSON | 402,223 | 0.02 | % | 115,111 | 287,112 | 0.01 | % | |||||||||||||
| KENNETH JAMES POLS | 3,305 | 0.00 | % | 3,305 | - | 0.00 | % | |||||||||||||
| KENNETH POLS & MARY JOY POLS | 20,509 | 0.00 | % | 20,509 | - | 0.00 | % | |||||||||||||
| KENNETH TYSON & CHRISTINE TYSON | 400,428 | 0.02 | % | 115,021 | 285,407 | 0.01 | % | |||||||||||||
| KENNTEH TYSON & CHRISTINE TYSON | 7,325 | 0.00 | % | 7,325 | - | 0.00 | % | |||||||||||||
| KERRI ANNE BALL & PETER GEOFFREY BALL (181) | 2,000,000 | 0.09 | % | 195,000 | 1,805,000 | 0.08 | % | |||||||||||||
| KERRIE LOUISE GRAYSON (182) | 3,473,305 | 0.16 | % | 697,089 | 3,109,640 | 0.1 4 | % | |||||||||||||
| KERRY LYNETTE GREENOP | 425,041 | 0.02 | % | 116,252 | 308,789 | 0.01 | % | |||||||||||||
| KEVIN FRANCIS WOOD | 400,536 | 0.02 | % | 115,027 | 285,509 | 0.01 | % | |||||||||||||
| KEVIN JOHN HOWARD (183) | 9,617,710 | 0.45 | % | 697,089 | 8,920,621 | 0.4 1 | % | |||||||||||||
| KEVIN RILEY (184) | 835,254 | 0.04 | % | 231,763 | 603,491 | 0.03 | % | |||||||||||||
| 41 |
| Name of Beneficial Owner | No. of Shares Owned Prior to Offering | Percent of Shares Beneficially Owned Prior to Offering | No. of Shares Being Offered | No. of Shares Beneficially Owned After Offering | Percent of Shares Beneficially Owned After Offering | |||||||||||||||
| KEVIN VARDY & ELIZABETH VARDY (185) | 1,098,096 | 0.05 | % | 149,905 | 948,191 | 0.04 | % | |||||||||||||
| KIRK WAYNE PURCHASE | 218 | 0.00 | % | 218 | - | 0.00 | % | |||||||||||||
| KIRSTIN MILLER | 225 | 0.00 | % | 225 | - | 0.00 | % | |||||||||||||
| KRISTEN YOUNG | 600 | 0.00 | % | 600 | - | 0.00 | % | |||||||||||||
| KRISTY NEWMAN | 3,000 | 0.00 | % | 3,000 | - | 0.00 | % | |||||||||||||
| KYLIE HARRISON | 63 | 0.00 | % | 63 | - | 0.00 | % | |||||||||||||
| KYLIE KOUVELAS | 465,923 | 0.02 | % | 118,296 | 347,627 | 0.02 | % | |||||||||||||
| KYLIE KOUVELAS | 400,043 | 0.02 | % | 115,002 | 285,041 | 0.01 | % | |||||||||||||
| KYLIE REBECCA HARRIS & MICHAEL HENRY SMITH | 4,252 | 0.00 | % | 4,252 | - | 0.00 | % | |||||||||||||
| LACHLAN AARON BELL | 763,333 | 0.04 | % | 133,167 | 630,166 | 0.03 | % | |||||||||||||
| LAINIE MAREE ADDINELL | 1,129,768 | 0.05 | % | 151,488 | 978,280 | 0.05 | % | |||||||||||||
| LANA THOMPSON | 19,225 | 0.00 | % | 19,225 | - | 0.00 | % | |||||||||||||
| LANCE POLLARD (186) | 2,294,776 | 0.11 | % | 209,739 | 2,085,037 | 0.10 | % | |||||||||||||
| LARRY SWIFT | 605,000 | 0.03 | % | 125,250 | 479,750 | 0.02 | % | |||||||||||||
| LAURANCE ANTHONY SIDARI | 611,198 | 0.03 | % | 125,560 | 485,638 | 0.02 | % | |||||||||||||
| LAUREN KATHLENE GORDON | 225 | 0.00 | % | 225 | - | 0.00 | % | |||||||||||||
| LEAH COCHRANE | 288 | 0.00 | % | 288 | - | 0.00 | % | |||||||||||||
| LEANNE WIGRAFT | 55 | 0.00 | % | 55 | - | 0.00 | % | |||||||||||||
| LEE ANN CONNOR | 2,500 | 0.00 | % | 2,500 | - | 0.00 | % | |||||||||||||
| LEE ANNETTE KLAVERSTYN | 44,495 | 0.00 | % | 44,495 | - | 0.00 | % | |||||||||||||
| LEE LEE INGRAM | 43 | 0.00 | % | 43 | - | 0.00 | % | |||||||||||||
| LEE NEWMAN | 3,000 | 0.00 | % | 3,000 | - | 0.00 | % | |||||||||||||
| LEEANNE KATHLEEN ALCORN | 485,179 | 0.02 | % | 119,259 | 365,920 | 0.02 | % | |||||||||||||
| LEI XU | 125 | 0.00 | % | 125 | - | 0.00 | % | |||||||||||||
| LEIGH STAFFORD (187) | 1,558,293 | 0.07 | % | 362,915 | 1,195,378 | 0.06 | % | |||||||||||||
| LEISA JAYNE PROVOST | 168 | 0.00 | % | 168 | - | 0.00 | % | |||||||||||||
| LEISA WARD & NIGEL WARD | 43 | 0.00 | % | 43 | - | 0.00 | % | |||||||||||||
| LEN MACLEAN | 406,237 | 0.02 | % | 115,312 | 290,925 | 0.01 | % | |||||||||||||
| LENNOX MACLEAN & MILTON FRITH & RICHARD PATRICK BUNGEY | 402,453 | 0.02 | % | 115,123 | 287,330 | 0.01 | % | |||||||||||||
| LEON HOARE | 22,638 | 0.00 | % | 22,638 | - | 0.00 | % | |||||||||||||
| LEON JOHN MUNCE | 31 | 0.00 | % | 31 | - | 0.00 | % | |||||||||||||
| LEONE S BALDOCK | 7,325 | 0.00 | % | 7,325 | - | 0.00 | % | |||||||||||||
| LEONE SIGNA BALDOCK | 150,129 | 0.01 | % | 102,506 | 47,623 | 0.00 | % | |||||||||||||
| LEONE SIGNA CATHERINE BALDOCK | 1,227 | 0.00 | % | 1,227 | - | 0.00 | % | |||||||||||||
| LEONG H OH | 61,566 | 0.00 | % | 61,566 | - | 0.00 | % | |||||||||||||
| LEONIE S BALDOCK | 1,227 | 0.00 | % | 1,227 | - | 0.00 | % | |||||||||||||
| LES SAMBA | 38,032 | 0.00 | % | 38,032 | - | 0.00 | % | |||||||||||||
| LESLEIGH DENISE WAGNER | 1,000,793 | 0.05 | % | 145,040 | 855,753 | 0.04 | % | |||||||||||||
| LESLEY ANNE SMITHERS | 406,515 | 0.02 | % | 115,326 | 291,189 | 0.01 | % | |||||||||||||
| LESLEY DOYLE | 35 | 0.00 | % | 35 | - | 0.00 | % | |||||||||||||
| LESLEY MARGARET FROST & JOHN ARNOLD FROST (188) | 1,159,181 | 0.05 | % | 152,959 | 1,006,222 | 0.05 | % | |||||||||||||
| LESLEY SMITHERS & CAROLYN WILLIAMS | 851,784 | 0.04 | % | 137,589 | 714,195 | 0.03 | % | |||||||||||||
| LESLEY SMITHERS & CAROLYN WILLIAMS SMITHERS | 480,994 | 0.02 | % | 119,050 | 361,944 | 0.02 | % | |||||||||||||
| LESLIE FROST (189) | 906,737 | 0.04 | % | 140,337 | 766,400 | 0.04 | % | |||||||||||||
| LESLIE JAMES TAYLOR & SUSANNE TAYLOR (190) | 1,481,746 | 0.07 | % | 169,087 | 1,312,659 | 0.06 | % | |||||||||||||
| LESLIE MOSCA | 40,768 | 0.00 | % | 40,768 | - | 0.00 | % | |||||||||||||
| LESLIE TAYLOR & SUSANNE TAYLOR (191) | 1,425,000 | 0.07 | % | 166,250 | 1,258,750 | 0.06 | % | |||||||||||||
| LIANE TAYLOR | 3,368 | 0.00 | % | 3,368 | - | 0.00 | % | |||||||||||||
| LIDIA TACCONE | 89,920 | 0.00 | % | 89,920 | - | 0.00 | % | |||||||||||||
| LINDA MAREE GANT (192) | 1,732,876 | 0.08 | % | 181,644 | 1,551,232 | 0.07 | % | |||||||||||||
| 42 |
| Name of Beneficial Owner | No. of Shares Owned Prior to Offering | Percent of Shares Beneficially Owned Prior to Offering | No. of Shares Being Offered | No. of Shares Beneficially Owned After Offering | Percent of Shares Beneficially Owned After Offering | |||||||||||||||
| LINDA-JANE SHEEDY | 11,720 | 0.00 | % | 11,720 | - | 0.00 | % | |||||||||||||
| LINDA-JANE SHEEDY | 8,296 | 0.00 | % | 8,296 | - | 0.00 | % | |||||||||||||
| LIONEL CARL DEWSNAP | 86 | 0.00 | % | 86 | - | 0.00 | % | |||||||||||||
| LIONEL CHARLES FLASHMAN | 41,032 | 0.00 | % | 41,032 | - | 0.00 | % | |||||||||||||
| LIONEL DEWSNAP | 5,860 | 0.00 | % | 5,860 | - | 0.00 | % | |||||||||||||
| LISA JANE WARD | 15,000 | 0.00 | % | 15,000 | - | 0.00 | % | |||||||||||||
| LISA MAREE VIDLER | 2,962,196 | 0.14 | % | 243,110 | 2,719,086 | 0.13 | % | |||||||||||||
| LISA MARIE SEALE | 7,325 | 0.00 | % | 7,325 | - | 0.00 | % | |||||||||||||
| LISA MARIE SEALE | 254 | 0.00 | % | 254 | - | 0.00 | % | |||||||||||||
| LISA SEALE & RYDALL TERANCE SEALE (193) | 9,333 | 0.00 | % | 9,333 | - | 0.00 | % | |||||||||||||
| LISA STRIBLEY BACKDALE (194) | 8,737 | 0.00 | % | 8,737 | - | 0.00 | % | |||||||||||||
| LIVIANA FORZA | 6,000 | 0.00 | % | 6,000 | - | 0.00 | % | |||||||||||||
| LIZ BESSON | 34,988 | 0.00 | % | 34,988 | - | 0.00 | % | |||||||||||||
| LLOYD MCDONALD | 49 | 0.00 | % | 49 | - | 0.00 | % | |||||||||||||
| LOIS CLOSTER (195) | 339,255 | 0.02 | % | 205,154 | 134,101 | 0.01 | % | |||||||||||||
| LOREEN LAL | 605 | 0.00 | % | 605 | - | 0.00 | % | |||||||||||||
| LOREEN LAL | 550 | 0.00 | % | 550 | - | 0.00 | % | |||||||||||||
| LORRAINE ELLIOTT | 40 | 0.00 | % | 40 | - | 0.00 | % | |||||||||||||
| LORRAINE JOYCE MAHONY | 7,325 | 0.00 | % | 7,325 | - | 0.00 | % | |||||||||||||
| LORRAINE JOYCE MAHONY | 21,406 | 0.00 | % | 21,406 | - | 0.00 | % | |||||||||||||
| LOUIS JOSEPH GREALY | 385 | 0.00 | % | 385 | - | 0.00 | % | |||||||||||||
| LOUISE CHRISTINE GILMOUR | 290,000 | 0.01 | % | 109,500 | 180,500 | 0.01 | % | |||||||||||||
| LOUISE FAULKNER | 7,325 | 0.00 | % | 7,325 | - | 0.00 | % | |||||||||||||
| LOUISE JANE FAULKNER | 61,566 | 0.00 | % | 61,566 | - | 0.00 | % | |||||||||||||
| LOUISE JANE FAULKNER | 43 | 0.00 | % | 43 | - | 0.00 | % | |||||||||||||
| LUKE DEAN & BIANCA DEAN (196) | 7,474 | 0.00 | % | 7,474 | - | 0.00 | % | |||||||||||||
| LYNDA ELIZABETH SUGARS | 122 | 0.00 | % | 122 | - | 0.00 | % | |||||||||||||
| LYNETTE KAY UNDERWOOD | 2,453 | 0.00 | % | 2,453 | - | 0.00 | % | |||||||||||||
| LYNETTE MARGARET SCHAEFER | 2,000,000 | 0.09 | % | 195,000 | 1,805,000 | 0.08 | % | |||||||||||||
| LYNETTE MARIA GOYEN | 656,988 | 0.03 | % | 127,849 | 529,139 | 0.02 | % | |||||||||||||
| MADELINE KENNEDY | 17,518 | 0.00 | % | 17,518 | - | 0.00 | % | |||||||||||||
| MALCOLM ANDREW WARREN & NOLA JOY WARREN (197) | 53,915 | 0.00 | % | 53,915 | - | 0.00 | % | |||||||||||||
| MALCOLM BUTLER & LIDIANA BUTLER | 813 | 0.00 | % | 813 | - | 0.00 | % | |||||||||||||
| MALCOLM HILL | 278 | 0.00 | % | 278 | - | 0.00 | % | |||||||||||||
| MALCOLM HILL & KHRISTINE HILL | 43 | 0.00 | % | 43 | - | 0.00 | % | |||||||||||||
| MALCOLM JOHN HILL | 313 | 0.00 | % | 313 | - | 0.00 | % | |||||||||||||
| MALCOLM KAIN & LILIANA KAIN (198) | 1,586 | 0.00 | % | 1,586 | - | 0.00 | % | |||||||||||||
| MALCOLM NEIL FOWLER | 24,527 | 0.00 | % | 24,527 | - | 0.00 | % | |||||||||||||
| MARCEL KOCH (199) | 2,982,441 | 0.14 | % | 339,122 | 2,643,319 | 0.1 2 | % | |||||||||||||
| MARCEL KOCH & URSULA KOCH (200) | 5,064,938 | 0.23 | % | 348,247 | 4,716,691 | 0.22 | % | |||||||||||||
| MARCUS FINCH & ROBYN ANN FINCH (201) | 853 | 0.00 | % | 853 | - | 0.00 | % | |||||||||||||
| MAREE LOVETT | 775 | 0.00 | % | 775 | - | 0.00 | % | |||||||||||||
| MAREE LOVETT | 1,220 | 0.00 | % | 1,220 | - | 0.00 | % | |||||||||||||
| MAREETA V ROLLEY (202) | 959,872 | 0.04 | % | 142,994 | 816,878 | 0.04 | % | |||||||||||||
| MAREETA V ROLLEY | 150,000 | 0.01 | % | 102,500 | 47,500 | 0.00 | % | |||||||||||||
| MARGARET LIVINGSTON (203) | 1,377,212 | 0.06 | % | 163,861 | 1,213,351 | 0.06 | % | |||||||||||||
| MARGARET MARY CAMENS | 540,595 | 0.03 | % | 122,030 | 418,565 | 0.02 | % | |||||||||||||
| MARGARET MARY MCINTYRE & DAVID FRANCIS MCINTYRE (204) | 2,013,412 | 0.09 | % | 195,671 | 1,817,741 | 0.08 | % | |||||||||||||
| MARGARET ROSE MCQUILLAN | 75 | 0.00 | % | 75 | - | 0.00 | % | |||||||||||||
| MARGIE MCCLEELAND | 12 | 0.00 | % | 12 | - | 0.00 | % | |||||||||||||
| 43 |
| Name of Beneficial Owner | No. of Shares Owned Prior to Offering | Percent of Shares Beneficially Owned Prior to Offering | No. of Shares Being Offered | No. of Shares Beneficially Owned After Offering | Percent of Shares Beneficially Owned After Offering | |||||||||||||||
| MARIA JOSEPHINE TENNI | 9,810 | 0.00 | % | 9,810 | - | 0.00 | % | |||||||||||||
| MARIA MITROPOULOS | 1,426,731 | 0.07 | % | 166,337 | 1,260,394 | 0.06 | % | |||||||||||||
| MARIA SZABO | 540 | 0.00 | % | 540 | - | 0.00 | % | |||||||||||||
| MARIE ARIADHNE LABOUR | 512 | 0.00 | % | 512 | - | 0.00 | % | |||||||||||||
| MARIE-THERESA O'DWYER | 250 | 0.00 | % | 250 | - | 0.00 | % | |||||||||||||
| MARILYN EUNICE SMITH & BRONWYN KAY LOCK (205) | 1,418,750 | 0.07 | % | 165,938 | 1,252,813 | 0.06 | % | |||||||||||||
| MARILYN SULLIVAN | 1,586 | 0.00 | % | 1,586 | - | 0.00 | % | |||||||||||||
| MARIO ANTONIO DE PETRO | 1,250 | 0.00 | % | 1,250 | - | 0.00 | % | |||||||||||||
| MARIO FERNS (206) | 4,940 | 0.00 | % | 4,940 | - | 0.00 | % | |||||||||||||
| MARIO POLETTI & GLENYS POLETTI | 1,109,679 | 0.05 | % | 150,484 | 959,195 | 0.04 | % | |||||||||||||
| MARION JEAN FAINT | 98 | 0.00 | % | 98 | - | 0.00 | % | |||||||||||||
| MARJORIE CAROLE HUDSON | 7,325 | 0.00 | % | 7,325 | - | 0.00 | % | |||||||||||||
| MARJORIE CAROLE HUDSON | 2,420 | 0.00 | % | 2,420 | - | 0.00 | % | |||||||||||||
| MARJORIE CAROLE HUDSON & REDVERS JOHN HUDSON | 7,325 | 0.00 | % | 7,325 | - | 0.00 | % | |||||||||||||
| MARJORIE CAROLE HUDSON & REDVERS JOHN HUDSON | 36,833 | 0.00 | % | 36,833 | - | 0.00 | % | |||||||||||||
| MARK ANDREW YON | 1,750 | 0.00 | % | 1,750 | - | 0.00 | % | |||||||||||||
| MARK ANTHONY SPENCE | 9,765 | 0.00 | % | 9,765 | - | 0.00 | % | |||||||||||||
| MARK BALICKI | 1,032 | 0.00 | % | 1,032 | - | 0.00 | % | |||||||||||||
| MARK CLIMPSON & NATALIE CLIMPSON (207) | 21,970 | 0.00 | % | 21,970 | - | 0.00 | % | |||||||||||||
| MARK CROHAN & JACINTA CROHAN | 98,100 | 0.00 | % | 98,100 | - | 0.00 | % | |||||||||||||
| MARK GREGORY HARPER & MARGARET ELLEN HARPER | 1,387 | 0.00 | % | 1,387 | - | 0.00 | % | |||||||||||||
| MARK JOHN WHITTAKER & PAMELA JAYNE WHITTAKER (208) | 477,066 | 0.02 | % | 118,853 | 358,213 | 0.02 | % | |||||||||||||
| MARK RAYMOND LIDDLE | 7,620 | 0.00 | % | 7,620 | - | 0.00 | % | |||||||||||||
| MARK ROBERT AUSTIN | 548 | 0.00 | % | 548 | - | 0.00 | % | |||||||||||||
| MARK ROBERT HAZELL | 26,458 | 0.00 | % | 26,458 | - | 0.00 | % | |||||||||||||
| MARK STUART PAGE & ODETTE MARGARET PAGE | 3,467 | 0.00 | % | 3,467 | - | 0.00 | % | |||||||||||||
| MARK THEODORE OHLSSON | 4,088 | 0.00 | % | 4,088 | - | 0.00 | % | |||||||||||||
| MARK WISSMANN | 7,325 | 0.00 | % | 7,325 | - | 0.00 | % | |||||||||||||
| MARK WISSMANN | 32 | 0.00 | % | 32 | - | 0.00 | % | |||||||||||||
| MAROL KELLY | 460,000 | 0.02 | % | 118,000 | 342,000 | 0.02 | % | |||||||||||||
| MARTIN EDWARD KAVANAGH | 386 | 0.00 | % | 386 | - | 0.00 | % | |||||||||||||
| MARTIN G CHAPMAN & AUDREY CHAPMAN | 73,248 | 0.00 | % | 73,248 | - | 0.00 | % | |||||||||||||
| MARTIN GRAHAM CHAPMAN & AUDREY CHAPMAN | 3,053 | 0.00 | % | 3,053 | - | 0.00 | % | |||||||||||||
| MARTIN MACKENZIE & MARY MACKENZIE | 3,375 | 0.00 | % | 3,375 | - | 0.00 | % | |||||||||||||
| MARY JOY POLS | 67,068 | 0.00 | % | 67,068 | - | 0.00 | % | |||||||||||||
| MARY MILES (209) | 7,045 | 0.00 | % | 7,045 | - | 0.00 | % | |||||||||||||
| MARY TZIKAS | 7,358 | 0.00 | % | 7,358 | - | 0.00 | % | |||||||||||||
| MARY-ANNE PHILLIPS | 43 | 0.00 | % | 43 | - | 0.00 | % | |||||||||||||
| MARYANNE SMITH & MALCOLM SMITH | 350 | 0.00 | % | 350 | - | 0.00 | % | |||||||||||||
| MARY-JANE MOLONEY | 298,096 | 0.01 | % | 109,905 | 188,191 | 0.01 | % | |||||||||||||
| MATHEW KROPMAN & ANNE KROPMAN | 55 | 0.00 | % | 55 | - | 0.00 | % | |||||||||||||
| MATT CORKIN (210) | 1,525,004 | 0.07 | % | 171,250 | 1,353,754 | 0.06 | % | |||||||||||||
| MATTHEW DOUGLAS MIDDLEMISS | 69,543 | 0.00 | % | 69,543 | - | 0.00 | % | |||||||||||||
| MATTHEW JAMES HOPKER LLEWELLYN | 1,472 | 0.00 | % | 1,472 | - | 0.00 | % | |||||||||||||
| MATTHEW TROY & DAMIEN TROY | 39,984 | 0.00 | % | 39,984 | - | 0.00 | % | |||||||||||||
| MATTHEW TYSON KITCHENER | 572 | 0.00 | % | 572 | - | 0.00 | % | |||||||||||||
| MAURICE DOVER (211) | 2,905,662 | 0.13 | % | 335,283 | 2,570,379 | 0.12 | % | |||||||||||||
| MAX TWIGG (212) | 1,471,429 | 0.07 | % | 168,571 | 1,302,858 | 0.06 | % | |||||||||||||
| MAXWELL ROBERT HOOPER & VICKIE JEAN HOOPER (213) | 8,014,114 | 0.37 | % | 669,125 | 7,344,989 | 0.3 4 | % | |||||||||||||
| MELINDA HARRISON | 485,300 | 0.02 | % | 119,265 | 366,035 | 0.02 | % | |||||||||||||
| 44 |
| Name of Beneficial Owner | No. of Shares Owned Prior to Offering | Percent of Shares Beneficially Owned Prior to Offering | No. of Shares Being Offered | No. of Shares Beneficially Owned After Offering | Percent of Shares Beneficially Owned After Offering | |||||||||||||||
| MELISSA CURCIO | 10,916 | 0.00 | % | 10,916 | - | 0.00 | % | |||||||||||||
| MELISSA JANE NEWING | 1,237 | 0.00 | % | 1,237 | - | 0.00 | % | |||||||||||||
| MELISSA MAREE PARK | 3,175 | 0.00 | % | 3,175 | - | 0.00 | % | |||||||||||||
| MELVYN STUART HORNBY | 29,361 | 0.00 | % | 29,361 | - | 0.00 | % | |||||||||||||
| MELVYN WHITWORTH | 43 | 0.00 | % | 43 | - | 0.00 | % | |||||||||||||
| MEREDITH ANNE PRUYN | 2,129 | 0.00 | % | 2,129 | - | 0.00 | % | |||||||||||||
| MERREN BARBARA BREMNER | 817 | 0.00 | % | 817 | - | 0.00 | % | |||||||||||||
| MERRYL ANDREE SHAND | 1,073,572 | 0.05 | % | 148,679 | 924,893 | 0.04 | % | |||||||||||||
| MERVYN VICTOR DUNKIN & JEANETTE CLYDA DUNKIN | 3,843 | 0.00 | % | 3,843 | - | 0.00 | % | |||||||||||||
| MICHAEL ANTHONY ROWLINGSON& MARGARET HELEN ROWLINGSON | 43 | 0.00 | % | 43 | - | 0.00 | % | |||||||||||||
| MICHAEL BIGG & MONICA BIGG (214) | 18,335,043 | 0.85 | % | 1,201,752 | 17,133,291 | 0. 79 | % | |||||||||||||
| MICHAEL CARTY & NICOLE CARTY | 4,905 | 0.00 | % | 4,905 | - | 0.00 | % | |||||||||||||
| MICHAEL CHRISAFIS | 2,523 | 0.00 | % | 2,523 | - | 0.00 | % | |||||||||||||
| MICHAEL DALZOTTO | 601,304 | 0.03 | % | 125,065 | 476,239 | 0.02 | % | |||||||||||||
| MICHAEL DENNIS BRAY | 163 | 0.00 | % | 163 | - | 0.00 | % | |||||||||||||
| MICHAEL E ALLEN & LYNETTE CAROL ALLEN (215) | 481,748 | 0.02 | % | 119,087 | 362,661 | 0.02 | % | |||||||||||||
| MICHAEL GEORGE ALCORN | 1,881,924 | 0.09 | % | 189,096 | 1,692,828 | 0.08 | % | |||||||||||||
| MICHAEL GERARD KEATING & JUDITH ANNE KEATING (216) | 2,541,472 | 0.12 | % | 317,074 | 2,224,398 | 0.1 0 | % | |||||||||||||
| MICHAEL GROCOCK & JODIE GROCOCK | 4,905 | 0.00 | % | 4,905 | - | 0.00 | % | |||||||||||||
| MICHAEL HARTLEY (217) | 5,124 | 0.00 | % | 5,124 | - | 0.00 | % | |||||||||||||
| MICHAEL JAMES MCAULIFFE | 2,931 | 0.00 | % | 2,931 | - | 0.00 | % | |||||||||||||
| MICHAEL JOHN BOWNE | 596,001 | 0.03 | % | 124,800 | 471,201 | 0.02 | % | |||||||||||||
| MICHAEL JOHN BOWNE & TRACEY LEE BOWNE | 132,056 | 0.01 | % | 101,603 | 30,453 | 0.00 | % | |||||||||||||
| MICHAEL JOHN DUFFY | 157 | 0.00 | % | 157 | - | 0.00 | % | |||||||||||||
| MICHAEL JOSEPH MCCANN (218) | 1,086,652 | 0.05 | % | 222,333 | 864,319 | 0.04 | % | |||||||||||||
| MICHAEL MCMAHON (219) | 3,143,646 | 0.15 | % | 347,182 | 2,796,464 | 0.13 | % | |||||||||||||
| MICHAEL MINICHIELLO & THERESA MINICHIELLO (220) | 3,113,332 | 0.14 | % | 250,667 | 2,862,665 | 0.13 | % | |||||||||||||
| MICHAEL QUAGLIATA | 2,618,892 | 0.12 | % | 225,945 | 2,392,947 | 0.11 | % | |||||||||||||
| MICHAEL ROGER OSWALD PEARS | 24,314 | 0.00 | % | 24,314 | - | 0.00 | % | |||||||||||||
| MICHAEL ROGER OSWALD PEARS | 19,538 | 0.00 | % | 19,538 | - | 0.00 | % | |||||||||||||
| MICHAEL ROGERS (221) | 12,373,153 | 0.57 | % | 808,658 | 11,564,495 | 0.54 | % | |||||||||||||
| MICHAEL SERGI & ANTONETTE SERGI | 1,360,676 | 0.06 | % | 163,034 | 1,197,642 | 0.06 | % | |||||||||||||
| MICHAEL STELLER (222) | 6,010 | 0.00 | % | 6,010 | - | 0.00 | % | |||||||||||||
| MICHAEL TACCONE | 1,774,576 | 0.08 | % | 183,729 | 1,590,847 | 0.07 | % | |||||||||||||
| MICHAEL WHITROW & SUSANNE WHITROW | 43 | 0.00 | % | 43 | - | 0.00 | % | |||||||||||||
| MICHAEL ZAHARIADIS | 378 | 0.00 | % | 378 | - | 0.00 | % | |||||||||||||
| MICHAEL ZAMMIT & CYNTHIA ZAMMIT | 278,480 | 0.01 | % | 108,924 | 169,556 | 0.01 | % | |||||||||||||
| MICHEAL ROGER PEARS | 6,027 | 0.00 | % | 6,027 | - | 0.00 | % | |||||||||||||
| MICHELE UNTERFRAUNER | 9,375 | 0.00 | % | 9,375 | - | 0.00 | % | |||||||||||||
| MICHELLE AUDREY THOMPSON | 212,540 | 0.01 | % | 105,627 | 106,913 | 0.00 | % | |||||||||||||
| MICHELLE LOUISE CLIFFORD | 7,325 | 0.00 | % | 7,325 | - | 0.00 | % | |||||||||||||
| MICK ROWLINGSON & MAGGIE ROWLINGSON | 1,735 | 0.00 | % | 1,735 | - | 0.00 | % | |||||||||||||
| MICK ROWLINGSON & MAGGIE ROWLINGSON | 5,860 | 0.00 | % | 5,860 | - | 0.00 | % | |||||||||||||
| MIKE MCCANN (223) | 424,524 | 0.02 | % | 116,226 | 308,298 | 0.01 | % | |||||||||||||
| MILAN DEBELAK | 500 | 0.00 | % | 500 | - | 0.00 | % | |||||||||||||
| MILTON DOUGLAS TAYLOR | 1,400,075 | 0.06 | % | 165,004 | 1,235,071 | 0.06 | % | |||||||||||||
| MIRIAM NERVO | 414,812 | 0.02 | % | 115,741 | 299,071 | 0.01 | % | |||||||||||||
| MOHAMAD ABAS | 1,263 | 0.00 | % | 1,263 | - | 0.00 | % | |||||||||||||
| MUJI RETNA MUNAWATI | 407,603 | 0.02 | % | 115,380 | 292,223 | 0.01 | % | |||||||||||||
| MURRAY HIGHT & FERN HIGHT | 43 | 0.00 | % | 43 | - | 0.00 | % | |||||||||||||
| 45 |
| Name of Beneficial Owner | No. of Shares Owned Prior to Offering | Percent of Shares Beneficially Owned Prior to Offering | No. of Shares Being Offered | No. of Shares Beneficially Owned After Offering | Percent of Shares Beneficially Owned After Offering | |||||||||||||||
| MURRAY HIGHT & FERN HIGHT | 7,325 | 0.00 | % | 7,325 | - | 0.00 | % | |||||||||||||
| MURRAY JAMES CLOSE & HELEN DOREEN CLOSE (224) | 70,000 | 0.00 | % | 70,000 | - | 0.00 | % | |||||||||||||
| MYLES NORMAN DAVEY | 35 | 0.00 | % | 35 | - | 0.00 | % | |||||||||||||
| MYREE ANNETTE MORSI | 4,905 | 0.00 | % | 4,905 | - | 0.00 | % | |||||||||||||
| NANETTE REX | 500 | 0.00 | % | 500 | - | 0.00 | % | |||||||||||||
| NAOMI CLASOHM | 70,068 | 0.00 | % | 70,068 | - | 0.00 | % | |||||||||||||
| NARANDRAKUMAR NARSAI | 59 | 0.00 | % | 59 | - | 0.00 | % | |||||||||||||
| NATALIE ROSE - MARIE MARK | 1,892 | 0.00 | % | 1,892 | - | 0.00 | % | |||||||||||||
| NATASA DENMAN & STUART LLOYD DENMAN | 1,635 | 0.00 | % | 1,635 | - | 0.00 | % | |||||||||||||
| NATASCHA RILEY (225) | 1,472 | 0.00 | % | 1,472 | - | 0.00 | % | |||||||||||||
| NATASHA JAN BULLOCK | 100,000 | 0.00 | % | 100,000 | - | 0.00 | % | |||||||||||||
| NATHAN KING | 150 | 0.00 | % | 150 | - | 0.00 | % | |||||||||||||
| NAUM VITANOVSKI | 74 | 0.00 | % | 74 | - | 0.00 | % | |||||||||||||
| NEIL ALLSOPP & RHONDA ALLSOPP (226) | 367,858 | 0.02 | % | 183,286 | 184,572 | 0.01 | % | |||||||||||||
| NEIL ANDREW CATO | 208 | 0.00 | % | 208 | - | 0.00 | % | |||||||||||||
| NEIL ARTHUR YOUNG & HEATHER JUNE YOUNG | 9,499 | 0.00 | % | 9,499 | - | 0.00 | % | |||||||||||||
| NEIL DENIS PORTER & JUDITH PEARCE | 49,048 | 0.00 | % | 49,048 | - | 0.00 | % | |||||||||||||
| NEIL IBBOTT (227) | 1,461,310 | 0.07 | % | 168,066 | 1,293,245 | 0.06 | % | |||||||||||||
| NEIL JOHN BALL & LYNDI ELIZABETH BALL (228) | 2,522,400 | 0.12 | % | 316,120 | 2,206,280 | 0.1 0 | % | |||||||||||||
| NEIL JOHNSOTON (229) | 86 | 0.00 | % | 86 | - | 0.00 | % | |||||||||||||
| NEIL MARTINS & LIUIA MARTINS (230) | 24,524 | 0.00 | % | 24,524 | - | 0.00 | % | |||||||||||||
| NEIL MORTLAND | 23,689 | 0.00 | % | 23,689 | - | 0.00 | % | |||||||||||||
| NELUKSHI WIJETUNGA | 4,905 | 0.00 | % | 4,905 | - | 0.00 | % | |||||||||||||
| NEVELLE WATERS | 5,482 | 0.00 | % | 5,482 | - | 0.00 | % | |||||||||||||
| NEVELLE WATERS | 13,185 | 0.00 | % | 13,185 | - | 0.00 | % | |||||||||||||
| NEVILLE DAVID GRANT (231) | 3,992,321 | 0.18 | % | 484,616 | 3,507,705 | 0.1 6 | % | |||||||||||||
| NEVILLE PARTON (232) | 30,717 | 0.00 | % | 30,717 | - | 0.00 | % | |||||||||||||
| NGAIRE MCCALLUM | 43 | 0.00 | % | 43 | - | 0.00 | % | |||||||||||||
| NICHOLA JAMES-WALLACE | 984,584 | 0.05 | % | 144,229 | 840,355 | 0.04 | % | |||||||||||||
| NICHOLAS HARRINGTON | 6,350 | 0.00 | % | 6,350 | - | 0.00 | % | |||||||||||||
| NICHOLAS MACRI & CARMEL MACRI | 1,690,000 | 0.08 | % | 179,500 | 1,510,500 | 0.07 | % | |||||||||||||
| NICHOLAS MOLONEY & LISA MOLONEY | 1,015,000 | 0.05 | % | 145,750 | 869,250 | 0.04 | % | |||||||||||||
| NICHOLAS PAUL CASEY & MARGARET THERESE CASEY | 93 | 0.00 | % | 93 | - | 0.00 | % | |||||||||||||
| NICHOLAS PETER MARK | 1,892 | 0.00 | % | 1,892 | - | 0.00 | % | |||||||||||||
| NICHOLAS USSIA | 10,390 | 0.00 | % | 10,390 | - | 0.00 | % | |||||||||||||
| NICK ADAMIDIS | 1,421 | 0.00 | % | 1,421 | - | 0.00 | % | |||||||||||||
| NICK USSIA (233) | 43,464 | 0.00 | % | 43,464 | - | 0.00 | % | |||||||||||||
| NICK USSIA & CARMEL NEGHBRON | 25,000 | 0.00 | % | 25,000 | - | 0.00 | % | |||||||||||||
| NICK USSIA & JOHN VITOCCO | 382,572 | 0.02 | % | 114,129 | 268,443 | 0.01 | % | |||||||||||||
| NICO SCHUTTE | 2,278,970 | 0.11 | % | 208,949 | 2,070,022 | 0.10 | % | |||||||||||||
| NICOLE MARIA MERDY | 64,091 | 0.00 | % | 64,091 | - | 0.00 | % | |||||||||||||
| NICOLE MARIE ALDRIDGE | 1,529,638 | 0.07 | % | 171,482 | 1,358,156 | 0.06 | % | |||||||||||||
| NIGEL ANTHONY COOPER | 36,786 | 0.00 | % | 36,786 | - | 0.00 | % | |||||||||||||
| NOEL ARTHER YOUNG & ESTELLE MERLE YOUNG | 347,570 | 0.02 | % | 112,379 | 235,192 | 0.01 | % | |||||||||||||
| NOEL ARTHUR YOUNG & ESTELLE MERLE YOUNG | 407,148 | 0.02 | % | 115,357 | 291,791 | 0.01 | % | |||||||||||||
| NOEL HARDINGHAM & SUE HARDINGHAM | 43 | 0.00 | % | 43 | - | 0.00 | % | |||||||||||||
| NOEL JOHN LILL | 278 | 0.00 | % | 278 | - | 0.00 | % | |||||||||||||
| NOELA FORD | 463 | 0.00 | % | 463 | - | 0.00 | % | |||||||||||||
| NOELA VALENTINE BROOKS | 53,896 | 0.00 | % | 53,896 | - | 0.00 | % | |||||||||||||
| NORMA FAY ROSENHAIN (234) | 1,377,096 | 0.06 | % | 163,855 | 1,213,241 | 0.06 | % | |||||||||||||
| 46 |
| Name of Beneficial Owner | No. of Shares Owned Prior to Offering | Percent of Shares Beneficially Owned Prior to Offering | No. of Shares Being Offered | No. of Shares Beneficially Owned After Offering | Percent of Shares Beneficially Owned After Offering | |||||||||||||||
| NORMAN AVERY | 61 | 0.00 | % | 61 | - | 0.00 | % | |||||||||||||
| OWEN J STEINHARDT & LYNITA A STEINHARDT | 954,247 | 0.04 | % | 142,712 | 811,535 | 0.04 | % | |||||||||||||
| PAMELA YOUNG | 29,432 | 0.00 | % | 29,432 | - | 0.00 | % | |||||||||||||
| PAT MCCARTHY | 44,143 | 0.00 | % | 44,143 | - | 0.00 | % | |||||||||||||
| PATRICIA JOAN HENDERSON | 212 | 0.00 | % | 212 | - | 0.00 | % | |||||||||||||
| PATRICIA JOAN HENDERSON | 411 | 0.00 | % | 411 | - | 0.00 | % | |||||||||||||
| PATRICIA L K LEE & JEFFREY L H CHEONG | 36,786 | 0.00 | % | 36,786 | - | 0.00 | % | |||||||||||||
| PATRICK LOQUANCIO | 400,525 | 0.02 | % | 115,026 | 285,499 | 0.01 | % | |||||||||||||
| PAUL & KARGER | 7,325 | 0.00 | % | 7,325 | - | 0.00 | % | |||||||||||||
| PAUL & RUGH HOOGENRAAD | 407,325 | 0.02 | % | 115,366 | 291,959 | 0.01 | % | |||||||||||||
| PAUL ALEXANDER HOOGENRAAD | 61,566 | 0.00 | % | 61,566 | - | 0.00 | % | |||||||||||||
| PAUL ALEXANDER HOOGENRAAD & RUTH MILLICENT HOOGENRAAD | 434,420 | 0.02 | % | 116,721 | 317,699 | 0.01 | % | |||||||||||||
| PAUL BARRY EDWARDS & BARBARA EVELYN EDWARDS (235) | 3,339,528 | 0.15 | % | 356,976 | 2,982,552 | 0.14 | % | |||||||||||||
| PAUL CARTY | 24 | 0.00 | % | 24 | - | 0.00 | % | |||||||||||||
| PAUL CONNOLLY | 5,232 | 0.00 | % | 5,232 | - | 0.00 | % | |||||||||||||
| PAUL CONNOLLY & DEBORAH CONNOLLY | 251,124 | 0.01 | % | 107,556 | 143,568 | 0.01 | % | |||||||||||||
| PAUL FRANCIS FONTAINE | 54,632 | 0.00 | % | 54,632 | - | 0.00 | % | |||||||||||||
| PAUL GERARD TOBIN | 737 | 0.00 | % | 737 | - | 0.00 | % | |||||||||||||
| PAUL HENRY THOMPSON | 525,855 | 0.02 | % | 121,293 | 404,562 | 0.02 | % | |||||||||||||
| PAUL HOOGENRAAD & RUTH HOOGENRAAD | 405,394 | 0.02 | % | 115,270 | 290,124 | 0.01 | % | |||||||||||||
| PAUL KARGER | 5,758 | 0.00 | % | 5,758 | - | 0.00 | % | |||||||||||||
| PAUL MAXWELL FOX | 598 | 0.00 | % | 598 | - | 0.00 | % | |||||||||||||
| PAUL RICHARD & KAREN MAREE & DAMIAN PAUL HILLS (236) | 1,400,000 | 0.06 | % | 165,000 | 1,235,000 | 0.06 | % | |||||||||||||
| PAUL RICHARD HILLS | 20,437 | 0.00 | % | 20,437 | - | 0.00 | % | |||||||||||||
| PAUL RUSSELL & CHRISTOPHER RUYS & IAN PATTERSON (237) | 1,402,453 | 0.06 | % | 165,123 | 1,237,330 | 0.06 | % | |||||||||||||
| PAUL SOLOMON & LEE SOLOMON | 601 | 0.00 | % | 601 | - | 0.00 | % | |||||||||||||
| PAUL STEPHAN TOOHEY & PAULINE GRACE TOOHEY (238) | 6,590,768 | 0.31 | % | 424,538 | 6,166,230 | 0.29 | % | |||||||||||||
| PAUL TAYLOR (239) | 1,555,009 | 0.07 | % | 267,750 | 1,287,259 | 0.06 | % | |||||||||||||
| PAUL THOMAS LEWIS | 690 | 0.00 | % | 690 | - | 0.00 | % | |||||||||||||
| PAUL TOSIN & DANIELA TOSIN (240) | 203,025 | 0.01 | % | 105,151 | 97,874 | 0.00 | % | |||||||||||||
| PAUL TOSIN & ELIZABETH FLORENCE KINNON (241) | 5,584 | 0.00 | % | 5,584 | - | 0.00 | % | |||||||||||||
| PAUL WILLIAM HUTCHINSON & DEBBIE LEA HUTCHINSON | 500 | 0.00 | % | 500 | - | 0.00 | % | |||||||||||||
| PAULINE MALONEY | 4,905 | 0.00 | % | 4,905 | - | 0.00 | % | |||||||||||||
| PERRY JOHN REGOLINI & GABRIELLE SIMONE REGOLINI | 125 | 0.00 | % | 125 | - | 0.00 | % | |||||||||||||
| PETER ALBERT DOUGLAS GRIEVE & EVELYN JOY GRIEVE | 402,457 | 0.02 | % | 115,123 | 287,334 | 0.01 | % | |||||||||||||
| PETER ANDREW ANTHONSEN | 5,000 | 0.00 | % | 5,000 | - | 0.00 | % | |||||||||||||
| PETER BARNES | 115 | 0.00 | % | 115 | - | 0.00 | % | |||||||||||||
| PETER BERNARD RYAN (242) | 23 | 0.00 | % | 23 | - | 0.00 | % | |||||||||||||
| PETER BILSTON | 337,289 | 0.02 | % | 111,864 | 225,425 | 0.01 | % | |||||||||||||
| PETER COGO & MAUREEN COGO | 1,543 | 0.00 | % | 1,543 | - | 0.00 | % | |||||||||||||
| PETER COLIN KEITH | 1,000,350 | 0.05 | % | 145,018 | 855,333 | 0.04 | % | |||||||||||||
| PETER COX | 16,905 | 0.00 | % | 16,905 | - | 0.00 | % | |||||||||||||
| PETER DESMOND WILSON (243) | 1,008,261 | 0.05 | % | 145,413 | 862,848 | 0.04 | % | |||||||||||||
| PETER DURDIN | 117 | 0.00 | % | 117 | - | 0.00 | % | |||||||||||||
| PETER EDMUND BURKE | 1,812 | 0.00 | % | 1,812 | - | 0.00 | % | |||||||||||||
| PETER ERNEST HANSEN & JOYCE MARION HANSEN | 1,095 | 0.00 | % | 1,095 | - | 0.00 | % | |||||||||||||
| PETER GOWAN & JULIE GOWAN (244) | 1,067,206 | 0.05 | % | 148,360 | 918,846 | 0.04 | % | |||||||||||||
| PETER JAMES DUNN (245) | 1,115,665 | 0.05 | % | 150,783 | 964,882 | 0.04 | % | |||||||||||||
| PETER JAMES KEARNEY (246) | 20,509 | 0.00 | % | 20,509 | - | 0.00 | % | |||||||||||||
| 47 |
| Name of Beneficial Owner | No. of Shares Owned Prior to Offering | Percent of Shares Beneficially Owned Prior to Offering | No. of Shares Being Offered | No. of Shares Beneficially Owned After Offering | Percent of Shares Beneficially Owned After Offering | |||||||||||||||
| PETER JOHN NONNENMACHER & LYNETTE FRANCES NONNENMACHER AND GREGORY JOHN NONNENMACHER (247) | 401,750 | 0.02 | % | 115,088 | 286,663 | 0.01 | % | |||||||||||||
| PETER KRIKKE (248) | 85,926 | 0.00 | % | 85,926 | - | 0.00 | % | |||||||||||||
| PETER LEWIS (249) | 3,819,785 | 0.18 | % | 380,989 | 3,438,796 | 0.16 | % | |||||||||||||
| PETER MACBEAN STEWART & ROBIN KATHLEEN STEWART | 191,286 | 0.01 | % | 104,564 | 86,722 | 0.00 | % | |||||||||||||
| PETER MARK & DORA MARK (250) | 229,216 | 0.01 | % | 106,461 | 122,755 | 0.01 | % | |||||||||||||
| PETER MARSH & DAWN MAY MARSH | 36,624 | 0.00 | % | 36,624 | - | 0.00 | % | |||||||||||||
| PETER MELVILLE KING & ELIZABETH MARY KING | 1,482,712 | 0.07 | % | 169,136 | 1,313,576 | 0.06 | % | |||||||||||||
| PETER MELVILLE KING & ELIZABETH MARY KING | 465,923 | 0.02 | % | 118,296 | 347,627 | 0.02 | % | |||||||||||||
| PETER MILAS | 16,978 | 0.00 | % | 16,978 | - | 0.00 | % | |||||||||||||
| PETER MOORE (251) | 2,000,000 | 0.09 | % | 195,000 | 1,805,000 | 0.08 | % | |||||||||||||
| PETER RICHARD SMITH | 43 | 0.00 | % | 43 | - | 0.00 | % | |||||||||||||
| PETER ROBERT MOORE | 4,000,000 | 0.19 | % | 295,000 | 3,705,000 | 0.17 | % | |||||||||||||
| PETER ROBERT SENG & BRONWYN MARY SENG | 75 | 0.00 | % | 75 | - | 0.00 | % | |||||||||||||
| PETER RYAN GILMOUR | 405,000 | 0.02 | % | 115,250 | 289,750 | 0.01 | % | |||||||||||||
| PETER SLAVKO CESTNIK & TIFFANY CLAIR CESTNIK | 1,655,048 | 0.08 | % | 177,752 | 1,477,296 | 0.07 | % | |||||||||||||
| PETER WILLIAM HEARMAN & PENELOPE HEARMAN & JOHN MICHAEL HEARMAN (252) | 2,510,322 | 0.12 | % | 315,516 | 2,194,806 | 0.1 0 | % | |||||||||||||
| PETER WILLIAM WEST & SIAN ELIZABETH WEST (253) | 18,750 | 0.00 | % | 18,750 | - | 0.00 | % | |||||||||||||
| PHIL WOOD (254) | 12,699 | 0.00 | % | 12,699 | - | 0.00 | % | |||||||||||||
| PHIL WOOD (255) | 2,453 | 0.00 | % | 2,453 | - | 0.00 | % | |||||||||||||
| PHILIP BLAKE & SUSAN BLAKE & ELIZABETH BLAKE & RYAN BLAKE | 645,732 | 0.03 | % | 127,287 | 518,445 | 0.02 | % | |||||||||||||
| PHILIP MOORE | 1,102 | 0.00 | % | 1,102 | - | 0.00 | % | |||||||||||||
| PHILIP ROSS SMITH | 2,838 | 0.00 | % | 2,838 | - | 0.00 | % | |||||||||||||
| PHILLIP A COLE | 950,000 | 0.04 | % | 142,500 | 807,500 | 0.04 | % | |||||||||||||
| PHILLIP HYAMS | 214 | 0.00 | % | 214 | - | 0.00 | % | |||||||||||||
| PHILLIP JOHN TENNI | 4,905 | 0.00 | % | 4,905 | - | 0.00 | % | |||||||||||||
| PHYLLIS JEAN BILSTON | 711,251 | 0.03 | % | 130,563 | 580,688 | 0.03 | % | |||||||||||||
| POPI ZOGRAFAKIS | 9,810 | 0.00 | % | 9,810 | - | 0.00 | % | |||||||||||||
| RACHAEL ANNE ISHERWOOD | 750 | 0.00 | % | 750 | - | 0.00 | % | |||||||||||||
| RACHAEL ANNE JAY | 985 | 0.00 | % | 985 | - | 0.00 | % | |||||||||||||
| RACHAEL JAY | 43 | 0.00 | % | 43 | - | 0.00 | % | |||||||||||||
| RACHEL JOYCE & CARLY JOYCE (256) | 835,035 | 0.04 | % | 136,752 | 698,283 | 0.03 | % | |||||||||||||
| RAELENE DEBRA HAMILTON | 408,175 | 0.02 | % | 115,409 | 292,766 | 0.01 | % | |||||||||||||
| RAJINDER SINGH | 875 | 0.00 | % | 875 | - | 0.00 | % | |||||||||||||
| RAMANI SAMINATHAN & JAYA RANI SUBRAMANIAN (257) | 8,986,710 | 0.42 | % | 639,336 | 8,347,374 | 0.39 | % | |||||||||||||
| RANDHIR VARMA & LEIGH VARMA (258) | 985,056 | 0.05 | % | 144,253 | 840,803 | 0.04 | % | |||||||||||||
| RAYMOND CRAWSHAW & BRENDA CRAWSHAW | 1,022,914 | 0.05 | % | 146,146 | 876,768 | 0.04 | % | |||||||||||||
| RAYMOND NEILSEN | 644,647 | 0.03 | % | 127,232 | 517,415 | 0.02 | % | |||||||||||||
| RAYNI NUGENT | 21,727 | 0.00 | % | 21,727 | - | 0.00 | % | |||||||||||||
| RAYNI NUGENT | 6,923 | 0.00 | % | 6,923 | - | 0.00 | % | |||||||||||||
| REBECCA CAVANAGH | 6,377 | 0.00 | % | 6,377 | - | 0.00 | % | |||||||||||||
| REBECCA LOUISE STEPHAN | 428,244 | 0.02 | % | 116,412 | 311,832 | 0.01 | % | |||||||||||||
| REGINALD FREDERICK POULIER | 456 | 0.00 | % | 456 | - | 0.00 | % | |||||||||||||
| REID DRESCHER (259) | 1,400,000 | 0.06 | % | 165,000 | 1,235,000 | 0.06 | % | |||||||||||||
| REINHILD ERNA MCLEAN | 72 | 0.00 | % | 72 | - | 0.00 | % | |||||||||||||
| RENALDO GAIETY | 1,545 | 0.00 | % | 1,545 | - | 0.00 | % | |||||||||||||
| RENE KATE FULKO | 1,143 | 0.00 | % | 1,143 | - | 0.00 | % | |||||||||||||
| RETO JAMES DUNN (260) | 502,284 | 0.02 | % | 120,114 | 382,170 | 0.02 | % | |||||||||||||
| RHONDA ALLSOPP & NEIL ALLSOPP (261) | 833,934 | 0.04 | % | 136,697 | 697,237 | 0.03 | % | |||||||||||||
| RICHARD ANTHONY GILI | 1,750 | 0.00 | % | 1,750 | - | 0.00 | % | |||||||||||||
| RICHARD ARTHUR POWELL | 75,247 | 0.00 | % | 75,247 | - | 0.00 | % | |||||||||||||
| 48 |
| Name of Beneficial Owner | No. of Shares Owned Prior to Offering | Percent of Shares Beneficially Owned Prior to Offering | No. of Shares Being Offered | No. of Shares Beneficially Owned After Offering | Percent of Shares Beneficially Owned After Offering | |||||||||||||||
| RICHARD ARTHUR POWELL & JANICE DAWN POWELL | 8,873 | 0.00 | % | 8,873 | - | 0.00 | % | |||||||||||||
| RICHARD FRIAR & ALLISON FRIAR | 2,453 | 0.00 | % | 2,453 | - | 0.00 | % | |||||||||||||
| RICHARD HOWE & CHRIS SERTIC | 1,019,159 | 0.05 | % | 145,958 | 873,201 | 0.04 | % | |||||||||||||
| RICHARD PETER MALONEY | 27,172 | 0.00 | % | 27,172 | - | 0.00 | % | |||||||||||||
| RICK OLARENSHAW (262) | 75,334 | 0.00 | % | 75,334 | - | 0.00 | % | |||||||||||||
| RITA TACCONE & DOMENICO TACCONE | 1,055,960 | 0.05 | % | 147,798 | 908,162 | 0.04 | % | |||||||||||||
| ROB MCFARLAND | 29 | 0.00 | % | 29 | - | 0.00 | % | |||||||||||||
| ROB VERKAIK & ELIZABETH VERKAIK (263) | 8,175 | 0.00 | % | 8,175 | - | 0.00 | % | |||||||||||||
| ROBERT AND REA BLISS (264) | 15,911,324 | 0.74 | % | 1,175,566 | 14,735,758 | 0. 68 | % | |||||||||||||
| ROBERT BURNS & JULIE BURNS | 18,086 | 0.00 | % | 18,086 | - | 0.00 | % | |||||||||||||
| ROBERT CHARLES WALTERS & MARY ANN WALTERS | 879,323 | 0.04 | % | 138,966 | 740,357 | 0.03 | % | |||||||||||||
| ROBERT COSTIGAN & ROSALIE COSTIGAN | 43 | 0.00 | % | 43 | - | 0.00 | % | |||||||||||||
| ROBERT FREDERICK GARTON (265) | 2,876 | 0.00 | % | 2,876 | - | 0.00 | % | |||||||||||||
| ROBERT GEORGE PRENDERGAST & MAREE ANN PRENDERGAST (266) | 38,363,520 | 1.78 | % | 2,108,176 | 36,350,344 | 1.68 | % | |||||||||||||
| ROBERT GEORGE SUGGETT | 14,589 | 0.00 | % | 14,589 | - | 0.00 | % | |||||||||||||
| ROBERT GRANT FRASER & SHERIDAN LEE HONEY (267) | 2,100 | 0.00 | % | 2,100 | - | 0.00 | % | |||||||||||||
| ROBERT JOHN SALVAIR | 600 | 0.00 | % | 600 | - | 0.00 | % | |||||||||||||
| ROBERT JOHN WEBBER & KATHERINE WEBBER (268) | 7,325 | 0.00 | % | 7,325 | - | 0.00 | % | |||||||||||||
| ROBERT KEITH LYONS | 43 | 0.00 | % | 43 | - | 0.00 | % | |||||||||||||
| ROBERT MALCOM WILKIE | 402,800 | 0.02 | % | 115,140 | 287,660 | 0.01 | % | |||||||||||||
| ROBERT MALCOM WILKIE & LINDA ELIZABETH WILKIE (269) | 7,775,528 | 0.36 | % | 673,776 | 7,101,752 | 0.3 3 | % | |||||||||||||
| ROBERT PAIGE | 43 | 0.00 | % | 43 | - | 0.00 | % | |||||||||||||
| ROBERT PRUYN | 2,174,030 | 0.10 | % | 203,702 | 1,970,329 | 0.09 | % | |||||||||||||
| ROBERT PRUYN & MEREDITH PRUYN (270) | 1,535,825 | 0.07 | % | 171,791 | 1,364,034 | 0.06 | % | |||||||||||||
| ROBERT VAN BLANKEN & LYNDA GAY VAN BLANKEN | 33,964 | 0.00 | % | 33,964 | - | 0.00 | % | |||||||||||||
| ROBERT WETTENHALL MCFARLAND & ERROLLY GLEN MCFARLAND | 302 | 0.00 | % | 302 | - | 0.00 | % | |||||||||||||
| ROBERT WILKIE & LINDA WILKIE (271) | 73,572 | 0.00 | % | 73,572 | - | 0.00 | % | |||||||||||||
| ROBIN ROSS & MARY ROSS | 96 | 0.00 | % | 96 | - | 0.00 | % | |||||||||||||
| ROBIN ROSS & NICOLE ROSS | 66 | 0.00 | % | 66 | - | 0.00 | % | |||||||||||||
| ROBYN JAYNE LOFTS | 793 | 0.00 | % | 793 | - | 0.00 | % | |||||||||||||
| ROBYN JAYNE WEST | 1,226 | 0.00 | % | 1,226 | - | 0.00 | % | |||||||||||||
| ROBYN JAYNE WEST | 14,650 | 0.00 | % | 14,650 | - | 0.00 | % | |||||||||||||
| ROBYN LYNETTE HARRIS & HOWARD JOHN GATELEY | 1,239 | 0.00 | % | 1,239 | - | 0.00 | % | |||||||||||||
| ROBYN QUICK | 1,871,994 | 0.09 | % | 188,600 | 1,683,394 | 0.08 | % | |||||||||||||
| ROCKY MARTIN (272) | 2,398 | 0.00 | % | 2,398 | - | 0.00 | % | |||||||||||||
| RODERICK IAN DONALD & SANDRA ELIZABETH DONALD | 5,938 | 0.00 | % | 5,938 | - | 0.00 | % | |||||||||||||
| RODERICK IAN DONALD & SANDRA ELIZABETH DONALD | 443,949 | 0.02 | % | 117,197 | 326,752 | 0.02 | % | |||||||||||||
| RODNEY MALCOLM BLACK | 400,043 | 0.02 | % | 115,002 | 285,041 | 0.01 | % | |||||||||||||
| RODNEY WAYNE FAGG & JULIE LEAH FAGG (273) | 21,344 | 0.00 | % | 21,344 | - | 0.00 | % | |||||||||||||
| ROGER S FOXTON & JENNIFER S FOXTON | 532 | 0.00 | % | 532 | - | 0.00 | % | |||||||||||||
| ROGER THOMAS GOLDING | 401,890 | 0.02 | % | 115,095 | 286,796 | 0.01 | % | |||||||||||||
| RON ANTHONY | 42 | 0.00 | % | 42 | - | 0.00 | % | |||||||||||||
| RON WILLIAMS & CAROL WILLIAMS | 1,952 | 0.00 | % | 1,952 | - | 0.00 | % | |||||||||||||
| RON WILLIAMS & CAROL WILLIAMS | 14,650 | 0.00 | % | 14,650 | - | 0.00 | % | |||||||||||||
| RONA KAY DOUGLAS | 5,016 | 0.00 | % | 5,016 | - | 0.00 | % | |||||||||||||
| RONALD D KEECH & KATHRYN KEECH | 15,652 | 0.00 | % | 15,652 | - | 0.00 | % | |||||||||||||
| RONALD DAVID WILLIAMS & CAROL ANN WILLIAMS | 261 | 0.00 | % | 261 | - | 0.00 | % | |||||||||||||
| RONALD LEENDERT VANDERWAAL & HEATHER JOY VANDERWAAL | 3,563,645 | 0.17 | % | 273,182 | 3,290,463 | 0.15 | % | |||||||||||||
| RONALD NICHOLSON | 6,250 | 0.00 | % | 6,250 | - | 0.00 | % | |||||||||||||
| RONALD PETER KUCHARSKI (274) | 5,753,241 | 0.27 | % | 591,301 | 5,161,940 | 0.2 4 | % | |||||||||||||
| 49 |
| Name of Beneficial Owner | No. of Shares Owned Prior to Offering | Percent of Shares Beneficially Owned Prior to Offering | No. of Shares Being Offered | No. of Shares Beneficially Owned After Offering | Percent of Shares Beneficially Owned After Offering | |||||||||||||||
| RONALD VANDERWAAL & HEATHER JOY VANDERWAAL | 1,772,764 | 0.08 | % | 183,638 | 1,589,126 | 0.07 | % | |||||||||||||
| RONISE BARR | 10,872 | 0.00 | % | 10,872 | - | 0.00 | % | |||||||||||||
| ROS SHAW | 1,572 | 0.00 | % | 1,572 | - | 0.00 | % | |||||||||||||
| ROS SHAW | 7,325 | 0.00 | % | 7,325 | - | 0.00 | % | |||||||||||||
| ROSEMARY DAWN CHALKLEN | 760 | 0.00 | % | 760 | - | 0.00 | % | |||||||||||||
| ROSEMARY ETHEL WYNNE | 3,299 | 0.00 | % | 3,299 | - | 0.00 | % | |||||||||||||
| ROSEMARY ETHEL WYNNE | 73,248 | 0.00 | % | 73,248 | - | 0.00 | % | |||||||||||||
| ROSEMARY STONE | 4,570 | 0.00 | % | 4,570 | - | 0.00 | % | |||||||||||||
| ROSS ARDITA & MARIA ARDITA | 103,336 | 0.00 | % | 100,167 | 3,169 | 0.00 | % | |||||||||||||
| ROSS BAUER & CAROLYN BAUER (275) | 65,977 | 0.00 | % | 65,977 | - | 0.00 | % | |||||||||||||
| ROSS GRANTLY RAMSEY & NITA DAWN RAMSEY | 7,008 | 0.00 | % | 7,008 | - | 0.00 | % | |||||||||||||
| ROSS LEONARD SOLOMON | 617,540 | 0.03 | % | 125,877 | 491,663 | 0.02 | % | |||||||||||||
| ROSS NOEL ULLMAN & SUZANNE ULLMAN (276) | 6,096,188 | 0.28 | % | 399,809 | 5,696,379 | 0.26 | % | |||||||||||||
| ROSS WILLIAM WARNER | 600 | 0.00 | % | 600 | - | 0.00 | % | |||||||||||||
| ROWAN DON MARSHALL & LEIGHTON ANGUS MARSHALL & OLIVER JAMES MARSHALL | 1,143 | 0.00 | % | 1,143 | - | 0.00 | % | |||||||||||||
| ROWAN FOX | 3,663,691 | 0.17 | % | 278,185 | 3,385,506 | 0.16 | % | |||||||||||||
| ROWAN WILLIAMS | 32,180 | 0.00 | % | 32,180 | - | 0.00 | % | |||||||||||||
| ROY SPAGNOLO & XAVIER LO | 25,908 | 0.00 | % | 25,908 | - | 0.00 | % | |||||||||||||
| RUSSEL VAN ROOYEN & STARLINE VAN ROOYEN (277) | 23,853 | 0.00 | % | 23,853 | - | 0.00 | % | |||||||||||||
| RUSSELL C DUNKIN | 2,969 | 0.00 | % | 2,969 | - | 0.00 | % | |||||||||||||
| RUSSELL CRAIG DUNKIN | 61 | 0.00 | % | 61 | - | 0.00 | % | |||||||||||||
| RUSSELL FRANCEIS WOODROW | 63,095 | 0.00 | % | 63,095 | - | 0.00 | % | |||||||||||||
| RUSSELL FRANCEIS WOODROW & HELEN ELSIE WOODROW (278) | 3,035,840 | 0.14 | % | 246,792 | 2,789,048 | 0.13 | % | |||||||||||||
| RUSSELL JOHN WILKIE | 400,832 | 0.02 | % | 115,042 | 285,790 | 0.01 | % | |||||||||||||
| RUSSELL JOHN WILKIE & ROBYN LOUISA WILKIE (279) | 1,522,320 | 0.07 | % | 171,116 | 1,351,204 | 0.06 | % | |||||||||||||
| RUSSELL SHANE HERITAGE (280) | 16,668 | 0.00 | % | 16,668 | - | 0.00 | % | |||||||||||||
| RUSSELL WOODROW | 15,674 | 0.00 | % | 15,674 | - | 0.00 | % | |||||||||||||
| RUTH LILLIAS WISE | 2,329 | 0.00 | % | 2,329 | - | 0.00 | % | |||||||||||||
| RYAN PAUL KRIKKE | 32,821 | 0.00 | % | 32,821 | - | 0.00 | % | |||||||||||||
| SALLY RILLSTONE & DOMINIC RILLSTONE | 33,000 | 0.00 | % | 33,000 | - | 0.00 | % | |||||||||||||
| SALLYANNE FLORENCE & GINA LOUISE FLORENCE | 98,096 | 0.00 | % | 98,096 | - | 0.00 | % | |||||||||||||
| SAMANTHA ANN STEWART | 100,000 | 0.00 | % | 100,000 | - | 0.00 | % | |||||||||||||
| SAMEER PRASAD | 1,402,940 | 0.07 | % | 165,147 | 1,237,793 | 0.06 | % | |||||||||||||
| SAMMAR HANNA SOUSOU | 1,425 | 0.00 | % | 1,425 | - | 0.00 | % | |||||||||||||
| SAMMAR HANNA SOUSOU | 51,250 | 0.00 | % | 51,250 | - | 0.00 | % | |||||||||||||
| SAMUEL ROBERT WILLIAMS | 1,027 | 0.00 | % | 1,027 | - | 0.00 | % | |||||||||||||
| SANDRA FAY LOCK | 93,932 | 0.00 | % | 93,932 | - | 0.00 | % | |||||||||||||
| SANDRA FAY LOCK | 1,165,980 | 0.05 | % | 153,299 | 1,012,681 | 0.05 | % | |||||||||||||
| SANTINO ANTHONY MASTROENI | 11,460,788 | 0.53 | % | 668,039 | 10,792,749 | 0.50 | % | |||||||||||||
| SARAH FRANCES OAKES | 436,792 | 0.02 | % | 116,840 | 319,952 | 0.01 | % | |||||||||||||
| SARAH KATE HARRIS | 6,540 | 0.00 | % | 6,540 | - | 0.00 | % | |||||||||||||
| SARAH LEANNE O'DWYER | 500 | 0.00 | % | 500 | - | 0.00 | % | |||||||||||||
| SAVERINO SALEMI & WANDA SALEMI | 16,797 | 0.00 | % | 16,797 | - | 0.00 | % | |||||||||||||
| SCOTT GANT & LESLIE GANT (281) | 50,888,848 | 2.36 | % | 2,734,442 | 48,154,406 | 2.2 3 | % | |||||||||||||
| SCOTT HORNBY | 90,852 | 0.00 | % | 90,852 | - | 0.00 | % | |||||||||||||
| SCOTT PRENDERGAST | 434,200 | 0.02 | % | 116,710 | 317,490 | 0.01 | % | |||||||||||||
| SCOTT RUSSELL SPLADE & CAROL GAE SPLADE | 3,754,677 | 0.17 | % | 282,734 | 3,471,943 | 0.16 | % | |||||||||||||
| SEAMUS MARTIN (282) | 3,969,276 | 0.18 | % | 293,464 | 3,675,812 | 0.17 | % | |||||||||||||
| SEAN CHRISTOPHER DAVID NUGARA & MICHELLE MARIA NUGARA (283) | 1,380,747 | 0.06 | % | 164,814 | 1,215,933 | 0.06 | % | |||||||||||||
| SEAN JAGO | 1,500 | 0.00 | % | 1,500 | - | 0.00 | % | |||||||||||||
| 50 |
| Name of Beneficial Owner | No. of Shares Owned Prior to Offering | Percent of Shares Beneficially Owned Prior to Offering | No. of Shares Being Offered | No. of Shares Beneficially Owned After Offering | Percent of Shares Beneficially Owned After Offering | |||||||||||||||
| SEAN MATTHEW DOHENY | 28,028 | 0.00 | % | 28,028 | - | 0.00 | % | |||||||||||||
| SEAN MATTHEW MCNAMARA | 120 | 0.00 | % | 120 | - | 0.00 | % | |||||||||||||
| SEAN MERVYN WARD & CARLY JANE WARD | 8,276 | 0.00 | % | 8,276 | - | 0.00 | % | |||||||||||||
| SEEMA KINGER & SANJAY KINGER | 4,088 | 0.00 | % | 4,088 | - | 0.00 | % | |||||||||||||
| SERGIO FORZA (284) | 1,011,496 | 0.05 | % | 145,575 | 865,921 | 0.04 | % | |||||||||||||
| SERGIO FORZA | 1,535,177 | 0.07 | % | 171,759 | 1,363,418 | 0.06 | % | |||||||||||||
| SHANE ANDREWS | 904 | 0.00 | % | 904 | - | 0.00 | % | |||||||||||||
| SHANNON HANDLEY | 44 | 0.00 | % | 44 | - | 0.00 | % | |||||||||||||
| SHANULISA PRASAD | 404,628 | 0.02 | % | 115,231 | 289,397 | 0.01 | % | |||||||||||||
| SHARNAH THOMPSON (285) | 208,454 | 0.01 | % | 141,614 | 66,840 | 0.00 | % | |||||||||||||
| SHARON DELMENICO & WESLEY DELMENICO | 362 | 0.00 | % | 362 | - | 0.00 | % | |||||||||||||
| SHARON MAREE GATTY | 617,402 | 0.03 | % | 125,870 | 491,532 | 0.02 | % | |||||||||||||
| SHARON MORTLAND | 23,689 | 0.00 | % | 23,689 | - | 0.00 | % | |||||||||||||
| SHARYN D'ARCY | 1,653 | 0.00 | % | 1,653 | - | 0.00 | % | |||||||||||||
| SHEELAGM YOUNG (286) | 1,870,134 | 0.09 | % | 283,507 | 1,586,627 | 0.0 7 | % | |||||||||||||
| SHEHARA WIJETUNGA | 169,933 | 0.01 | % | 103,497 | 66,436 | 0.00 | % | |||||||||||||
| SHELLEY MARIE FOX | 1,438,188 | 0.07 | % | 166,909 | 1,271,279 | 0.06 | % | |||||||||||||
| SHERYLE SHERIDAN (287) | 199,048 | 0.01 | % | 104,952 | 94,096 | 0.00 | % | |||||||||||||
| SIMON DUPRE | 1,300 | 0.00 | % | 1,300 | - | 0.00 | % | |||||||||||||
| SIMON DUPRE | 149 | 0.00 | % | 149 | - | 0.00 | % | |||||||||||||
| SIMON DUPRE | 74 | 0.00 | % | 74 | - | 0.00 | % | |||||||||||||
| SIMON GORDON MANNING | 6,227 | 0.00 | % | 6,227 | - | 0.00 | % | |||||||||||||
| SIMON GORDON MANNING & BELINDA ROTH MANNING (288) | 1,359 | 0.00 | % | 1,359 | - | 0.00 | % | |||||||||||||
| SIMON JAMES CLOVER | 1,000 | 0.00 | % | 1,000 | - | 0.00 | % | |||||||||||||
| SIMON QUIRK & DEBORAH QUIRK | 430 | 0.00 | % | 430 | - | 0.00 | % | |||||||||||||
| SIMON SHEPPARD | 1,112 | 0.00 | % | 1,112 | - | 0.00 | % | |||||||||||||
| SIMONE HELENE RHODES CONCHA | 13,995 | 0.00 | % | 13,995 | - | 0.00 | % | |||||||||||||
| SKYE ERIN PARKER | 32,044 | 0.00 | % | 32,044 | - | 0.00 | % | |||||||||||||
| SKYE ERIN PARKER | 51,541 | 0.00 | % | 51,541 | - | 0.00 | % | |||||||||||||
| SOF ANDRIKOPOULOS | 14,715 | 0.00 | % | 14,715 | - | 0.00 | % | |||||||||||||
| SOFIANOS ANDRIKOPOULOS & YIOTA ANDRIKOPOULOS | 4,905 | 0.00 | % | 4,905 | - | 0.00 | % | |||||||||||||
| SONYA PARER (289) | 37,993 | 0.00 | % | 37,993 | - | 0.00 | % | |||||||||||||
| SOTIRIA BELTON | 12,262 | 0.00 | % | 12,262 | - | 0.00 | % | |||||||||||||
| SRIKANTHI MARIE WIJETUNGA | 1,163 | 0.00 | % | 1,163 | - | 0.00 | % | |||||||||||||
| SRIKANTHI MARIE WIJETUNGA | 15,000 | 0.00 | % | 15,000 | - | 0.00 | % | |||||||||||||
| STACY EVERINGHAM | 15,489 | 0.00 | % | 15,489 | - | 0.00 | % | |||||||||||||
| STANISLAUS ANTHONY CARROLL (290) | 4,979 | 0.00 | % | 4,979 | - | 0.00 | % | |||||||||||||
| STEPHEN BURNS & ROSALIND BURNS (291) | 1,337,947 | 0.06 | % | 351,897 | 986,050 | 0.05 | % | |||||||||||||
| STEPHEN GRABOWSKI | 164 | 0.00 | % | 164 | - | 0.00 | % | |||||||||||||
| STEPHEN JOHN COCKS | 200 | 0.00 | % | 200 | - | 0.00 | % | |||||||||||||
| STEPHEN JOHN DUFFY & ALEXANDRA MARY DUFFY | 125 | 0.00 | % | 125 | - | 0.00 | % | |||||||||||||
| STEPHEN JOHN MOFFATT | 93 | 0.00 | % | 93 | - | 0.00 | % | |||||||||||||
| STEPHEN JONES | 300,000 | 0.01 | % | 110,000 | 190,000 | 0.01 | % | |||||||||||||
| STEPHEN MOFFATT | 21,974 | 0.00 | % | 21,974 | - | 0.00 | % | |||||||||||||
| STEPHEN O'LOUGHLIN | 104 | 0.00 | % | 104 | - | 0.00 | % | |||||||||||||
| STEPHEN PATTERSON & CHERYL PATTERSON (292) | 1,415,000 | 0.07 | % | 165,750 | 1,249,250 | 0.06 | % | |||||||||||||
| STEPHEN ROBERT BIDELEUX | 1,000,291 | 0.05 | % | 145,015 | 855,276 | 0.04 | % | |||||||||||||
| STEPHEN ROSS | 66 | 0.00 | % | 66 | - | 0.00 | % | |||||||||||||
| STEVE ZISSOPOULOS | 43 | 0.00 | % | 43 | - | 0.00 | % | |||||||||||||
| STEVEN MARK KEECH | 1,270 | 0.00 | % | 1,270 | - | 0.00 | % | |||||||||||||
| 51 |
| Name of Beneficial Owner | No. of Shares Owned Prior to Offering | Percent of Shares Beneficially Owned Prior to Offering | No. of Shares Being Offered | No. of Shares Beneficially Owned After Offering | Percent of Shares Beneficially Owned After Offering | |||||||||||||||
| STEVEN VUKOVIC | 2,500 | 0.00 | % | 2,500 | - | 0.00 | % | |||||||||||||
| STEVEN WAYNE SMITH & LEANNE KAY SMITH (293) | 5,021 | 0.00 | % | 5,021 | - | 0.00 | % | |||||||||||||
| STEWART CRAIG DOBRZYNSKI & FIONA JOANNE DOBRZYNSKI (294) | 1,407,848 | 0.07 | % | 165,392 | 1,242,456 | 0.06 | % | |||||||||||||
| STEWART PALMER | 3,677 | 0.00 | % | 3,677 | - | 0.00 | % | |||||||||||||
| STUART DENMAN & NATASA DENMAN | 9,810 | 0.00 | % | 9,810 | - | 0.00 | % | |||||||||||||
| SUE NAYLOR | 1,157 | 0.00 | % | 1,157 | - | 0.00 | % | |||||||||||||
| SUI MING LEUNG | 31 | 0.00 | % | 31 | - | 0.00 | % | |||||||||||||
| SUSAN MARJORIE MONGELLI (295) | 206,000 | 0.01 | % | 105,300 | 100,700 | 0.00 | % | |||||||||||||
| SUSAN MONGELLI & PETER WATERS (296) | 104,227 | 0.00 | % | 100,211 | 4,016 | 0.00 | % | |||||||||||||
| SUSANA LAI CHU LAU | 1,090 | 0.00 | % | 1,090 | - | 0.00 | % | |||||||||||||
| SUSANA LAU | 13,185 | 0.00 | % | 13,185 | - | 0.00 | % | |||||||||||||
| SUZANNE MURPHY | 843,145 | 0.04 | % | 137,157 | 705,988 | 0.03 | % | |||||||||||||
| TAIER BAGE | 55 | 0.00 | % | 55 | - | 0.00 | % | |||||||||||||
| TANIA MAREE HANN | 149 | 0.00 | % | 149 | - | 0.00 | % | |||||||||||||
| TANYA TZIKAS | 7,358 | 0.00 | % | 7,358 | - | 0.00 | % | |||||||||||||
| TARA LEANNE & PAUL JOSEPH VAN WINCKEL | 400,000 | 0.02 | % | 115,000 | 285,000 | 0.01 | % | |||||||||||||
| TERENCE & SHARON GARROLL (297) | 486,667 | 0.02 | % | 119,333 | 367,334 | 0.02 | % | |||||||||||||
| TERRY & JULIE THOMAS HARRINGTON | 1,509,871 | 0.07 | % | 170,494 | 1,339,377 | 0.06 | % | |||||||||||||
| TERRY ALEXIADIS | 100,000 | 0.00 | % | 100,000 | - | 0.00 | % | |||||||||||||
| TERRY ALEXIADIS | 1,133 | 0.00 | % | 1,133 | - | 0.00 | % | |||||||||||||
| TERRY ANN ROTH | 2,193,760 | 0.10 | % | 204,688 | 1,989,072 | 0.09 | % | |||||||||||||
| TERRY ANN ROTH & ADAM DANIEL BOWLING (298) | 1,666,668 | 0.08 | % | 178,333 | 1,488,335 | 0.07 | % | |||||||||||||
| TERRY HARRINGTON & JULIE THOMAS | 405,933 | 0.02 | % | 115,297 | 290,636 | 0.01 | % | |||||||||||||
| TERRY JAMES GARDINER | 51,477 | 0.00 | % | 51,477 | - | 0.00 | % | |||||||||||||
| TERRY JAMES HARRINGTON | 401,200 | 0.02 | % | 115,060 | 286,140 | 0.01 | % | |||||||||||||
| TERRY JAMES HARRINGTON & JULIE DIANE THOMAS | 401,500 | 0.02 | % | 115,075 | 286,425 | 0.01 | % | |||||||||||||
| THARANGA KUMARA PATHIRANAGE | 1,478 | 0.00 | % | 1,478 | - | 0.00 | % | |||||||||||||
| THEMISTOCLES VANIERIS | 5,860 | 0.00 | % | 5,860 | - | 0.00 | % | |||||||||||||
| THEMISTOCLES VANIERIS & DICK THEO QUALLY | 43 | 0.00 | % | 43 | - | 0.00 | % | |||||||||||||
| THERESA IBBOTT | 1,061,310 | 0.05 | % | 148,066 | 913,245 | 0.04 | % | |||||||||||||
| THOMAS ALEXANDER MCLEAN | 72 | 0.00 | % | 72 | - | 0.00 | % | |||||||||||||
| THOMAS ASHCROFT & JULIA PATRICIA ASHCROFT (299) | 403,856 | 0.02 | % | 187,811 | 216,045 | 0.01 | % | |||||||||||||
| THOMAS ERNEST HORGAN | 746,822 | 0.03 | % | 132,341 | 614,481 | 0.03 | % | |||||||||||||
| THOMAS ERNEST HORGAN & ANNE THERESE HORGAN (300) | 735,786 | 0.03 | % | 131,789 | 603,997 | 0.03 | % | |||||||||||||
| THOMAS HILLARDT | 28,164 | 0.00 | % | 28,164 | - | 0.00 | % | |||||||||||||
| TIM SMITH (301) | 2,142,408 | 0.10 | % | 202,120 | 1,940,288 | 0.09 | % | |||||||||||||
| TIMOTHY JAMES JARVIS & GERARDINE ANNE WALSH | 2,405,502 | 0.11 | % | 215,275 | 2,190,227 | 0.10 | % | |||||||||||||
| TIMOTHY JOHN OLIVER (302) | 3,578,682 | 0.17 | % | 368,934 | 3,209,748 | 0.15 | % | |||||||||||||
| TIMOTHY PETER FARLEY & MARY KATHLEEN FARLEY (303) | 4,000,000 | 0.19 | % | 295,000 | 3,705,000 | 0.17 | % | |||||||||||||
| TIMOTHY RAMSEY & JODIE RAMSEY | 3,951 | 0.00 | % | 3,951 | - | 0.00 | % | |||||||||||||
| TIMOTHY ROSS CROOKS | 554,497 | 0.03 | % | 122,725 | 431,772 | 0.02 | % | |||||||||||||
| TIMOTHY ROSS FLOWERS & MONIQUE LYNETTE FLOWERS (304) | 1,500,000 | 0.07 | % | 170,000 | 1,330,000 | 0.06 | % | |||||||||||||
| TIMOTHY WALTER LENNON & NICOLE ANNE LENNON | 1,269 | 0.00 | % | 1,269 | - | 0.00 | % | |||||||||||||
| TIN SHEUNG LAU | 65,500 | 0.00 | % | 65,500 | - | 0.00 | % | |||||||||||||
| TINA DION (305) | 203,679 | 0.01 | % | 105,184 | 98,495 | 0.00 | % | |||||||||||||
| TINA MARIA MATANIC | 5,621 | 0.00 | % | 5,621 | - | 0.00 | % | |||||||||||||
| TODD DARREN BOYCE | 704 | 0.00 | % | 704 | - | 0.00 | % | |||||||||||||
| TODD DARREN BOYCE | 6,027 | 0.00 | % | 6,027 | - | 0.00 | % | |||||||||||||
| TODD FAIRBURN | 54 | 0.00 | % | 54 | - | 0.00 | % | |||||||||||||
| TODD SESSIONS | 568,164 | 0.03 | % | 123,408 | 444,756 | 0.02 | % | |||||||||||||
| 52 |
| Name of Beneficial Owner | No. of Shares Owned Prior to Offering | Percent of Shares Beneficially Owned Prior to Offering | No. of Shares Being Offered | No. of Shares Beneficially Owned After Offering | Percent of Shares Beneficially Owned After Offering | |||||||||||||||
| TONI KILGOUR & KARLENE KILGOUR & DANIELLE KILGOUR | 2,495 | 0.00 | % | 2,495 | - | 0.00 | % | |||||||||||||
| TONI MAE CAPUTO | 202 | 0.00 | % | 202 | - | 0.00 | % | |||||||||||||
| TONY HAVIG (306) | 2,979,148 | 0.14 | % | 338,957 | 2,640,191 | 0.1 2 | % | |||||||||||||
| TRACEY ANN REILLY | 9,810 | 0.00 | % | 9,810 | - | 0.00 | % | |||||||||||||
| TRAVIS DALE HUDSON | 246 | 0.00 | % | 246 | - | 0.00 | % | |||||||||||||
| TREVOR SCHOENMACHER & LISA STIVLEY & BRETT HANSEN (307) | 246,017 | 0.01 | % | 107,301 | 138,716 | 0.01 | % | |||||||||||||
| TREVOR STEPHEN CLOVER & CAROLE ELIZABETH CLOVER | 8,478 | 0.00 | % | 8,478 | - | 0.00 | % | |||||||||||||
| TRILAS MATESHA LEEMAN | 10,740 | 0.00 | % | 10,740 | - | 0.00 | % | |||||||||||||
| TRUDY PIA MARIA CROOKS | 554,497 | 0.03 | % | 122,725 | 431,772 | 0.02 | % | |||||||||||||
| VALLABHADAS PATEL | 61 | 0.00 | % | 61 | - | 0.00 | % | |||||||||||||
| VANESSA JOAN CARBIS | 26,072 | 0.00 | % | 26,072 | - | 0.00 | % | |||||||||||||
| VERA SMOLONOGOV | 405,518 | 0.02 | % | 115,276 | 290,242 | 0.01 | % | |||||||||||||
| VICKI BELL | 4,068,095 | 0.19 | % | 298,405 | 3,769,690 | 0.17 | % | |||||||||||||
| VICKI BELL & GRAHAM BELL (308) | 3,940,477 | 0.18 | % | 292,024 | 3,648,453 | 0.17 | % | |||||||||||||
| VICKI CHRISAFIS | 1,968 | 0.00 | % | 1,968 | - | 0.00 | % | |||||||||||||
| VICTORIA ALEXANDRA ROSE & GREGORY JOHN ROSE (309) | 49,048 | 0.00 | % | 49,048 | - | 0.00 | % | |||||||||||||
| VICTORIA JANE STANFORD & DAVID STANFORD (310) | 2,134 | 0.00 | % | 2,134 | - | 0.00 | % | |||||||||||||
| VINCE BARTOLILLO | 75 | 0.00 | % | 75 | - | 0.00 | % | |||||||||||||
| VINCE PAGANO & GAYLE PAGANO (311) | 61,566 | 0.00 | % | 61,566 | - | 0.00 | % | |||||||||||||
| VINCENT HUGH HORSBURGH (312) | 956,939 | 0.04 | % | 237,847 | 719,092 | 0.0 3 | % | |||||||||||||
| VINCENT JOHN CREAGH (313) | 2,464,950 | 0.11 | % | 218,248 | 2,246,703 | 0.10 | % | |||||||||||||
| VINCENT SAINATO | 2,100 | 0.00 | % | 2,100 | - | 0.00 | % | |||||||||||||
| VINCENT SCULLI & DORIS SCULLI | 379 | 0.00 | % | 379 | - | 0.00 | % | |||||||||||||
| VINCENZO PENNAZZA & DIANA PENNAZZA | 49,085 | 0.00 | % | 49,085 | - | 0.00 | % | |||||||||||||
| VIRGINIA DALZOTTO | 51,506 | 0.00 | % | 51,506 | - | 0.00 | % | |||||||||||||
| VIRGINIA DALZOTTO & GEORGE DALZOTTO | 4,298 | 0.00 | % | 4,298 | - | 0.00 | % | |||||||||||||
| VITO CHIARAVELLE & ANTIONIETTA CHIARAVELLE | 18,750 | 0.00 | % | 18,750 | - | 0.00 | % | |||||||||||||
| VITTORIO MONARCA & CATHERINE MONARCA (314) | 24,524 | 0.00 | % | 24,524 | - | 0.00 | % | |||||||||||||
| WALLY MUHIEDDINE | 3,969 | 0.00 | % | 3,969 | - | 0.00 | % | |||||||||||||
| WALTER VON OETTINGEN & BEVERLEY VON OETTINGEN | 43 | 0.00 | % | 43 | - | 0.00 | % | |||||||||||||
| WARREN LELAND HOHN & DONNA RAE HOHN (315) | 67,865 | 0.00 | % | 67,865 | - | 0.00 | % | |||||||||||||
| WARREN SIPSER (316) | 36,452 | 0.00 | % | 36,452 | - | 0.00 | % | |||||||||||||
| WARWICK CLARKE | 2,500 | 0.00 | % | 2,500 | - | 0.00 | % | |||||||||||||
| WAYNE CAREY | 1,961,912 | 0.09 | % | 193,096 | 1,768,816 | 0.08 | % | |||||||||||||
| WAYNE CONNELL & MICHELLE CONNELL | 555 | 0.00 | % | 555 | - | 0.00 | % | |||||||||||||
| WAYNE EDWARD WHITMORE & LISA WHITMORE | 14,650 | 0.00 | % | 14,650 | - | 0.00 | % | |||||||||||||
| WAYNE FRANCIS SYKES | 250,000 | 0.01 | % | 107,500 | 142,500 | 0.01 | % | |||||||||||||
| WAYNE GREGORY MCKELLAR & MARILYN THERESA MCKELLAR (317) | 3,032,669 | 0.14 | % | 246,633 | 2,786,036 | 0.13 | % | |||||||||||||
| WAYNE RICHARD BOSDEN & FIONA JOY BOSDEN | 110 | 0.00 | % | 110 | - | 0.00 | % | |||||||||||||
| WAYNE ROBERT BUDARICK & ANNETTE BUDARICK (318) | 7,088 | 0.00 | % | 7,088 | - | 0.00 | % | |||||||||||||
| WAYNE WHITMORE & LISA WHITMORE | 17,657 | 0.00 | % | 17,657 | - | 0.00 | % | |||||||||||||
| WAYNE WILLIAM LEWIS | 43 | 0.00 | % | 43 | - | 0.00 | % | |||||||||||||
| WAYNNE MCKELLAR | 765,052 | 0.04 | % | 133,253 | 631,799 | 0.03 | % | |||||||||||||
| WENDY KEOGH | 750 | 0.00 | % | 750 | - | 0.00 | % | |||||||||||||
| WILHELMINA HENDERINA PRUYN & DANIEL JOHN GARLICK | 31,534 | 0.00 | % | 31,534 | - | 0.00 | % | |||||||||||||
| WILLIAM BARRYMORE SMITH | 19,778 | 0.00 | % | 19,778 | - | 0.00 | % | |||||||||||||
| WILLIAM BERTRAM MCGRORY & SUSAN JOY MCGRORY (319) | 194,445 | 0.01 | % | 104,722 | 89,723 | 0.00 | % | |||||||||||||
| WILLIAM DANIEL GOLLOP | 5,860 | 0.00 | % | 5,860 | - | 0.00 | % | |||||||||||||
| WILLIAM ELIOU | 444,143 | 0.02 | % | 117,207 | 326,936 | 0.02 | % | |||||||||||||
| WILLIAM FRASER | 21,974 | 0.00 | % | 21,974 | - | 0.00 | % | |||||||||||||
| WILLIAM FRASER & YOLANTA FRASER (320) | 9,351 | 0.00 | % | 9,351 | - | 0.00 | % | |||||||||||||
| WILLIAM JACKSON & DAWN JACKSON | 3,578,621 | 0.17 | % | 273,931 | 3,304,690 | 0.15 | % | |||||||||||||
| WILLIAM JOHN VALLENCE | 1,037,370 | 0.05 | % | 146,869 | 890,502 | 0.04 | % | |||||||||||||
| WILLIAM JOHN VALLENCE | 406,931 | 0.02 | % | 115,347 | 291,584 | 0.01 | % | |||||||||||||
| WILLIAM LAZARO | 2,044 | 0.00 | % | 2,044 | - | 0.00 | % | |||||||||||||
| WILLIAM NICHOLAS FRASER & YOLANTA MARTA FRASER | 214 | 0.00 | % | 214 | - | 0.00 | % | |||||||||||||
| WILLIAM OSBORNE & NONGKARN OSBORNE | 36,786 | 0.00 | % | 36,786 | - | 0.00 | % | |||||||||||||
| WILLIAM PETER MAILE | 9,257,223 | 0.43 | % | 557,861 | 8,699,362 | 0.40 | % | |||||||||||||
| WILLIAM ROSS TAYLOR & HELEN LARINE TAYLOR (321) | 224,524 | 0.01 | % | 106,226 | 118,298 | 0.01 | % | |||||||||||||
| WOO JIE MING | 3,679 | 0.00 | % | 3,679 | - | 0.00 | % | |||||||||||||
| YVETTE CARROLL | 43 | 0.00 | % | 43 | - | 0.00 | % | |||||||||||||
| ZEENA LOBO | 24,524 | 0.00 | % | 24,524 | - | 0.00 | % | |||||||||||||
| ZORAN MATIC | 84,675 | 0.00 | % | 84,675 | - | 0.00 | % | |||||||||||||
| 53 |
| (1) | Of these shares, 10,168,302 shares are held by the selling stockholders as trustees for Gilmour Super Fund A/C. | |
| (2) | With respect to 7,309,345 shares, Mr. Hansen shares voting and investment power with his spouse, his daughter and his son. With respect to 3,255,600 shares, Mr. Hansen shares voting and investment power with Trevor Schoenmaker, Lisa Stivley and Brett Hansen. | |
| (3) | Of these shares, 121,199,412 shares are owned by POTB Pty Ltd as trustee for Muda Jake Trust, and 94,115,080 shares are owned by Super Keeper Pty Ltd as trustee for RestNPlay SMSF. The selling stockholders are beneficiaries of the Muda Jake Trust and RestNPlay SMSF. | |
| (4) | Of these shares, 123,119,848 shares are owned by Fenwick Corporation Pty Ltd (“Fenwick”). Fenwick is the trustee for Fenwick Investment A/C. The selling stockholder is the director of Fenwick and the beneficiary of Fenwick Investment A/C. 3,890,480 of these shares are owned by C T Super Pty Ltd. The selling stockholder is the director of C T Super Pty Ltd. 49266592 shares are held by Clem Tacca Pty Ltd as trustee for Clem Tacca Family A/C. The selling stockholder is the director of Clem Tacca Pty Ltd and the beneficiary of Clem Tacca Family A/C. | |
| (5) | Of these shares, 64,682,940 shares are held by Mortgage Brokers Pty Ltd as trustee for Frank Wilkie Super Fund A/C, and 46,715,220 shares are held by Asal Holdings. | |
| (6) | Of these shares, 377,356 are owned by Erstein Pty Limited as trustee for Hartland Super Fund A/C, 244,647 are owned by Erstein Pty Ltd as trustee for Hartland Super Fund and 133,976 are owned by Erstein Pty Ltd as trustee for the Hartland Family A/C. The selling stockholder is the director of Erstein Pty Limited and Erstein Pty Ltd. | |
| (7) | Of these shares, 2,987,856 shares are owned by Alan Lamb and Sandra Givens as trustee for the Glamourous Superannuation Fund. | |
| (8) | Of these shares, 1,250 shares are owned by Alan Thynne and Judith Thynne, trustees for the Thynne Family S/F A/C. | |
| (9) | Of these shares, 3,206,666 shares are owned by Sacco Developments Australia Pty Limited as trustee for the Sacco Family A/C. The selling stockholder is the director of Sacco Developments Australia Pty Limited. | |
| (10) | Of these shares, 1,485,834 shares are owned by Quantum One Pty Ltd as trustee for Crown Domain A/C. The selling stockholder is the director of Quantum One Pty Ltd. | |
| (11) | Of these shares, 150,000 are owned directly and 1,172,265 shares are owned by Mr. Royal Charles Rolley and Maree Elma Rolley as trustee for the Romaral Super Fund A/C. The selling stockholders are beneficiaries of Romaral Super Fund A/C. | |
| (12) | Of these shares, 1,417,004 shares are owned by 4 A & K Dyer Pty Ltd. The selling stockholder is the director of 4 A & K Dyer Pty Ltd. | |
| (13) | Of these shares, 28,836 shares are owned directly, and 73,572 are owned by Mrs. Leanne Asker and Mr. Andrew Asker as trustee for the Asker Family A/C. | |
| (14) | Of these shares, 816 shares are held directly. 1,227 shares are owned by AFHM Pty Ltd, as trustee of the Andrew Murray Superfund A/C. The selling stockholder is the director of AFHM Pty Ltd. 1,002,382 shares are owned by A F H M Pty Ltd. The selling stockholder is the director of A F H M Pty Ltd. 1,000,427 shares are held by AFHM Pty Ltd. | |
| (15) | Of these shares, 625 shares are held by Mr. Andrew Fudge and Mrs. Karen Fudge as trustees for the Fudge Family S/F A/C. | |
| (16) | Of these shares, 36975000 shares are held by A Maggiotto Nominees Pty Ltd, as trustee for Maggiotto Super Fund A/C. The selling stockholder is the beneficiary of the Maggiotto Super Fund A/C. | |
| (17) | Of these shares, 1,403,000 are held by AJAF Pty Ltd as trustee for the Field Family Trust. The selling stockholder is director of AJAF Pty Ltd. | |
| (18) | Of these shares, 126 shares are owned by Mrs. Anne Ruys as trustee for Naomi Nathan Simon Ruys A/C. | |
| (19) | Of these shares, 816 shares are held directly and 416,100 are held by Annette Budarick as trustee for the Budarick Family A/C. | |
| (20) | Of these shares, 53,250 shares are held by Mr. Anthony Houston as trustee for the Houston Super Fund A/C. | |
| (21) | Of these shares, 36,624 shares are held by Comserve Management Limited and 518,392 shares are held by Comserve Management Limited as trustee for Greenfield A/C. The selling stockholder is the director of Comserve Management Limited. | |
| (22) | Of these shares, 421,636 shares are held by Anthony and Abigail Kooy as trustees for the A&A Kooy Super Fund. | |
| (23) | Of these shares, 8,500 shares are held by Strange Technology Pty Limited. The selling stockholder is the director of Strange Technology Limited. | |
| (24) | Of these shares, 1,643,676 shares are held by Vanchem Pty Ltd, as trustee for Madeclaire Super Fund A/C. The selling stockholder is the director of Vanchem Pty Ltd. | |
| (25) | Of these shares, 227,815 shares are held directly and 328,950 are held by Piesse Investments Pty Ltd, as trustee for the Piesse Super Fund A/C. The selling stockholder is the director of Piesse Investments Pty Ltd. | |
| (26) | Of these shares, 3,591,844 shares are held by Northam Park Pty Ltd as trustee for the B & CA Hudson Super Fund A/C. The selling stockholder is the director of Northam Park Pty Ltd. | |
| (27) | Of these shares, 43,998,168 shares are held by Ossum Holdings Pty Ltd as trustee for the Tanton Super Fund A/C and 27,179,920 shares are held by Ossum Holdings Pty Ltd as trustee for the Tanton Family No. 2 A/C. The selling stockholder is the director of Ossum Holdings Pty Ltd. | |
| (28) | Of these shares, 13,217,024 shares are held by BJ & BL Gant Pty Ltd as trustee for Gant Super Fund A/C and 423,707 shares are held by BJ & BL Gant Pty Ltd as trustee for the Superannuation Fund A/C. The selling stockholder are the directors of BJ & BL Gant Pty Ltd. |
| 54 |
| (29) | Of these shares, 2,824,861 shares are held by Barry Oates and Alexandra Watts as trustees of the Oates Family S/F A/C, and 1,893,792 shares are held by Bookmark Editing & Publishing Services Pty Ltd as trustee of the Four Leaf Clover A/C. The selling stockholders are directors of Bookmark Editing & Publishing Services Pty Ltd. | |
| (30) | Of these shares, 3,290,704 shares are held by Mr. Barry Watson and Mrs. Janet Watson as trustees for the Watson Family S/F A/C. | |
| (31) | Of these shares, 1,461,032 shares are held by Blue Eagle Investments Pty Ltd as trustee for the Blue Eagle Super Fund A/C. The selling stockholders are the directors of Blue Eagle Investments Pty Ltd. | |
| (32) | Of these shares, 419,048 shares are held by Aviwed Pty Ltd and 1,312,128 shares are held by Aviwed Pty Ltd as trustee for the Mellers Family A/C. The selling stockholder is the director of Aviwed Pty Ltd. | |
| (33) | Of these shares, 3,008,227 shares are held by Mrs. Bonnie June Goodrich and Mrs. Marney Renee Jefferies as trustees for the Sea Change Super Fund A/C. | |
| (34) | Of these shares, 1,449,048 shares are held by the selling stockholder as trustee for the Prowse Family Investment A/C. | |
| (35) | Of these shares, 682,500 shares are held by Doynton Holdings Pty Ltd as trustee for The Think Big A/C. 88,931 shares are held by Hansens Amazing Team Pty Ltd as trustee for the Loans No. 3 A/C. The selling stockholder is the director of Doynton Holdings Pty Ltd and Hansens Amazing Team Pty Ltd. | |
| (36) | Of these shares, 856,509 shares are held by Mr. Brett Andrew Hansen and Mrs. Jennifer Louise Hansen as trustees for Greenpeas Super Fund A/C, and 175,536 shares are held by Greenpeas Investments Pty Ltd as trustees for The B & J Hansen Family A/C. The selling stockholders are the directors of Greenpeas Investments Pty Ltd. | |
| (37) | Of these shares, 2,540 shares are held directly by the selling stockholder, and 8,572 shares are held by Mr. Brett John Ward and Ms. Donna Marie Muller as trustees for the Ward Superannuation Fund A/C. | |
| (38) | Of these shares, 572,066 shares held by the selling stockholders as trustees for The BF & SK Garnett Family Trust. | |
| (39) | Of these shares, 51,875 shares are held by Mr. Brian Martin as trustee for the Brian Martin Super Fund A/C, and 94,802 shares are held by Brian Martin & Associates Pty Ltd as trustee for the Brian Martin Super Fund A/C. The selling stockholders are the directors of Brian Martin & Associates Pty Ltd. | |
| (40) | Of these shares, 4,126 shares are held by Bellerise Pty Limited as trustee for the Superannuation Fund A/C. The selling stockholders are directors of the Bellerise Pty Limited. | |
| (41) | Of these shares, 20,437 shares are held by Greenland Nominees Pty Ltd as trustee for the Bruce Greenland S/Fund A/C. The selling stockholder is the director of Greenland Nominees Pty Ltd. | |
| (42) | Of these shares, 2,000,000 shares are held by Jash Pty Ltd as trustee for the Bruce Hinckfuss Super Fund. The selling stockholder is the director of Jash Pty Ltd. | |
| (43) | Of these shares, 419,774 shares are held by First Equity Capital Pty Ltd as trustee for the First Equity Finance FND A/C. The selling stockholder is the director of First Equity Capital Pty Ltd. | |
| (44) | Of these shares, 2,310 shares are held by the selling stockholders as trustees for C &H Anthony Super Fund A/C. | |
| (45) | Of these shares, 98,096 shares are held by the selling stockholders as trustee for Relyon Trading S/F A/C. | |
| (46) | Of these shares, 920 shares are held by the selling stockholder as trustee for The Ruys Family A/C. | |
| (47) | Of these shares, 1,762 shares are held by the selling stockholder directly, and 2,453 shares are held by Mr. Christopher Mary Ruys and Mrs. Anne Veronica Ruys as trustees for the Ruys Family Super Fund A/C. | |
| (48) | Of these shares, 5,055 shares are held by Bristow Investments Pty Ltd as trustee for The Bristow Super Fund A/C. The selling stockholders are directors of Bristow Investments Pty Ltd. | |
| (49) | Of these shares, 20,000,000 shares are held by Tofino Trading Ltd. The selling stockholder is the director of Tofino Trading Ltd. | |
| (50) | Of these shares, 1,159,516 shares are held by the selling stockholders as trustees for The Crane Family S/F A/C. | |
| (51) | Of these shares, 9,052 shares are held by Symbiance Financial Services Pty Ltd. The selling stockholder is the director of Symbiance Financial Services Pty Ltd. |
| 55 |
| (52) | Of these shares, 3256184 shares are held directly, and 3059176 shares are held by the selling stockholder as trustee for the Cardub Super Fund. | |
| (53) | Of these shares, 1,401,876 shares are held by X C Lent Developments Pty Ltd, and 2,707,588 are held by the selling stockholders as trustees for the Kozicki Super Fund A/C. The selling stockholders the directors of X C Lent Developments Pty Ltd. | |
| (54) | Of these shares, 1,464,048 shares are held by C F Superfund Pty Ltd as trustee for the C F Super Fund A/C, and 1,457,223 shares are held by Plan B Investments Pty Ltd as trustee for PBI A/C. The selling stockholder is the director of C F Superfund Pty Ltd and Plan B Investments Pty Ltd. | |
| (55) | Of these shares, 481,846 shares are held by the selling stockholder as trustee for Synoptic Super Fund. | |
| (56) | Of these shares, 10,821,930 shares are held by Dansan (AUST) Pty Ltd as trustee for the Dansan Family A/C, and 1,792,384 are held by SGF Group Pty Ltd as trustee for SGF Planet A/C. The selling stockholder is the director of Dansan (AUST) Pty Ltd and SGF Group Pty Ltd. | |
| (57) | Of these shares, 6,304,366 shares are held by Optimal Equity Pty Ltd. The selling stockholders are the directors of Optimal Equity Pty Ltd. | |
| (58) | Of these shares, 19,620 shares are held by the selling stockholders as trustees for Les Bicounets A/C. | |
| (59) | Of these shares, 2,350,000 shares are held by Lynette Barnes as trustee for Wanawattha Springs Trust. The selling stockholders are beneficiaries of Wanawattha Springs Trust. | |
| (60) | Of these shares, 1,610,253 shares are held by Vaingirl Nominees Pty Ltd as trustee for Hector Henry Holdings A/C, and 1,402,862 shares are held by Vaingirl Nominees Pty Ltd as trustee for Sunday Trading A/C. The selling stockholder is director of Vaingirl Nominees Pty Ltd. | |
| (61) | Of these shares, 400,000 shares are held by the selling stockholder as trustee for DS Hutchinson Super A/C. | |
| (62) | Of these shares, 1,400,536 shares are held by Lock Enterprises Pty Ltd, and 3,578,196 shares are held by Lock Enterprises Pty Ltd as trustee for Darryl Lock Super Fund A/C. The selling stockholders are directors of Lock Enterprises Pty Ltd. | |
| (63) | Of these shares, 481 shares are held by DBH20 Consulting Pty Ltd as trustee for DBH 20 Consulting S/F A/C. The selling stockholder is director of DBH20 Consulting Pty Ltd. | |
| (64) | Of these shares, 15 shares are held by the selling stockholders directly, and 85,834 shares are held by the selling stockholders as trustees for Besson & Besson A/C. | |
| (65) | Of these shares, 611300 shares are held by the selling stockholders as trustees for Superfund A/C. | |
| (66) | Of these shares, 854,944 shares are held by the selling stockholder as trustee for the Ward Family Superannuation Fund A/C. | |
| (67) | Of these shares, 278,480 shares are held by Davco Constructions Pty Ltd. The selling stockholder is the director of the Davco Constructions Pty Ltd. | |
| (68) | Of these shares, 39,852 shares are held by Besson Family Retirement Fund Pty Ltd as trustee for Besson Family R/Fund A/C. The selling stockholder is the director of Besson Family Retirement Fund Pty Ltd. | |
| (69) | Of these shares, 1,694,288 shares are held by the selling stockholder as trustee for The Highvale Family A/C. | |
| (70) | Of these shares, 168,966 shares are held by White Eagle Nominees Pty Ltd as trustee for Mann Family Super Fund A/C. The selling stockholder is the beneficiary of the Mann Family Super Fund A/C. | |
| (71) | Of these shares, 27,892 shares are held by Danateth Pty Ltd as trustee for the Rowan Family A/C. The selling stockholder is the beneficiary of the Rowan Family A/C. | |
| (72) | Of these shares, 1,027,663 shares are held directly, 122 shares are held by Kosten Pty Ltd, and 107 shares are held by Davken Pty Ltd. The selling stockholder is the director of Kosten Pty Ltd and Davken Pty Ltd. | |
| (73) | Of these shares, 2,134 shares are held by David Stanford as trustee for Davic Holdings A/C. | |
| (74) | Of these shares, 543,366 shares are held by Kenobi Holdings Pty Ltd as trustee for Kenobi Super A/C, 417,604 shares are held by Kenobi Holdings Pty Ltd as trustee for The Caspero Unit A/C, 14,650 shares are held by the selling stockholder as trustee for Kenobi Super Fund, and 11,258 shares are held by Kenobi Holdings Pty Ltd as trustee for Kenobi Holdings A/C. The selling stockholder is director of Kenobi Holdings Pty Ltd. | |
| (75) | Of these shares, 2,875 shares are held by the selling stockholders as trustees for Jeffery Warren S/F A/C. | |
| (76) | Of these shares, 419,929 shares are held directly and 1,831,152 shares are held by Austallus Pty Ltd as trustee for Austallus Super Fund A/C. The selling stockholders are directors of Austallus Pty Ltd. | |
| (77) | Of these shares, 1,485,834 shares are held by the selling stockholders as trustees for O'Connor Williams S/F A/C. | |
| (78) | Of these shares, 514,137 shares are held by Durand Holdings Pty Ltd as trustee for Durand Investment A/C and 675 shares are held by Durand Holdings Pty Ltd. The selling stockholder is director of Durand Holdings Pty Ltd. |
| 56 |
| (79) | Of these shares, 3,073,846 shares are held by Augustwave Pty Ltd as trustee for Augustwave Super A/C. The selling stockholder is director of Augustwave Pty Ltd. | |
| (80) | Of these shares, 1,525,004 shares are held by Venoace Pty Ltd as trustee for Johnson Family Discretionary A/C No. 2. The selling stockholder is director of Venoace Pty Ltd. | |
| (81) | Of these shares, 7,325 shares are held by Themistocoles, Vanieris as trustee for Vanieris & Qually A/C. The selling stockholder is director of Themistocoles, Vanieris. | |
| (82) | Of these shares, 9,602,949 shares are held by Domenic Tacca Pty Ltd as trustee for Domenic Tacca Family A/C. The selling stockholder is the director of Domenic Tacca Pty Ltd. | |
| (83) | Of these shares, 1,139,375 shares are held by the selling stockholders as trustees for Tuscany Super Fund A/C. | |
| (84) | Of these shares, 555 shares are held by the selling stockholder as trustee for Fairbrother Family A/C. | |
| (85) | Of these shares, 774,287 shares are held by Torwood General Cleaning Services Pty Ltd as trustee for Executive Super Fund A/C. The selling stockholders are directors of Torwood General Cleaning Services Pty Ltd. | |
| (86) | Of these shares, 11,445 shares are held by Wendon Holdings Pty Limited as trustee for Wendon Family Property A/C. The selling stockholders are directors of Wendon Holdings Pty Limited. | |
| (87) | Of these shares, 28,349 shares are held by the selling stockholders as trustees for the Fairbrother Family Trust. | |
| (88) | Of these shares, 613,000 shares are held by the selling stockholders as trustees for the Swain Family Pension A/C. | |
| (89) | Of these shares, 647,594 shares are held directly and 22,912 shares are held by Dorothy Jean Ellis as trustee for The D Ellis Super Fund. | |
| (90) | Of these shares, 134,247 shares are held by Addvokat Pty Ltd as trustee for Addvokat A/C. The selling stockholder is director of Addvokat Pty Ltd. | |
| (91) | Of these shares, 412,192 shares are held directly, and 64,644,680 shares are held by the selling stockholder as trustee for the Dr. L. Prasad Super Fund A/C. | |
| (92) | Of these shares, 30,586 shares are held by Shandan Trading Pty Ltd as trustee for The Shandan Trading A/C. The selling stockholder is director of Shandan Trading Pty Ltd. | |
| (93) | Of these shares, 911,669 shares are held by the selling stockholders as trustees for Zondins Super Fund. | |
| (94) | Of these shares, 2,564,413 shares are held by the selling stockholders as trustees for the Morgan Superannuation A/C. | |
| (95) | Of these shares, 105 shares are held by Tandara Pastoral Co Pty Ltd. The selling stockholder is director of Tandara Pastoral Co Pty Ltd. | |
| (96) | Of these shares, 550,000 shares are held by E & C Georgiou Num Pty Ltd as trustee for The Emilious Georgiou A/C, 460,000 shares are held by the selling stockholders as trustee for Georgiou Super Fund A/C. The selling stockholders are directors of E & C Georgiou Num Pty Ltd. | |
| (97) | Of these shares, 3,495,403 shares are held by Dyer Farms Pty Ltd as trustee for Tooronga Farms Ret Fund A/C. The selling stockholders are directors of Dyer Farms Pty Ltd. | |
| (98) | Of these shares, 4,180,960 shares are held by Faldison Pty Ltd. The selling stockholder is director of Faldison Pty Ltd. | |
| (99) | Of these shares, 86 shares are held by Kurrajon Enterprises Pty Ltd. The selling stockholder is director of Kurrajon Enterprises Pty Ltd. | |
| (100) | Of these shares, 224 shares are held by the selling stockholder as trustee for the Dunstan Family S/Fund A/C. | |
| (101) | Of these shares, 714 shares are held by the selling stockholders as trustees of The Dunstan Family S/F A/C. | |
| (102) | Of these shares, 7,580 shares are held by the selling stockholders as trustees for Felswheel P/L Emp S/F A/C, and 7,325 shares are held by Garry McLeod as trustee for Felswheel P/L Emp Super Fund. | |
| (103) | Of these shares, 4,088,640 shares are held by Galico Pty Ltd as trustee for Lacono Family A/C. The selling stockholder is director of Galico Pty Ltd. | |
| (104) | Of these shares, 4,808 shares are held by the selling stockholders as trustees for Haden Wolski Fam Super A/C, and 469 shares are held by Gavin Wolski as trustee for Haden Wolski Fam S/F A/C. | |
| (105) | Of these shares, 1,332,985 shares are held by the selling stockholders as trustees for The Columbus Super Fund A/C. |
| 57 |
| (106) | Of these shares, 3,463,072 shares are held directly, and 2,726,472 shares are held by GFF Holdings Pty Ltd as trustee for GFF Superannuation Fund A/C. The selling stockholder is director of GFF Holdings Pty Ltd. | |
| (107) | Of these shares, 4,212,011 shares are held by the selling stockholders as trustees for GL & CJ Godley S/F A/C, 1,661,398 shares are held by the selling stockholders directly, and 631,814 shares are held by Chellema Investment Co Pty Ltd as trustee for Trading A/C. The selling stockholders are directors of Chellema Investment Co Pty Ltd. | |
| (108) | Of these shares, 1,588 shares are held by Bolzano Investments Pty Ltd. The selling stockholders are directors of Bolzano Investments Pty Ltd. | |
| (109) | Of these shares, 1,888,306 shares are held by the selling stockholder as trustee for Paradigm Developments Super Fund. | |
| (110) | Of these shares, 401,653 shares are held by the selling stockholders as trustees for Paradigm Developments SF. | |
| (111) | Of these shares, 1,056,938 shares are held directly, and 1,067,970 shares are held by the selling stockholders as trustees for The Sullivan Super Fund A/C. | |
| (112) | Of these shares, 203,983 shares are held by the selling stockholders as trustees for Blair-West Med Pens Fund A/C. | |
| (113) | Of these shares, 1,420,821 shares are held by the selling stockholders as trustees for Blair-West Medical S/F A/C. | |
| (114) | Of these shares, 6,639,812 shares are held by G L B Pty Ltd as trustee for The GLB Super Fund A/C, 1,800,000 shares are held by G L B Pty Ltd as trustee for The G L Bliss Family A/C, and 1,250,728 shares are held by G L B Pty Ltd. The selling stockholder is director of G L B Pty Ltd. | |
| (115) | Of these shares, 272,215 shares are held by the selling stockholders as trustees for Vlahos Super Fund A/C. | |
| (116) | Of these shares, 1,515,202 shares are held by Alclare Pty Ltd as trustee for The Blair-West Family A/C. The selling stockholder is the director of Alclare Pty Ltd. | |
| (117) | Of these shares, 15, 000 shares are held by the selling stockholder as trustee for the Consedine Super Fund A/C, and 11,250 shares are held by Consedine Super Pty Ltd as trustee for the Consedine Super Fund A/C. The selling stockholder is director of Consedine Super Pty Ltd. | |
| (118) | Of these shares, 1,137,332 shares are held by the selling stockholders as trustees for George NEL Super Fund. | |
| (119) | Of these shares, 7,466,017 shares are held by the selling stockholders as trustees for The Mason Super Fund A/C, and 4,736,250 shares are held by the selling stockholders as trustees for The Mason Family A/C. | |
| (120) | Of these shares, 1,085 shares are held by Balanced Developments Pty Ltd. The selling stockholder is the director of Balanced Developments Pty Ltd. | |
| (121) | Of these shares, 4,079 shares are held by the selling stockholder as trustee for Free Will Fund A/C. | |
| (122) | Of these shares, 119,985 shares are held by G A Giusti Construction Pty Limited. The selling stockholders are directors of G A Giusti Construction Pty Limited. | |
| (123) | Of these shares, 2,381 shares are held by the selling stockholders as trustees for Lagana Super Fund A/C. | |
| (124) | Of these shares, 3,807 shares are held by the selling stockholders as trustees for Hawks Discretionary A/C. | |
| (125) | Of these shares, 401,946 shares are held directly, and 1,855,790 shares are held by the selling stockholders as trustees for The Joybell Nominees S/F A/C. | |
| (126) | Of these shares, 452,114 shares are held by the selling stockholder as trustee for Gloria Hartney S/F A/C. | |
| (127) | Of these shares, 426,980 shares are held directly, 2,397,864 shares are held by the selling stockholder and Dana Heriot as trustees for Gordon Super Fund A/C, and 847,696 shares are held by the selling stockholder as trustee for Heriot A/C. | |
| (128) | Of these shares, 1,015,001 shares are held by the selling stockholders as trustees for Farmcostalota Super Fund A/C. | |
| (129) | Of these shares, 37,652 shares are held directly, and 666,951 shares are held by the selling stockholder as trustee for GL Smith Super Fund A/C. | |
| (130) | Of these shares, 129 shares are held by the selling stockholders as trustees for Graham Rowe Super Fund A/C. | |
| (131) | Of these shares, 408,790 shares are held by the selling stockholder as trustee for The Warden Super Fund. | |
| (132) | Of these shares, 740,707 shares are held by the selling stockholders as trustees for Gloria Hartney S/Fund A/C. | |
| (133) | Of these shares, 43 shares are held by the selling stockholders as trustees for The Turner Super Fund A/C. | |
| (134) | Of these shares, 35,035 shares are held by the selling stockholder as trustee of The Turner Super Fund A/C. | |
| (135) | Of these shares, 2,000,000 shares are held by G & F Dennis Superannuation Fund. The selling stockholder is the director of G & F Dennis Superannuation Fund. |
| 58 |
| (136) | Of these shares, 1,560,550 shares are held by Tenni & Associates Pty Ltd as trustee for The Tenni Family A/C, and 439,137 shares are held by the selling stockholder as trustee for The Evolution Unit A/C. The selling stockholder is the director of Tenni & Associates Pty Ltd. | |
| (137) | Of these shares, 30,655 shares are held by the selling stockholders as trustees for G & B Giarratana A/C. | |
| (138) | Of these shares, 1,995 shares are held by the selling stockholder as trustee for Douglas McAdam A/C, 1,308 shares are held by the selling stockholder as trustee for Heather McAdam A/C, and 1,145 shares are held by the selling stockholder as trustee for Rose McAdam A/C. | |
| (139) | Of these shares, 28,253,332 shares are held by Gregs Service Pty Ltd as trustees for McAdam Family A/C, 21,375,898 shares are held by Gregs Service Pty Ltd as trustees for Equities Trading Trust, and 403,679 shares are held by the selling stockholders as trustees for Greg and Jen’s SMSF A/C. The selling stockholders are directors of Gregs Service Pty Ltd. | |
| (140) | Of these shares, 3,844,709 shares are held by Bew’s Kennel Pty Ltd as trustee for Watson Trading A/C. The selling stockholder is director of Bew’s Kennel Pty Ltd. | |
| (141) | Of these shares, 73,572 shares are held by Tabac Nominees Pty Ltd. The selling stockholders are directors of Tabac Nominees Pty Ltd. | |
| (142) | Of these shares, 55 shares are held by the selling stockholders as trustees for R & K Martin Super Fund A/C. | |
| (143) | Of these shares, 20,437 shares are held by the selling stockholders as trustee for HF Mechielsen A/C. | |
| (144) | Of these shares, 2,247,432 shares are held by Blue Chip Turf Management Pty Ltd as trustee for Trim Family A/C. The selling stockholders are directors of Blue Chip Turf Management Pty Ltd. | |
| (145) | Of these shares, 47,034 shares are held by the selling stockholder and Martha Ross as trustees for H & M Ross Retire Fund A/C. | |
| (146) | Of these shares, 204 shares are held by the selling stockholders as trustees for R Howard Retirement Fund A/C. | |
| (147) | Of these shares, 3,259,082 shares are held by Resort Brokers Pty Ltd as trustee for Crooks Family Superfund A/C. The selling stockholders are directors of Resort Brokers Pty Ltd. | |
| (148) | Of these shares, 1,825,838 shares are held by the selling stockholders as trustees for Foster Super Fund A/C. | |
| (149) | Of these shares, 1,434,139 shares are held by the selling stockholder as trustee for Patterson Family A/C, and 1,412,773 shares are held by the selling stockholder as trustee for The Blume Patterson Unit A/C. | |
| (150) | Of these shares, 3,384,596 shares are held by the selling stockholders as trustees for Ian Harold Banks S/Fund A/C. | |
| (151) | Of these shares, 1,095,644 shares are held by Jiah Superannuation Pty Ltd as trustee for Jiah Super Fund. The selling stockholders are directors of Jiah Super Fund. | |
| (152) | Of these shares, 150,000 shares are held by Synman Nominees Pty Ltd as trustee for IMJWS Super Fund A/C. The selling stockholder is director of Synman Nominees Pty Ltd. | |
| (153) | Of these shares, 548,926 shares are held by Linian Investments Pty Ltd as trustee for Ferntor Holdings Account, and 404,088 shares are held by the selling stockholders as trustees for Linian Super Fund A/C. The selling stockholders are directors of Linian Investments Pty Ltd. | |
| (154) | Of these shares, 45,426 shares are held by the selling stockholders as trustees for Foster Super Fund A/C. | |
| (155) | Of these shares, 775 shares are held by the selling stockholders as trustees for Superannuation Fund A/C. | |
| (156) | Of these shares, 400,200 shares are held by the selling stockholder as trustee for Award Saver A/C. | |
| (157) | Of these shares, 12,397,570 shares are held by the selling stockholders as trustees for Lawrenson J & R S/Fund A/C, and 1,075 shares are held by Mrs. Emma Jane Lay. | |
| (158) | Of these shares, 3,600,012 shares are held by Kovron Pty Ltd as trustee for J M Creagh Super Fund A/C, and 2,526,992 shares are held by Trial Developments Pty Ltd. The selling stockholders are directors of Kovron Pty Ltd. and Trial Developments Pty Ltd. |
| 59 |
| (159) | Of these shares, 10,000 shares are held by the selling stockholder as trustee for James W Smith 2 A/C. | |
| (160) | Of these shares, 123,132 shares are held by Salora Station Pty Ltd as trustee for Highbray Absolute Entitl AC. | |
| (161) | Of these shares, 86 shares are held by the selling stockholders as trustees for Faraway Super Fund A/C. | |
| (162) | Of these shares, 3,219 shares are held by the selling stockholder as trustee for Faraway Super Fund A/C. | |
| (163) | Of these shares, 8,398,675 shares are held by Admin Nominees Pty Ltd as trustee for Lovett Family A/C. The selling stockholders are directors of Admin Nominees Pty Ltd. | |
| (164) | Of these shares, 984,998 shares are held by Campbell Marketing Pty Ltd as trustee for The John Campbell S/F A/C. The selling stockholder is the director of Campbell Marketing Pty Ltd. | |
| (165) | Of these shares, 1,473,800 shares are held by the selling stockholder as trustee for Thwaites Family S/F A/C. | |
| (166) | Of these shares, 7,325 shares are held by the selling stockholder as trustee for Kelly & Assoc Super Fund. | |
| (167) | Of these shares, 54 shares are held by the selling stockholders as trustees for Kelly Kelly & Assoc S/F A/C. | |
| (168) | Of these shares, 548,500 shares are held by the selling stockholders as trustees for J Rautenbach Super Fund A/C. | |
| (169) | Of these shares, 29,429 shares are held by Bricks and Mortar Investments Pty Ltd as trustee for McElligott S/Fund No 2 A/C. The selling stockholders are directors of Bricks and Mortar Investments Pty Ltd. | |
| (170) | Of these shares, 14,553 shares are held by the selling stockholders as trustee for J&C Installations PL S/F A/C. | |
| (171) | Of these shares, 1,375 shares are held by John Orlando Pty Limited. The selling stockholder is the director of John Orlando Pty Limited. | |
| (172) | Of these shares, 661,592 shares are held by the selling stockholders as trustees for Pugsley Super Fund A/C. | |
| (173) | Of these shares, 468,974 shares are held by Royall Investments Pty Ltd as trustee for Royall Super Fund A/C. The selling stockholders are directors of Royall Investments Pty Ltd. | |
| (174) | Of these shares, 26,083 shares are held by the selling stockholders as trustees of Fry Super Fund A/C. | |
| (175) | Of these shares, 401,962 shares are held by the selling stockholders as trustees of Toigo Super Fund A/C. | |
| (176) | Of these shares, 3,892,113 shares are held by the selling stockholders as trustees for John & Goi’s Super Fund A/C, and 57,831 shares are held by the selling stockholders as trustees for John & Goi’s S/F A/C. | |
| (177) | Of these shares, 470,068 shares are held by the selling stockholder as trustee for Kirzner Family A/C. | |
| (178) | Of these shares, 150,038 shares are held by the selling stockholder as trustee for Kristian Gowan A/C. | |
| (179) | Of these shares, 2,367,749 shares are held by the selling stockholders as trustees for Keith Vuichoud Pens Fund A/C. | |
| (180) | Of these shares, 2,000,000 shares are held by Nexcar Pty Ltd as trustee for Nexcar Investment AC, and 2,000,000 shares are held by Timmatt Pty Ltd as trustee for Stuckey Superannuation Fund AC. The selling stockholder is director or Nexcar Pty Ltd and Timmatt Pty Ltd. | |
| (181) | Of these shares, 2,000,000 shares are held by the selling stockholders as trustee for Hightide Trust. | |
| (182) | Of these shares, 2,472,226 shares are held directly, and 1,001,079 shares are held by the selling stockholder as trustee for Kerrie Louise Grayson A/C. | |
| (183) | Of these shares, 358,048 shares are held directly, 9,232,079 shares are held by Kevin Howard Crane Hire Pty Ltd as trustee for K & M Howard Super Fund A/C, 26,816 shares are held by Kevin Howard Investments Pty Ltd, and 767 shares are held by the selling stockholder as trustee for Superannuation Fund A/C. The selling stockholder is director of Kevin Howard Investments Pty Ltd. | |
| (184) | Of these shares, 410,730 shares are held directly, and 424,524 shares are held by the selling stockholder as trustee for Riley Super Fund A/C. | |
| (185) | Of these shares, 1,098,096 shares are held by Vardy Superannuation Pty Ltd as trustee for Vardy Super Fund A/C. The selling stockholders are directors of Vardy Superannuation Pty Ltd. | |
| (186) | Of these shares, 2,294,776 shares are held by Pollard Superannuation Pty Ltd as trustee for Pollard Super Fund A/C. The selling stockholders are directors of Pollard Superannuation Pty Ltd. | |
| (187) | Of these shares, 726,984 shares are held by the selling stockholder as trustee for Precision Greenfields S/F AC, 429,188 shares are held by Precision Greenfields Pty Ltd, and 402,121 shares are held by the selling stockholder as trustee for Stafford Investment A/C. The selling stockholder is the director of Precision Greenfields Pty Ltd. |
| 60 |
| (188) | Of these shares, 1,159,181 shares are held by the selling stockholders as trustees for MaggieArnold Super Fund. | |
| (189) | Of these shares, 906,737 shares are held by Frosti Super Pty Ltd as trustee for MaggiArnold Super Fund. The selling stockholder is the director of Frosti Super Pty Ltd. | |
| (190) | Of these shares, 1,481,746 shares are held by Southwest Automotive Pty Ltd as trustee for Southwest Automotive S/F A/C. The selling stockholders are directors of Southwest Automotive Pty Ltd. | |
| (191) | Of these shares, 1,425,000 shares are held by the selling stockholders as trustees for Southwest Automotive S/F A/C. | |
| (192) | Of these shares, 1,732,876 shares are held by Triple 8 Ventures Pty Ltd as trustee for L Porteous Family A/C. The selling stockholders are directors of Triple 8 Ventures Pty Ltd. | |
| (193) | Of these shares, 9,333 shares are held by the selling stockholders as trustees for R & L Seale Super Fund. | |
| (194) | Of these shares, 8,737 shares are held by Backdale Pty Ltd as trustee for Backdale Super Fund. The selling stockholders are directors of Backdale Pty Ltd. | |
| (195) | Of these shares, 98,096 shares are held directly, and 241,159 shares are held by the selling stockholder as trustee for R Closter Fam Disc No 2 A/C. | |
| (196) | Of these shares, 7,474 shares are held by Skylark Investment Pty Ltd as trustee for Skylark Family A/C. the selling stockholders are directors of Skylark Investment Pty Ltd. | |
| (197) | Of these shares, 35,415 shares are held directly, and 18,500 shares are held by the selling stockholders as trustees for Warren Family Super Fund A/C. | |
| (198) | Of these shares, 1,586 shares are held by the selling stockholders as trustees for Kain Super Fund A/C. | |
| (199) | Of these shares, 1,428,621 shares are held by the selling stockholder as trustee for Koch Superannuation Fund A/C, and 1,553,820 shares are held by the selling stockholder as trustee for Koch Super Fund. | |
| (200) | Of these shares, 5,064,938 shares are held by the selling stockholders as trustees for Koch Super Fund A/C. | |
| (201) | Of these shares, 853 shares are held by the selling stockholders as trustees for LaParinta Super Fund A/C. | |
| (202) | Of these shares, 959,872 shares are held by the selling stockholder as trustee for Romaral Super Fund. | |
| (203) | Of these shares, 1,377,212 shares are held by Sherrin Pty Ltd as trustee for J & M Livingston Super A/C. The selling stockholder is director of Sherrin Pty Ltd. | |
| (204) | Of these shares, 2,013,412 shares are held by McIntyre Executive Pty Limited as trustee for McIntyre Executive S/F A/C. The selling stockholders are directors of McIntyre Executive Pty Limited. | |
| (205) | Of these shares, 1,418,750 shares are held by Phillips Nominees Pty Ltd as trustee for Phillips Family A/C. The selling stockholders are directors of Phillips Nominees Pty Ltd. | |
| (206) | Of these shares, 1,752 shares are held by Tridu Pty Ltd as trustee for Ferns Super Fund A/C, 1,611 shares are held by the selling stockholder as trustee for Tridu Pty Ltd A/C, and 1,577 shares are held by Tridu Pty Ltd. The selling stockholder is director of Tridu Pty Ltd. | |
| (207) | Of these shares, 18,700 shares are held by MNE-Longtime Pty Ltd as trustee for MNE Family Superfund A/C, and 3,270 shares are held by MNE-Longtime Pty Ltd as trustee for MNE Family A/C. The selling stockholders are directors of MNE-Longtime Pty Ltd. | |
| (208) | Of these shares, 477,066 shares are held by the selling stockholders as trustees for The Freedom Super Fund A/C. | |
| (209) | Of these shares, 7,045 shares are held by the selling stockholders as trustees for Miles Family Super Fund A/C. | |
| (210) | Of these shares, 1,525,004 shares are held by MSC Enterprises (AUST) Pty Ltd. The selling stockholder is director of MSC Enterprises (AUST) Pty Ltd. | |
| (211) | Of these shares, 1,489,598 shares are held by Investment Vision Pty Ltd as trustee for Vision One A/C, and 1,416,064 shares are held by Investment Vision Pty Ltd as trustee for Maurice Dover Super A/C. The selling stockholder is director of Investment Vision Pty Ltd. | |
| (212) | Of these shares, 1,471,429 shares are held by Twigg Investments Pty Ltd as trustee for Twigg Investment A/C. The selling stockholder is director of Twigg Investments Pty Ltd. | |
| (213) | Of these shares, 5,000,224 shares are held by Tasman (VIC) Pty Ltd as trustee for Hooper Super Fund A/C, 2,931,343 shares are held by Fifth Glenmar Pty Ltd as trustee for Fifth Glenmar Property A/C, and 82,547 shares are held by Fifth Glenmar Pty Ltd. The selling stockholder is director of Tasman (VIC) Pty Ltd and Fifth Glenmar Pty Ltd. | |
| (214) | Of these shares, 9,174,562 shares are held by Nickbah Pty Ltd as trustee for Hamilah Super Fund, 4,675,821 shares are held by Nickbah Pty Ltd as trustee for M S Bigg Business A/C, and 4,484,660 shares are held by Hamilah Pty Ltd as trustee for The Hamilah Super Fund A/C. The selling stockholders are directors of Nickbah Pty Ltd and Hamilah Pty Ltd. |
| 61 |
| (215) | Of these shares, 481,748 shares are held by Heartbeat Communications Pty Ltd as trustee for Heartbeat Comm S/Fund A/C. The selling stockholders are directors of Heartbeat Communications Pty Ltd. |
| (216) | Of these shares, 2,080,162 shares are held by Newquay Investments Pty Ltd as trustee for Newquay Super Fund A/C, and 461,310 shares are held by Newquay Investments Pty Ltd as trustee for Michael Keating Family A/C. The selling stockholders are directors of Newquay Investments Pty Ltd. |
| (217) | Of these shares, 5,124 shares are held by the selling stockholder as trustee for Midoris Super Fund A/C. |
| (218) | Of these shares, 1,009,810 shares are held directly, and 76,842 shares are held by the selling stockholder as trustee for McCann SMSE Pty Ltd A/C. |
| (219) | Of these shares, 1,589,826 shares are held by the selling stockholder as trustee for M McMahon Super Fund A/C, and 1,553,820 shares are held by the selling stockholder as trustee for M McMahon Super Fund. |
| (220) | Of these shares, 3,113,332 shares are held by the selling stockholders as trustees for Minichiello Super Fund A/C. |
| (221) | Of these shares, 5,496,274 shares are held by Rogers Superannuation Pty Ltd as trustee for Rogers Superannuation Account, and 6,876,879 shares are held by the selling stockholder as trustee for The M H R Account. The selling stockholder is director of Rogers Superannuation Pty Ltd. |
| (222) | Of these shares, 150 shares are held directly, and 5,860 shares are held by the selling stockholder as trustee for EADG Pty Ltd A/C. |
| (223) | Of these shares, 424,524 shares are held by McCann SMSF Pty Ltd as trustee for McCann Super Fund A/C. The selling stockholder is director of McCann SMSF Pty Ltd. |
| (224) | Of these shares, 70,000 shares are held by the selling stockholders as trustees for MJ &HD CLOSE SUPER A/C. |
| (225) | Of these shares, 1,472 shares are held by the selling stockholder as trustee for Les Bicounets A/C. |
| (226) | Of these shares, 294,286 shares are held by N & R Allsopp Pty Ltd as trustee for Allsopp Family A/C, 73,572 shares are held by the selling stockholders as trustees for Superannuation Fund A/C. The selling stockholders are directors of N & R Allsopp Pty Ltd. |
| (227) | Of these shares, 1,461,310 shares are held by NV Estates Pty Ltd as trustee for Ibbott Family Superannuation Fund. The selling stockholder is director of NV Estates Pty Ltd. |
| (228) | Of these shares, 1,500,000 shares are held by Ball Superannuation Fund Pty Ltd as trustee for Ball Superannuation Fund, and 1,022,400 shares are held by the selling stockholders as trustee for Ball Family Trust. The selling stockholders are directors of Ball Superannuation Fund Pty Ltd. |
| (229) | Of these shares, 86 shares are held by Nitash Pty Ltd as trustee for Johnston Family A/C. The selling stockholder is director of Nitash Pty Ltd. |
| (230) | Of these shares, 24,524 shares are held by the selling stockholders as trustees for Martins Family A/C. |
| (231) | Of these shares, 3,112,924 shares are held by Kambell Pty Ltd as trustee for Grant Family Super Fund A/C, 458,429 shares are held by Kambell Pty Ltd as trustee for Grant Family A/C, and 420,968 shares are held by Kambell Pty Ltd. The selling stockholder is director of Kambell Pty Ltd. |
| (232) | Of these shares, 30,717 shares are held by Reswick Pty Ltd as trustee for Neville Parton S/Fund A/C. The selling stockholder is director of Reswick Pty Ltd. |
| (233) | Of these shares, 41,992 shares are held by R M Investments Pty Ltd as trustee for NRM Unit Account, and 1,472 shares are held by Mabeti Pty Limited as trustee for Superannuation Fund A/C. The selling stockholder is director of R M Investments Pty Ltd and Mabeti Pty Limited. |
| (234) | Of these shares, 1,377,096 shares are held by King Cosmos Investments Limited. The selling stockholder is director of King Cosmos Investments Limited. |
| (235) | Of these shares, 1,878,218 shares are held by Kew Directors Pty Ltd as trustee for Kew Directors S/F A/C, and 1,461,310 shares are held by Kew Directors Pty Ltd as trustee for Kew Dirs S/F-Portfolio A/C. The selling stockholders are directors of Kew Directors Pty Ltd. |
| (236) | Of these shares, 1,400,000 shares are held by the selling stockholders as trustees for Hills Superannuation Fund. |
| (237) | Of these shares, 1,402,453 shares are held by Optionall Pty Ltd as trustee for Christopher Ruys A/C. The selling stockholders are directors of Optionall Pty Ltd. |
| (238) | Of these shares, 6,590,768 shares are held by Murranji Pty Limited as trustee for Toohey Family Superfund A/C. The selling stockholders are directors of Murranji Pty Limited. |
| (239) | Of these shares, 996,163 shares are held by GOF Nominees Pty Limited, and 558,846 shares are held by P & K Taylor Superannuation Fund Pty Ltd. The selling stockholder is director of GOF Nominees Pty Limited and P & K Taylor Superannuation Fund Pty Ltd. |
| 62 |
| (240) | Of these shares, 203,025 shares are held by the selling stockholders as trustees for Tosin S/F A/C. | |
| (241) | Of these shares, 5,584 shares are held by the selling stockholders as trustees for TK Unit A/C. | |
| (242) | Of these shares, 23 shares are held by Main Street Realty Pty Ltd as trustee for Ryan Family Super Fund A/C. The selling stockholder is director of Main Street Realty Pty Ltd. |
| (243) | Of these shares, 1,008,261 shares are held by the selling stockholder as trustee for The Wilson Clan Family A/C. |
| (244) | Of these shares, 1,067,206 shares are held by the selling stockholders as trustees for The Gowan Super Fund A/C. |
| (245) | Of these shares, 1,115,665 shares are held by SMSF 4U Pty Ltd as trustee for P J Dunn Superfund No2 A/C. The stockholder is director of SMSF 4U Pty Ltd. |
| (246) | Of these shares, 20,509 shares are held by the selling stockholder as trustee for PJ Kearnet Super Fund. |
| (247) | Of these shares, 401,750 shares are held by Nonnemacher Enterprises Pty Ltd as trustee for Nonnemacher S/F A/C. The selling stockholder is director of Nonnemacher Enterprises Pty Ltd. |
| (248) | Of these shares, 24,915 shares are held directly, and 61,011 shares are held by Direct Motors Pty Ltd as trustee for Direct Motors Super Fund A/C. The selling stockholder is director of Direct Motors Pty Ltd. |
| (249) | Of these shares, 3,402,336 shares are held directly, and 417,449 shares are held by the selling stockholder as trustee for Lewis Super Fund A/C. |
| (250) | Of these shares, 229,216 shares are held by the selling stockholders as trustees for Mark Family Super Fund A/C. |
| (251) | Of these shares, 2,000,000 shares are held by Peter Moore Pty Ltd as trustee for Peter Moore Super Fund A/C. The selling stockholder is director of Peter Moore Pty Ltd. |
| (252) | Of these shares, 2,325,788 shares are held by the selling stockholders as trustees for Hearman Super Fund A/C, and 184,534 shares are held by the selling stockholders as trustees for Hearman Family A/C. |
| (253) | Of these shares, 18,750 shares are held by Blue Moon Cabins Pty Ltd as trustee for The West Family A/C. The selling stockholders are directors of Blue Moon Cabins Pty Ltd. |
| (254) | Of these shares, 12,699 shares are held by the selling stockholder as trustee for Phil Wood Family Super Fund. |
| (255) | Of these shares, 2,453 shares are held by the selling stockholder as trustee for Phil Wood Family S/F A/C. |
| (256) | Of these shares, 835,035 shares are held by the selling stockholders as trustees for The Joybell Nominees S/F A/C. |
| (257) | Of these shares, 8,567,668 shares are held by the selling stockholders as trustees for Ramani Family Superannuation Fund, and 419,042 shares are held by R & J PTY LTD as trustee for Ramani Family A/C. The selling stockholders are directors of R & J Pty Ltd. |
| (258) | Of these shares, 985,056 shares are held by the selling stockholders as trustees for Varma Super Fund A/C. |
| (259) | Of these shares, 1,400,000 shares are held be Cape One Master Fund II LP. The selling stockholder is a director of Cape One Master Fund II LP. |
| (260) | Of these shares, 502,284 shares are held by Praklark Pty Ltd. The selling stockholder is director of Praklark Pty Ltd. |
| (261) | Of these shares, 833,934 shares are held by the selling stockholders as trustees for Neil & Rhonda Allsopp SF A/C. |
| (262) | Of these shares, 75,334 shares are held by the selling stockholder as trustee for 214 Graham Street A/C. |
| (263) | Of these shares, 8,175 shares are held by the selling stockholders as trustees for Verkaik Super Fund A/C. |
| (264) | Of these shares, 449,048 shares are held by R A B Investments Pty Ltd, 7,069,408 shares are held by the selling stockholders as trustees for RAB Investments P/L S/F A/C, 6,839,592 shares are held by RAB Investments Pty Ltd, and 1,553,276 shares are held directly. |
| (265) | Of these shares, 2,876 shares are held by Limbre Pty Ltd as trustee for Garton Super Fund A/C. The selling stockholder is director of Limbre Pty Ltd. |
| (266) | Of these shares, 16,144,132 shares are held directly, and 22,219,388 shares are held by Handibeau Pty Limited as trustee for Prendergast Super Fund A/C. The selling stockholders are directors of Handibeau Pty Limited. |
| (267) | Of these shares, 2,100 shares are held by the selling stockholders as trustees for Lapin et Tigre S/Fund A/C. |
| (268) | Of these shares, 7,325 shares are held by the selling stockholders as trustees for The Dulkara Super Fund. |
| (269) | Of these shares, 4,042,856 shares are held by the selling stockholders as trustees for Big Boss Investments A/C, 2,940,288 shares are held by the selling stockholders as trustees for Broadbill Super Fund A/C, and 792,384 shares are held by Big Boss Investments Pty Ltd. The selling stockholders are directors of Big Boss Investments Pty Ltd. |
| 63 |
| (270) | Of these shares, 1,535,825 shares are held by the selling stockholders as trustees for Pruyn Family A/C. |
| (271) | Of these shares, 73,572 shares are held by the selling stockholders as trustees for Broadbill Super Fund A/C. |
| (272) | Of these shares, 2,398 shares are held by the selling stockholder as trustee for R & K Martin Super Fund A/C. |
| (273) | Of these shares, 15,627 shares are held by the selling stockholders as trustees for Rodney & Julie Fagg Super Fund, 5,607 shares are held by the selling stockholders as trustees for Super Fund A/C, and 110 shares are held by the selling stockholders as trustees for Superannuation Fund A/C. |
| (274) | Of these shares, 4,129,024 shares are held by Ascendant SC Pty Ltd as trustee for Ascendant SC A/C, 1,065,400 shares are held by Bageton Nominees Pty Ltd as trustee for Kucharski Family A/C, 539,197 shares are held by S C Ascendant Pty Ltd as trustee for Ascendant P/L A/C, and 19,620 shares are held by Ascendant SC Pty Ltd as trustee for Ascendant A/C. The selling stockholder is director of Ascendant SC Pty Ltd, Bageton Nominees Pty Ltd, S C Ascendant Pty Ltd and Ascendant SC Pty Ltd. |
| (275) | Of these shares, 125 shares are held directly, and 65,852 shares are held by the selling stockholders as trustees for Set Free Super Fund A/C. |
| (276) | Of these shares, 6,096,188 shares are held by the selling stockholders as trustees for The Namllu Super Fund. |
| (277) | Of these shares, 23,853 shares are held by the selling stockholders as trustees for Van Rooyen Super Fund A/C. |
| (278) | Of these shares, 3,035,840 shares are held by R & H Woodrow Pty Ltd as trustee for Woodrow Super Fund A/C. The selling stockholders are directors of R & H Woodrow Pty Ltd. |
| (279) | Of these shares, 1,522,320 shares are held by Bigmor Pty Ltd as trustee for Bigmor Super Fund A/C. The selling stockholders are directors of Bigmor Pty Ltd. |
| (280) | Of these shares, 15,874 shares are held by Marishane Pty Ltd as trustee for Heritage Super Fund A/C, and 794 shares are held by Mascotglen Pty Ltd. The selling stockholder is director of Marishane Pty Ltd. |
| (281) | Of these shares, 13,777,712 shares are held by Gant Investments Pty Ltd, and 37,111,136 shares are held by Gant Investments Pty Ltd as trustee for Gant Investments A/C. The selling stockholders are directors of Gant Investments Pty Ltd. |
| (282) | Of these shares, 3,969,276 shares are held by Shayjo Superannuation Pty Ltd as trustee for The Shayjo Superannuation Fund. The selling stockholder is director of Shayjo Superannuation Pty Ltd. |
| (283) | Of these shares, 1,379,929 shares are held directly, and 818 shares are held by the selling stockholders as trustees for Olivia & Shania Nugara A/C. |
| (284) | Of these shares, 1,011,496 shares are held by the selling stockholder as trustee for Forzas1 Superannuation A/C. |
| (285) | Of these shares, 170,358 shares are held by Ellon Nominees Pty Ltd as trustee for Ellon Family A/C, and 38,096 shares are held by Est Late Shannon Hoare & Ellon Nominees Pty Ltd as trustee for Ellon Family A/C. The selling stockholder is director of Ellon Nominees Pty Ltd. |
| (286) | Of these shares, 1,177,144 shares are held by Coorparoo Health and Beauty Pty Limited as trustee for I & S Young Family A/C, and 692,990 shares are held by Coorparoo Health & Beauty Pty Ltd as trustee for 1& S Young Family Trust. The selling stockholder is director of Coorparoo Health and Beauty Pty Limited. |
| (287) | Of these shares, 199,048 shares are held by the selling stockholder as trustee for Sheridan Family A/C. |
| (288) | Of these shares, 1,359 shares are held by the selling stockholders as trustees for S & B Manning S/F A/C. |
| (289) | Of these shares, 37,993 shares are held by the selling stockholder as trustee for Parer Clarke Investment A/C. |
| (290) | Of these shares, 4,979 shares are held by Petrach Nominees Pty Limited as trustee for S A Carroll Super Fund A/C. The selling stockholder is director of Petrach Nominees Pty Limited. |
| (291) | Of these shares, 476,637 shares are held directly, 424,524 shares are held by the selling stockholders as trustees for Burns Family Super Fund A/C, and 436,786 shares are held by the selling stockholders as trustees for Burns Super Fund A/C. |
| (292) | Of these shares, 1,415,000 shares are held by Avon Rise Pty Ltd as trustee for Sixth Gypsy P/L S/Fund A/C. The selling stockholders are directors of Avon Rise Pty Ltd. |
| (293) | Of these shares, 4,977 shares are held by the selling stockholders as trustees for SW Smith Family A/C, and 44 shares are held by the selling stockholders as trustees for Steven W Smith Family A/C. |
| (294) | Of these shares, 1,407,848 shares are held by the selling stockholders as trustees for Dobrzynski Family S/F A/C. |
| (295) | Of these shares, 206,000 shares are held by the selling stockholder as trustee for Sirius Super Fund A/C. |
| 64 |
| (296) | Of these shares, 104,227 shares are held by the selling stockholders as trustees for Sirius Super Fund A/C. |
| (297) | Of these shares, 486,667 shares are held by the selling stockholders as trustees for T & S Carroll Super Fund A/C. |
| (298) | Of these shares, 1,666,668 shares are held by Roth Consulting Group Pty Ltd as trustees for Roth Consulting S/F A/C. The selling stockholders are directors of Roth Consulting Group Pty Ltd. |
| (299) | Of these shares, 2,868 shares are held directly, 327,416 shares are held by the selling stockholders as trustees for Ashcroft Super Fund A/C, and 73,572 shares are held by Ashcroft Superannuation Fund. The selling stockholders are directors of Ashcroft Superannuation Fund. |
| (300) | Of these shares, 735,786 shares are held by the selling stockholders as trustees for Horgan Family S/F A/C. |
| (301) | Of these shares, 2,142,408 shares are held by the selling stockholders as trustees for Timbel Family A/C. |
| (302) | Of these shares, 1,014,633 shares are held directly, and 2,564,049 shares are held by Desgo Pty Ltd as trustee for Oliver Super Fund A/C. The selling stockholder is director of Desgo Pty Ltd. |
| (303) | Of these shares, 4,000,000 shares are held by First Farley Pty Ltd as trustee for The Timar Superannuation Fund. The selling stockholders are directors of First Farley Pty Ltd. |
| (304) | Of these shares, 1,500,000 shares are held by Onsight Ascent Pty Ltd as trustee for The Onsight Trust. The selling stockholders are directors of Onsight Ascent Pty Ltd. |
| (305) | Of these shares, 203,679 shares are held by the selling stockholder as trustee for Tina Dion Super Fund A/C. |
| (306) | Of these shares, 1,576,764 shares are held by Adelaide East Pty Limited as trustee for Tony Havig Family A/C, and 1,402,384 shares are held by Liverpool Road Investments Pty Ltd as trustee for Tony Havig Super Fund A/C. The selling stockholder is director of Adelaide East Pty Limited and Liverpool Road Investments Pty Ltd. |
| (307) | Of these shares, 246,017 shares are held by Tourquet Pty Ltd as trustee for Hansens AZDF Synd Unit A/C. The selling stockholders are directors of Tourquet Pty Ltd. |
| (308) | Of these shares, 3,940,477 shares are held by the selling stockholders as trustees for Bell Family Super Fund A/C. |
| (309) | Of these shares, 49,048 shares are held by the selling stockholders as trustees for Rose Family Super Fund A/C. |
| (310) | Of these shares, 2,134 shares are held by the selling stockholders as trustee for Davic Holdings A/C. |
| (311) | Of these shares, 61,566 shares are held by the selling stockholders as trustee for Abalode Superannuation A/C. |
| (312) | Of these shares, 540,300 shares are held by the selling stockholders as trustees for Horsburgh Family S/Fund A/C, and 416,639 shares are held directly. |
| (313) | Of these shares, 2,464,950 shares are held by the selling stockholder as trustee for Creagh V3 Super Fund. |
| (314) | Of these shares, 24,524 shares are held by the selling stockholders as trustees for MPC Superannuation Fund A/C. |
| (315) | Of these shares, 67,865 shares are held by the selling stockholders as trustees for Hohn Family S/F A/C. |
| (316) | Of these shares, 36,452 shares are held by SFC Investments Pty Ltd. The selling stockholder is director of SFC Investments Pty Ltd. |
| (317) | Of these shares, 3,032,669 shares are held by the selling stockholders as trustee for McKellar Superannuation Fund. |
| (318) | Of these shares, 7,088 shares are held by The Budarick Superannuation Administration Company Pty Ltd as trustee for Budarick Super Fund A/C. The selling stockholders are directors of The Budarick Superannuation Administration Company Pty Ltd. |
| (319) | Of these shares, 194,445 shares are held by the selling stockholders as trustees for J &B Superannuation FD A/C. |
| (320) | Of these shares, 8,584 shares are held by the selling stockholders as trustees for Marta Fraser A/C, and 767 shares are held directly. |
| (321) | Of these shares, 224,524 shares are held by the selling stockholders as trustees for Taylor Super Fund A/C. |
| 65 |
Securities Authorized for Issuance under Equity Compensation Plans
The following table sets forth securities authorized for issuance under any equity compensation plans approved by our shareholders as well as any equity compensation plans not approved by our shareholders as of December 31, 2014.
| Plan category | Number
of securities to be issued upon exercise of outstanding options, warrants and rights (a) | Weighted
average exercise price of outstanding options, warrants and rights | Number
of securities remaining available for future issuance under equity compensation plans (excluding securities reflected in column (a)) | |||||||||
| Plans approved by our shareholders | - | - | - | |||||||||
| Plans not approved by shareholders | - | - | - |
The following description of our capital stock is based upon our amended and restated articles of incorporation, as amended, our bylaws and applicable provisions of law, in each case as currently in effect. This discussion does not purport to be complete and is qualified in its entirety by reference to our amended and restated articles of incorporation, as amended, and our bylaws, copies of which are filed with the SEC as exhibits to the registration statement of which this prospectus is a part.
Authorized Capital Stock
As of the date of this prospectus, our authorized capital stock consists of (i) 2,500,000,000 shares of common stock, par value $0.001 per share, and (ii) 50,000,000 shares of preferred stock, par value $0.001 per share. At March 30, 2015, we had 2,158,110,323 shares of common stock issued and outstanding. At March 30, 2015, we had 1,000,000 and 1,400,000 shares of Series A and Series F preferred stock, respectively, issued and outstanding, and no shares of Series B, Series C, Series D and Series E preferred stock issued and outstanding.
Common Stock
The holders of common stock are entitled to one vote per share on all matters submitted to a vote of shareholders, including the election of directors. There is no right to cumulate votes in the election of directors. The holders of common stock are entitled to any dividends that may be declared by the board of directors out of funds legally available for payment of dividends subject to the prior rights of holders of preferred stock and any contractual restrictions we have against the payment of dividends on common stock. In the event of our liquidation or dissolution, holders of common stock are entitled to share ratably in all assets remaining after payment of liabilities and the liquidation preferences of any outstanding shares of preferred stock. Holders of common stock have no preemptive rights and have no right to convert their common stock into any other securities.
| 66 |
Preferred Stock
The preferred stock is issuable in one or more series with such designations, voting powers, if any, preferences and relative, participating, optional or other special rights, and such qualifications, limitations and restrictions, as are determined by resolution of our board of directors. The issuance of preferred stock may have the effect of delaying, deferring or preventing a change in control of our company without further action by shareholders and could adversely affect the rights and powers, including voting rights, of the holders of common stock.
Description of Series A Preferred Stock
Our amended and restated articles of incorporation, as amended, authorizes 1,000,000 shares of Series A preferred stock, 1,000,000 of which are outstanding as of March 30, 2015. There are no sinking fund provisions applicable to our Series A preferred stock.
Ranking. The Series A preferred stock ranks pari passu with any other series of preferred stock designated by the Company and not designated as senior securities or subordinate to the Series A preferred stock
Liquidation Preference. In the event of a liquidation or winding up of the Company, a holder of Series A preferred stock will be entitled to receive $1.00 per share of Series A preferred stock.
Dividends. The Series A preferred stock is entitled to receive 12% per annum dividends, paid monthly.
Conversion. Holders of Series A preferred shares have the following rights with respect to the conversion of Series A preferred shares into shares of our common stock:
| ● | At any time after December 31, 2014 and upon notice provided by the holder to the Company, a holder has the right to convert, at face value per share, all or any portion of their Series A preferred shares into shares of our common stock on the basis of 400 shares of common stock for each share of Series A preferred stock so converted (the “Series A Conversion Ratio”). | |
| ● | If at any time after the date of issuance of the Series A preferred stock, in the event the Company (i) makes or issues a dividend or other distribution payable in common stock (other than with respect to the Series A preferred stock); (ii) subdivides outstanding shares of common stock into a larger number of shares; or (iii) combines outstanding shares of common stock into a smaller number of shares; or (iv) conducts a rights offering to its existing shareholders, the Series A Conversion Ratio shall be adjusted appropriately. | |
| ● | Except as otherwise provided in the amended and restated articles of incorporation, as amended, if the common stock issuable upon the conversion of the Series A preferred stock shall be changed into the same or different number of shares of any class or classes of stock, whether by capital reorganization, reclassification or otherwise, then in each such event, the holder of each share of Series A preferred stock shall have the right thereafter to convert such share into the kind and amount of shares of stock and other securities and property receivable upon such capital reorganization, reclassification or other change by holders of the number of shares of common stock into which such shares of Series A preferred stock might have been converted immediately prior to such capital reorganization, reclassification or other change. |
Voting. On all matters to come before our shareholders, holders of Series A preferred stock have that number of votes per share (rounded to the nearest whole share) equal to the product of: (a) the number of shares of Series A preferred stock held on the record date for the determination of the holders of the shares entitled to vote, or, if no record date is established, at the date such vote is taken or any written consent of shareholders is first solicited, and (b) 1001. The holders of Series A preferred shares vote together with the holders of the outstanding shares of all other capital stock of the Company (including and any other series of preferred stock then outstanding), and not as a separate class, series or voting group.
Redemption and Call Rights. The Series A preferred stock is not subject to any redemption rights on behalf of the Company or subject to call by any holder of Series A preferred stock.
| 67 |
Description of Series B Preferred Stock
Our amended and restated articles of incorporation, as amended, authorizes 410,000 shares of Series B preferred stock, none of which are outstanding as of March 30, 2015. There are no sinking fund provisions applicable to our Series B preferred stock.
Ranking. The Series B preferred stock ranks pari passu with any other series of preferred stock designated by the Company and not designated as senior securities or subordinate to the Series B preferred stock.
Liquidation Preference. In the event of a liquidation or winding up of the Company, a holder of Series B preferred stock will be entitled to receive $1.00 per share of Series B preferred stock.
Dividends. The Series B preferred stock is entitled to receive 12% per annum dividends, paid monthly.
Conversion. Holders of Series B preferred shares have the following rights with respect to the conversion of Series B preferred shares into shares of our common stock:
| ● | On December 31, 2014 and upon notice provided by the holder to the Company, a holder has the right to convert, at face value per share, all or any portion of their Series B preferred shares into shares of our common stock on the basis of 400 shares of common stock for each share of Series B preferred stock so converted, or if the holder elects to convert on December 31, 2015, such shares will be converted on the basis of 66⅔ shares of common stock for each share of Series B preferred stock (the “Series B Conversion Ratio”). On December 31, 2014, all of the then outstanding Series B preferred shares were converted into Company common stock. | |
| ● | If at any time after the date of issuance of the Series B preferred stock, in the event the Company (i) makes or issues a dividend or other distribution payable in common stock (other than with respect to the Series B preferred stock); (ii) subdivides outstanding shares of common stock into a larger number of shares; or (iii) combines outstanding shares of common stock into a smaller number of shares; or (iv) conducts a rights offering to its existing shareholders, the Series B Conversion Ratio shall be adjusted appropriately. | |
| ● | Except as otherwise provided in the amended and restated articles of incorporation, as amended, if the common stock issuable upon the conversion of the Series B preferred stock shall be changed into the same or different number of shares of any class or classes of stock, whether by capital reorganization, reclassification or otherwise, then in each such event, the holder of each share of Series B preferred stock shall have the right thereafter to convert such share into the kind and amount of shares of stock and other securities and property receivable upon such capital reorganization, reclassification or other change by holders of the number of shares of common stock into which such shares of Series B preferred stock might have been converted immediately prior to such capital reorganization, reclassification or other change. |
Voting. On all matters to come before our shareholders, holders of Series B preferred stock have that number of votes per share (rounded to the nearest whole share) equal to the product of: (a) the number of shares of Series B preferred stock held on the record date for the determination of the holders of the shares entitled to vote, or, if no record date is established, at the date such vote is taken or any written consent of shareholders is first solicited, and (b) 200. The holders of Series B preferred shares vote together with the holders of the outstanding shares of all other capital stock of the Company (including and any other series of preferred stock then outstanding), and not as a separate class, series or voting group.
Redemption and Call Rights. Any time after December 31, 2015, the Company has the right, but not the obligation, to redeem all of the unconverted outstanding shares of Series B preferred stock by paying in cash an amount per share equal to $1.00.
Description of Series C Preferred Stock
Our amended and restated articles of incorporation, as amended, authorizes 400,025 shares of Series C preferred stock, none of which are outstanding as of March 30, 2015. There are no sinking fund provisions applicable to our Series C preferred stock.
Ranking. The Series C preferred stock ranks pari passu with any other series of preferred stock designated by the Company and not designated as senior securities or subordinate to the Series C preferred stock.
Liquidation Preference. In the event of a liquidation or winding up of the Company, a holder of Series C preferred stock will be entitled to receive $1.00 per share of Series C preferred stock.
Dividends. The Series C preferred stock is entitled to receive 12% per annum dividends, paid monthly.
| 68 |
Conversion. Holders of Series C preferred shares have the following rights with respect to the conversion of Series C preferred shares into shares of our common stock:
| ● | On December 31, 2014 and upon notice provided by the holder to the Company, a holder has the right to convert, at face value per share, all or any portion of their Series C preferred shares into shares of our common stock on the basis of 200 shares of common stock for each share of Series C preferred stock so converted, or if the holder elects to convert on December 31, 2015, such shares will be converted on the basis of 57.1428 shares of common stock for each share of Series C preferred stock (the “Series C Conversion Ratio”). On December 31, 2014, all of the then outstanding Series C preferred shares were converted into Company common stock. | |
| ● | If at any time after the date of issuance of the Series C preferred stock, in the event the Company (i) makes or issues a dividend or other distribution payable in common stock (other than with respect to the Series C preferred stock); (ii) subdivides outstanding shares of common stock into a larger number of shares; or (iii) combines outstanding shares of common stock into a smaller number of shares; or (iv) conducts a rights offering to its existing shareholders, the Series C Conversion Ratio shall be adjusted appropriately. | |
| ● | Except as otherwise provided in the amended and restated articles of incorporation, as amended, if the common stock issuable upon the conversion of the Series C preferred stock shall be changed into the same or different number of shares of any class or classes of stock, whether by capital reorganization, reclassification or otherwise, then in each such event, the holder of each share of Series C preferred stock shall have the right thereafter to convert such share into the kind and amount of shares of stock and other securities and property receivable upon such capital reorganization, reclassification or other change by holders of the number of shares of common stock into which such shares of Series C preferred stock might have been converted immediately prior to such capital reorganization, reclassification or other change. |
Voting. On all matters to come before our shareholders, holders of Series C preferred stock have that number of votes per share (rounded to the nearest whole share) equal to the product of: (a) the number of shares of Series C preferred stock held on the record date for the determination of the holders of the shares entitled to vote, or, if no record date is established, at the date such vote is taken or any written consent of shareholders is first solicited, and (b) 100. The holders of Series C preferred shares vote together with the holders of the outstanding shares of all other capital stock of the Company (including and any other series of preferred stock then outstanding), and not as a separate class, series or voting group.
Redemption and Call Rights. Any time after December 31, 2015, the Company has the right, but not the obligation, to redeem all of the unconverted outstanding shares of Series C preferred stock by paying in cash an amount per share equal to $1.00.
Description of Series D Preferred Stock
Our amended and restated articles of incorporation, as amended, authorizes 173,000 shares of Series D preferred stock, none of which are outstanding as of March 30, 2015. There are no sinking fund provisions applicable to our Series D preferred stock.
Ranking. The Series D preferred stock ranks pari passu with any other series of preferred stock designated by the Company and not designated as senior securities or subordinate to the Series D preferred stock.
Liquidation Preference. In the event of a liquidation or winding up of the Company, a holder of Series D preferred stock will be entitled to receive $1.00 per share of Series D preferred stock.
Dividends. The Series D preferred stock is entitled to receive 12% per annum dividends, paid monthly.
Conversion. Holders of Series D preferred shares have the following rights with respect to the conversion of Series D preferred shares into shares of our common stock:
| ● | On December 31, 2014 and upon notice provided by the holder to the Company, a holder has the right to convert, at face value per share, all or any portion of their Series D preferred shares into shares of our common stock on the basis of 133.3333 shares of common stock for each share of Series D preferred stock so converted, or if the holder elects to convert on December 31, 2015, such shares will be converted on the basis of 50 shares of common stock for each share of Series D preferred stock (the “Series D Conversion Ratio”). On December 31, 2014, all of the then outstanding Series D preferred shares were converted into Company common stock. | |
| ● | If at any time after the date of issuance of the Series D preferred stock, in the event the Company (i) makes or issues a dividend or other distribution payable in common stock (other than with respect to the Series C preferred stock); (ii) subdivides outstanding shares of common stock into a larger number of shares; or (iii) combines outstanding shares of common stock into a smaller number of shares; or (iv) conducts a rights offering to its existing shareholders, the Series D Conversion Ratio shall be adjusted appropriately. |
| 69 |
| ● | Except as otherwise provided in the amended and restated articles of incorporation, as amended, if the common stock issuable upon the conversion of the Series D preferred stock shall be changed into the same or different number of shares of any class or classes of stock, whether by capital reorganization, reclassification or otherwise, then in each such event, the holder of each share of Series D preferred stock shall have the right thereafter to convert such share into the kind and amount of shares of stock and other securities and property receivable upon such capital reorganization, reclassification or other change by holders of the number of shares of common stock into which such shares of Series D preferred stock might have been converted immediately prior to such capital reorganization, reclassification or other change. |
Voting. On all matters to come before our shareholders, holders of Series D preferred stock have that number of votes per share (rounded to the nearest whole share) equal to the product of: (a) the number of shares of Series D preferred stock held on the record date for the determination of the holders of the shares entitled to vote, or, if no record date is established, at the date such vote is taken or any written consent of shareholders is first solicited, and (b) 67. The holders of Series D preferred shares vote together with the holders of the outstanding shares of all other capital stock of the Company (including and any other series of preferred stock then outstanding), and not as a separate class, series or voting group.
Redemption and Call Rights. Any time after December 31, 2015, the Company has the right, but not the obligation, to redeem all of the unconverted outstanding shares of Series D preferred stock by paying in cash an amount per share equal to $1.00.
Description of Series E Preferred Stock
Our amended and restated articles of incorporation, as amended, authorizes 461,000 shares of Series E preferred stock, none of which are outstanding as of March 30, 2015. There are no sinking fund provisions applicable to our Series E preferred stock.
Ranking. The Series E preferred stock ranks pari passu with any other series of preferred stock designated by the Company and not designated as senior securities or subordinate to the Series E preferred stock.
Liquidation Preference. In the event of a liquidation or winding up of the Company, a holder of Series E preferred stock will be entitled to receive $1.00 per share of Series E preferred stock.
Dividends. The Series E preferred stock is entitled to receive 12% per annum dividends, paid monthly.
Conversion. Holders of Series E preferred shares have the following rights with respect to the conversion of Series E preferred shares into shares of our common stock:
| ● | On December 31, 2014 and upon notice provided by the holder to the Company, a holder has the right to convert, at face value per share, all or any portion of their Series E preferred shares into shares of our common stock on the basis of 40 shares of common stock for each share of Series E preferred stock so converted, or if the holder elects to convert on December 31, 2015, such shares will be converted on the basis of 25 shares of common stock for each share of Series E preferred stock (the “Series E Conversion Ratio”). On December 31, 2014, all of the then outstanding Series E preferred shares were converted into Company common stock. | |
| ● | If at any time after the date of issuance of the Series E preferred stock, in the event the Company (i) makes or issues a dividend or other distribution payable in common stock (other than with respect to the Series C preferred stock); (ii) subdivides outstanding shares of common stock into a larger number of shares; or (iii) combines outstanding shares of common stock into a smaller number of shares; or (iv) conducts a rights offering to its existing shareholders, the Series E Conversion Ratio shall be adjusted appropriately. | |
| ● | Except as otherwise provided in the amended and restated articles of incorporation, as amended, if the common stock issuable upon the conversion of the Series E preferred stock shall be changed into the same or different number of shares of any class or classes of stock, whether by capital reorganization, reclassification or otherwise, then in each such event, the holder of each share of Series E preferred stock shall have the right thereafter to convert such share into the kind and amount of shares of stock and other securities and property receivable upon such capital reorganization, reclassification or other change by holders of the number of shares of common stock into which such shares of Series E preferred stock might have been converted immediately prior to such capital reorganization, reclassification or other change. |
| 70 |
Voting. On all matters to come before our shareholders, holders of Series E preferred stock have that number of votes per share (rounded to the nearest whole share) equal to the product of: (a) the number of shares of Series E preferred stock held on the record date for the determination of the holders of the shares entitled to vote, or, if no record date is established, at the date such vote is taken or any written consent of shareholders is first solicited, and (b) 40. The holders of Series E preferred shares vote together with the holders of the outstanding shares of all other capital stock of the Company (including and any other series of preferred stock then outstanding), and not as a separate class, series or voting group.
Redemption and Call Rights. Any time after December 31, 2015, the Company has the right, but not the obligation, to redeem all of the unconverted outstanding shares of Series E preferred stock by paying in cash an amount per share equal to $1.00.
Description of Series F Preferred Stock
Our amended and restated articles of incorporation, as amended, authorizes 1,500,000 shares of Series F preferred stock, 1,400,000 of which are outstanding as of March 30, 2015. There are no sinking fund provisions applicable to our Series F preferred stock.
Ranking. The Series F preferred stock ranks pari passu with any other series of preferred stock subsequently designated by the Company and not designated as senior securities or subordinate to the Series F preferred stock.
Liquidation Preference. In the event of a liquidation or winding up of the Company, a holder of Series F preferred stock will be entitled to receive $1.00 per share of Series F preferred stock.
Dividends. The Series F preferred stock is entitled to receive 12% per annum dividends, paid monthly.
Conversion. Holders of Series F preferred shares have the following rights with respect to the conversion of Series F preferred shares into shares of our common stock:
| ● | On December 31, 2015 and upon notice provided by the holder to the Company, a holder has the right to convert, at face value per share, all or any portion of their Series F preferred shares into shares of our common stock on the basis of 33.3333 shares of common stock for each share of Series F preferred stock so converted (the “Series F Conversion Ratio”). | |
| ● | If at any time after the date of issuance of the Series F preferred stock, in the event the Company (i) makes or issues a dividend or other distribution payable in common stock (other than with respect to the Series F preferred stock); (ii) subdivides outstanding shares of common stock into a larger number of shares; or (iii) combines outstanding shares of common stock into a smaller number of shares; or (iv) conducts a rights offering to its existing shareholders, the Series F Conversion Ratio shall be adjusted appropriately. | |
| ● | Except as otherwise provided in the amended and restated articles of incorporation, as amended, if the common stock issuable upon the conversion of the Series F preferred stock shall be changed into the same or different number of shares of any class or classes of stock, whether by capital reorganization, reclassification or otherwise, then in each such event, the holder of each share of Series F preferred stock shall have the right thereafter to convert such share into the kind and amount of shares of stock and other securities and property receivable upon such capital reorganization, reclassification or other change by holders of the number of shares of common stock into which such shares of Series F preferred stock might have been converted immediately prior to such capital reorganization, reclassification or other change. |
Voting. On all matters to come before our shareholders, holders of Series F preferred stock have that number of votes per share (rounded to the nearest whole share) equal to the product of: (a) the number of shares of Series F preferred stock held on the record date for the determination of the holders of the shares entitled to vote, or, if no record date is established, at the date such vote is taken or any written consent of shareholders is first solicited, and (b) 34. The holders of Series F preferred shares vote together with the holders of the outstanding shares of all other capital stock of the Company (including and any other series of preferred stock then outstanding), and not as a separate class, series or voting group.
Redemption and Call Rights. Any time after December 31, 2015, the Company has the right, but not the obligation, to redeem all of the unconverted outstanding shares of Series F preferred stock by paying in cash an amount per share equal to $1.00.
Transfer Agent
The transfer agent and registrar for our common stock is VStock Transfer, 77 Spruce Street, Suite 201, Cedarhurst, NY 11516.
| 71 |
The validity of the securities offered by this prospectus will be passed upon for us by Legal & Compliance, LLC, 330 Clematis Street, Suite 217, West Palm Beach, Florida 33401.
Our consolidated balance sheets as of December 31, 2014 and 2013 and the related consolidated statement of operations, changes in shareholders’ equity and cash flows for the years ended December 31, 2014 and 2013 included in this prospectus have been audited by Rose, Snyder & Jacobs LLP, independent registered public accounting firm, as indicated in their report with respect thereto, and have been so included in reliance upon the report of such firm given on their authority as experts in accounting and auditing.
DISCLOSURE OF COMMISSION’S POSITION ON INDEMNIFICATION FOR SECURITIES ACT LIABILITIES
Our directors and officers are indemnified as provided by Florida law and our bylaws. We have agreed to indemnify each of our directors and certain officers against certain liabilities, including liabilities under the Securities Act. Insofar as indemnification for liabilities arising under the Securities Act may be permitted to our directors, officers and controlling persons pursuant to the provisions described above, or otherwise, we have been advised that in the opinion of the SEC, such indemnification is against public policy as expressed in the Securities Act and is, therefore, unenforceable. In the event that a claim for indemnification against such liabilities (other than our payment of expenses incurred or paid by our director, officer or controlling person in the successful defense of any action, suit or proceeding) is asserted by such director, officer or controlling person in connection with the securities being registered, we will, unless in the opinion of our counsel the matter has been settled by controlling precedent, submit to a court of appropriate jurisdiction the question whether such indemnification by it is against public policy as expressed in the Securities Act and will be governed by the final adjudication of such issue.
WHERE YOU CAN FIND ADDITIONAL INFORMATION
We have filed with the SEC the registration statement on Form S-1 under the Securities Act for the common stock offered by this prospectus. This prospectus, which is a part of the registration statement, does not contain all of the information in the registration statement and the exhibits filed with it, portions of which have been omitted as permitted by SEC rules and regulations. For further information concerning us and the securities offered by this prospectus, we refer to the registration statement and to the exhibits filed with it. Statements contained in this prospectus as to the content of any contract or other document referred to are not necessarily complete. In each instance, we refer you to the copy of the contracts and/or other documents filed as exhibits to the registration statement.
The registration statement on Form S-1, of which this prospectus forms a part, including exhibits, is available at the SEC’s website at http://www.sec.gov. You may also read and copy any document we file with, or furnish to, the SEC at its public reference facilities:
| Public Reference Room Office | |
| 100 F Street, N.E. | |
| Room 1580 | |
| Washington, D.C. 20549 |
You may also obtain copies of the documents at prescribed rates by writing to the Public Reference Section of the SEC at 100 F Street, N.E., Room 1580, Washington, D.C. 20549. Callers in the United States can also call (202) 551-8090 for further information on the operations of the public reference facilities.
| 72 |
IEG HOLDINGS CORPORATION
CONSOLIDATED FINANCIAL STATEMENTS
DECEMBER 31, 2014 and 2013
| F-1 |

REPORT OF INDEPENDENT REGISTERED PUBLIC ACCOUNTING FIRM
To the Board of Directors and Stockholders of
IEG Holdings Corporation
We have audited the accompanying consolidated financial statements of IEG Holdings Corporation and subsidiaries (collectively the “Company”) which comprise the consolidated balance sheets as of December 31, 2014 and 2013 , and the related consolidated statements of operations, stockholders’ equity (deficit), and cash flows for the years then ended, and related notes to the consolidated financial statements.
Management’s Responsibility for the Financial Statements
Management is responsible for the preparation and fair presentation of these financial statements in accordance with accounting principles generally accepted in the United States of America; this includes the design, implementation, and maintenance of internal control relevant to the preparation and fair presentation of financial statements that are free from material misstatement, whether due to fraud or error.
Auditor’s Responsibility
Our responsibility is to express an opinion on these financial statements based on our audit. We conducted our audit in accordance with auditing standards generally accepted in the United States of America as established by the Auditing Standards Board (United States) and in accordance with auditing standards of the Public Company Accounting Oversight Board (United States). Those standards require that we plan and perform the audit to obtain reasonable assurance about whether the financial statements are free from material misstatement.
An audit involves performing procedures to obtain audit evidence about the amounts and disclosures in the financial statements. The procedures selected depend on the auditor’s judgment, including the assessment of the risks of material misstatement of the financial statements, whether due to fraud or error. In making those risk assessments, the auditor considers internal control relevant to the entity’s preparation and fair presentation of the financial statements in order to design audit procedures that are appropriate in the circumstances, but not for the purpose of expressing an opinion on the effectiveness of the entity’s internal control. The Company is not required to have, nor were we engaged to perform an audit of its internal control over financial reporting. Accordingly, we express no such opinion. An audit also includes evaluating the appropriateness of accounting policies used and the reasonableness of significant accounting estimates made by management, as well as evaluating the overall presentation of the financial statements.
We believe that the audit evidence we have obtained is sufficient and appropriate to provide a basis for our audit opinion.
Opinion
In our opinion, the consolidated financial statements referred to above present fairly, in all material respects, the financial position of IEG Holdings Corporation and subsidiaries as of December 31, 2014 and 2013 , and the results of their operations and their cash flows for the years then ended in accordance with accounting principles generally accepted in the United States of America.
Emphasis-of-matter Regarding Going Concern
The accompanying consolidated financial statements have been prepared assuming that the Company will continue as a going concern. As discussed in Note 1 to the consolidated financial statements, the Company has incurred significant operating losses and negative cash flow from operations since inception. These conditions raise substantial doubt about its ability to continue as a going concern. Management’s plans regarding those matters also are described in Note 1. The consolidated financial statements do not include any adjustments that might result from the outcome of this uncertainty. Our opinion is not modified with respect to that matter.

Rose, Snyder & Jacobs LLP
Encino, California
March 25, 2015
15821 VENTURA BOULEVARD, SUITE 490, ENCINO, CALIFORNIA 91436 PHONE: (818) 461 - 0600 ● FAX: (818) 461 - 0610
| F-2 |
IEG HOLDINGS CORPORATION
DECEMBER 31, 2014 AND DECEMBER 31, 2013
| December 31, 2014 | December 31, 2013 | |||||||
| ASSETS | ||||||||
| CURRENT ASSETS | ||||||||
| Cash and cash equivalents | $ | 433,712 | $ | 281,879 | ||||
| Loans receivable - current, net, note 2 | 567,164 | 64,719 | ||||||
| Other receivables | 25,882 | - | ||||||
| TOTAL CURRENT ASSETS | 1,026,758 | 346,598 | ||||||
| PROPERTY AND EQUIPMENT, net, note 3 | 36,100 | 43,349 | ||||||
| LOANS RECEIVABLE - LONG TERM, net, note 2 | 3,749,152 | 361,394 | ||||||
| OTHER ASSETS | ||||||||
| Security deposits | 39,329 | 39,329 | ||||||
| Loan costs, net | 77,781 | 131,470 | ||||||
| TOTAL OTHER ASSETS | 117,110 | 170,799 | ||||||
| TOTAL ASSETS | $ | 4,929,120 | $ | 922,140 | ||||
| LIABILITIES AND STOCKHOLDERS’ EQUITY (DEFICIT) | ||||||||
| CURRENT LIABILITIES | ||||||||
| Accounts payable and accrued expenses | $ | 172,139 | $ | 323,978 | ||||
| Deferred rent | 28,429 | 48,844 | ||||||
| CEO accrued wages, note 10 | 106,588 | - | ||||||
| Working capital loans, note 5 | - | 140,000 | ||||||
| Current portion of senior debt, note 4 | - | 114,562 | ||||||
| TOTAL CURRENT LIABILITIES | 307,156 | 627,384 | ||||||
| LONG-TERM LIABILITIES | ||||||||
| Senior debt, note 4 | 2,230,000 | 385,438 | ||||||
| Deposit on preferred shares | - | 1,910,774 | ||||||
| TOTAL LIABILITIES | 2,537,156 | 2,923,596 | ||||||
| COMMITMENTS AND CONTINGENCIES, note 9 | ||||||||
| STOCKHOLDERS’ EQUITY (DEFICIT) | ||||||||
| Preferred stock, $0.001 par value; 50,000,000 shares authorized, 2,400,000 shares issued and outstanding, note 6 | 2,400 | - | ||||||
| Common stock, $0.001 par value; 2,500,000,000 shares authorized, 2,158,110,323 and 956,722,830 shares issued and outstanding at December 31, 2014 and 2013 respectively, note 6 | 2,158,111 | 956,723 | ||||||
| Additional paid-in capital | 14,914,705 | 6,323,319 | ||||||
| Accumulated deficit | (14,683,252 | ) | (9,281,498 | ) | ||||
| TOTAL STOCKHOLDERS’ EQUITY (DEFICIT) | 2,391,964 | (2,001,456 | ) | |||||
| TOTAL LIABILITIES AND STOCKHOLDERS’ EQUITY (DEFICIT) | $ | 4,929,120 | $ | 922,140 | ||||
See report of independent registered public accounting firm and notes to consolidated financial statements.
| F-3 |
IEG HOLDINGS CORPORATION
CONSOLIDATED STATEMENTS OF OPERATIONS
FOR THE YEARS ENDED DECEMBER 31, 2014 AND 2013
| 2014 | 2013 | |||||||
| REVENUES | ||||||||
| Interest revenue | $ | 521,018 | $ | 56,585 | ||||
| Other revenue | 8,207 | 6,364 | ||||||
| TOTAL REVENUES | 529,225 | 62,949 | ||||||
| OPERATING EXPENSES | ||||||||
| Salaries and wages | 1,889,136 | 1,345,243 | ||||||
| Other operating expenses | 1,074,409 | 513,197 | ||||||
| Consulting | 871,228 | 422,771 | ||||||
| Provision for credit losses | 614,684 | 63,573 | ||||||
| Advertising | 290,315 | 77,380 | ||||||
| Rent | 250,744 | 290,985 | ||||||
| Travel, meals and entertainment | 376,101 | 95,505 | ||||||
| Depreciation and amortization | 15,054 | 36,885 | ||||||
| Start up costs, note 10 | - | 1,500,000 | ||||||
| TOTAL OPERATING EXPENSES | 5,381,671 | 4,345,539 | ||||||
| LOSS FROM OPERATIONS | (4,852,446 | ) | (4,282,590 | ) | ||||
| OTHER INCOME (EXPENSE) | ||||||||
| Miscellaneous Income | 8,949 | 510 | ||||||
| Interest expense | (558,257 | ) | (195,895 | ) | ||||
| TOTAL OTHER INCOME (EXPENSE) | (549,308 | ) | (195,385 | ) | ||||
| NET LOSS | $ | (5,401,754 | ) | $ | (4,477,975 | ) | ||
| Net loss per share, basic and diluted | $ | (0.00 | ) | $ | (0.01 | ) | ||
| Weighted average number of shares, basic and diluted | 1,334,514,156 | 618,849,992 | ||||||
See report of independent registered public accounting firm and notes to consolidated financial statements.
| F-4 |
IEG HOLDINGS CORPORATION
CONSOLIDATED STATEMENTS OF STOCKHOLDERS’ EQUITY (DEFICIT)
FOR THE YEARS ENDED DECEMBER 31, 2014 AND 2013
| Additional | ||||||||||||||||||||||||||||||||||||||||||||||||||||||||||||||||||||||||
| Common Stock | Series A | Series B | Series C | Series D | Series E | Series F | Paid-in | Subscription | Accumulated | |||||||||||||||||||||||||||||||||||||||||||||||||||||||||||||||
| Shares | Amount | Shares | Amount | Shares | Amount | Shares | Amount | Shares | Amount | Shares | Amount | Shares | Amount | Capital | Receivable | Deficit | Total | |||||||||||||||||||||||||||||||||||||||||||||||||||||||
| Balance, January 1, 2013 | 272,447,137 | $ | 272,447 | - | $ | - | - | $ | - | - | $ | - | - | $ | - | - | $ | - | - | $ | - | $ | 3,464,161 | $ | - | $ | (4,803,523 | ) | $ | (1,066,915 | ) | |||||||||||||||||||||||||||||||||||||||||
| Shares issued for pre-merger shares of shell | 7,484,650 | 7,485 | - | - | - | - | - | - | - | - | - | - | - | - | (7,485 | ) | - | - | - | |||||||||||||||||||||||||||||||||||||||||||||||||||||
| Issuance of shares at $0.02 and $0.03 | 12,491,916 | 12,492 | - | - | - | - | - | - | - | - | - | - | - | - | 287,265 | - | - | 299,757 | ||||||||||||||||||||||||||||||||||||||||||||||||||||||
| Issuance of shares at $0.005 | 664,299,127 | 664,299 | - | - | - | - | - | - | - | - | - | - | - | - | 2,579,378 | - | 3,243,677 | |||||||||||||||||||||||||||||||||||||||||||||||||||||||
| Net loss | - | - | - | - | - | - | - | - | - | - | - | - | - | - | - | - | (4,477,975 | ) | (4,477,975 | ) | ||||||||||||||||||||||||||||||||||||||||||||||||||||
| Balance, December 31, 2013 | 956,722,830 | 956,723 | - | - | - | - | - | - | - | - | - | - | - | - | 6,323,319 | - | (9,281,498 | ) | (2,001,456 | ) | ||||||||||||||||||||||||||||||||||||||||||||||||||||
| Issuance of shares at $0.005 | 611,991,383 | 611,991 | 2,447,966 | - | - | 3,059,957 | ||||||||||||||||||||||||||||||||||||||||||||||||||||||||||||||||||
| Issuance of shares at $0.01, $0.015 and $0.02 | 303,884,449 | 303,885 | 2,791,833 | - | - | 3,095,718 | ||||||||||||||||||||||||||||||||||||||||||||||||||||||||||||||||||
| Issuance of Preferred Shares | - | - | 1,000,000 | 1,000 | - | - | - | - | - | - | - | - | - | - | 999,000 | - | - | 1,000,000 | ||||||||||||||||||||||||||||||||||||||||||||||||||||||
| Issuance of Preferred Shares | - | - | - | - | 410,000 | 410 | - | - | - | - | - | - | - | - | 409,590 | - | - | 410,000 | ||||||||||||||||||||||||||||||||||||||||||||||||||||||
| Issuance of Preferred Shares | - | - | - | - | - | - | 400,025 | 400 | - | - | - | - | - | - | 399,625 | - | - | 400,025 | ||||||||||||||||||||||||||||||||||||||||||||||||||||||
| Issuance of Preferred Shares | - | - | - | - | - | - | - | - | 173,000 | 173 | 172,827 | - | - | 173,000 | ||||||||||||||||||||||||||||||||||||||||||||||||||||||||||
| Issuance of Preferred Shares | - | - | - | - | - | - | - | - | - | - | 461,000 | 461 | - | - | 460,539 | - | - | 461,000 | ||||||||||||||||||||||||||||||||||||||||||||||||||||||
| Issuance of Preferred Shares | - | - | - | - | - | - | - | - | - | - | - | - | 1,400,000 | 1,400 | 1,398,600 | - | - | 1,400,000 | ||||||||||||||||||||||||||||||||||||||||||||||||||||||
| Conversion of Preferred Shares to Common Shares | 285,511,661 | 285,512 | - | - | (410,000 | ) | (410 | ) | (400,025 | ) | (400 | ) | (173,000 | ) | (173 | ) | (461,000 | ) | (461 | ) | - | - | (284,068 | ) | - | - | - | |||||||||||||||||||||||||||||||||||||||||||||
| Preferred Dividends | - | - | - | - | - | - | - | - | - | - | - | - | - | - | (204,526 | ) | - | - | (204,526 | ) | ||||||||||||||||||||||||||||||||||||||||||||||||||||
| Net loss | - | - | - | - | - | - | - | - | - | - | - | - | - | - | - | - | (5,401,754 | ) | (5,401,754 | ) | ||||||||||||||||||||||||||||||||||||||||||||||||||||
| Balance, December 31, 2014 | 2,158,110,323 | $ | 2,158,111 | 1,000,000 | $ | 1,000 | - | $ | - | - | $ | - | - | $ | - | - | $ | - | 1,400,000 | $ | 1,400 | $ | 14,914,705 | $ | - | $ | (14,683,252 | ) | $ | 2,391,964 | ||||||||||||||||||||||||||||||||||||||||||
See report of independent registered public accounting firm and notes to consolidated financial statements.
| F-5 |
IEG HOLDINGS CORPORATION
CONSOLIDATED STATEMENTS OF CASH FLOWS
FOR THE YEARS ENDED DECEMBER 31, 2014 AND 2013
| December 31, 2014 | December 31, 2013 | |||||||
| CASH FLOWS FROM OPERATING ACTIVITIES: | ||||||||
| Net loss | $ | (5,401,754 | ) | $ | (4,477,975 | ) | ||
| Adjustments to reconcile net loss to net cash used in operating activities: | ||||||||
| Provision for credit losses | 614,684 | 63,462 | ||||||
| Depreciation and amortization | 15,054 | 36,885 | ||||||
| Amortization of loan costs | 53,689 | 48,281 | ||||||
| Changes in assets - (increase) decrease: | ||||||||
| Other receivables | (25,882 | ) | - | |||||
| Deposits | - | (4,875 | ) | |||||
| Loan costs | - | (15,450 | ) | |||||
| Changes in liabilities - increase (decrease): | ||||||||
| Accounts payable and accrued expenses | 554,867 | 373,964 | ||||||
| Deferred salary | 907,598 | 952,903 | ||||||
| Deferred rent | (20,415 | ) | - | |||||
| Payable for Rights Sales Agreement | - | 1,500,000 | ||||||
| NET CASH USED IN OPERATING ACTIVITIES | (3,302,159 | ) | (1,522,805 | ) | ||||
| CASH FLOWS FROM INVESTING ACTIVITIES: | ||||||||
| Loans receivable originated | (4,781,022 | ) | (403,000 | ) | ||||
| Loans receivable repaid | 276,077 | 43,911 | ||||||
| Purchases of property and equipment | (9,009 | ) | - | |||||
| Advances to officer | - | (267,832 | ) | |||||
| Advances to IEG Holdings Limited ACN 131 987 838 | - | (966,620 | ) | |||||
| NET CASH USED IN INVESTING ACTIVITIES | (4,513,954 | ) | (1,593,541 | ) | ||||
| CASH FLOWS FROM FINANCING ACTIVITIES: | ||||||||
| Proceeds from long-term debt | 1,730,000 | 250,000 | ||||||
| Proceeds from short-term loan | 669,980 | 500,000 | ||||||
| Payments on short-term loan | (419,980 | ) | (360,000 | ) | ||||
| Proceeds from issuance of common stock | 4,267,949 | 1,892,861 | ||||||
| Deposits on preferred stock | 1,834,112 | 936,763 | ||||||
| Preferred dividends paid | (114,115 | ) | - | |||||
| NET CASH PROVIDED BY FINANCING ACTIVITIES | 7,967,946 | 3,219,624 | ||||||
| NET INCREASE (DECREASE) IN CASH AND CASH EQUIVALENTS | 151,833 | 103,278 | ||||||
| CASH AND CASH EQUIVALENTS, BEGINNING OF YEAR | 281,879 | 178,601 | ||||||
| CASH AND CASH EQUIVALENTS, END OF YEAR | $ | 433,712 | $ | 281,879 | ||||
| Supplemental disclosures: | ||||||||
| Interest paid in cash | $ | 477,157 | $ | 94,125 | ||||
| Income taxes paid in cash | $ | - | $ | - | ||||
| Deposit on preferred stock in lieu of accrued compensation | $ | 85,989 | $ | 914,011 | ||||
| Issuance of common stock in lieu of payment of deferred salary | $ | 1,000,000 | $ | 1,172,823 | ||||
| Issuance of common stock in lieu of payment of dividend on preferred shares | $ | 90,411 | $ | - | ||||
| Issuance of common stock in lieu of loan payments | $ | 390,000 | $ | - | ||||
See report of independent registered public accounting firm and notes to consolidated financial statements.
| F-6 |
IEG HOLDINGS CORPORATION
NOTES TO CONSOLIDATED FINANCIAL STATEMENTS
DECEMBER 31, 2014 AND 2013
| 1. | SUMMARY OF SIGNIFICANT ACCOUNTING POLICIES |
Nature of Business
The principal business activity of the Company is providing unsecured consumer loans ranging from $5,000 - $10,000 over a five year term. The loans are offered under the consumer brand “Mr. Amazing Loans”. The Company is headquartered in Las Vegas, Nevada and originates consumer loans in the states of Arizona, Florida, Georgia, Illinois, Missouri, Nevada, New Jersey, Oregon, Pennsylvania, Texas, Utah, and Virginia via its online platform and distribution network. The Company is a licensed direct lender with state licenses and/or certificates of authority to lend in these 12 states and offers all loans within the prevailing statutory rates.
Organization and Basis of Accounting
Investment Evolution Global Corporation (“IEGC”) was incorporated in the state of Delaware on February 20, 2008. On March 14, 2013, IEGC consummated a reverse merger transaction with IEG Holdings Corporation (“IEG Holdings”) (f/k/a Ideal Accents, Inc.). As a result of the reverse merger, the shareholders of IEGC received 90,815.71 shares of common stock in IEG Holdings for each share of IEGC, so that they own approximately 99.1% of the issued and outstanding common shares of IEG Holdings immediately after the transaction. For accounting purposes, the reverse merger has been treated as an acquisition of IEG Holdings by IEGC (the accounting acquirer) and a recapitalization of IEGC. Immediately prior to the reverse merger, IEG Holdings effected a 1-for-6 reverse stock split. The stockholders’ equity has been restated to retroactively reflect the number of shares of IEGC, using the capital structure of IEG Holdings and to present the accumulated deficit of IEGC as of the date of the merger.
These consolidated financial statements include the operations of IEG Holdings Corporation and its wholly-owned subsidiaries Investment Evolution Global Corporation, Investment Evolution Corporation, and IEC SPV, LLC (collectively the “Company”). All inter-company transactions and balances have been eliminated in consolidation.
The Company’s accounting and reporting policies are in accordance with U.S. generally accepted accounting principles and conform to general practices within the consumer finance industry.
Going Concern
The consolidated financial statements have been prepared in conformity with accounting principles generally accepted in the United States of America, which contemplate continuation of the Company as a going concern. The Company has reported recurring losses and has not generated positive net cash flows from operations. These conditions raise substantial doubt about the Company’s ability to continue as a going concern. Management intends to raise capital funding sufficient to continue operations through January 2017 via a public offering of equity consisting of common stock and/or preferred stock. This additional working capital will enable the Company to increase loan volume utilizing its existing $10 million credit facility. If the Company is not successful in raising sufficient capital, it may have to delay or reduce expenses, or curtail operations. The accompanying consolidated financial statements do not include any adjustments to reflect the possible future effects on the recoverability and classification of assets or the amounts and classification of liabilities that could result should the Company not continue as a going concern.
Use of Estimates
The preparation of consolidated financial statements in conformity with accounting principles generally accepted in the United States of America requires management to make estimates and assumptions that affect the reported amounts and disclosures. Management uses its historical records and knowledge of its business in making these estimates. Accordingly, actual results may differ from these estimates.
Cash and Cash Equivalents
For the purpose of the statement of cash flows, the Company considers cash equivalents to include short-term, highly liquid investments with an original maturity of three months or less.
| F-7 |
IEG HOLDINGS CORPORATION
NOTES TO CONSOLIDATED FINANCIAL STATEMENTS
DECEMBER 31, 2014 AND 2013
| 1. | SUMMARY OF SIGNIFICANT ACCOUNTING POLICIES (Continued) |
Loans Receivable and Interest Income
The Company is licensed to originate consumer loans in the states of Arizona, Florida, Georgia, Illinois, Missouri, Nevada, New Jersey, Oregon, Pennsylvania, Texas, Utah, and Virginia. During fiscal 2014 and 2013, the Company originated $2,000, $3,000, $5,000 and $10,000 loans with terms ranging from three to five years, and in 2014 streamlined its product offering to $5,000 and $10,000 loans over a five year term. The Company offers its loans at or below the prevailing statutory rates. Loans are carried at the unpaid principal amount outstanding, net of an allowance for credit losses.
The Company calculates interest revenue using the interest yield method. Charges for late payments are credited to income when collected.
Accrual of interest income on loans receivable is suspended when no payment has been received on account for 60 days or more on a contractual basis, at which time a loan is considered delinquent. Payments received on nonaccrual financing loans are first applied to the unpaid accrued interest and then principal. Loans are returned to active status and accrual of interest income is resumed when all of the principal and interest amounts contractually due are brought current; at which time management believes future payments are reasonably assured. At December 31, 2014, 49 loans with a total balance of $200,596 were delinquent.
Allowance for Credit Losses
The Company maintains an allowance for credit losses due to the fact that it is probable that a portion of the loans receivable will not be collected. The allowance is estimated by management based on various factors, including specific circumstances of the individual loans, management’s knowledge of the industry, and the experience and trends of other companies in the same industry.
Our portfolio of loans receivable consists of a large number of relatively small, homogenous accounts. The allowance for credit losses is determined using a systematic methodology, based on a combination of historical bad debt of comparable companies and industry index. Impaired loans are considered separately and 100% charged off.
The allowance for credit losses is primarily based upon models that analyze specific portfolio statistics and also reflect, management’s judgment regarding overall accuracy. We take into account several factors, including the customer’s transaction history, specifically the timeliness of customer payments, the remaining contractual term of the loan, and the outstanding balance of the loan.
Impaired Loans
The
Company assesses loans for impairment individually when a loan is 90 days past due. The Company defines impaired loans as bankrupt
accounts and accounts that are 184 days or more past due. In accordance with the Company’s charge-off policy, once a loan
is deemed uncollectible, 100% of the remaining balance is charged-off. Loans can also be charged off when deemed uncollectable
due to consumer specific circumstances.
The Company does not accrue interest on impaired loans and any recoveries
of impaired loans are recorded to the allowance for credit losses. Changes in the allowance for credit losses are recorded as
operating expenses in the accompanying statement of operations.
Property and Equipment
Property and equipment are stated at cost. Depreciation and amortization are being provided using the straight-line method over the estimated useful lives of the assets as follows:
| Classification | Life | |
| Computer equipment | 3-5 years | |
| Furniture and fixtures | 8 years |
| F-8 |
IEG HOLDINGS CORPORATION
NOTES TO CONSOLIDATED FINANCIAL STATEMENTS
DECEMBER 31, 2014 AND 2013
| 1. | SUMMARY OF SIGNIFICANT ACCOUNTING POLICIES (Continued) |
The Company amortizes its leasehold improvements over the shorter of their economic lives, which are generally five years, or the lease term that considers renewal periods that are reasonably assured. Expenses for repairs and maintenance are charged to expense as incurred, while renewals and betterments are capitalized. When assets are retired or otherwise disposed of, the cost and accumulated depreciation are removed from the accounts and any gain or loss is reflected in the consolidated statement of operations.
Operating Leases
The Company’s office leases typically have a lease term of three to five years and contain lessee renewal options and cancellation clauses in the event of regulatory changes.
Loan Costs
Loan costs consist of the cost of acquiring the $3 million credit facility and the cost of increasing the facility from $3 million to $10 million, including broker success fees and legal fees. These costs are amortized over four years, the period of the credit facility. Accumulated amortization of loan costs amounted to $127,704 and $74,105 at December 31, 2014 and 2013, respectively.
Income Taxes
We account for income taxes using the liability method in accordance with FASB Accounting Standards Codification (“ASC”) 740 “Income Taxes”. To date, no current income tax liability has been recorded due to our accumulated net losses. Deferred income tax assets and liabilities are recognized for temporary differences between the financial statement carrying amounts of assets and liabilities and the amounts that are reported in the income tax returns. Our net deferred income tax assets have been fully reserved by a valuation allowance due to the uncertainty of our ability to realize future taxable income and to recover our net deferred income tax assets.
Advertising Costs
Advertising costs are expensed as incurred. Advertising costs amounted to $290,315 and $77,380 at December 31, 2014 and 2013, respectively.
Earnings and loss per Share
The Company computes net earnings (loss) per share in accordance with ASC 260-10 that establishes standards for computing and presenting net earnings (loss) per shares. Basic earnings (loss) per share are computed by dividing net income (loss) by the weighted average number of common shares outstanding during the period. Diluted earnings per share is computed similar to basic earnings per share except that the denominator is increased to include the number of additional common shares that would have been outstanding if the potential common shares, if any, had been issued and if the additional common shares were dilutive.
Reclassifications
Certain numbers from 2013 have been reclassified to conform with the current year presentation.
Fair Value of Financial Instruments
The Company has adopted guidance issued by the FASB that defines fair value, establishes a framework for measuring fair value in accordance with existing generally accepted accounting principles, and expands disclosures about fair value measurements. Assets and liabilities recorded at fair value in the consolidated balance sheets are categorized based upon the level of judgment associated with the inputs used to measure their fair value. The categories are as follows:
| F-9 |
IEG HOLDINGS CORPORATION
NOTES TO CONSOLIDATED FINANCIAL STATEMENTS
DECEMBER 31, 2014 AND 2013
| 1. | SUMMARY OF SIGNIFICANT ACCOUNTING POLICIES (Continued) |
| Level I | Inputs are unadjusted, quoted prices for identical assets or liabilities in active markets at the measurement date. | |
| Level II | Inputs, other than quoted prices included in Level I, that are observable for the asset or liability through corroboration with market data at the measurement date. | |
| Level III | Unobservable inputs that reflect management’s best estimate of what market participants would use in pricing the asset or liability at the measurement date. |
At December 31, 2014 and 2013, the only financial instruments that are subject to these classifications are cash and cash equivalents, which are considered Level I assets.
Carrying amounts reported in the consolidated balance sheets for receivables, accounts payable, and accrued expenses approximate fair value because of their immediate or short-term nature. The fair value of borrowings is not considered to be significantly different than its carrying amount because the stated rates for such debt reflect current market rates and conditions.
| 2. | LOANS RECEIVABLE |
Loans receivable consisted of the following at December 31:
| 2014 | 2013 | |||||||
| Loans receivable | $ | 4,913,279 | $ | 487,432 | ||||
| Allowance for credit losses | (596,963 | ) | (61,319 | ) | ||||
| Loans receivable, net | 4,316,316 | 426,113 | ||||||
| Loan receivables, current | 567,164 | 64,719 | ||||||
| Loan receivables, non current | $ | 3,749,152 | $ | 361,394 | ||||
A reconciliation of the allowance for credit losses consist of the following at December 31:
| 2014 | 2013 | |||||||
| Beginning balance | $ | 61,319 | $ | 17,777 | ||||
| Provision for credit losses | 614,684 | 63,492 | ||||||
| Loans charged off | (79,040 | ) | (19,950 | ) | ||||
| Ending balance | $ | 596,963 | $ | 61,319 | ||||
| Basis of Assessment: | ||||||||
| Individually | $ | - | $ | - | ||||
| Collectively | $ | 596,963 | $ | 61,319 | ||||
| F-10 |
IEG HOLDINGS CORPORATION
NOTES TO CONSOLIDATED FINANCIAL STATEMENTS
DECEMBER 31, 2014 AND 2013
| 2. | LOANS RECEIVABLE (Continued) |
The following is an age analysis of past due receivables as of December 31, 2014 and 2013:
| 30-59 Days Past Due | 60-89 Days Past Due | Greater Than 90 Days | Total Past Due | Current | Total Financing Receivables | Recorded Investment > 90 Days and Accruing | |||||||||||||||||||||||
| 2014 | $ | 65,684 | $ | 76,198 | $ | 124,397 | $ | 266,279 | $ | 4,647,000 | $ | 4,913,279 | $ | 124,397 | |||||||||||||||
| 2013 | $ | 17,760 | $ | 7,056 | $ | 4,469 | $ | 29,285 | $ | 458,147 | $ | 487,432 | $ | 4,469 | |||||||||||||||
The Company’s primary credit quality indicator is the customer’s Vantage credit score as determined by Experian on the date of loan origination. The Company does not update the customer’s credit profile during the contractual term of the loan.
The following is a summary of the loan receivable balance as of December 31, 2014 and 2013 by credit quality indicator:
| Credit Score | 2014 | 2013 | ||||||
| Below 550 | $ | - | $ | - | ||||
| 551-600 | 299,040 | 3,948 | ||||||
| 601-650 | 2,180,507 | 157,886 | ||||||
| 651-700 | 1,737,587 | 192,561 | ||||||
| 701-750 | 558,305 | 108,630 | ||||||
| 751-800 | 113,581 | 14,859 | ||||||
| 801-850 | 24,259 | 9,549 | ||||||
| $ | 4,913,279 | $ | 487,432 | |||||
| 3. | PROPERTY AND EQUIPMENT |
At December 31, 2014 and 2013, property and equipment consists of the following:
| 2014 | 2013 | |||||||
| Computer equipment | $ | 120,513 | $ | 120,513 | ||||
| Furniture and fixtures | 22,323 | 13,314 | ||||||
| Leasehold improvements | 55,102 | 57,980 | ||||||
| 197,938 | 191,807 | |||||||
| Less accumulated depreciation and | ||||||||
| amortization | 161,838 | 148,458 | ||||||
| Total | $ | 36,100 | $ | 43,349 | ||||
Depreciation of property and equipment amounted to $15,054 and $36,885
during the years ended December 31, 2014 and 2013, respectively, are included in the accompanying statements of operations in
operating expenses.
| F-11 |
IEG HOLDINGS CORPORATION
NOTES TO CONSOLIDATED FINANCIAL STATEMENTS
DECEMBER 31, 2014 AND 2013
| 4. | LONG TERM DEBT |
The Company has a credit facility that provides for borrowings of up to $10 million with $2,230,000 and $500,000 outstanding at December 31, 2014, and December 31, 2013, respectively, subject to a borrowing base formula. The Company may borrow, at its option, at the rate of 18% with a minimum advance of $25,000. As of December 31, 2014 the Company’s effective interest rate was 18% and the unused amount available under the credit line was $7.77 million. Proceeds from this credit facility are used to fund loans to consumers. The credit facility revolving period, during which interest only payments are due, was extended to June 2016 under an amendment to the loan agreement.
Upon conversion to a term loan, monthly principal and interest payments equal to 100% of the consumer loan proceeds will be due. This note matures on June 1, 2016.
Substantially all of the Company’s assets are pledged as collateral for borrowings under the revolving credit agreement.
Future minimum payments on the credit facility at December 31, 2014 are as follows:
| Years ending December 31 | ||||
| 2015 | - | |||
| 2016 | 2,230,000 | |||
| $ | 2,230,000 | |||
| 5. | WORKING CAPITAL LOANS |
On March 19, 2013, the Company secured a $220,000 working capital loan to expand from Clem Tacca. The Company repaid $264,000 to Clem Tacca on June 10, 2013 which comprised full repayment of $220,000 loan principal and a $44,000 facility fee recorded as interest expense.
On September 6, 2013, the Company secured a $180,000 working capital loan from Clem Tacca. The Company repaid $90,000 on November 6, 2013, $50,000 on December 16, 2013, and $62,000 on March 31, 2014 which comprised full repayment of $180,000 loan principal advanced and a $22,000 facility fee recorded as interest expense.
On October 15, 2013, the Company secured a $100,000 loan from Domenic Tacca Pty Ltd. The company repaid $132,500 on May 1, 2014 which comprised full repayment of $100,000 loan principal advanced and a $32,500 facility fee recorded as interest expense.
On January 29 2014, the Company received $60,000 of a $265,000 loan from Willoughby Family Trust, an investor in the Company. The Company received an additional $140,000 on February 11 and an additional $65,000 on March 10, 2014. The Company repaid $110,000 in cash on June 30, 2014, and $200,000 was an offset of balance due for subscription receivable, which comprised full repayment of $265,000 loan principal and a $45,000 facility fee recorded as interest expense.
On February 26, 2014, the Company received $85,000 of a working capital loan of up to $245,000 from Dr. L. Prasad, an investor in the Company. The Company received an additional $25,000 on March 27, 2014, repaid $25,000 on April 2, 2014 and received an additional $30,000 on April 22, 2014. The Company repaid $139,500 on May 1, 2014 which comprised full repayment of $115,000 outstanding loan principal and a $24,500 facility fee recorded as interest expense.
On July 13, 2014, the Company secured a $100,000 working capital loan to expand from Dr. L Prasad, an investor in the Company. The Company repaid $115,000 on September 30, 2014 which comprised full repayment of $100,000 loan principal and a $15,000 facility fee recorded as interest expense.
| F-12 |
IEG HOLDINGS CORPORATION
NOTES TO CONSOLIDATED FINANCIAL STATEMENTS
DECEMBER 31, 2014 AND 2013
| 5. | WORKING CAPITAL LOANS (Continued) |
On July 14, 2014, the Company secured a $90,000 working capital loan to expand from Willoughby Family Trust, an investor in the Company. The Company repaid $9,000 cash on September 8, 2014, and $90,000 was an offset of balance due for subscription receivable, which comprised full repayment of $90,000 loan principal and a $9,000 facility fee recorded as interest expense.
On July 28, 2014, the Company secured a $100,000 working capital loan to expand from Domenic Tacca, an investor in the Company. The Company repaid $115,000 on September 30, 2014 which comprised full repayment of $100,000 loan principal and a $15,000 facility fee recorded as interest expense.
The effective interest rate on these notes is 43.7% and 35.6% for the years ended December 31, 2014 and 2013 respectively.
| 6. | STOCKHOLDERS’ EQUITY |
The aggregate number of shares which the Company has the authority to issue is 2,550,000,000 shares, of which 2,500,000,000 shares are common stock, par value $0.001 per share, and 50,000,000 shares are preferred stock , par value $0.001 per shares. The Board of Directors is authorized at any time, and from time to time, to provide for the issuance of Preferred Stock in one or more series, and to determine the designations, preferences, limitations and relative or other rights of the Preferred Stock or any series thereof.
The stockholders’ equity has been restated to retroactively reflect the number of shares of Investment Evolution Global Corporation, using the capital structure of IEG Holdings Corporation and to present the accumulated deficit of Investment Evolution Global Corporation as of the date of the merger.
During the years ended December 31, 2014, and 2013 the Company issued 915,875,832 shares at a price of $0.005, $0.01, $0.015, and $0.02 per share and 676,791,043 shares at a price of $0.005, $0.02 and $0.03 per share, respectively, in accordance with rights offerings to existing stockholders of the Company.
On March 31, 2014 the Board of Directors resolved to increase the authorized number of common stock from 1,000,000,000 to 2,500,000,000. In addition, the Board of Directors authorized to issue Series A, B, C and D of Preferred Stock, par value $0.001 per share.
On March 31, 2014 the Company issued 1,983,025 shares of convertible preferred stock (“Preferred Stock”), which is allocated as follows:
Series A: 1,000,000 shares, Series B: 410,000 shares, Series C: 400,025 shares and Series D: 173,000 shares. 1,000,000 shares of Series A Preferred Stock were issued to the Company’s President and Chief Executive Officer, Mr. Paul Mathieson, in consideration for $1,000,000 owed to him.
On November 19, 2014 the Company issued 1,861,000 shares of Preferred Stock, which is allocated as follows:
Series E: 461,000 shares and Series F: 1,400,000 shares.
On December 31, all holders of Series B, Series C, Series D, and Series E Preferred Stock elected to convert their shares to Common Stock, which was distributed as follows:
Series B: 410,000 shares of preferred stock converted to 164,000,000 shares of common stock
Series C: 400,025 shares of preferred stock converted to 80,005,000 shares of common stock
Series D: 173,000 shares of preferred stock converted to 23,066,661 shares of common stock
Series E: 461,000 shares of preferred stock converted to 18,440,000 shares of common stock.
The Preferred Stock accrues dividends at the rate of 12% per annum paid monthly. Each series of preferred stock ranks pari-passu with each other series of preferred stock, and senior to the common stock of the Company, as to dividends, and upon liquidation, dissolution or a winding up of the Company. In the event of a liquidation or winding up of the Corporation, holders of the Preferred Stock shall be entitled to receive the Stated Value of $1 per share.
| F-13 |
IEG HOLDINGS CORPORATION
NOTES TO CONSOLIDATED FINANCIAL STATEMENTS
DECEMBER 31, 2014 AND 2013
| 6. | STOCKHOLDERS’ EQUITY (Continued) |
Series A Preferred Stock
During the years ended December 31, 2014 and 2013, the Company issued 1,000,000 and 0 shares of Series A convertible preferred stock, respectively, with a par value of $0.001 per share. Each share is convertible into 400 shares of common stock at the option of the holder any time after December 31, 2014. The holder of the shares is also entitled to vote at a ratio of 1001 votes for each share of preferred stock.
Series B Preferred Stock
During the years ended December 31, 2014 and 2013, the Company issued 410,000 and 0 shares of Series B convertible preferred stock, respectively, with a par value of $0.001 per share. Each share was converted into 400 shares of common stock at the option of the holder on December 31, 2014, for a total issuance of 164,000,000 shares on December 31, 2014.
Series C Preferred Stock
During the years ended December 31, 2014 and 2013, the Company issued 400,025 and 0 shares of Series C convertible preferred stock, respectively, with a par value of $0.001 per share. Each share was converted into 200 shares of common stock at the option of the holder on December 31, 2014, for a total issuance of 80,005,000 shares on December 31, 2014.
Series D Preferred Stock
During the years ended December 31, 2014 and 2013, the Company issued 173,000 and 0 shares of Series D convertible preferred stock, respectively, with a par value of $0.001 per share. Each share was converted into 133.3333 shares of common stock at the option of the holder on December 31, 2014, for a total issuance of 23,066,661 shares on December 31, 2014.
Series E Preferred Stock
During the years ended December 31, 2014 and 2013, the Company issued 461,000 and 0 shares of Series E convertible preferred stock, respectively, with a par value of $0.001 per share. Each share was converted into 40 shares of common stock at the option of the holder on December 31, 2014, for a total issuance of 18,440,000 shares on December 31, 2014.
Series F Preferred Stock
During the years ended December 31, 2014 and 2013, the Company issued 1,400,000 and 0 shares of Series F convertible preferred stock, respectively, with a par value of $0.001 per share. Each share is convertible into 33.3333 shares of common stock at the option of the holder on December 31, 2015. The holder of the shares is also entitled to vote at a ratio of 33.3333 votes for each share of preferred stock. Any time after December 31, 2015, the Company also has the right to redeem the shares at a redemption value of $1 per share.
| 7. | INCOME TAXES |
The difference between income tax expense attributable to continuing operations and the amount of income tax expense that would result from applying domestic federal statutory rates to pre-tax income (loss) is mainly related to an increase in the valuation allowance. Valuation allowances are established, when necessary, to reduce deferred income tax assets to the amount expected to be realized. Deferred income tax assets are mainly related to net operating loss carryforwards.
Management has chosen to take a 100% valuation allowance against the deferred income tax asset until such time as management believes that its projections of future profits make the realization of the deferred income tax assets more likely than not. Significant judgment is required in the evaluation of deferred income tax benefits and differences in future results from management’s estimates could result in material differences.
As of December 31, 2014, the Company is in the process of determining the exact amount of loss carryforwards that may potentially be used to offset future Federal taxable income, which will expire through 2034. In the event of statutory ownership changes, the amount of net operating loss carryforward that may be utilized in future years is subject to significant limitations.
| F-14 |
IEG HOLDINGS CORPORATION
NOTES TO CONSOLIDATED FINANCIAL STATEMENTS
DECEMBER 31, 2014 AND 2013
| 7. | INCOME TAXES (Continued) |
The Company has adopted guidance issued by the FASB that clarifies the accounting for uncertainty in income taxes recognized in an enterprise’s financial statements and prescribes a recognition threshold of more likely than not and a measurement process for financial statement recognition and measurement of a tax position taken or expected to be taken in a tax return. In making this assessment, a company must determine whether it is more likely than not that a tax position will be sustained upon examination, based solely on the technical merits of the position and must assume that the tax position will be examined by taxing authorities. The Company’s policy is to include interest and penalties related to unrecognized tax benefits in income tax expense. Interest and penalties totaled $0 for the years ended December 31, 2014 and 2013. The Company files income tax returns with the Internal Revenue Service (“IRS”) and the states of Arizona, Florida, Georgia, Illinois, Missouri, Nevada, New Jersey, Oregon, Pennsylvania, Texas, Utah, and Virginia. All of the Company’s tax filings are still subject to examination. The Company’s net operating loss carryforwards are subject to IRS examination until they are fully utilized and such tax years are closed.
We utilize FASB ASC 740-10, “Income Taxes” which requires the recognition of deferred tax assets and liabilities for the expected future tax consequences of events that have been included in the financial statements or tax returns.
Under this method, deferred income taxes are recognized for the tax consequences in future years of differences between the tax bases of assets and liabilities and their financial reporting amounts at each year end based on enacted tax laws and statutory tax rates applicable to the periods in which the differences are expected to affect taxable income. Valuation allowances are established, when necessary, to reduce deferred tax assets to the amount expected to be realized. The provision for income taxes represents the tax payable for the period and the change during the period in deferred tax assets and liabilities.
The components of the income tax provision for fiscal year 2014 and 2013 were as follows:
| 2014 | 2013 | |||||||
| Current | ||||||||
| Federal | $ | 0 | $ | 0 | ||||
| State | 0 | 0 | ||||||
| 0 | 0 | |||||||
| Deferred | ||||||||
| Federal | 0 | 0 | ||||||
| State | 0 | 0 | ||||||
| 0 | 0 | |||||||
| Total | $ | 0 | $ | 0 | ||||
A reconciliation of the expected income tax (benefit) computed using the federal statutory income tax rate to the Company’s effective income tax rate is as follows for fiscal year 2014 and 2013:
| 2014 | 2013 | |||||||
| Income tax computed at federal statutory tax rate | -34.0 | % | -34.0 | % | ||||
| Non-deductible expenses | 0.6 | 11.4 | ||||||
| Change in Valuation allowance | 33.4 | 22.6 | ||||||
| Total | 0 | % | 0 | % | ||||
| F-15 |
IEG HOLDINGS CORPORATION
NOTES TO CONSOLIDATED FINANCIAL STATEMENTS
DECEMBER 31, 2014 AND 2013
| 7. | INCOME TAXES (Continued) |
Significant components of the Company’s deferred tax assets and liabilities for income taxes for the fiscal years ended December 31, 2014 and 2013 are as follows:
| 2014 | 2013 | |||||||
| Deferred tax assets | ||||||||
| Provision for credit losses | $ | 200,000 | $ | 20,000 | ||||
| Deferred rent | 10,000 | 16,000 | ||||||
| Deferred expenses | 600,000 | 600,000 | ||||||
| Net Operating loss carryforwards | 3,450,000 | 1,850,000 | ||||||
| Total deferred tax assets | 4,260,000 | 2,486,000 | ||||||
| Less: Valuation allowance | (4,260,000 | ) | (2,486,000 | ) | ||||
| Net deferred tax assets | $ | 0 | $ | 0 | ||||
| 8. | CONCENTRATION OF CREDIT RISK |
The Company’s portfolio of finance receivables is with consumers living throughout Arizona, Florida, Georgia, Illinois, Missouri, Nevada, New Jersey, Oregon, Pennsylvania, Texas, Utah, and Virginia and consequently such consumers’ ability to honor their installment contracts may be affected by economic conditions in these areas.
The Company maintains cash at financial institutions which may, at times,
exceed federally insured limits.
| 9. | COMMITMENTS AND CONTINGENCIES |
Operating Leases
The
Company leases its operating facilities under non-cancelable operating leases that expire through August 2016. Total rent expense
for the years ended December 31, 2014 and 2013 was $250,744 and $290,985, respectively. The Company
is responsible for certain operating expenses in connection with these leases. The following is a schedule, by year, of future
minimum rental payments required under non-cancelable operating leases in excess of one year as of December 31, 2014:
| Years ending December 31, | ||||
| 2015 | $ | 171,767 | ||
| 2016 | $ | 83,755 | ||
The Chicago, Phoenix and West Palm Beach offices were vacated in 2013 after obtaining special approval from the Illinois, Arizona and Florida Commissioners to operate the state licenses without having a physical office location in each state. The Company subleased the Chicago office in September 2014 and is currently looking to sublease the remaining two unused offices which could reduce future required rental payments.
Legal Matters
From time to time, the Company may get involved in legal proceedings in the normal course of its business. The Company is not involved in any legal proceedings at the present time.
Professional Employment Contract
The Company has a professional employment contract with its Chief Executive Officer (“CEO”), according to which, the Company paid $300,000 salary plus health insurance and $1,000,000 bonus for year ended December 31, 2014. Commencing January 1, 2015 the Company is obligated to pay its CEO $1,000,000 salary annually plus health insurance, with a discretionary bonus to be determined by the IEG Holdings Corporation Board on December 31, 2015.
| F-16 |
IEG HOLDINGS CORPORATION
NOTES TO CONSOLIDATED FINANCIAL STATEMENTS
DECEMBER 31, 2014 AND 2013
| 9. | COMMITMENTS AND CONTINGENCIES (Continued) |
Regulatory Requirements
State statutes authorizing the Company’s products and services typically provide state agencies that regulate banks and financial institutions with significant regulatory powers to administer and enforce the law. Under statutory authority, state regulators have broad discretionary power and may impose new licensing requirements, interpret or enforce existing regulatory requirements in different ways, or issue new administrative rules. In addition, when the staff of state regulatory bodies change, it is possible that the interpretations of applicable laws and regulations may also change.
| 10. | RELATED PARTY TRANSACTIONS |
Chief Executive Officer
Compensation to our Chief Executive Officer under the Professional Employment Agreement totaled $1,300,000 for the year ended December 31, 2014. $1,000,000 was offset against common stock subscription and $85,989 was offset against preferred stock subscription. The balance of deferred salary amounted to $106,588 at December 31, 2014.
Compensation to our Chief Executive Officer under the Professional Employment Agreement totaled $1,000,000 for the year ended December 31, 2013. $1,000,000 was offset against common stock subscription, and $1,086,834 of deferred salary from prior periods was offset against common stock subscription and deposits on preferred shares.
Consulting Fees
During the years ended December 31, 2014 and December 31, 2013, the Company paid consulting fees totaling $29,538 and $17,524, respectively, to Gilmour & Company Pty Ltd. Gilmour & Company Pty Ltd is owned by Ian Gilmour, a director of IEG Holdings Corporation.
During the years ended December 31, 2014 and December 31, 2013, the Company paid consulting fees totaling $20,000 and $1,839, respectively, to Comms Watch Pty Ltd. Comms Watch Pty Ltd is owned by Damien Mathieson, the brother of our Chief Executive Officer.
During the years ended December 31, 2014 and December 31, 2013, the Company paid consulting fees totaling $321,951 and $335,000, respectively, to Clem Tacca and related entities. Clem Tacca is a shareholder of IEG Holdings Corporation.
During the years ended December 31, 2014 and December 31, 2013, the Company paid consulting fees totaling $150,473 and $35,258, respectively to Frank Wilkie and related entities. Frank Wilkie is a shareholder of IEG Holdings Corporation.
Rights Sale Agreement
Effective June 30, 2013, the Company entered into a Rights Sales Agreement, under which the Company acquired the Australian rights to conduct business throughout Australia, from IEG Holdings Limited ACN 131 987 838, its parent (until its shares were distributed to the ultimate shareholders of IEG Holdings Limited ACN 131 987 838).
The purchase price for the Rights Sales Agreement was $1,500,000 which was paid as follows:
| Paid through advances to (payments to third parties made on behalf of) IEG Holdings Limited ACN 131 987 838 | $ | 1,074,937 | ||
| Offset amounts owed from Company shareholders who are also creditors of IEG Holdings Limited ACN 131 987 838 | $ | 425,063 |
The cost of the Rights Sales Agreement was recorded as start-up cost in the statements of operations in accordance with ASC 720-15-25.
| F-17 |
IEG HOLDINGS CORPORATION
NOTES TO CONSOLIDATED FINANCIAL STATEMENTS
DECEMBER 31, 2014 AND 2013
| 11. | REVERSE MERGER |
On January 28, 2013 the Investment Evolution Global Corporation (“IEGC”) entered into a stock exchange agreement (the “Stock Exchange Agreement”) among IEGC, its sole shareholder IEG Holdings Limited, an Australian company (“IEG”) and IEG Holdings Corporation (f/k/a Ideal Accents, Inc.), a Florida corporation (“IEG Holdings”). Under the terms of the Stock Exchange Agreement, IEG Holdings agreed to acquire a 100% interest in the Company for 272,447,137 shares of IEG Holdings’ common stock after giving effect to a 1 for 6 reverse stock split. On February 14, 2013 IEG Holdings filed the Amended Articles with the Secretary of State of Florida changing its name from Ideal Accents, Inc. to IEG Holdings Corporation, increasing the number of shares of its authorized common stock to 1,000,000,000, $.001 par value, creation of 50,000,000 shares of “blank-check” preferred stock and effectuating a 1 for 6 reverse stock split of its issued and outstanding common stock (the “Reverse Stock Split”) pursuant to the terms of the Stock Exchange Agreement. FINRA approved the IEG Holdings Amended Articles on March 11, 2013.
On March 13, 2013 IEG Holdings completed the acquisition of IEGC under the terms of the Stock Exchange Agreement and issued to IEG 272,447,137 shares of IEG Holdings common stock after giving effect to the Reverse Stock Split whereby IEG Holdings acquired a 100% interest in the Company. As a result of the ownership interests of IEG in IEG Holdings and its former ownership interest in the Company, for financial statement reporting purposes, the acquisition of the Company by IEG Holdings has been treated as a reverse acquisition with IEGC being the accounting acquirer.
| 12. | SUBSEQUENT EVENTS |
Investment Evolution Canada, LLC
On January 2, 2015 the Company formed Investment Evolution Canada, LLC, a 100% owned subsidiary of Investment Evolution Global Corporation which will be used for planned future Canadian operations.
| F-18 |
IEG HOLDINGS CORPORATION
170,290,274 Shares of
Common Stock
PROSPECTUS
____________, 2015
Until ____________, 2015, all dealers that effect transactions in these securities, whether or not participating in this offering, may be required to deliver a prospectus. This is in addition to the dealers’ obligation to deliver a prospectus when acting as underwriters and with respect to their unsold allotments or subscriptions.
| 83 |
PART II
INFORMATION NOT REQUIRED IN THE PROSPECTUS
Item 13. Other Expenses of Issuance and Distribution.
The table below lists various expenses payable in connection with the sale and distribution of the securities being registered hereby. All the expenses are estimates, except the Securities and Exchange Commission (“SEC”) registration fee. All such expenses will be borne by the Company; none of the expenses will be borne by the selling stockholders.
| Type | Amount | |||
| SEC Registration Fee | $ | 10,643 | ||
| NASDAQ Listing Fee | 75,000 | |||
| Legal Fees and Expenses | 25,000 | |||
| Accounting Fees and Expenses | 5,000 | |||
| Total Expenses | $ | 115,643 | ||
Item 14. Indemnification of Directors and Officers
The Florida Business Corporation Act allows us to indemnify any person made a party to any lawsuit by reason of being a director or officer of the Company, or serving at the request of the corporation as a director, officer, employee or agent of another corporation, partnership, joint venture, trust or other enterprise against expenses (including attorneys’ fees), judgments, fines and amounts paid in settlement actually and reasonably incurred by him in connection with such action, suit or proceeding if he acted in good faith and in a manner he reasonably believed to be in or not opposed to the best interests of the corporation, and, with respect to any criminal action or proceeding, had no reasonable cause to believe his conduct was unlawful.
Our Amended and Restated Articles of Incorporation provide that our directors and officers shall be indemnified and the Company shall advance expenses on behalf of its officers and directors to the fullest extent not prohibited by law either now or hereafter.
Our by-laws require us to indemnify directors and officers against, to the fullest extent permitted by law, liabilities which they may incur under the circumstances described above.
Insofar as indemnification for liabilities arising under the Securities Act may be permitted to directors, officers and controlling persons of the Company pursuant to the foregoing provisions, or otherwise, we have been advised that in the opinion of the SEC, such indemnification is against public policy as expressed in the Securities Act and is, therefore, unenforceable.
Item 15. Recent Sales of Unregistered Securities
The following is a summary of transactions by us within the past three years involving sales or our securities that were not registered under the Securities Act. All numbers of shares and exercise prices have been adjusted to reflect the 1-for-6 reverse split of the Company effected on February 22, 2013.
Pursuant to the terms of the January 28, 2013 stock exchange agreement (the “Stock Exchange Agreement”) among Investment Evolution Global Corporation (“IEGC”), its sole shareholder IEG Holdings Limited, an Australian company (“IEG”) and our Company, we issued 272,447,137 shares of our common stock in exchange for a 100% interest in IEGC in March 2013. The securities were issued in reliance upon the exemptions provided by Section 4(a)(2), Regulation S and Section 2(a)(3), as applicable under the Securities Act of 1933, as amended (the “Securities Act”). Such securities are restricted as to their transferability as set forth in Rule 144 under the Securities Act.
On June 30, 2013, the Company issued 208,494,108 shares of common stock to the Company’s Chief Executive Officer, Mr. Paul Mathieson, for an aggregate purchase price of $1,042,471. These securities were issued in reliance upon the exemptions provided by Section 4(a)(2) and Section 2(a)(3) of the Securities Act.
During the nine months ended September 30, 2013, we issued 12,491,916 shares of our common stock at a price of $0.02 and $0.03 per share, and 512,513,594 shares at $0.005 per share in a private placement to pre-merger existing stockholders of the Company. The securities were issued in reliance upon the exemptions provided by Section 4(a)(2), Regulation S and Section 2(a)(3), as applicable under the Securities Act. Such securities are restricted as to their transferability as set forth in Rule 144 under the Securities Act.
During the quarter ended December 31, 2013, the Company issued 151,785,533 shares at a price of $0.005 per share in a private placement to pre-merger existing stockholders of the Company. The securities were issued in reliance upon the exemptions provided by Section 4(a)(2) and Section 2(a)(3), as applicable under the Securities Act.
On March 31, 2014, the Company issued 1,000,000 shares of Series A convertible preferred stock to the Company’s President and Chief Executive Officer, Mr. Mathieson, in consideration for $1,000,000. Also on March 31, 2014, the Company issued an aggregate of 410,000 shares of Series B convertible preferred stock to four accredited investors, for an aggregate purchase price of $410,000. In addition, on March 31, 2014, the Company issued an aggregate of 400,025 shares of Series C convertible preferred stock to five accredited investors, for an aggregate purchase price of $400,025. The Company also issued an aggregate of 173,000 shares of Series D convertible preferred stock to 14 accredited investors on March 31, 2014, for an aggregate purchase price of $173,000. All of these securities were issued in reliance upon the exemptions provided by Section 4(a)(2) and Section 2(a)(3), as applicable, and Regulation S under the Securities Act.
During the quarter ended June 30, 2014, the Company issued 611,991,383 shares of its common stock at a price of $0.005 per share in a private placement to existing stockholders of the Company who were accredited investors or who were not “u.s. Persons” as defined in the Securities Act. The securities were issued in reliance upon the exemptions provided by Section 4(a)(2) and Section 2(a)(3) or Regulation s, as applicable under the Securities Act.
| II-1 |
During the nine months ended September 30, 2014, the Company issued 838,740,134 shares of common stock at a price of $0.005, $0.01, $0.015 and $0.02 per share in private placements to existing stockholders of the Company who were accredited investors or who were not “u.s. Persons” as defined in the Securities Act.. The securities were issued in reliance upon the exemptions from registration provided by Regulation D, Rule 506 and Rule 506(b) and Regulation S as promulgated by the SEC under the Securities Act.
On November 19, 2014, the Company issued 75,316,666 shares of common stock at a price of $0.01, $0.015 and $0.02 per share in private placements to existing stockholders of the Company. These securities were issued in reliance upon the exemptions provided by Section 4(a)(2) and Section 2(a)(3), as applicable under the Securities Act.
On November 19, 2014, the Company issued an aggregate of 461,000 shares of Series E preferred stock to nine accredited investors. Also on November 19, 2014, the Company issued an aggregate of 1,400,000 shares of Series F preferred stock 24 accredited investors. All of these securities were issued in reliance upon the exemptions provided by Section 4(a)(2) and Section 2(a)(3), as applicable under the Securities Act.
On November 27, 2014, the Company issued 1,819,032 shares of common stock at a price of $0.01 per share in a private placement to existing stockholders of the Company. All of these securities were issued in reliance upon the exemptions provided by Section 4(a)(2), as applicable under the Securities Act.
Effective December 31, 2014, all holders of the then-outstanding Series B preferred stock provided notice to us of their intent to convert, pursuant to the terms of the Series B preferred stock, all of their Series B preferred shares into shares of our common stock on the basis of 400 shares of common stock for each share of Series B preferred stock so converted. Accordingly, on December 31, 2014, we issued an aggregate of 164,000,000 shares of common stock to the holders of our Series B preferred stock in exchange for all shares of their Series B preferred stock. The shares of common stock were issued in reliance upon the exemptions provided by Section 3(a)(9) of the Securities Act.
Effective December 31, 2014, all holders of the then-outstanding Series C preferred stock provided notice to us of their intent to convert, pursuant to the terms of the Series C preferred stock, all of their Series C preferred shares into shares of our common stock on the basis of 200 shares of common stock for each share of Series C preferred stock so converted. Accordingly, on December 31, 2014, we issued an aggregate of 80,005,000 shares of common stock to the holders of our Series C preferred stock in exchange for all shares of their Series C preferred stock. The shares of common stock were issued in reliance upon the exemptions provided by Section 3(a)(9) of the Securities Act.
Effective December 31, 2014, all holders of the then-outstanding Series D preferred stock provided notice to us of their intent to convert, pursuant to the terms of the Series D preferred stock, all of their Series D preferred shares into shares of our common stock on the basis of 133.3333 shares of common stock for each share of Series D preferred stock so converted. Accordingly, on December 31, 2014, we issued an aggregate of 23,066,661 shares of common stock to the holders of our Series D preferred stock in exchange for all shares of their Series D preferred stock. The shares of common stock were issued in reliance upon the exemptions provided by Section 3(a)(9) of the Securities Act.
Effective December 31, 2014, all holders of the then-outstanding Series E preferred stock provided notice to us of their intent to convert, pursuant to the terms of the Series E preferred stock, all of their Series E preferred shares into shares of our common stock on the basis of 40 shares of common stock for each share of Series E preferred stock so converted. Accordingly, on December 31, 2014, we issued an aggregate of 18,440,000 shares of common stock to the holders of our Series E preferred stock in exchange for all shares of their Series E preferred stock. The shares of common stock were issued in reliance upon the exemptions provided by Section 3(a)(9) of the Securities Act.
Item 16. Exhibits and Financial Statement Schedules
(a) Exhibits.
See the Exhibit Index on the page immediately preceding the exhibits for a list of exhibits filed as part of this registration statement on Form S-1, which Exhibit Index is incorporated herein by reference.
(b) Financial Statement Schedules.
None.
Item 17. Undertakings
Insofar as indemnification for liabilities arising under the Securities Act ““may be permitted to directors, officers and controlling persons of the Registrant pursuant to the foregoing provisions, or otherwise, the Registrant has been advised that in the opinion of the SEC such indemnification is against public policy as expressed in the Securities Act and is, therefore, unenforceable. In the event that a claim for indemnification against such liabilities (other than the payment by the Registrant of expenses incurred or paid by a director, officer or controlling person of the Registrant in the successful defense of any action, suit or proceeding) is asserted by such director, officer or controlling person in connection with the securities being registered, the Registrant will, unless in the opinion of its counsel the matter has been settled by controlling precedent, submit to a court of appropriate jurisdiction the question whether such indemnification by it is against public policy as expressed in the Securities Act and will be governed by the final adjudication of such issue.
(a) Rule 415 Offering. The undersigned registrant hereby undertakes:
| (1) | To file, during any period in which offers or sales are being made, a post-effective amendment to this registration statement: | ||
| (i) | To include any prospectus required by Section 10(a)(3) of the Securities Act of 1933; | ||
| (ii) | To reflect in the prospectus any facts or events arising after the effective date of the registration statement (or the most recent post-effective amendment thereof) which, individually or in the aggregate, represent a fundamental change in the information set forth in the registration statement. Notwithstanding the foregoing, any increase or decrease in volume of securities offered (if the total dollar value of securities offered would not exceed that which was registered) and any deviation from the low or high end of the estimated maximum offering range may be reflected in the form of prospectus filed with the Commission pursuant to Rule 424(b) if, in the aggregate, the changes in volume and price represent no more than 20% change in the maximum aggregate offering price set forth in the “Calculation of Registration Fee” table in the effective registration statement. | ||
| (iii) | To include any material information with respect to the plan of distribution not previously disclosed in the registration statement or any material change to such information in the registration statement; | ||
| (2) | That, for the purpose of determining any liability under the Securities Act of 1933, each such post-effective amendment shall be deemed to be a new registration statement relating to the securities offered therein, and the offering of such securities at that time shall be deemed to be the initial bona fide offering thereof. | ||
| (3) | To remove from registration by means of a post-effective amendment any of the securities being registered which remain unsold at the termination of the offering. | ||
| II-2 |
SIGNATURES
Pursuant to the requirements of the Securities Act of 1933, the registrant has duly caused this registration statement to be signed on its behalf by the undersigned, thereunto duly authorized, in the City of Las Vegas, State of Nevada, on April 9, 2015.
| IEG Holdings Corporation | ||
| By: | /s/ Paul Mathieson | |
| Paul Mathieson, | ||
| President and Chief Executive Officer | ||
Pursuant to the requirements of the Securities Act of 1933, this Form S-1 has been signed by the following persons in the capacities indicated on April 9, 2015.
| Name | Title | |
| /s/ Paul Mathieson | President, Chief Executive Officer, Chief Financial Officer | |
| Paul Mathieson | (Principal Executive Officer and Principal Financial and Accounting Officer) and Director | |
| * | Director | |
| Matthew I. Banks | ||
* |
Director | |
Ian M. Gilmour |
||
| * | Director | |
Harold A. Hansen |
| *By: | /s/ Paul Mathieson | ||
| Attorney-in-fact |
EXHIBIT INDEX
| Exhibit Number | Description of Exhibit | |
| 2.1* | Stock Exchange Agreement among Investment Evolution Global Corporation, IEG Holdings Limited and Ideal Accents, Inc. dated as of January 28, 2013. | |
| 3.1* | Amended and Restated Articles of Incorporation of IEG Holdings Corporation, effective February 22, 2013. | |
| 3.2* | Articles of Amendment to Amended and Restated Articles of Incorporation of IEG Holdings Corporation, effective March 20, 2014. | |
| 3.3* | Articles of Amendment to Amended and Restated Articles of Incorporation of IEG Holdings Corporation, effective October 27, 2014. | |
| 3.4 | Amended and Restated Bylaws . | |
| 4.1* | Form of Stock Certificate. | |
| 5.1 | Opinion of the Law Office of Legal & Compliance, LLC. | |
| 10.1* | Loan and Security Agreement between IEC SPV, LLC and BFG Loan Holdings, LLC dated June 11, 2012. | |
| 10.2* | Promissory Note by IEC SPV, LLC in favor of BFG Loan Holdings, LLC dated June 11, 2012. | |
| 10.3* | Amended and Restated Promissory Note by IEC SPV, LLC in favor of BFG Loan Holdings, LLC dated as of November 12, 2013. | |
| 10.4* | First Amendment to Loan and Security Agreement between IEC SPV, LLC and BFG Loan Holdings, LLC dated November 12, 2013. | |
| 10.5* | Second Amendment to Loan and Security Agreement by and between BFG Investment Holdings, LLC, IEC SPV, LLC, Investment Evolution Global Corporation, Investment Evolution Corporation and Paul J. Mathieson dated as of June 30, 2014. | |
| 10.6* | Australian Rights Sales Agreement by and between IEG Holdings Limited and Investment Evolution Global Corporation, dated as of June 30, 2013. | |
| 10.7 | Services Agreement between CyberRidge, LLC and Investment Evolution Corporation dated as of March 28, 2012. | |
| 21.1* | List of Subsidiaries. | |
| 23.1 | Consent of Independent Registered Public Accounting Firm. | |
| 23.2 | Consent of the Law Office of Legal & Compliance, LLC (included in Exhibit 5.1). |
* Previously filed.